CENTRE FOR AREA STUDIES WORKING PAPER SERIES OF THE CENTRE FOR AREA STUDIES N° 7 Stephen O. Odebero Factors Influencing Unequal Cross-Border Higher Education Student Mobility in The East African Community
Transcript
C E N T R E F O R A R E A S T U D I E S
WORKING PAPER SERIES OF THE CENTRE FOR AREA STUDIES N° 7
Stephen O. OdeberoFactors Influencing Unequal Cross-Border Higher Education Student Mobility in The East African Community
Stephen O. OdeberoFactors Influencing Unequal Cross-Border Higher Education
Student Mobility in The East African Community
Working Paper Series of the Centre for Area StudiesNo. 7
Stephen O. Odebero
Factors Influencing Unequal Cross-Border Higher Education Student Mobility in The East African Community
Working Paper Series of the Centre for Area StudiesNo. 7
Stephen O. Odebero Factors Influencing Unequal Cross-Border Higher Education Student Mobility in The East African Community
Bibliographische Information der Deutschen NationalbibliothekDie Deutsche Nationalbibliothek verzeichnet diese Publikation in der Deutschen Nationalbibliographie; detaillierte bibliographische Daten sind im Internet über http: // dnb.ddb.de abrufbar. Die Verwertung der Texte und Bilder ist ohne Zustimmung des Verlages urheber - rechtswidrig und strafbar. Das gilt auch für Vervielfältigungen, Über setzungen, Mikro verfilmungen und für die Verarbeitung mit elektronischen Systemen.
Working Paper Series of the Centre for Area StudiesNo. 7
7
FACTORS INFLUENCING UNEQUAL CROSS-BORDER HIGHER EDUCATION STUDENT MOBILITY IN THE EAST AFRICAN COMMUNITY
Stephen O. Odebero1
ABSTRACT
Education is now widely recognized as a scarce commodity but whose investment leads to future pecuniary and non-pecuniary returns. Individuals invest in human capital (HC) with hope for future returns, while family investments expect social returns. Indeed, governments in the East African Community (EAC) are motivated by the perceived social rate of returns. Emerging school of thought hold that higher education (HE) is a big business whose investment must be carefully planned. In the EAC, cross-border movement in search for HE in neighbouring economies has been, to say the least, the most unequal. By her own admission, Kenya’s minister of foreign affairs stated that the country loses annually over 2 billion Kenyan Shil-lings (KES) in student mobility to Uganda in search for HE. While this has gone on for years unabated, this study examines the central question why is cross-border HE student mobility in the EAC unequal? The study generates a four-tier typology of integration that includes (i) stagnant integration (LL), (ii) moribund integration (LH), (iii) synergistic integration (HL), and (iv) unequal integration (HH) based on the relationship between student HE mobility and levels of inequality. Overall, the study advocates the synergistic type of integration, which encourages higher student mobility with lower inequalities. The study was done as a spatial variation based on the concept of extreme case selection and the most likely condition. Kenya, Uganda, Tanzania, and Rwanda were seen as influential cases to be included in the study. Uganda was seen as the destination point for cross-border student mobility, while Kenya and Rwanda were the exit points. An extensive but selective review of exist-ing literature was also done as well as a modest collection of primary data that was done prior to the research visit. Greater premium was placed on empirical data and government reports. A quality appraisal strategy was adapted in line with the central research question in the initial proposal. Heterogeneity of included studies, the likely
1 Stephen O. Odebero, Masinde Muliro University of Science and Technology, Kenya
Working Paper Series of the Centre for Area StudiesNo. 7
8
impact of bias, and the applicability of the findings were also addressed. Unequal cross-border student mobility is a product of many interrelated factors. The domi-nance of cross-border students in Uganda’s tertiary institutions was largely attrib-utable to the relatively lower cost of higher education in Uganda. However, varied tuition fees charged by HE institutions in the EAC was a product of different corpo-rate tax regimes established by partner states, with Kenya and Tanzania registering the highest corporate tax regimes while Uganda and Rwanda had the lowest. Overall, the study established that asymmetries in systems of education practiced in the EAC has disadvantaged Kenya as a destination of student mobility in search of HE. Stu-dents in Uganda and Tanzania, upon starting their advanced level (A-level) exami-nations, expect to complete their basic university education in 3 years. Studying in Kenya, Rwanda, or Burundi would mean they are subjected to a 4-year curriculum and this would lead to an unnecessary increase in duration and total costs. In the short run, universities in Kenya should consider reducing tuition fees in order to stem student mobility to Uganda and possibly attract students from other countries in the region; however, in the long run the EAC member states may need to estab-lish a more comprehensive strategy to equalize tuition fees. To achieve this, it may involve the establishment of equalized taxation measures for education in the region. The reality is that the EAC requires a unified system of education, be it the 7-4-2-3 system or the 8-4-4 system of education. This idea is alluded to by Article 102(e) of the EAC Treaty, which requires partner states to harmonize curricula, examination, and certification.
Education is now widely recognized as a scarce commodity but whose investment leads to future pecuniary and non-pecuniary returns (Schulz, 1960; Psacharopoul-sos and Woodhall, 1985). Individuals invest in education with hope for future pri-vate returns, while family investments are motivated by expected private and social returns. Indeed, governments in the East African Community (EAC) are equally motivated by the perceived social rate of returns in the investment in higher educa-tion (HE). Emerging school of thought hold that education is a big business whose investment must be carefully planned (Odebero, 2011).
In the EAC, cross-border movement in search of HE in neighbouring economies has been, to say the least, the most unequal. By her own admission, Kenya’s min-ister of foreign affairs stated that the country loses over KES (Kenyan Shilling) 2 billion annually in student mobility to Uganda in search of HE and added that there were already more than 40,000 Kenyan students enrolled in Ugandan universities and other educational institutions outside (Kimani, 2010; Mutai, 2010). Tanzania has also recorded a significant number of Kenyan students in its universities. However, the number of foreign students seeking admission in Kenya has been quite low com-pared to the numbers seeking admission outside the country. If this remains preva-lent, it will result in a huge imbalance in benefits arising from educational exchange in favour of receiving countries.
The history of cooperation in East Africa dates back to the colonial days. It depicts the good will that existed and exists among the East African countries to cooperate and work together. This history gives impetus to the current thinking and conceptu-alization of the East African Community. Within this framework, all socioeconomic sectors are bound to be influenced by different dimensions. One such sector is the education sector, where, for instance, there has been remarkable student flight from one country to another in search of higher education.
The flight of students from one county to another should be a matter of concern to education authorities in the EAC. Whereas it has been argued that the main rea-sons behind the flight are the costs associated with favourable exchange rates that act in favour of Ugandan currency, this is subject to debate and investigation. Thus, more questions should go beyond the issue of the costs and focus on the role of the structure of education used in member countries on unequal student exchange, access, relevance of the systems of education in the member countries, and, most significantly, on the cooperation between the member states. Therefore, reasonable questions must be examined to establish the reasons behind the flight of students in higher education from Kenya and vice versa. Thus, this study looks at the central question why is cross-border higher education student mobility unequal and what can be done to correct the imbalance?
10
1.2 CENTRAL RESEARCH QUESTION
This study was guided by the following main question:• Why is cross-border higher education student mobility unequal in the EAC?
1.3 CONCEPTS
According to Gerring (1999), concept formation lies at the heart of all social science research. The significance of concept formation lies in its ability to aid proper con-ceptualization of the topic of study since every author makes lexical and semantic choices as they write. In this study, the spectrum of concepts was developed in an organogram as shown in figure 1 below.
Figure 1: Organogram of the Main Concepts of the Study. Source: Own conception
Subsequently, the main concepts of the study were defined as follows:
Factors for inequality: As used in this study, this refers to the major factors that would cause unequal cross-border student mobility across the border of EAC mem-ber states in search of higher education.
Economic factors: This refers to economic explanations for cross-border student mobility in search of higher education. They are further explained as related to the costs of purchasing higher education (both direct and indirect).
System of educationAdmission criteriaCost of education
Social
Factors for Inequality
Economic
11
Social factors: This refers to social explanations for cross-border student mobility in search of higher education in EAC member states. These are also explained as being related to the admission criteria (encumbrances) and the structure system of educa-tion in member states (see also details in figure 1).
1.4 THE CAUSAL PATH
Causality has been defined as a theoretical concept independent of the data used to learn about it (King, Keohane, and Verba, n. d: 76). In this study, the outcome variable (dependent variable) is the unequal mobility of students seeking HE in the region and it is denoted by Y. However, the causal variable (independent variable) relates to the factors influencing unequal student mobility and is denoted by X. The possible factors that are myriad are hypothesized and denoted by Z.
Figure 2: The Causal Path. Source: Own conception
ZPOSSIBLE FACTORS
1. Diffrence in cost of higher education
Kenya Uganda Tanzania Rwanda Burundi
2. Different admission poli-cies for foreign students
a) Free visa requirements for all students from EAC member states in Uganda
b) Work permit requirement for students from outside Kenya including the EAC
c) Different requirement for admission
3. Difference in education systems, e. g., the 8-4-4, 7-4-4, 6-6-4.
Y
UNEQUAL MOBILITY OF STUDENTS IN HE
INSTITUTIONS IN THE REGION
X
FACTORS INFLUENCING UNEQUAL STUDENT
MOBILITY
12
Figure 2 explains the (X) causal factors (independent variable) influencing (Y) unequal student mobility among the member states (dependent variable). The pos-sible factors (X) are hypotheses related to the difference in costs of university educa-tion in EAC member states. Exploring the literature, it is revealed that countries like Uganda, with relatively lower costs of university education, tended to attract more students from the region compared to Kenya, where costs of higher education was seen to be higher and beyond the reach of average families (Odebero, 2011).
Another reason for inequality in cross-border student mobility is related to differ-ent admission policies in member countries. Here again, Uganda has attracted more students because its universities tend to be more flexible in admission requirements compared to Tanzania, Rwanda, Burundi, and Kenya.
Of critical importance is the fact that Uganda has been accepting students with relatively inferior grades to pursue university education compared to the Kenya Cer-tificate of Secondary Education (KCSE). Kenya’s Commission for Higher Education insists on a KCSE mean score of C+ and above as the minimum requirement for university admission (World Bank, 2004).
1.5 TYPOLOGY OF INTEGRATION
Scholars Otieno and Matheka (2009) assert that challenges hindering the process of integration in East Africa should be dealt with decisively through mechanisms that will merge existing political and ideological differences in member countries. One such mechanism is education, mainly because the interplay of education and devel-opment generates economic prosperity as well as because it brings about social and political integration through the sharing of ideas, skills, attitudes, and knowledge. And specifically in education, neo-functionalists believe that as the member states see the benefits resulting from educational integration, they will be willing to give it a broader mandate until integrating effects are virtually overwhelming. That is why dif-ferences that could result from inequity in distribution of educational opportunities, processes, and outcomes must be addressed (cited in Odebero, 2011).
With this grounding in the theory of neo-functionalism, the typology of inte-gration for this study explains that educational integration entails the capacity for cross-border movement of students in higher education institutions, including credit accumulation and transfer mainly in tertiary institutions and universities, among other areas (see figure 3). The process involved in educational integration is long and tedious, but the framework envisages that positive spillover effects will bear incen-tives for integration in further sectors as well as transfer of domestic allegiance that could lead to the emergence of interest groups and associations that would champion regional integration as shown in figure 3.
13
Figure 3: Typology of Integration. Source: Own conception
Figure 3 explains that low student mobility and low integration would lead to an undesirable type of integration called stagnant integration. The reverse of it is when there is a very high student mobility and very high inequality that would lead to unequal integration. This type of integration would also be undesirable because it propagates unequal integration. It resonates quite well with the situation currently present in member countries, where cross-border student mobility is quite high but concentrated in more or less one country. If this is corrected, there will be high stu-dent mobility with low inequality, and this will result in a more desirable type of integration called synergistic integration, which this study encourages. The reverse of is moribund integration, because, although it has a more equitable distribution of cross-border student mobility, it is hinged on low mobility. This calls for an enquiry into the low speed of movement in the region.
Therefore, the framework acknowledges that as broader integration leads to cohe-sion among people in the member states, regional educational inequalities should be bridged through harmonized curricula and equalized education systems. Stereo-typing of some graduates of the education systems in the region could affect their performance in the labour market with disastrous effects on the economies of their countries; this could easily sow a seed of conflict that could result in the collapse of educational and political integration effort.
HLSynergistic Integration
HH Unequal Integration
LLStagnant Integration
LHMoribund Integration
Mobility
Inequality
14
1.6 MATERIALS AND METHODS OF REVIEW
The study was undertaken as a spatial variation based on the concept of extreme case selection and the most likely condition. Kenya, Uganda, Tanzania, and Rwanda were perceived as the most influential cases for selection to be included in the study. Ugandan universities were seen as the destination of cross-border student mobility in the region while Kenya, Tanzania, and Rwanda were the exit points.
Primary data
Primary data was collected from male and female students enrolled in HE institu-tions or those who have studied across the borders. Instruments for data collec-tion included questionnaires and focus group discussions (FGDs) done before the research visit.
Students documented their gender, reasons for studying across the border, their experiences, and recommendations for equitable student mobility. Key informants in strategic positions in the EAC were also targeted using questionnaires administered through email contacts. They were mainly senior officers in universities.
Secondary data
Secondary data included process tracing of admission policies, cost of living, and tuition costs in different countries in order to determine factors influencing student mobility in the region where key online literature was used. The findings were care-fully put into perspective and interpreted to pave way for conclusions and recom-mendations for the study.
Quality appraisal strategy
The adopted quality appraisal strategy followed the central research question in the initial proposal. Assessment of the identified studies, including the overall proposal, was subjected to several independent peer reviewers. Initial proposal and review were sent to prospective host professors in Germany, whose comments in turn were addressed. Other comments and reviews were initiated by the German Academic Exchange Service (DAAD), which also had the discretion to accept or reject the proposal if the overall quality was below international standards for support. The DAAD’s report was addressed; there was also one additional host supervisor in edu-cational integration to oversee the project in Germany. Structured discussions of the study with host professors and presentations at the Centre for Area Studies (CAS) and the editorial process also acted as benchmarks for quality.
15
Contextualizing the findings
Data collected were mainly qualitative. The literature was subjected to different meth-ods of synthesis but issues of quality, heterogeneity of included studies, the likely impact of bias, and the applicability of the findings were comprehensively addressed.
1.7 FINDINGS OF THE STUDY
The study reached the following findings, which were meant to shed light on the causes of unequal cross-border higher education student mobility in the EAC.
Unequal Costs of Higher Education in the EAC
The dominance of Kenyan students in Uganda’s tertiary institutions has largely been attributable to the high cost of tertiary education in Kenya. Most literature and the interviewed students and senior administrators in HE institutions indicated that the relatively lower cost of higher education in Uganda was the main attracting factor for most Kenyan students. Responding online to a Daily Monitor’s post for the relatively high numbers of Kenyan students in Ugandan universities, some respondents felt that universities in Kenya were meant for the rich and were therefore inaccessible by the majority of the poor (Daily Monitor, 5 May 2014:
The Universities in Kenya were meant for the rich...so, the pinch is still there though ... slowly by slowly things are catching up… [sic]
In one private university, a senior officer admitted that up to 44 percent of the 2,872 graduates in the year 2013 were Kenyans and this he attributed to the relatively lower
The scramble for higher education in Uganda; Kenyans obtaining short permits to travel to Uganda for studies at the Kenya–Uganda border in Busia town. Source: Daily Monitor (2014)
16
cost of education at the institution compared to the charges in Kenya (Daily Moni-tor, 2014). The Kenyan government admitted that over 40,000 Kenyan students were admitted in Uganda’s various institution of higher learning with Makerere University, the oldest institution of higher learning, hosting over 3,500 students (Mutai, 2010).
This is a high number by any standards and with the current cost of HE estimated at KES 100,000 per year; it means that Kenya could be losing up to KES 4 billion annually in foreign exchange.
Unharmonized Tuition Fees in the EAC
As if admitting that cost of higher education in the region was an issue, three East African Community member states signed a local agreement meant to harmonize tuition fees. Under the “coalition of the willing”, Kenya, Rwanda, and Uganda signed an agreement that was meant to bind the three states in charging local tuition fees for students moving to study in either of the three countries (Smith, 2014). How-ever, despite the signing of this agreement, there is no guarantee that indeed the fees charged will be harmonized in order to enhance equitable student mobility in the region. Moreover, the fact that Tanzania and Burundi were not included in the local agreement means that EAC states are yet to agree on harmonized fees. This led to the signing of another agreement dubbed the Northern Corridor Integration Proj-ects by Kenya, Uganda, Rwanda, Burundi, and South Sudan (see circular Ref MoE.HQS/3/9/11, 4 June 2014).
In a recent proposal, countries in the EAC acknowledged that difference in tuition fees paid in HE institutions had inhibited the free movement of students in the region. They further mooted a plan to harmonize tuition fees that will enable continuing students enrolled in HE institutions in the region to freely move to any university in any member country without having to be subjected to higher tuition fees there (Kabeera, 2013).
However, even with this proposal, universities in member countries are said to be hesitant to approve or adopt the idea because of limited funding from their govern-ments. Public universities rely solely on tuition fees charged and government capita-tion for maintaining their programmes. Private universities, however, rely mainly on tuition fees; as a consequence, reduced fees in harmonization may inhibit their operations. In addition, as argued elsewhere in this paper, taxation also drains the universities’ income made from tuition fees. Unless the taxation law is amended in some countries, like Kenya, to reduce corporate tax for higher education institutions, reduced fees in harmonization will bring Kenyan universities to a halt.
The duration of stay in a university will also undermine the harmonization effort. Even if tuition fees were to be the same, this does not necessarily imply that the cost of university education will necessarily be the same in member states owing to the difference in the duration one has to stay in university in different member states.
17
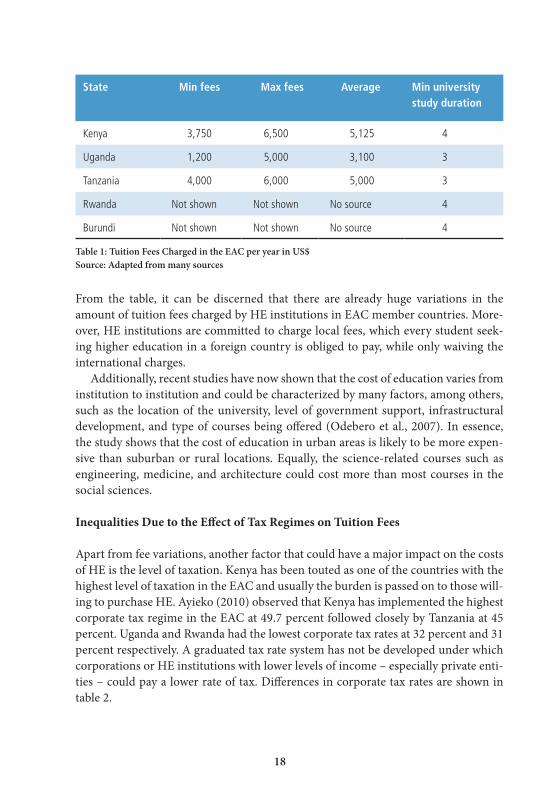
Member countries with a 4-year basic university education, such as Kenya, Rwanda, and Burundi, will pay more in the long run compared to those with a 3-year basic university education, as practiced in Uganda and Tanzania. In the end, tuition fees for countries with a 3-year basic university education will continue to attract more students than in countries where the 4-year period is adopted. The harmonization effort, though a welcome idea, will most likely not solve the problem of unequal stu-dent mobility in search of higher education in the region. Although the circular targets integration of partner states in the northern corridor, it should be noted that Tanzania is not included in the cooperation. This may mean that there could be misunderstanding within partner states in the implementation of key resolutions. In addition, even if the international rates are waived for cooperating partners in Kenya, Uganda, Rwanda, Burundi, and South Sudan, there is no guaran-tee that this will lead to harmonized fees charges. Details are seen in the different fees charges as shown in table 1.
18
State Min fees Max fees Average Min university study duration
Kenya 3,750 6,500 5,125 4
Uganda 1,200 5,000 3,100 3
Tanzania 4,000 6,000 5,000 3
Rwanda Not shown Not shown No source 4
Burundi Not shown Not shown No source 4
Table 1: Tuition Fees Charged in the EAC per year in US$ Source: Adapted from many sources
From the table, it can be discerned that there are already huge variations in the amount of tuition fees charged by HE institutions in EAC member countries. More-over, HE institutions are committed to charge local fees, which every student seek-ing higher education in a foreign country is obliged to pay, while only waiving the international charges.
Additionally, recent studies have now shown that the cost of education varies from institution to institution and could be characterized by many factors, among others, such as the location of the university, level of government support, infrastructural development, and type of courses being offered (Odebero et al., 2007). In essence, the study shows that the cost of education in urban areas is likely to be more expen-sive than suburban or rural locations. Equally, the science-related courses such as engineering, medicine, and architecture could cost more than most courses in the social sciences.
Inequalities Due to the Effect of Tax Regimes on Tuition Fees
Apart from fee variations, another factor that could have a major impact on the costs of HE is the level of taxation. Kenya has been touted as one of the countries with the highest level of taxation in the EAC and usually the burden is passed on to those will-ing to purchase HE. Ayieko (2010) observed that Kenya has implemented the highest corporate tax regime in the EAC at 49.7 percent followed closely by Tanzania at 45 percent. Uganda and Rwanda had the lowest corporate tax rates at 32 percent and 31 percent respectively. A graduated tax rate system has not be developed under which corporations or HE institutions with lower levels of income – especially private enti-ties – could pay a lower rate of tax. Differences in corporate tax rates are shown in table 2.
19
Country % Tax Regime Rank in the EAC
Kenya 49.7 1
Tanzania 45 2
Uganda 32 3
Rwanda 31 4
Burundi – –
Table 2: Asymmetries in Tax Regimes in the EAC Source: Derived from Ayieko (2010)
Evident from table 2, Kenya has the highest tax regime, followed by Tanzania, Uganda, and Rwanda (in that order). The corporate tax rates in Kenya and Tanza-nia is said to be one of the highest in the world, surpassing most of the developed countries such as Australia at 30 percent, Canada 26.5 percent, and United Kingdom 21 percent (KPMG, 2015). Higher tax regimes have an indirect effect on tuition fees charged by universities and other tertiary colleges. Corporations such as universities will tend to pass the burden of taxation to the consumers and hence higher corporate tax will lead to higher tuition fees differentiated according to varied tax regimes.
In the final analysis, countries with higher corporate tax regimes will invite higher tuition fees as opposed to those with lower corporate tax. It follows that the pricing of tuition fees is based on the punitive corporate tax measures instituted by member states. As Kassam, Ratansi, Neky, Pabari, and Okoth (2013) would rightly point out, taxation of gross revenue rises without consideration of how the cost of production is punitive to small-scale (and large-scale) investors who may still be struggling to extract marginal reserves. In Kenya, for instance, the taxation law requires that any business operating with a turnover in the range of KES 7 million and above per year, then such a business falls under the purview of taxation and is subject to monthly tax returns, the overall cost of production notwithstanding.
The Act states inter alia at part ii, (Republic of Kenya, 2012: 24–25)
Subject to , [sic] and in accordance with this Act, a tax to be known as income tax shall be charged for each year of income upon all the income of a person, which accrued in or was derived … from gains or profits from … a business, for whatever period of time carried on.
In creating the Act, the overall cost of production was not implied and therefore leaving investors – especially HE investors – at the mercy of the noose of the taxman.
Impliedly, what this means is that the cost of education can even be much lower if taxation policies in member states can be revised to factor in not just the revenue
20
streams but also the audited books of accounts, where the overall profits posited and the overall cost of production are considered.
In his postulation about the causes of unequal student mobility, the executive sec-retary of the Inter-University Council for East Africa placed taxation into the picture when he argued that HE institutions hike tuition fees because of a lack of funding from the government, thus scaring away students. He additionally notes that govern-ments are unable to allocate sufficient funds to universities. In the new budget for the 2014/2015 financial year, Kenya unveiled the largest budget since independence (Masese and Kanini, 2014). The budget of KES 1.77 trillion is said to be bigger than all the EAC states of Tanzania, Uganda, Burundi, and Rwanda combined. Comment-ing on the budget, PricewaterhouseCoopers noted that with this budget chances were that the government was likely to increase tax on consumption goods while further noting that income was not at all safe from increased tax (Masese and Kanini, 2014). This means that the cost of higher education is likely to continue escalating.
Inequalities Due to Asymmetries in the Education System in the EAC
The education systems adopted in the EAC is one of the most unequal among the history of integrating nations in the world. Member states in the EAC, despite start-ing off with a fairly homogenous system of education adopted from their colonial masters, have at present education systems with wide disparities.
Inequalities Due to Admission Policy and Subject Specialization
The implementation of the 8-4-4 system of education in Kenya in 1981 under the President Daniel Toroitich arap Moi regime was supposed to be a harbinger of increased access to HE by students given its broad curricula. It replaced the former system of education (the 7-4-2-3), a system that was accused of being mostly aca-demic in nature that only trained students towards white-collar jobs. However, as Kenya is mostly an agricultural economy, a majority of the students graduating from the education system became jobless for lack of practical skills. The Professor David Mackay-led commission, which was charged with reviewing the education system that had been in use since independence, found it unsuitable to drive the economic demands at the time and accordingly replaced it with the Canadian 8-4-4 system of education, which had a broader curriculum and placed emphasis on the science, vocational, and practical subjects (Republic of Kenya, 1963; Republic of Kenya, 1981).
But the implementation of the new system may have come to haunt Kenyans now as three-quarters of the students who sit Form Four examinations miss out on the uni-versities the Joint Admission Board (JAB) list. It is expected that those who miss out on the JAB list seek admission in private universities and other middle level colleges; nevertheless, this has proved to be a major challenge owing to inadequate and poorly
21
equipped middle level colleges. Since 1998, when the pressure from the World Bank allowed governments in sub-Saharan Africa to privatize higher education, the demise of the middle level colleges has been underway as most of them have been reduced to universities and constituent colleges of public universities, which are struggling to keep afloat due to inadequate funding from the exchequer. The collapse of middle level colleges has constricted student admission in tertiary institutions. According to Kenyan National Examination Council reports (KNEC 2011, 2012, 2013, and 2014), there were 357,488 KCSE candidates in 2010, 411,783 in 2011, and 436,349 in 2012. The year 2013 recorded the highest number of KCSE candidates at 446,696.
Coun
try
Stru
ctur
e(y
ears
)
Prim
ary
Seco
ndar
y
Tota
l sec
onda
ry
Tota
l pre
-uni
vers
ity
gene
ral e
duca
tion
Min
uni
vers
ity
st
udy
dura
tion
Secondary Lower Upper A-level
Rwanda 6-3-3-4 6 N/A 3 3 N/A 6 12 4
Burundi 6-3-3-4 6 N/A 3 3 N/A 6 12 4
Kenya 8-4-4 8 4 N/A N/A N/A 4 12 4
Tanzania 7-4-2-3 7 4 N/A N/A 2 6 13 3
Uganda 7-4-2-3 7 4 N/A N/A 2 6 13 3
Table 3: Asymmetries in Education Systems in the EAC. Source: Derived from Odebero (2011)
Kenyan Students Graduating from Ugandan Universities. Source: Mutai (2010)
22
From table 3, it can be seen that Rwanda and Burundi are on a 6-3-3-4 system of education, encompassing 6 years of primary education, 3 years of lower secondary, and 3 years of upper secondary. Their university education requires a minimum of 4 years, totalling 16 years of education. Tanzania and Uganda are on a 7-4-2-3 system of education, requiring 7 years of primary, 4 years of secondary, and another 2 years at advanced level (A-level) with university education taking 3 years at the very mini-mum. Oppositely, Kenya has a unique system of education in the EAC, taking 8 years of primary with 4 years of secondary education while a basic degree takes 4 years. Kenya, Rwanda, and Burundi, because of the lack of an A-level segment in their edu-cation system, have pegged their minimum university duration at 4 years, which is contrary to Uganda and Tanzania where university education takes only 3 years.
As Nicholas Langat has noted (cited in Mutai, 2010: 2):
Before the integration of the EAC in 1977, the member countries including Uganda, Kenya and Tanzania vastly enjoyed the 7-4-2-3 education system that extended to sitting of one paper across the region. It at the same time allowed students in the region to join any of the giant East African universities including University of Nai-robi, Dar es Salaam and Makerere University each on identified field of knowledge.
In this paper, it is argued that countries whose integration effort is still at a low level and experiencing insurmountable challenges like the EAC cannot propagate such huge asymmetries in their education systems and hope to be successful. The five countries in the region are practicing three different education systems and this could portend doom for the integration efforts as it inhibits labour mobility in the region. No meaningful integration effort can be achieved without an edu-cation system that allows for the free movement of labour and human capital in general. Overall, these asymmetries have disadvantaged Kenya as a destination of student mobility in search of HE. Students in Uganda and Tanzania, upon sitting their A-level examinations, expect to complete their basic university education in 3 years. Studying in Kenya, Rwanda, or Burundi means they are subjected to a 4-year curriculum, which leads to an unnecessary increase in duration and costs of their education. This is explained well by Mwikambi Kabui (Cited in Kabeera, 2013), who observed that a mechanism is needed to have a common education system to eliminate suspicion of incompetence among graduates, adding that HE in the EAC needed to have a unified syllabus and a system where students take entry exams before joining the university to make sure that all students are on the same level. The integration effort cannot run away from the reality for long, because the reality is that at the end the EAC will need a unified system of education, be it the 7-4-2-3 sys-tem or the 8-4-4 system of education. This thinking is alluded to by Article 102(e) of the EAC Treaty, which requires partner states to harmonize curricula, examination, and certification. Having entry examinations or simply harmonizing curricula are
23
only short-term solutions. These differences in education system cannot be ignored because they have cost implications.
The A-Level Segment and Subject Specialization
Most of the students interviewed argued that they were attracted to Uganda’s sys-tem of education by the A level segment, which allowed them to pursue subjects of their choice; this is unlike Kenya where they were forced to do all subjects includ-ing those they were not talented in. Every year when KCSE examination results are released, many students score grades that cannot take them to university according to Kenyan standards. The Kenya’s Commission for University Education (CUE) only allows those with grade C+ and above in KCSE to be admitted to university educa-tion (CUE, 2013). The remaining lot, who are the majority, are advised to pursue their careers in middle level colleges and youth polytechnics. In his speech during the release of 2013 KCSE results, the Kenyan Cabinet Secretary for Education noted that out of 446,696 candidature, only 123,365 representing 27.5 percent had managed to score C+ and above (Kaimenyi, 2014) and who would possibly be admissible to Kenya’s public and private universities according to the Commission for University Education regulations for 2013. He further advised that the remaining lot should pursue their careers in middle level colleges and other technical and vocational col-leges. He stated thus:
I wish to inform the candidates who sat their examinations in 2013 that there exists many opportunities besides university education. Majority of the graduants with a mean grade below C+ and above and even those with C+ and above who will not be absorbed by both public and private universities can be absorbed into middle level colleges and other TVET [Technical and Vocational Education and Training] institutions (Kaimenyi, 2014:14)
It is important to note that the cabinet secretary in charge of policies in education notes that majority of the Form Four graduates do not make it to university educa-tion, that is to say in this case over 72 percent. Equally important is his advice to join middle level colleges and other TVET institutions. Let’s now consider the opportuni-ties available to the majority of the students with less than C+ and above and who are also likely to come from lower socioeconomic status.
24
Low Access to Universities and Middle Level Colleges and Alternatives Available at Optimal Cost
Total 36,541 34,626 3,8942 37,574 43,915 41,285 35,881 35,632
Grand total 71,167 76,516 85,200 71,513
Table 4: Student Enrolment in Middle Level Colleges and TVET Centres in Kenya (2006–2009). Source: Odebero, (2012). “Situational analysis of the education sector in Kenya”. A Consultancy Report prepared for TNS/RMS and Safaricom Foundation (Unpublished)
From the table, enrolment in national polytechnics in 2007 and 2008 stood at around 14,000 for male and 9,000 for female in 2008 but plummeted to about 4,000 males and 3,000 females from 2009. This is attributable to the elevation of the two national polytechnics (Mombasa and Kenya Polytechnics) to university colleges (Republic of Kenya, 2009). It is regrettable that despite the low number of middle level colleges, polytechnics, and TVET institutions, the government of Kenya could still turn them into university colleges thus affecting students’ access to polytechnics by more than half. However, it is noted from the table that youth polytechnics attract more female students than males.
It is discernible that enrolment in Kenya’s national polytechnics as well as other technical and vocational institutions, including youth polytechnics, is low, at an aver-age of 75,000 students for the period studied. This is despite the fact that the country releases slightly over 300,0000 student per year with less than grade C+ who are expected to enrol in middle level colleges. This means that there are close to 285,831 Form Four graduates who have no opportunity for middle level education, represent-ing around 64 percent of the total number of KCSE candidature.
Total 68,345 43,884 70,775 47,464 73,543 49,304 110,328 67,407
Grand total 112,229 118,239 122,847 177,735
Table 5: Student Enrolment in Public and Private Universities in Kenya (2006–2009). Source: Ministry of Higher Education, Science and Technology and Ministry of State for Youth and Sports (cited in Com-mission for Higher Education, 2011)
According to Kaimenyi (2014), 123,365 representing 27.5 percent had managed to score C+ and above in the 2013 KCSE. Current statistics indicate that enrolment in public and private universities is on the increase from around 178,000 in 2010 (as shown in table above) to over 300,000 in 2013/2014. This means that the country can meet the demand for university education by up to 60–70 percent compared to middle level colleges where the country can barely meet 36 percent. Impliedly, there seems to be limited opportunities for middle level education to meet the demands for that cycle of education as over 64 percent of Form Four leavers desiring to join middle level education do not have the opportunity. The situation is made worse by the government policy that has allowed public universities to muzzle the middle level colleges and turn them into constituent colleges. Most of the students interviewed alluded to the dearth of middle level education for those who cannot make it to the university. Uganda was seen as the alternative as entry into A-level education rekin-dled their hope for further education. It gave them a chance to select 3 subjects they were talented in, which they later pursued at the university, unlike Kenya where the 8-4-4 system of education compelled them to take up to 8 subjects. Moreover, some students who had scored less than C+ still praised the Ugandan university education as being flexible and allowing them to take up degree courses, which drew condem-nation from Kenyan higher education authorities for allowing unqualified students into university education.
Inequalities Based on Dominant Language of Instruction in the Region
Since independence, Rwandan education system used French and Kinyarwanda as their language of instruction. Bust since joining the EAC, the government policy on language of instruction changed. In order to fit into the regional integration, lan-
26
guage of instruction changed to English. Many university students feel that they will be better placed in the job market if they have English comprehension; however, they contend that the development of the language is low in Rwanda. According to Kabeera and Nayebare (2014), there are over 1,128 students who cross the border in search of HE outside Rwanda and report that most of those who moved to Uganda wanted to improve their reading culture and English comprehension since this was still a huge challenge among the local institutions. But major questions still arise as to why most of those the students cross over to Uganda and not Kenya despite the fact that both Kenya and Uganda were British colonies and have well-developed struc-tures of English language.
1.8 CONCLUSIONS AND RECOMMENDATIONS
Equalizing Costs of Higher Education in the EAC
The study established that dominance of Kenyan students in Uganda’s tertiary insti-tutions has largely been attributable to the high cost of higher education in Kenya. In addition to literature reviewed, students interviewed responded that the rela-tively lower cost of higher education in Uganda was the main attracting factor for them. The study also found that some respondents felt that universities in Kenya were meant for the rich and were therefore inaccessible for the majority of the poor. Senior university administrators in some private universities in Uganda also opined that up to 44 percent of the 2,872 graduates in the year 2013 were Kenyans and this he attributed to the relatively lower cost of education in Uganda compared to the costs in Kenya. Some government officers in the Kenyan government also admitted that over 40,000 of Kenyan students were admitted to various institutions of higher learn-ing in Uganda. The study recommends that universities in Kenya should consider reducing tuition fees in order to stem student mobility to Uganda and possibly attract students from other countries in the region. Several factors, however, will come into play in order to make this possible, including the reduction of government taxation for the sake of education.
Harmonizing Tuition Fees in the EAC
The study also found that three East African Community member states signed a local agreement meant to harmonize tuition fees. Under the “coalition of the willing”, Kenya, Rwanda, and Uganda signed an agreement that was purposed on binding the three into charging set local tuition fees for students moving to study in either of the three countries. Another agreement between five member countries namely Kenya, Uganda, Rwanda, Burundi, and South Sudan (but excluding Tanzania), and
27
dubbed the Northern Corridor Integration Project, was reached, which required all students studying in public universities in member states of this project to pay the same fees charged for nationals of the host state. However, despite the signing of the two agreements, this study concluded that there is no guarantee that indeed the fees charged will be harmonized in order to enhance equitable student mobility in the region. Besides, Tanzania, a key EAC member state, did not commit itself to any of the two agreements. It is also noted that the agreements are only enforceable in public universities. This study recommends that the EAC member states should come up with a more comprehensive strategy to equalize tuition fees in HE institutions. To achieve this it will involve legislation of equalized taxation measures for education in the region.
Equalization of Tax Regimes in the HE Sector
Since the study concludes that the pricing of tuition fees is based on the punitive corporate tax measures instituted by member states and this has largely resulted in the huge difference in the tuition fees charged, which in turn has resulted in unequal student mobility in the region, it is now recommended that broad measures should be instituted by EAC member states to generate legislations that target equalized tax-ation for higher education sector with view to equalize HE tuition fees in the region.
Adoption of a Unified System of Education in the EAC
It was established that the asymmetries in the EAC member states’ education sys-tems have disadvantaged Kenya as a destination of student mobility in search of HE because students in Uganda and Tanzania, upon sitting their A-level examina-tions, expect to clear their basic university education in 3 years. Studying in Kenya, Rwanda, or Burundi would mean they are subjected to a 4-year curriculum and this would lead to an unnecessary increase in duration and total costs incurred for their education. The study recommends that the integration effort cannot run away from the reality for long because the reality is that the EAC is in need of a unified system of education, be it the 7-4-2-3 system or the 8-4-4 system of education. This think-ing is alluded to by Article 102(e) of the EAC Treaty, which requires partner states to harmonize curricula, examination, and certification. Having entry examinations harmonized or simply harmonizing curricula are only short-term solutions.
Increasing Education Opportunities for All Secondary School Teachers
The study recommends that a mechanism be put in place to help the Form Four graduates in Kenya with less than C+ to resurrect their academic careers. This could involve changing the system of education to the 7-4-2-3 system so that students can
28
go through the A level segment, which allows for subject specialization. It could also involve increasing middle level colleges and training opportunities at that level through expansion of existing middle level colleges, building new ones and prohibit-ing the muzzling of middle level colleges by public universities through presidential or political directives.
29
1.9 REFERENCES
Aduda, J. (n.d.). “Analysis of Tax Reform Policies and Tax Revenues in Kenya”, business.uon.ac.ke/node (accessed on 7 June 2014).
Alemayahu G., Joung, N., Mwabu, G., and Mwangi, K. 2001. “Discussion Paper 9”, KIPPRA (The Keniya Institute for Public Policy Research and Analysis).
Ayieko, F. (2010). “Kenya’s Tax Regime is Burdensome, Say Experts”, East African, 3 January.Ssenkabirwa, Al-M. (2014). “Kenya’s Student Numbers Drop in Ugandan Universities”, Daily Monitor,
5 March,www.monitor.co.ug/News/National/Kenya-student-numbers-drop-in-Ugandan-universi-ties/-/688334/2231020/-/110x30e/-/index.html (accessed on 26 February 2015).
Gerring, J. (1999). “What Makes a Concept Good? A Criterial Framework for Understanding Concept Formation in the Social Sciences”, Polity, 3 (31): 357–393,www.jstor.org/stable/3235246 (accessed on 3 November 2011)
Godia, G. (2010). Gains from East Africa Common Market. Business Daily, 16 August.Kabeera, E. (2013). “No End in Sight on Harmonization of Tuition Fees in EAC Universities”, The New
Times, 26 September.Kaimenyi, J. (2014). “Press Statement on the Release of the 2013 KCSE Examination Results by the
Cabinet Secretary”, Ministry of Education Science and Technology, Nairobi, 3 March,www.capi-talfm.co.ke/news/files/2014/03/2013-KCSE-EXAMINATION-SPEECH-FOR-THE-CABINET-SECRETARY-MoEST.pdf (accessed on 26 February 2015).
Kassam, A., Ratansi, L., Neky, A., Pabari, D., and Okoth, S. (2013). “Tax Regimes in East Africa their Impact on the Mining Industry”, presented at the 3rd Mining Business and Investment East Africa Conference (MBI), Nairobi, 10–11 October.
Kerlinger, F. N. (1973). Foundation of Behavioural Science, 2nd edition, New York.Kimani, J. (2010). “Kenyan Students in Uganda Want to Vote during Referendum”, Daily Nation,
17 August: 15.King, G., Keohane, O. R., and Verba, S. (1994). Designing Social Inquiry Scientific Inference in Quali-
tative Research. New Jersey.Kenyan National Examination Council (KNEC) (2011, 2012, 2013, and 2014).www.knec.ac.ke/
main/index.php?option=com_content&view=article&id=32:kenya-certificate-of-secondary-education&catid=17:exams (accessed on 17 March 2015).
KPMG (2015). “Corporate Tax Rates Table”,www.kpmg.com/global/en/services/tax/tax-tools-and-resources/pages/corporate-tax-rates-table.aspx (accessed on 17 March 2015).
Mutai, B. (2010). “Exodus of Kenyan Students to Uganda”, The Kenyan Watchdog, 11 April.Nassiuma, K. D. and Mwangi, J. (2004). Statistical Methods for Information Analysis. An Introduc-
tion, Egerton University.Ng’eno, N. K., Nyagitho, O. H., Ikiara, M. M., Ronge E. E., and Nyamunga, N. J. (2003). “Regional
Integration Study of East Africa: The Case of Kenya”, KIPPRA (Kenya Institute for Public Policy Research and Analysis) Working Paper 9 (January 2003).
30
Odebero S. O., Bosire J. N., Sang A.K., Ngala B.J., and Ngware W.M. (2007). “Equity in the Distribution of HELB Loans in Kenya in Relation to Students’ Characteristics: An Empirical Analysis”, Educa-tion Research Review, 2 (8).
Odebero, S. O. (2011). “Educational Inequalities and Opportunities in East African Region”, In Society for International Development (SID), East African Integration. Dynamics of Equity in Trade, Edu-cation, Media and Labour, Nairobi: 51–128.
Odebero, S. O. (2012). “Situational Analysis of Education Sector in Kenya”, a consultancy report pre-pared for the TNS/RMS Safaricom Foundation, unpublished.
Okungu, J. (2010). “The collapse of the EAC had far reaching effects”, All Africa, http://allafrica.com/stories/201007090057.html (accessed on 26 February 2015)
Okungu, J (2010). “The Dream of One East Africa”, Management, (August 2010), Nairobi: Kenya Insti-tute of Management.
Otieno, J. and Matheka, F. (2009). “EAC Common Markets: Integration”, The East African Standard, 29 December: 33.
Republic of Kenya, (2012). Income Tax Act Chapter 470 Laws of Kenya. Nairobi: Government Printers.Smith, B. (2014). “Kenya, Rwanda, Uganda Sign Local Fees Agreement”, In The Pie News: News and
Business Analysis for Professionals in International Education,www.pn.news.co.ke (accessed on 21 May 2014).
World Bank (2004). “Kenya Strengthening the Foundation of Education and Training in Kenya: Oppor-tunities and Challenges in Primary and General Secondary Education”, Report No. 28064-KE.
THE AUTHOR
Stephen O. Odebero is associate professor of education planning in the Department of Education Planning and Management at Masinde Muliro University of Science and Technology (Kenya). He holds a PhD in education planning and is special-ized in higher education financing. Throughout the last years, he has given lectures at numerous universities, including Egerton University (Nakuru, Kenya), Laikipia University (Eldoret, Kenya), Chuka University (Kenya), and Mount Kenya Univer-sity (Thika, Kenya).
Stephen O. Odebero is also Kenya’s representative of the African Higher Educa-tion Collaborative (AHEC), a division of the Council of International Exchange of Scholars (CIES), and founding member of the Education Management Society of Kenya.
His research deals with education and training matters in high schools and uni-versities. He was nominated by the Ministry of Education to attend the seminar For Presidents of Universities in Anglophone African Countries held in the Peoples’ Republic of China in 2007, organized by the Institute of African Studies Zhejiang Normal University (Jinhua, China). During this time, he also addressed the 3rd meeting of China-Africa Think Tanks Forum in Beijing. In 2014, Prof. Odebero was granted a German Academic Exchange Service (DAAD) scholarship and under-took a research stay at the Research Academy Leipzig at the university.
CONTACT:
Prof. Stephen O. Odebero, PhDMasinde Muliro University of Science and TechnologyP.O. Box 190-50100Kakamega, [email protected]