Stepwise transmigration of T- and B cells through aperivascular channel in high endothelial venulesKibaek Choe1 , Jieun Moon1 , Soo Yun Lee1, Eunjoo Song1, Ju Hee Back1 , Joo-Hye Song3 , Young-Min Hyun4,Kenji Uchimura5,6 , Pilhan Kim1,2
High endothelial venules (HEVs) effectively recruit circulatinglymphocytes from the blood to lymph nodes. HEVs have endo-thelial cells (ECs) and perivascular sheaths consisting of fibro-blastic reticular cells (FRCs). Yet, post-luminal lymphocytemigration steps are not well elucidated. Herein, we performedintravital imaging to investigate post-luminal T- and B-cell mi-gration in popliteal lymph node, consisting of trans-EC migration,crawling in the perivascular channel (a narrow space between ECsand FRCs) and trans-FRC migration. The post-luminal migration ofT cells occurred in a PNAd-dependent manner. Remarkably, wefound hot spots for the trans-EC and trans-FRC migration ofT- and B cells. Interestingly, T- and B cells preferentially sharedtrans-FRC migration hot spots but not trans-EC migration hotspots. Furthermore, the trans-FRC T-cell migration was confinedto fewer sites than trans-EC T-cell migration, and trans-FRC mi-gration of T- and B cells preferentially occurred at FRCs coveredby CD11c+ dendritic cells in HEVs. These results suggest that HEVECs and FRCs with perivascular DCs delicately regulate T- andB-cell entry into peripheral lymph nodes.
DOI 10.26508/lsa.202101086 | Received 6 April 2021 | Revised 3 June2021 | Accepted 9 June 2021 | Published online 29 June 2021
Introduction
Lymph nodes constantly recruit and return lymphocytes to andfrom the blood to facilitate rapid encounters between antigens andrare antigen-specific lymphocytes (1, 2). Circulating lymphocytes inthe blood enter the lymph nodes via high endothelial venules(HEVs), the wall of which is composed mainly of two cellularcomponents, endothelial cells (ECs) and fibroblastic reticular cells(FRCs) (2). A current model of lymphocyte transmigration across theHEV wall consists of four distinct steps (2): rolling (initiation ofadhesion between lymphocytes and HEV ECs), sticking (firm ad-hesion to ECs), intraluminal crawling (searching for a suitable exit
site), and trans-endothelial migration (trans-EC migration). Afterthe trans-ECmigration, however, lymphocytes must crawl inside theperivascular channel (PVC) (1, 3), a narrow space between ECs andFRCs, and subsequently transmigrate across FRCs to finally arrive atthe lymph node parenchyma. Boscacci et al described the intra-PVCcrawling of T cells as perivascular trapping around HEVs due to adelay in directed motility and low directional persistence in theperivascular region within 20 μmof the HEV endothelium (4). Park etal reported that B cells remained flatten along the abluminal side ofHEVs after trans-EC migration (5). Although efforts to elucidatepost–trans-EC migration in HEVs have been made, a clear visual-ization and molecular mechanism of post–trans-EC migration, in-cluding the intra-PVC and trans-FRC migration of T- and B cells inHEVs, is still lacking.
L-selectins expressed on lymphocytes are well-known adhesionmolecules that mediate the initiation of lymphocyte rolling alongthe luminal side of HEVs by binding to their ligands expressed onthe HEV endothelium (1, 6). Interestingly, L-selectin ligands areexpressed not only on the luminal side but also on the abluminalside of the HEV endothelium (7). Peripheral node addressins(PNAds), the main L-selectin ligands, require carbohydrate sulfa-tion for optimal L-selectin binding. The sulfation is catalysed byGlcNAc-6-O-sulfotransferases (GlcNAc6STs), of which GlcNAc6ST-1and GlcNAc6ST-2 contribute to PNAd expression in HEVs (8, 9).GlcNAc6ST-1 deficiency leads to lower PNAd expression on theabluminal side of HEVs and reduces the number of lymphocytesentering the lymph node (10). However, the detailed effects ofGlcNAc6ST-1 deficiency on the abluminal migration of lymphocytesremain elusive.
During the diapedesis of T cells across HEVs, T cells do not exitthrough random sites in HEVs but rather through discrete sites,called “exit ramps” (11). Many studies have been performed tounderstand the hot spots of trans-EC and trans-pericyte neutrophilmigration in inflamed tissue (12, 13, 14, 15, 16). However, the hot spotsof T- and B cells in lymph nodes remain poorly understood despitethe fact that the ECs and FRCs of HEVs are substantially different
1Graduate School of Nanoscience and Technology, Korea Advanced Institute of Science and Technology, Daejeon, Republic of Korea 2Graduate School of Medical Scienceand Engineering, Korea Advanced Institute of Science and Technology, Daejeon, Republic of Korea 3Center for Vascular Research, Institute for Basic Science, Daejeon,Republic of Korea 4Department of Anatomy and Brain Korea 21 PLUS Project for Medical Science, Yonsei University College of Medicine, Seoul, Republic of Korea5Department of Biochemistry, Nagoya University Graduate School of Medicine, Nagoya, Japan 6Unite de Glycobiologie Structurale et Fonctionnelle, UMR 8576 CNRS,Universite de Lille, Villeneuve d’Ascq, France
from the ECs and pericytes of normal venules in nonlymphoidorgans (17).
Herein, we clearly visualized the multiple steps of post-luminalT- and B-cell migration in popliteal lymph node, including trans-ECmigration, intra-PVC crawling, and trans-FRC migration, using in-travital confocal microscopy and fluorescent labelling of ECs andFRCs with different colours. Our 3D cell tracking analysis revealedthat GlcNAc6ST-1 deficiency led to T- and B cells requiring moretime for trans-FRC migration. In addition, PNAd blocking increasedthe amount of time required for trans-EC and trans-FRC T-cell mi-gration and delayed the passage of T cell in PVC by making the T-celldetour to an exit site. Next, we found the hot spots for T- and B-celltrans-EC and trans-FRC migration. Simultaneously imaging T- and Bcells showed that T- and B cells preferentially shared the hot spots fortrans-FRCmigration but not for trans-ECmigration. Interestingly, trans-FRC T-cell migration was confined to fewer sites than trans-EC T-cellmigration, and T- and B cells prefer to transmigrate across FRCscovered by CD11c+ DCs in HEVs. These results imply that FRCs delicatelyregulate the transmigration of T- and B cells across the HEVwall, whichcould be mediated by perivascular DCs.
Results
Intravital imaging of T- and B-cell transmigration across HEVscomposed of ECs and FRCs
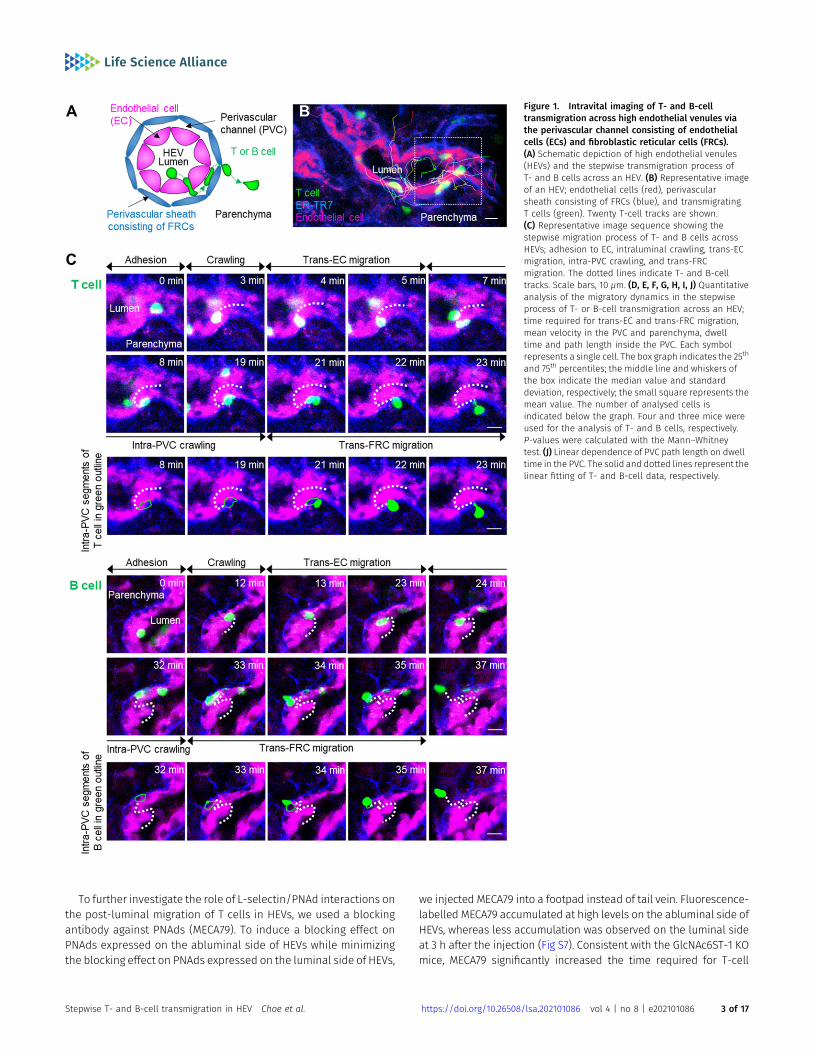
To clearly visualize the multiple steps involved in post-luminalT-cell migration in HEVs by intravital confocal fluorescence mi-croscopy, we adoptively transferred GFP-expressing T cells (green)and injected fluorescence-labelled anti–ER-TR7 antibody (blue)into an actin-DsRed mouse (red; Fig 1A and B). By acquiring time-lapse Z-stack images, we observed many 3D T-cell tracks in HEV(Video 1). Representative serial images (Figs 1C and S1) clearly showthe multiples steps of T-cell migration across HEV composed of ECsand FRCs through the perivascular channel (a narrow space be-tween ECs and FRCs): adhesion to ECs, intraluminal crawling, trans-EC migration, intra-PVC crawling, and trans-FRC migration, finallyarriving at the lymph node parenchyma. To compare T-cell andB-cell migration, we also performed the same experiment with Bcells (Fig 1C). 3D tracking analysis showed that B cells requiredmoretime for trans-EC migration (3.0 ± 2.2 min) and trans-FRC migration(1.8 ± 0.9 min) than T cells (trans-EC time, 1.5 ± 0.9 min; trans-FRCtime, 1.5 ± 0.9 min; Fig 1D and F). The mean velocity of T cells (5.3 ± 1.7μm/min) was significantly higher than that of B cells (4.1 ± 1.4 μm/min) during intra-PVCmigration (Fig 1E), whereas the dwell time andtotal path length in the PVC were not significantly different betweenT- and B cells (Fig 1H and I). Similar results were obtained whenboth cells were imaged simultaneously, except that B cells hadsignificant longer dwell time than T cells (Figs 2C–F and S5). In-terestingly, more than half of the T- and B cells crawled from 50 to350 μm inside the PVC (Fig 1I), which implies that T- and B cells arenot stationary but rather actively search for suitable exit sites insidethe PVC. In addition, the linear dependence of the path length anddwell time in the PVC (Fig 1J) implies that some T- and B cells leavethe PVC more quickly not because of the higher velocity but rather
because of the shorter path length to exit sites. We also measuredthe velocity of T- and B cells in parenchyma, revealing no significantchanges in their velocity at 1-min intervals up to 10 min after trans-FRC migration (Fig S2). The mean velocity of T cells in parenchyma(8.9 ± 2.3 μm/min) was significantly higher than that of B cells (5.3 ±1.8 μm/min; Fig 1G). To investigate the effect of injecting an anti–ER-TR7 antibody into the mouse footpad on T-cell migration in HEVs, weperformed the same experiment in the absence of the antibody. Thetrans-EC and trans-FRC migration times, dwell time, path length, andmean velocity in the PVC were similar between the antibody-injectedand noninjected groups, whereas the mean velocity of parenchymalT cells of the antibody-treated group was higher than that of non-injected parenchymal T cells (Fig S3). This result shows that injectionof the anti–ER-TR7 antibody does not affect T-cell migration in HEVsbutmay increase the velocity of T cells in parenchyma, which appearsto be related to a previous report that T cells crawl along the FRCnetwork in lymph node parenchyma (11).
Nonredundant role of L-selectin/PNAd interactions in the post-luminal migration of T- and B cells in HEVs
To explore the molecular basis underlying the post-luminal mi-gration of T- and B cells in HEVs, we performed intravital imaging ofGlcNAc6ST-1 KO mice that have low PNAd expression on theabluminal side of HEVs (8, 9, 10). To simultaneously image T- and Bcells, we adoptively transferred DsRed-expressing T cells (red) andGFP-expressing B cells (green) into GlcNAc6ST-1 KO and wild-typemice (Fig 2A and B). The trans-FRC migration times of T- and B cellsin KO mice (T, 2.5 ± 1.7 min; B, 3.6 ± 2.2 min) were significantly longerthan those in wild-type mice (T, 1.6 ± 1.1 min; B, 1.9 ±1.1 min; Figs 2E, G,and H and S4 and Video 2). In contrast, the trans-EC migration timesof T- and B cells were similar between the two groups (Fig 2C). Thisindicates that GlcNAc6ST-1 was required for efficient T- and B-celltrans-FRC migration, but not for their trans-EC migration. The meanvelocities of B cells in the PVC (3.0 ± 0.7 μm/min) and even in theparenchyma (3.7 ± 0.9 μm/min) of KO mice were substantially lowerthan those of wild-type mouse B cells (in PVC, 3.5 ± 0.8 μm/min;in parenchyma, 4.5 ± 1.3 μm/min; Fig 2D and F), whereas those ofT cells were similar between the two groups. This indicates thatGlcNAc6ST-1 was involved in intra-PVC migration as well as even inparenchymal migration for B cells. The fact that B cells were moreaffected than T cells is consistent with a previous report on T- andB-cell rolling and sticking in GlcNAc6ST-1 KO and GlcNAc6ST-1/2double KO mice (9), which was attributed to the 1.5-fold higherL-selectin expression in T cells than that in B cells (18). The dwelltimes of T- and B cells in the PVCs of KOmice were slightly increased(T, 27 ± 22 min; B, 42 ± 31 min) compared with those of wild-typemice (T, 21 ± 18 min; B, 30 ± 22 min), although statistical significancewas not reached (Fig S5A). The path lengths, displacement, andmeandering indices (MIs) of PVCs in T- and B cells were similarbetween the two groups (Fig S5B–E). In addition, there was nodifference in the percentage of homing T-cell subsets (centralmemory, naıve CD4, and naıve CD8) between KO and wild-type mice(Fig S6). These results imply that lower PNAd expression on theabluminal side of HEVs due to GlcNAc6ST-1 deficiency may lead todelay T- and B-cell trans-FRC migration and to decrease the B-cellmean velocities in PVC and parenchyma.
Stepwise T- and B-cell transmigration in HEV Choe et al. https://doi.org/10.26508/lsa.202101086 vol 4 | no 8 | e202101086 2 of 17
To further investigate the role of L-selectin/PNAd interactions onthe post-luminal migration of T cells in HEVs, we used a blockingantibody against PNAds (MECA79). To induce a blocking effect onPNAds expressed on the abluminal side of HEVs while minimizingthe blocking effect on PNAds expressed on the luminal side of HEVs,
we injected MECA79 into a footpad instead of tail vein. Fluorescence-labelled MECA79 accumulated at high levels on the abluminal side ofHEVs, whereas less accumulation was observed on the luminal sideat 3 h after the injection (Fig S7). Consistent with the GlcNAc6ST-1 KOmice, MECA79 significantly increased the time required for T-cell
Figure 1. Intravital imaging of T- and B-celltransmigration across high endothelial venules viathe perivascular channel consisting of endothelialcells (ECs) and fibroblastic reticular cells (FRCs).(A) Schematic depiction of high endothelial venules(HEVs) and the stepwise transmigration process ofT- and B cells across an HEV. (B) Representative imageof an HEV; endothelial cells (red), perivascularsheath consisting of FRCs (blue), and transmigratingT cells (green). Twenty T-cell tracks are shown.(C) Representative image sequence showing thestepwise migration process of T- and B cells acrossHEVs; adhesion to EC, intraluminal crawling, trans-ECmigration, intra-PVC crawling, and trans-FRCmigration. The dotted lines indicate T- and B-celltracks. Scale bars, 10 μm. (D, E, F, G, H, I, J) Quantitativeanalysis of the migratory dynamics in the stepwiseprocess of T- or B-cell transmigration across an HEV;time required for trans-EC and trans-FRC migration,mean velocity in the PVC and parenchyma, dwelltime and path length inside the PVC. Each symbolrepresents a single cell. The box graph indicates the 25th
and 75th percentiles; the middle line and whiskers ofthe box indicate the median value and standarddeviation, respectively; the small square represents themean value. The number of analysed cells isindicated below the graph. Four and three mice wereused for the analysis of T- and B cells, respectively.P-values were calculated with the Mann–Whitneytest. (J) Linear dependence of PVC path length on dwelltime in the PVC. The solid and dotted lines represent thelinear fitting of T- and B-cell data, respectively.
Stepwise T- and B-cell transmigration in HEV Choe et al. https://doi.org/10.26508/lsa.202101086 vol 4 | no 8 | e202101086 3 of 17
trans-FRC migration (3.1 ± 3.9 min) compared with that required withthe control antibody (1.5 ± 0.8 min; Fig S8C), indicating PNAds wererequired for efficient T-cell trans-FRC migration. In addition, MECA79substantially increased the trans-EC migration time (2.1 ± 0.9 min),dwell time, and path length in the PVC (32 ± 33 min, 115 ± 114 μm) anddecreased the MI during intra-PVC migration (0.33 ± 0.21) comparedwith those in the presence of the control antibody (trans-EC mi-gration time, 1.7 ± 0.6 min; dwell time, 13 ± 13 min; path length, 54 ±48 μm; MI, 0.54 ± 0.43; Fig S8A, E, F, and H). The mean velocity anddisplacement of T cells in the PVC were similar between the twogroups (Fig S8B and G). These results indicate that MECA79 delayedthe passage of T cells in PVC by making the T-cell detour to an exitsite. Consistent with the GlcNAc6ST-1 KO mice, MECA79 considerablydecreased the mean velocity of T cells in parenchyma (6.6 ± 2.2 μm/min) compared with that induced by the control antibody (7.8 ± 2.6μm/min; Fig S8D), indicating PNAds were also required for efficientT-cell parenchymalmigration. Collectively, these GlcNAc6ST-1 KO andMECA79 experiments show that interactions between L-selectins andPNAdsarealso involved in thepost-luminalmigrationof T- andB cells inHEVs from trans-EC migration to trans-FRC migration beyond theirknown role in luminal migration.
T- and B cells transmigrate through the preferred sites (hot spots)in ECs and FRCs of HEVs
T cells do not transmigrate across the HEV wall in a random fashionbut rather use discrete sites to arrive inside parenchyma (11). Thediapedesis of T cells through discrete HEV sites has been simplydescribed as a single step without distinction between trans-EC andtrans-FRC migration (2). The aforementioned imaging method usedto distinguish ECs and FRCs in HEVs enabled the observation of
trans-EC and trans-FRC migration hot spots separately. Multiple Tcells sequentially transmigrated across ECs at the same site (Fig 3Aand Video 3), and multiple T cells sequentially passed though FRCsat the same site to arrive inside parenchyma (Fig 3B and Video 4). Inaddition, we also observed a B-cell trans-EC migration hot spot (Fig3C and Video 5) and a B-cell trans-FRC migration hot spot (Fig 3Dand Video 6). A 3D distribution of the trans-EC and trans-FRC mi-gration sites in HEVs clearly shows the trans-EC and trans-FRCmigration hot spots (Fig 3E). The average number of cells trans-ECmigrating at a hot spot was 2.5 ± 0.1 for T cells and 2.5 ± 0.2 for B cellsduring 3 h (mean ± SEM, n = 14 and 10 mice for T- and B cells,respectively). In rare cases, up to five T cells or five B cells used thesame site for trans-ECmigration. The average number of cells trans-FRC migrating at a hot spot was 2.8 ± 0.1 for T cells and 2.4 ± 0.2 for Bcells during 3 h (mean ± SEM, n = 14 and 10 mice for T- and B cells,respectively). In rare cases, up to eight T cells or five B cells used thesame site for trans-FRC migration.
The aforementioned experiments involved imaging adoptivelytransferred T or B cells that might compete with endogenous lymphnode homing cells to transmigrate across HEVs. To observe trans-ECand trans-FRC migration hot spots for endogenous lymph nodehoming cells, we used Kaede transgenic mice, in which all cellsexpress the photoconvertible fluorescent protein Kaede (19). Whena 405-nm laser was irradiated onto HEVs, all cells in a field of viewchanged from green to red (Fig S9A), and newly appearing cells (non-photoconverted cells) in the HEV lumen were green. Therefore, wewere able to observe the trans-EC and trans-FRC migration of thegreen non-photoconverted cells across the red photoconverted ECsin HEVs (Fig S9B–D and Video 7). Up to 12 and 8 non-photoconvertedcells transmigrated across ECs and FRCs, respectively, at the same sitesin HEVs during 1.5 h of imaging (Fig S9B–D). Collectively, mice of the
Figure 1. Continued
Stepwise T- and B-cell transmigration in HEV Choe et al. https://doi.org/10.26508/lsa.202101086 vol 4 | no 8 | e202101086 4 of 17
Figure 2. Effect of GlcNAc6ST-1 deficiency on T- and B-cell transmigration across high endothelial venules (HEVs).(A) Schematic depiction of fluorescent labelling for the simultaneous imaging of transmigrating T cells (red) and B cells (green) via a perivascular sheath consisting offibroblastic reticular cells (blue) in GlcNAc6ST-1 KO and wild-type mice. The HEV lumen (light green) was labelled by intravenously injecting FITC-dextran, which facilitatesthe identification of the luminal surface in negative contrast. (B) Representative image sequence showing the stepwise migration process of a B cell across an HEV;adhesion to endothelial cell (EC), trans-EC migration, intra-PVC crawling and trans-fibroblastic reticular cell (FRC) migration. The dotted line indicates the B-cell track.
Stepwise T- and B-cell transmigration in HEV Choe et al. https://doi.org/10.26508/lsa.202101086 vol 4 | no 8 | e202101086 5 of 17
adoptive transfer model and Kaede mice clearly show the existence oftrans-EC and trans-FRC T- and B-cell migration hot spots in HEVs.
Interestingly, the average number of trans-FRC migrating T cellsat one site (1.8 ± 0.1, mean ± SEM, n = 14 mice) was significantly
higher than that of trans-ECmigrating T cells at one site (1.3 ± 0.0; Fig3F). Furthermore, the ratio of hot spots to the total potentialtransmigration sites was also substantially higher for trans-FRCT-cell migration (0.42 ± 0.15, mean ± SD, n = 14 mice) than for trans-EC
Figure 2. Continued
Lu, lumen; Pa, parenchyma. These images correspond to a 20-μm-thickmaximum intensity projection. Scale bars, 10 μm. (C, D, E, F)Quantitative analysis of themigratorydynamics of the stepwise T- and B-cell transmigration process across HEVs of GlcNAc6ST-1 KOmice compared with those of wild-typemice; time required for trans-EC andtrans-FRCmigration, mean velocity in the PVC and parenchyma. Each symbol represents a single cell. The box graph indicates the 25th and 75th percentiles; themiddle lineand whiskers of the box indicate the median value and standard deviation, respectively; the small square represents the mean value. The number of analysed cells isindicated below the graph. Four mice were analysed for each group. P-values were calculated with the Mann-Whitney test. (C, D, E, F) P-values between T- and B cells inwild-type mice were 0.0003 (C), <0.0001 (D), 0.0165 (E) and <0.0001 (F). (G, H) Representative image sequence showing that more time is required for trans-FRC migration inGlcNAc6ST-1 KO mice than in wild-type mice. The dotted lines indicate the boundary of FRCs. These images are serial single Z-frames (XY plane) and XZ or YZ crosssections. Arrow heads indicate the trans-FRC migration site. Scale bars, 10 μm.
Stepwise T- and B-cell transmigration in HEV Choe et al. https://doi.org/10.26508/lsa.202101086 vol 4 | no 8 | e202101086 6 of 17
T-cellmigration (0.19 ± 0.09; Fig 3G). For B cells, therewere no significantdifferences between the trans-EC and trans-FRC migration, whichmight have been partially due to the low number of B cells analysedper mouse (22 ± 15 cells/mouse for trans-EC migration; 17 ± 12 cells/
mouse for trans-FRC migration) compared with that for T cells (34 ± 18cells/mouse for trans-EC migration, 30 ± 13 cells/mouse for trans-FRCmigration). These results imply that trans-FRC T-cell migration isconfined to fewer sites than trans-EC T-cell migration.
Figure 3. Hot spots for trans-endothelial cell (EC) and trans-fibroblastic reticular cell (FRC) T- andB-cell migration.(A, C) Representative image sequenceshowing T- and B cells (green, arrow)transmigrate across the EC (red) at thesame site, entering the PVC from thelumen. Lu, lumen; Pa, parenchyma.(B, D) Representative image sequenceshowing T- and B cells (green, arrow)transmigrate across the FRC (blue)at the same site, exiting from the PVCto parenchyma. Lu, lumen; Pa,parenchyma. Scale bars, 10 μm.(E) Representative 3D reconstructedimage showing the distribution oftrans-EC (green dots) and trans-FRCmigration sites (red dots) of T- and Bcells in high endothelial venules. Thenumber of T- and B cells transmigratingat the same site is indicated. Scale bars,10 μm. (F) Average numbers oflabelled T- and B cells transmigratingat one site for 3 h. (G) Ratio of hot spotsto total transmigration sites for 3 h.The hot spot is defined as a site of ECsor FRCs where more than two T or B cellstransmigrate across the ECs or theFRCs in high endothelial venule. Eachsymbol represents a single mouse. Thebox graph indicates the 25th and 75th
percentiles; the middle line andwhiskers of the box indicate the medianand standard deviation, respectively;the small square represents the meanvalue. Fourteen (34 ± 18 cells/mouse fortrans-EC migration, 30 ± 13 cells/mouse for trans-FRC migration) and 10mice (22 ± 15 cells/mouse for trans-ECmigration, 17 ± 12 cells/mouse fortrans-FRC migration) were analysed forT- and B cells, respectively. P-valueswere calculated with paired t tests.
Stepwise T- and B-cell transmigration in HEV Choe et al. https://doi.org/10.26508/lsa.202101086 vol 4 | no 8 | e202101086 7 of 17
T- and B cells preferentially share hot spots for trans-FRCmigration but not for trans-EC migration
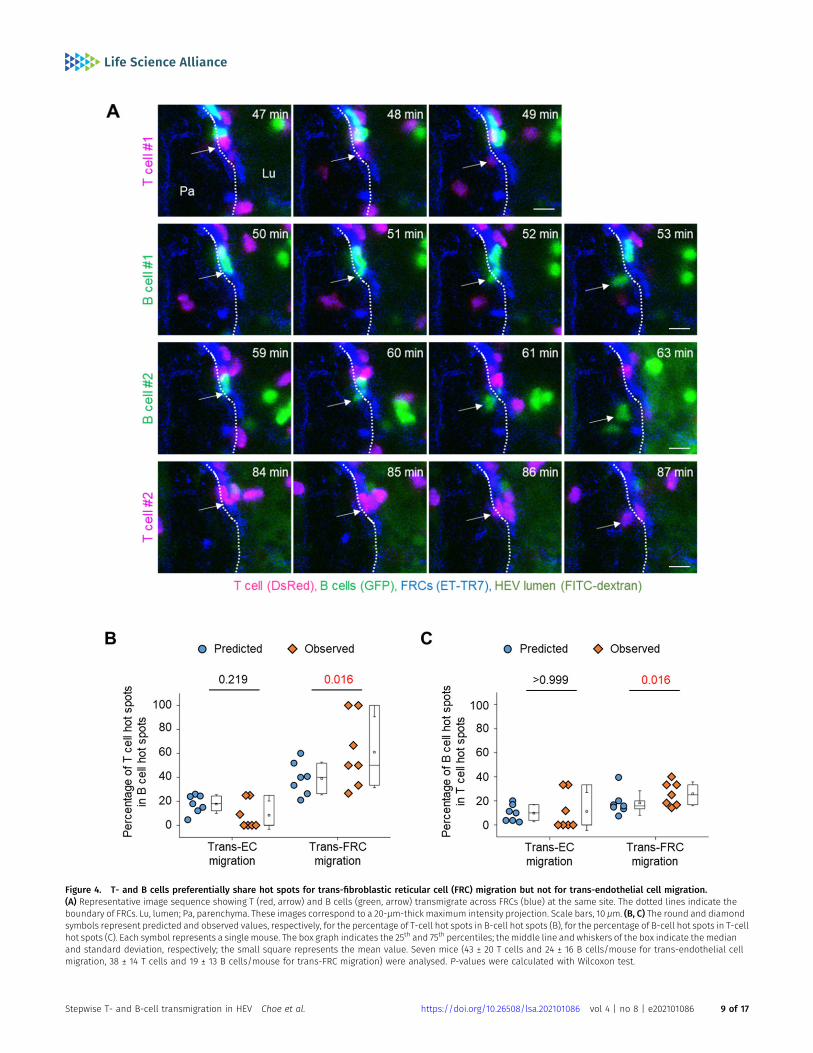
Simultaneously imaging T- and B cells showed that some T- and Bcells transmigrated across FRCs at the same site (Fig 4A and Video8). To investigate whether T- and B cells share their hot spotspreferentially or accidently, we compared the percentage of T-cellhot spots in total B-cell hot spots (diamond symbols in Fig 4B)with its predicted value that is the possibility of accidently sharing
T- and B-cell hot spots (round symbols in Fig 4B). The predictedvalue can be calculated as the percentage of T-cell hot spots intotal transmigration sites. To note, the percentage of hot spots intotal sites for trans-FRC migration was higher than that for trans-ECmigration (Fig 3G and round symbols in Fig 4B) maybe because thenumber of trans-FRC migration sites was less than that of trans-ECmigration sites. It implies that the possibility of accidently sharingT- and B-cell hot spots for trans-FRC migration is higher than thatfor trans-EC migration. However, surprisingly, the percentage of
Figure 3. Continued
Stepwise T- and B-cell transmigration in HEV Choe et al. https://doi.org/10.26508/lsa.202101086 vol 4 | no 8 | e202101086 8 of 17
Figure 4. T- and B cells preferentially share hot spots for trans-fibroblastic reticular cell (FRC) migration but not for trans-endothelial cell migration.(A) Representative image sequence showing T (red, arrow) and B cells (green, arrow) transmigrate across FRCs (blue) at the same site. The dotted lines indicate theboundary of FRCs. Lu, lumen; Pa, parenchyma. These images correspond to a 20-μm-thick maximum intensity projection. Scale bars, 10 μm. (B, C) The round and diamondsymbols represent predicted and observed values, respectively, for the percentage of T-cell hot spots in B-cell hot spots (B), for the percentage of B-cell hot spots in T-cellhot spots (C). Each symbol represents a single mouse. The box graph indicates the 25th and 75th percentiles; themiddle line and whiskers of the box indicate the medianand standard deviation, respectively; the small square represents the mean value. Seven mice (43 ± 20 T cells and 24 ± 16 B cells/mouse for trans-endothelial cellmigration, 38 ± 14 T cells and 19 ± 13 B cells/mouse for trans-FRC migration) were analysed. P-values were calculated with Wilcoxon test.
Stepwise T- and B-cell transmigration in HEV Choe et al. https://doi.org/10.26508/lsa.202101086 vol 4 | no 8 | e202101086 9 of 17
T-cell hot spots in B-cell hot spots was significantly higher than itspredicted value of accidently sharing hot spots for trans-FRC mi-gration (Fig 4B). Similarly, the percentage of B-cell hot spots inT-cell hot spots was also significantly higher than its predictedvalue for trans-FRC migration (Fig 4C). These results imply thatT- and B cells preferentially share trans-FRC migration hot spotsbeyond the prediction for accidently sharing. However, there wereno significant differences between observed and predicted valuesfor trans-EC migration (Fig 4B and C), which implies T- and B cellsjust accidently share their trans-EC migration hot spots.
T- and B cells prefer to transmigrate across FRCs covered byperivascular CD11c+ DCs
Neutrophils preferentially extravasate close to perivascular mac-rophages in inflamed skin vessels (16). In lymph nodes, many DCsare positioned close to HEVs (20, 21). Elimination of DCs in a lymphnode impairs lymphocyte recruitment to the lymph node (22).Based on these facts, we next investigated the possible associationof trans-FRC migration hot spots with perivascular DCs in HEVs. Tosimultaneously image DCs with T or B cells, we adoptively trans-ferred DsRed-expressing T or B cells into a CD11c-YFP mouse (23)(Fig 5A and B). During the intravital imaging of HEVs, many T cellstransmigrated across FRCs at the same site covered by perivascularCD11c+ DCs (Fig 5C and Video 9). To determine whether T cellstransmigrate across FRCs covered by the CD11c+ DCs preferentiallyor accidently, we compared the percentage of trans-FRC migrationsites covered by DCs (described as Type 1 in Fig S11) with DCcoverage on the HEV (Fig S10). For T cells, the percentages of trans-FRC migration sites and hot spots covered by DCs (69% ± 10% and78% ± 11%, respectively) were significantly higher than the DCcoverage on HEVs (55% ± 12%; Fig 5D). For B cells, the percentages oftrans-FRC migration sites and hot spots covered by DCs (66% ± 14%,79% ± 34%) were considerably higher than the DC coverage on HEVs(49% ± 14%; Fig 5D). These results reveal that T- and B cells pref-erentially transmigrate across FRCs covered by DCs. Furthermore,additional 14% T cells and 22% B cells also contacted with sur-rounding DCs during trans-FRC migration although their trans-FRCmigration sites were not covered by DCs (described as Type 2 orType 3 in Fig S11). Collectively, these suggest that perivascular DCs inHEVs may regulate the trans-FRCmigration of T- and B cells in HEVs.
Discussion
The transmigration of leukocytes across blood vessel walls is a keyevent in host defence reactions and immune system homeostasis (2, 24).Over the past several decades, most studies have focused on the inter-actions between leukocytes and ECs, the first cellular barrier in the bloodvessel wall (25). After trans-EC migration, leukocytes must pass pericytes,the second and final cellular barrier in the blood vessel wall. Recently,Proebstl et al clearly visualized the post-trans-EC migration of neu-trophils in inflamed tissue by 3D time-lapse intravital microscopy withfluorescent labelling of ECs, pericytes and neutrophils in differentcolours (15). They showed that intercellular adhesion molecule 1(ICAM-1), Mac-1, and LFA-1 mediate neutrophil crawling in the narrow
space between ECs and pericytes and that neutrophils prefer to exitthrough the enlarged pericyte gap in inflamed tissue (15).
Unlike inflamed blood vessels, HEVs constantly recruit lymphocytesinto lymph nodes in the steady state and therefore have differentcellular and molecular characteristics (2, 17). HEVs are composed ofcuboidal ECs and pericyte-like FRCs. Herein, we observed the post-luminal migration of T- and B cells, including trans-EC, intra-PVC andtrans-FRC migration, in HEVs by fluorescently labelling ECs, FRCs andT or B cells different colours. We uncovered that PNAd expressed onthe abluminal side of HEVs are involved in the post-luminal migrationof T- and B cells and that T- and B cells prefer to transmigrate throughFRCs covered by CD11c+ DCs.
PNAds expressed in HEV ECs mediate lymphocyte rolling andsticking. Although PNAds are also expressed at the endothelialjunction and on the abluminal side of HEVs, their involvement inpost-luminal lymphocyte migration has not been investigated asextensively as that in luminal migration because experimentalmethods such as molecular-deficient mice and blocking antibodytreatment cause severe defects in luminal migration. In contrast,the significant defects in post-luminal leukocyte migration could beobserved in inflamed cremaster venules of L-selectin–deficientmice because of no defect in the luminal migration (26). To se-lectively block the function of molecules expressed on the ablu-minal side of HEVs, we herein used GlcNAc6ST-1–deficientmice (8, 9,10) or injected blocking antibodies via the footpad rather than viaintravenous injection, as previously reported (15). GlcNAc6ST-1 ispredominantly involved in PNAd expression on the abluminal siderather than on the luminal side, although GlcNAc6ST-1 deficiencyalso modestly affects the luminal migration of lymphocytes byincreasing the rolling velocity (9). GlcNAc6ST-1 deficiency increasedthe time required for trans-FRC migration but not that for trans-ECmigration. This could be attributable to deficiency of GlcNAc6ST-1–synthesizing L-selectin ligands in the abluminal side of HEV. Inaddition to the abluminal side of HEV ECs, FRCs also expressGlcNAc6ST-1, but not GlcNAc6ST-2 (27), implying that FRC-expressedGlcNAc6ST-1 may regulate trans-FRC migration in some extent. Wealso investigated the effect of MECA79 on abluminal migrationbecause GlcNAc6ST-1 deficiency does not eliminate all PNAd ex-pression on the abluminal side of HEVs. The blocking antibodyMECA79 increased the time required for trans-FRC migration, thedwell time and path length in the PVC and decreased the MI in thePVC. Thus, PNAds expressed at the endothelial junction and on theabluminal side of HEVs facilitate the efficient transmigration oflymphocytes across the HEV wall but do not slow transmigration inthe perivascular region. GlcNAc6ST-1 deficiency and MECA79 anti-body also decreased the parenchymal B- and T-cell velocitiesimmediately after extravasation, respectively, probably because ofblockade of parenchymal expression of PNAd in close proximity toHEV (6, 21, 28). A caveat is that all antibodies we used contain apreservative, sodiumazide, that has potential side effects on lymphocytemigration in lymph node (29). Nevertheless, Fig S3 shows no significantdifference in T-cell migration in HEV between anti-ER-TR7–injected andnoninjected groups.
Interestingly, blocking of L-selectin shedding also slows down thepost-luminal lymphocyte migration (30, 31). This report combined withour resultmay imply that an appropriate amount of L-selectin expressionon lymphocyte is important for the efficient abluminal migration. What is
Stepwise T- and B-cell transmigration in HEV Choe et al. https://doi.org/10.26508/lsa.202101086 vol 4 | no 8 | e202101086 10 of 17
not yet clear is the exact timing of lymphocyte L-selectin shedding, al-though that of monocytes occurs during trans-EC migration (32).
Themolecularmechanismunderlying the PNAd-regulated lymphocytemigration in abluminal side of HEV where shear stress would be
absent may be related to the L-selectin signalling of lymphocytestriggered by interaction with PNAds. L-selectin signalling activatesβ2 integrins on lymphocytes (33, 34) and enhances the chemotaxisof lymphocytes to CCL21 (35). Interestingly, knocking out both
Figure 5. T- and B cells transmigrateacross fibroblastic reticular cells(FRCs) covered by CD11c+ DCs.(A) Schematic depiction of fluorescentlabelling for simultaneously imagingDCs (green), T or B cells (red) and FRCs(blue). The high endothelial venule (HEV)lumen (light red) was labelled byintravenously injecting TRITC-dextran,which facilitates the identification of theluminal surface in negative contrast.(B) Representative image of an HEV with aCD11c+ DC and a T-cell trans-FRC migratingfrom the PVC to parenchyma. Scale bar,10 μm. (C) Representative image sequenceshowing that six T cells transmigrate acrossthe FRC at the same site (arrow) in closeproximity to CD11c+ DCs. These imagescorrespond to a 6-μm-thick maximumintensity projection. Scale bars, 10 μm.(D) Comparison of the coverage of CD11c+DCs on HEVs and trans-FRC migration sitesor hot spots covered by DCs. The hotspot is defined as sites of FRCs wheremore than two T or B cells transmigratesacross the FRCs in HEV. Each symbolrepresents a single mouse. The box graphindicates the 25th and 75th percentiles; themiddle line and whiskers of the boxindicate the median and standarddeviation, respectively; the small squarerepresents the mean value. Eight (48 ±18 T cells/mouse) and eight mice (21 ± 19 Bcells/mouse) were used for the analysis ofT- and B cells, respectively. P-valueswere calculated with paired t test.
Stepwise T- and B-cell transmigration in HEV Choe et al. https://doi.org/10.26508/lsa.202101086 vol 4 | no 8 | e202101086 11 of 17
GlcNAc6ST-1 and GlcNAc6ST-2 completely eliminates PNAd ex-pression in HEVs, but the other L-selectin ligands remain on theabluminal side of HEVs (8). Recently, the reported antibodies CL40and S2 were shown to react with more types of L-selectin ligandsthan MECA79, which reacts with only PNAds (2, 36, 37). These anti-bodies or L-selectin chimeric proteins (38) may be used to induce astronger blocking effect on abluminal L-selectin ligands than thatinduced by MECA79.
In addition to PNAds, important molecules have been suggestedto play a role in the abluminal migration of lymphocytes in HEVs, suchas CCL21, autotaxin and mac25/angiomodulin. CCL21 secreted by ECsand FRCs binds to collagen IV on the abluminal side of HEVs (39). CCL21activates LFA-1 integrins of lymphocytes by interacting with CCR7 (1).Autotaxin secreted by the ECs of HEVs produces lysophosphatidic acid,which facilitates lymphocyte release from the HEV endothelium toparenchyma (40). Mac25/angiomodulin localized exclusively to theabluminal side of HEVs interacts with chemokines, such as CCL21, butits exact contribution to lymphocyte migration is unclear (41).
FRCs form a reticular conduit network in lymph nodes by se-creting and surrounding collagen fibres (42, 43). The FRC conduitdelivers small molecules, such as antigens, from afferent lymphto the HEV lumen (1, 42, 43). Using this function, we visualizedFRCs surrounding HEVs in a popliteal lymph node by injecting afluorescence-labelled anti–ER-TR7 antibody into amouse footpad. ER-TR7 antigens are ECM components secreted by FRCs (44) and form theconduit structure ensheathed by FRCs (11). Although ER-TR7 is a well-known FRCmarker (43), the function of the ER-TR7 antigen is unknown.Recently, one study showed that administration of an ER-TR7 antibodyinto tolerant mice affects the HEV basement membrane structure andCCL21 distribution (45). Although our analysis showed no difference inT-cell transmigration across HEVs between the ER-TR7 antibody–injected andnoninjected groups in the steady state, the increase in theparenchymal T-cell velocity of the antibody-injected group (Fig S3)implied the contribution of the ER-TR7 antigen to T-cell migration inthe lymph node parenchyma and required that the antibody be usedwith caution. FRCs can be identified by their expression of ER-TR7,podoplanin,α-SMA, and CCL19, which arenot expressed inHEV ECs (43).Thus, CCL19-cre;loxP-EGFP mice (46) or α-SMA-GFP mice (15, 47) can beused for the intravital fluorescent imaging of HEV FRCs without re-quiring the ER-TR7 antibody footpad injection.
Resident DCs in lymph nodes strategically position on the FRCconduit, including HEVs, to monitor the antigens delivered fromafferent lymph (42). These DCs contribute to lymphocyte entry intolymph nodes by interacting with HEV ECs and FRCs. CD11c+ DCsmaintain the HEV EC phenotype, including the expression of GLYCAM1(L-selectin ligands), by lymphotoxin-β-receptor (LTβR)-dependentsignalling (22). FRCs also express LTβR, and its signalling affectsFRC expansion in inflamed lymph nodes (48), but the effects of LTβRsignalling triggered by DCs on lymphocyte entry into lymph nodes inthe steady state are unknown. Interestingly, podoplanin expressed inFRCs regulates HEV endothelial adherens junctions by interactingwith the CLEC-2 of platelets (49). LTβR or podoplanin signalling maybe related to the hot spots of trans-EC lymphocyte migration.
The podoplanin of FRCs also controls FRC contractility (50, 51)and ECM production (52) by interacting with the CLEC-2 of DCs ininflamed lymph nodes. In the steady state, resident DCs in lymphnodes express CLEC-2 (53). Thus, it is conceivable that CLEC-2+
resident DCs may control the contractility of FRCs and remodel ECMsurrounding HEVs to facilitate the trans-FRC migration of T- and Bcells. Thus, the CLEC-2/podoplanin signalling may represent a keymolecular mechanism underlying our discovery that trans-FRC mi-gration hot spots preferentially occur at FRCs covered by CD11c+ DCs.In addition, the PVC (a narrow space between ECs and FRCs) acts as aregion of waiting for entering lymphocytes to maintain their pop-ulation in lymph nodes when lymphocyte egress is blocked (54),which may also be regulated by the DC-FRC interaction in HEVs.
Although we observed T- and B cells preferentially transmigrateacross FRCs covered by CD11c+ DCs (Fig 5), there is a possibility ofexistence of independent mechanisms with no causal relationshipthat facilitates the selected trans-FRC sites permits lymphocytediapedesis andat the same time favorsDCaccumulation. To exclude thispossibility, additional experiments such as observing the change of hotspots after elimination of perivascular DCs followed by finding andvalidating the role related molecules are required. In addition, bettercharacterization of the CD11c+ DCs located in the hot spots of HEVs isrequired to differentiate them from the other CD11c+ DCs observed inthe non–hot spot regions of HEVs. Some T-cell-zone resident mac-rophages can also express CD11c (55). Imaging of a triple-transgenicmouse with Zbtb46-cre;tdTomato and CD11b-GFP will be able to dif-ferentiate three types of DCs and macrophages potentially associatedwith the hot spots: Zbtb46+CD11b− cDC1 (red), Zbtb46+CD11b+ cDC2 (yellow),and Zbtb46−CD11b+ macrophage (green) (55, 56).
Herein, we clearly visualized the hot spots of trans-EC T- andB-cell migration in HEVs in vivo, but we unfortunately did notelucidate their underlying mechanisms. According to a previousreport on neutrophils in inflamed cremaster muscle venules,neutrophils preferentially adhere to the endothelial junction region(13) and preferentially transmigrate across the ECs through thejunction (para-cellular route) rather than through the nonjunctionalsite (trans-cellular route) (12). In lymph node HEVs, distinguishingbetween para- and trans-cellular routes has been challenging forseveral reasons. HEV ECs (diameter, 20–30 μm) (57) are plump inshape and smaller than flat ECs of the cremaster muscle venules(major axis, 47 μm; minor axis, 23 μm) (58). The average time requiredfor the trans-ECmigration of T cells inHEVs (<2min) is lower than thatrequired for neutrophils in inflamed venules (6 min) (12). Althoughour previous report showed the possibility of visualizing in vivo para-cellular T-cell migration in HEVs by high-speed (30 frames/s) confocalmicroscopy and fluorescently labelling the EC surface with an anti-CD31 antibody (59), the preferential route of trans-EC lymphocytemigration remains unknown.
Compared to T cells, B cells took a longer time to pass EC and FRClayers in HEV and had lower velocity in PVC and parenchyma justafter extravasation. Furthermore, the adhesion rate of B cells to HEVEC in luminal side is lower than that of T cells (5). These could beattributed to lower expression of L-selectin and CCR7 on B cellsthan T cells (18, 60). The difference in homing efficiency betweenT- and B cells may vary depending on the HEV location because ofthe heterogeneous expression of chemokines and integrins on HEVEC and surrounding FRCs in peripheral lymph node (27, 61). TheHEVs imaged in this work were located around 40–70 μmdepth fromthe capsule where might be close to B-cell follicles. B-cell homingefficiency in the deeper paracortical T-cell zone could be differentfrom our data probably due to less CXCL13 that is chemoattractant
Stepwise T- and B-cell transmigration in HEV Choe et al. https://doi.org/10.26508/lsa.202101086 vol 4 | no 8 | e202101086 12 of 17
for B cells highly expressed in follicles. Although this work focusedon peripheral lymph node, the other lymphoid organs have differentlymphocyte homing efficiency (62) because of organ-specific geneexpression on HEVs (63). B cells home better to mesenteric lymphnodes and Peyer’s patches than peripheral lymph nodes (62) byCD22-binding glycans expressed preferentially on the HEVs of mesentericlymph nodes and Peyer’s patches (63).
Inflamed peripheral lymph nodes become larger by recruitingmore lymphocytes and even L-selectin–negative leukocytes that areexcluded in the steady state (64, 65). Inflamed HEV ECs show differentgene expression, such as down-regulation of GLYCAM1 and GlcNAc6ST-1 (61). In addition, inflamed HEV integrity may be loosened because ofmarkedly increased leukocyte influx although the HEV FRCs canprevent bleeding by interacting with platelet CLEC-2 (49). CD11c+ DCsare associated with inflamed HEV EC proliferation that is functionallyassociated with increased leukocyte entry (66). The stepwisemigrationof lymphocyte across inflamed HEVs and their hot spots with peri-vascular CD11+ DCs will be interesting topic for future study.
In conclusion, we clearly visualized and analysed the multiplesteps involved in post-luminal T- and B-cell migration, includingtrans-EC, intra-PVC, and trans-FRC migration, in HEVs, suggestingthat these migration steps are regulated by PNAds. Notably, weidentified the trans-EC and trans-FRC migration hot spotsseparately in HEVs. Our analysis revealed that T- and B cellspreferentially share their trans-FRC migration hot spots but nottrans-EC migration hot spots. In addition, the trans-FRC migrationof T cells was confined to fewer sites than trans-EC migration.Surprisingly, the trans-FRC migration of T- and B cells prefer-entially occurred at FRCs covered by CD11c+ DCs. These resultsimply that pericyte-like FRCs, the second cellular barrier ofHEVs, regulate the entry of T- and B cells to maintain peripherallymph node homeostasis more precisely and restrictively than wepreviously thought.
Materials and Methods
Mice
Actin-DsRed and actin-GFP mice were kindly provided by Dr GouYoung Koh (KAIST, Daejeon, Republic of Korea). GlcNAc6ST-1 KOmice were previously described (9, 10). Kaede (19) and CD11c-YFP(23) mice were generously provided by Dr Michio Tomura (KyotoUniversity, Kyoto, Japan) and Dr Jae-Hoon Choi (Hanyang University,Seoul, Republic of Korea), respectively. C57BL/6 mice were pur-chased from the Jackson laboratory. All mice were maintained on aC57BL/6 background and bred in our SPF facility at KAIST. 8–16-wk-old mice were used. Experiments were approved by the Animal CareCommittee of KAIST (KA2013-11).
In vivo fluorescent labelling
T or B cells (2–4 × 10⁷) obtained from two spleens of actin-GFP miceby negative MACS kits (114.13D; Thermo Fisher Scientific, MAGM204;R&D Systems) were intravenously injected to an actin-DsRed mouse.Higher than 95% purity of isolated T- and B cells was confirmed by
FACS analysis using pan-T-cell and pan-B-cell markers, CD3e and B220,respectively. HEV ECs of actin-DsRed mouse popliteal lymph nodeexpressed red fluorescence much stronger than the surroundingstromal cells and endogenous lymphocytes, which was suffi-cient to image only HEV ECs by adjusting an image contrast(Fig 1A and B). To fluorescently visualize FRCs surrounding HEVsof a popliteal lymph node, an anit–ER-TR7 antibody conjugatedwith Alexa Fluor 647 (10 μg, 50 μl, sc-73355 AF647; Santa Cruz)was injected into a footpad 12 h before imaging. For the footpadinjection of the antibody, we anesthetized a mouse by intra-peritoneal injection of a mixture of 10 mg/kg Zoletil (Virbac) and6 mg/kg xylazine.
For simultaneous imaging of T- and B cells, T- and B cells isolatedfrom spleens of actin-DsRed and actin-GFP mice, respectively, wereintravenously injected to a wild-type mouse. To fluorescently labelHEV lumen, FITC-dextran (2 MD, 0.2 mg/ml, 50 μl, FD2000S; Sigma-Aldrich) dissolved in 1× PBS (Lonza) was intravenously injected,which facilitated the identification of EC in negative contrast (Fig 2Aand B). To distinguish B cells (bright green) from the HEV lumen(light green; Fig 2A and B), a low concentration of FITC-dextran inblood was maintained by the intravenous injection of a smallamount of FITC-dextran repeatedly with a tail vein catheter duringimaging. For simultaneous imaging of CD11c+ DCs and T or B cells,T or B cells obtained from two spleens of actin-DsRed mice wereintravenously injected to a CD11c-YFP mouse. To fluorescentlylabel HEV lumen, TRITC-dextran (500 kD, 1 mg/ml, 100 μl, 52194;Sigma-Aldrich) dissolved in 1× PBS (Lonza) was intravenouslyinjected.
Blocking antibody
To test accumulation of blocking antibody in abluminal side of HEV,we used MECA79 or immunoglobulin M (IgM) control conjugatedwith Alexa Fluor 488 (10 μg, 20 μl, 53-6036-82, 53-4341-80; eBio-science). For blockade of PNAd, MECA79 or IgM control (25 μg, 50 μl,553863, 553940; BD Biosciences) were injected into a footpad about3 h before imaging.
Flow cytometry
Popliteal and inguinal lymph nodes were harvested and single-cellsuspensions were prepared by mechanical dissociation on a cellstrainer (RPMI-1640 with 10% FBS). Cell suspensions were centri-fuged at 300g for 5 min. Erythrocytes in lymph nodes were lysedwith ammonium-chloride-potassium lysis buffer for 5 min at RT.Cell suspensions were washed and filtered through 40-μm filters.Nonspecific staining was reduced by using Fc receptor block (anti-CD16/CD32). Cells were incubated for 30 min with varying com-binations of the following fluorophore-conjugated monoclonalantibodies: anti-CD3e (clone 145-2C11; BD pharmigen), anti-CD4(clone GK1.5; BD Pharmingen), anti-CD8 (clone 53-6.7; eBioscience),anti-CD44 (clone IM7; BioLegend), and anti-CD62L (clone MEL-14;eBioscience) antibodies (diluted at a ratio of 1:200) in FACS buffer(5% bovine serum in PBS). After several washes, cells were ana-lysed by FACS Canto II (BD Biosciences) and the acquired datawere further evaluated by using FlowJo software (Treestar).
Stepwise T- and B-cell transmigration in HEV Choe et al. https://doi.org/10.26508/lsa.202101086 vol 4 | no 8 | e202101086 13 of 17
Mouse was anesthetized by intraperitoneal injection of a mixture of20 mg/kg Zoletil (Virbac) and 11 mg/kg xylazine. Depth of anes-thesia was continuously monitored during the experiment byusing a toe pinch and maintained by additional intramuscularinjection of half dose of the initially injected Zoletil-xylazinemixture whenever a response was observed. The left popliteallymph node of the anesthetized mouse was surgically exposed bysmall incision of skin and fascia at popliteal fossa. In addition,fatty tissue covering the lymph node was carefully removed bymicro-dissection forceps. During the entire intravital imaging,core body temperature of the mouse was maintained at 36°C byusing a temperature regulating system consisting of heating padand rectal probe (Kent Scientific Corp.). Temperature of thesurgically exposed lymph node was maintained at 36–38°C byusing tissue temperature sensor, and warm water recirculator(Kent Scientific Corp.) or silicone rubber heater (NISSI-YGC). Wecatheterized tail vein to inject T or B cells immediately before theimaging, and to inject FITC-dextran or TRITC-dextran repeatedlyduring the imaging. The prepared mouse on the motorized animalstage is shown in Fig S12. For 3D-time-lapse imaging, 22 sequentialz-stacks (170 × 170 μm, 512 × 512 pixels) with a 2-μm axial spacingwere acquired at intervals of a minute for 2–3 h after injection oflymphocytes.
Confocal microscopy system
Intravital imaging was performed by using a custom-built laserscanning confocal microscope (59, 67). Three continuous-wavelasers with 488 nm (Cobolt, MLD), 561 nm (Cobolt, Jive) and 640nm (Cobolt, MLD) were used as excitation lights for fluorescenceimaging. Fluorescence signals were simultaneously detected bythree bandpass filters (FF01-525/50, FF01-600/37, FF01-685/40;Semrock) and three photomultiplier tubes (R9110; Hamamatsu).For photoconversion of Kaede proteins, HEV in a field of view (170 ×170 μm) was irradiated by 405 nm laser (~10 mW/mm2; Coherent;OBIS) for 5 min. Z-axis resolution of about 3 μm per section wasacquired with 100 μm pinhole and 60× objective lens (LUMFLN,water immersion, NA 1.1; Olympus).
Image processing and data analysis
Tracking T or B cells was performed by using IMARIS software(version 8.1.2; Bitplane) or manual tracking plugin of ImageJ (Na-tional Institutes of Health). The position error of the track generatedfrom tissue drift was corrected by drift correction function ofIMARIS, or by a custom-written MATLAB program for the x-y axisand manually selection of same plane for z axis. We manually dis-tinguished the multistep of lymphocyte transmigrations includingtrans-EC, intra-PVC, trans-FRC, and intra-parenchyma migrations,and calculated the various parameters such as themean velocity andthe required time for each step by using Excel (Microsoft Corp.) andMATLAB (MathWorks). The 3D wind-rose plot of intra-PVC migrationsand the 3D distribution of trans-EC and trans-FRC migration sitesin HEV were made by MATLAB and IMARIS software, respectively.We defined a hot spot as a site where two or more T or B cells
transmigrated during 2–3 h of imaging. The DC coverage on HEV (Fig5D) was the average of two measurements of DC coverage at start(0 min) and end time (180 min) of imaging. The DC coverage on HEVwas calculated by dividing FRC volume colocalized with DC (cyan) bytotal FRC volume of HEV (blue; Fig S10). The FRC volume colocalizedwith DC was measured by surface–surface colocalization functionof IMARIS. Some DCs covering HEVs were moving for 3 h imaging. Weobserved that some T or B cells transmigrated across a hot spotwith temporarily absent of DC although the hot spot was covered byDC for the other T- or B-cell trans-FRC migration. For counting thehot spots covered by DCs in Fig 5D, we included the hot spots thatwere covered by DC for at least half of T- or B-cell trans-FRCmigration.
Statistics
Mann–Whitney test was used for the comparison of T- and B cells,GlcNAc6ST-1 KO and wild-type, MECA79 and control antibody, anit–ER-TR7 antibody-injected group and noninjected group. Pairedt test was used for the comparison of trans-EC and trans-FRCmigration (Fig 3F and G), DC coverage and trans-FRC migrationsites covered by DCs (Fig 5D). Wilcoxon test was used for thecomparison of prediction and observation of transmigration siteswhere T- and B cells simultaneously exit (Fig 4C). One-way ANOVATukey’s test was conducted to analyze the change in parenchymalT-cell velocity over time. P < 0.05 was considered statisticallysignificant.
Supplementary Information
Supplementary Information is available at https://doi.org/10.26508/lsa.202101086.
Acknowledgements
We thank Dr Sukhyun Song, Dr Jin Sung Park and Dr Kangsan Kim for helpwith FACS analysis, and Dr Gou Young Koh, Soyeon Ahn, Jingu Lee, DrInwon Park, Dr Yoonha Hwang, Dr Howon Seo, Ryul Kim, Dr Jinhyo Ahn,Eunji Kong, Sujung Hong for helpful discussion. This work was supportedby the Global Frontier Project (NRF-2013M3A6A4044716), and the BasicResearch Program (NRF-2017R1E1A1A01074190) of National ResearchFoundation of Korea (NRF) through funded by the Ministry of Science andICT, Republic of Korea.
Author Contributions
K Choe: conceptualization, resources, formal analysis, investigation,visualization, methodology, and writing—original draft, review, andediting.J Moon: resources, formal analysis, and investigation.SY Lee: resources.E Song: resources.JH Back: resources.J-H Song: methodology.Y-M Hyun: writing—review and editing.K Uchimura: resources and writing—review and editing.
Stepwise T- and B-cell transmigration in HEV Choe et al. https://doi.org/10.26508/lsa.202101086 vol 4 | no 8 | e202101086 14 of 17
P Kim: conceptualization, supervision, and writing—original draft,review, and editing.
Conflict of Interest Statement
The authors declare that they have no conflict of interest.
References
1. von Andrian UH, Mempel TR (2003) Homing and cellular traffic in lymphnodes. Nat Rev Immunol 3: 867–878. doi:10.1038/nri1222
2. Girard JP, Moussion C, Forster R (2012) HEVs, lymphatics and homeostaticimmune cell trafficking in lymph nodes. Nat Rev Immunol 12: 762–773.doi:10.1038/nri3298
3. Gretz JE, Anderson AO, Shaw S (1997) Cords, channels, corridors andconduits: Critical architectural elements facilitating cell interactions inthe lymph node cortex. Immunol Rev 156: 11–24. doi:10.1111/j.1600-065x.1997.tb00955.x
4. Boscacci RT, Pfeiffer F, Gollmer K, Sevilla AI, Martin AM, Soriano SF, NataleD, Henrickson S, von Andrian UH, Fukui Y, et al (2010) Comprehensiveanalysis of lymph node stroma-expressed Ig superfamily membersreveals redundant and nonredundant roles for ICAM-1, ICAM-2, andVCAM-1 in lymphocyte homing. Blood 116: 915–925. doi:10.1182/blood-2009-11-254334
5. Park C, Hwang IY, Sinha RK, Kamenyeva O, Davis MD, Kehrl JH (2012)Lymph node B lymphocyte trafficking is constrained by anatomy andhighly dependent upon chemoattractant desensitization. Blood 119:978–989. doi:10.1182/blood-2011-06-364273
6. Rosen SD (2004) Ligands for L-selectin: Homing, inflammation, andbeyond. Annu Rev Immunol 22: 129–156. doi:10.1146/annurev.immunol.21.090501.080131
7. Hemmerich S, Bistrup A, Singer MS, van Zante A, Lee JK, Tsay D, Peters M,Carminati JL, Brennan TJ, Carver-Moore K, et al (2001) Sulfation ofL-selectin ligands by an HEV-restricted sulfotransferase regulateslymphocyte homing to lymph nodes. Immunity 15: 237–247. doi:10.1016/s1074-7613(01)00188-1
8. Kawashima H, Petryniak B, Hiraoka N, Mitoma J, Huckaby V, Nakayama J,Uchimura K, Kadomatsu K, Muramatsu T, Lowe JB, et al (2005) N-acetylglucosamine-6-O-sulfotransferases 1 and 2 cooperatively controllymphocyte homing through L-selectin ligand biosynthesis in highendothelial venules. Nat Immunol 6: 1096–1104. doi:10.1038/ni1259
9. Uchimura K, Gauguet JM, Singer MS, Tsay D, Kannagi R, Muramatsu T, vonAndrian UH, Rosen SD (2005) A major class of L-selectin ligands iseliminated in mice deficient in two sulfotransferases expressed in highendothelial venules. Nat Immunol 6: 1105–1113. doi:10.1038/ni1258
10. Uchimura K, Kadomatsu K, El-Fasakhany FM, Singer MS, Izawa M, KannagiR, Takeda N, Rosen SD, Muramatsu T (2004) N-acetylglucosamine 6-O-sulfotransferase-1 regulates expression of L-selectin ligands andlymphocyte homing. J Biol Chem 279: 35001–35008. doi:10.1074/jbc.M404456200
11. Bajenoff M, Egen JG, Koo LY, Laugier JP, Brau F, Glaichenhaus N, GermainRN (2006) Stromal cell networks regulate lymphocyte entry, migration,and territoriality in lymph nodes. Immunity 25: 989–1001. doi:10.1016/j.immuni.2006.10.011
12. Woodfin A, Voisin MB, Beyrau M, Colom B, Caille D, Diapouli FM, Nash GB,Chavakis T, Albelda SM, Rainger GE, et al (2011) The junctional adhesionmolecule JAM-C regulates polarized transendothelial migration ofneutrophils in vivo. Nat Immunol 12: 761–769. doi:10.1038/ni.2062
13. Wojciechowski JC, Sarelius IH (2005) Preferential binding of leukocytesto the endothelial junction region in venules in situ. Microcirculation 12:349–359. doi:10.1080/10739680590934763
14. Wang S, Voisin MB, Larbi KY, Dangerfield J, Scheiermann C, Tran M,Maxwell PH, Sorokin L, Nourshargh S (2006) Venular basementmembranes contain specific matrix protein low expression regions thatact as exit points for emigrating neutrophils. J Exp Med 203: 1519–1532.doi:10.1084/jem.20051210
15. Proebstl D, Proebstl D, D’Angelo LT, Lueth TC (2012) Pericytes supportneutrophil subendothelial cell crawling and breaching of venular wallsin vivo. J Exp Med 209: 1219–1234. doi:10.1084/jem.20111622
16. Abtin A, Jain R, Mitchell AJ, Roediger B, Brzoska AJ, Tikoo S, Cheng Q, Ng LG,Cavanagh LL, von Andrian UH, et al (2014) Perivascular macrophagesmediate neutrophil recruitment during bacterial skin infection. NatImmunol 15: 45–53. doi:10.1038/ni.2769
17. Miyasaka M, Tanaka T (2004) Lymphocyte trafficking across highendothelial venules: Dogmas and enigmas. Nat Rev Immunol 4: 360–370.doi:10.1038/nri1354
18. Tang ML, Steeber DA, Zhang XQ, Tedder TF (1998) Intrinsic differences inL-selectin expression levels affect T and B lymphocyte subset-specificrecirculation pathways. J Immunol 160: 5113–5121. https://www.jimmunol.org/content/160/10/5113
19. Tomura M, Yoshida N, Tanaka J, Karasawa S, Miwa Y, Miyawaki A,Kanagawa O (2008) Monitoring cellular movement in vivo withphotoconvertible fluorescence protein “Kaede” transgenic mice. ProcNatl Acad Sci U S A 105: 10871–10876. doi:10.1073/pnas.0802278105
20. Mempel TR, Henrickson SE, Von Andrian UH (2004) T-cell priming bydendritic cells in lymph nodes occurs in three distinct phases. Nature427: 154–159. doi:10.1038/nature02238
21. Bajenoff M, Granjeaud S, Guerder S (2003) The strategy of T cell antigen-presenting cell encounter in antigen-draining lymph nodes revealed byimaging of initial T cell activation. J Exp Med 198: 715–724. doi:10.1084/jem.20030167
22. Moussion C, Girard J-P (2011) Dendritic cells control lymphocyte entry tolymph nodes through high endothelial venules. Nature 479: 542–546.doi:10.1038/nature10540
24. Nourshargh S, Alon R (2014) Leukocyte migration into inflamed tissues.Immunity 41: 694–707. doi:10.1016/j.immuni.2014.10.008
25. Ley K, Laudanna C, Cybulsky MI, Nourshargh S (2007) Getting to the site ofinflammation: The leukocyte adhesion cascade updated. Nat RevImmunol 7: 678–689. doi:10.1038/nri2156
26. Hickey MJ, Forster M, Mitchell D, Kaur J, De Caigny C, Kubes P (2000) L-selectin facilitates emigration and extravascular locomotion ofleukocytes during acute inflammatory responses in vivo. J Immunol 165:7164–7170. doi:10.4049/jimmunol.165.12.7164
27. Rodda LB, Lu E, Bennett ML, Sokol CL, Wang X, Luther SA, Barres BA, LusterAD, Ye CJ, Cyster JG (2018) Single-cell RNA sequencing of lymph nodestromal cells reveals niche-associated heterogeneity. Immunity 48:1014–1028.e6. doi:10.1016/j.immuni.2018.04.006
28. Uchimura K, Rosen SD (2006) Sulfated L-selectin ligands as atherapeutic target in chronic inflammation. Trends Immunol 27: 559–565.doi:10.1016/j.it.2006.10.007
29. Freitas AA, Bognacki J (1979) The role of locomotion in lymphocytemigration. Immunology 36: 247–255. http://www.ncbi.nlm.nih.gov/pubmed/220182
30. Faveeuw C, Preece G, Ager A (2001) Transendothelial migration oflymphocytes across high endothelial venules into lymph nodes isaffected by metalloproteinases. Blood 98: 688–695. doi:10.1182/blood.v98.3.688
31. Galkina E, Tanousis K, Preece G, Tolaini M, Kioussis D, Florey O, HaskardDO, Tedder TF, Ager A (2003) L-selectin shedding does not regulateconstitutive T cell trafficking but controls the migration pathways of
Stepwise T- and B-cell transmigration in HEV Choe et al. https://doi.org/10.26508/lsa.202101086 vol 4 | no 8 | e202101086 15 of 17
antigen-activated T lymphocytes. J Exp Med 198: 1323–1335. doi:10.1084/jem.20030485
32. Rzeniewicz K, Newe A, Rey Gallardo A, Davies J, Holt MR, Patel A, CharrasGT, Stramer B, Molenaar C, Tedder TF, et al (2015) L-selectin shedding isactivated specifically within transmigrating pseudopods of monocytesto regulate cell polarity in vitro. Proc Natl Acad Sci U S A 112: E1461–E1470.doi:10.1073/pnas.1417100112
33. Giblin PA, Hwang ST, Katsumoto TR, Rosen SD (1997) Ligation ofL-selectin on T lymphocytes activates beta1 integrins and promotesadhesion to fibronectin. J Immunol 159: 3498–3507. https://www.jimmunol.org/content/159/7/3498.long
34. Hwang ST, Singer MS, Giblin PA, Yednock TA, Bacon KB, Simon SI, RosenSD (1996) GlyCAM-1, a physiologic ligand for L-selectin, activates beta 2integrins on naive peripheral lymphocytes. J Exp Med 184: 1343–1348.doi:10.1084/jem.184.4.1343
35. Subramanian H, Grailer JJ, Ohlrich KC, Rymaszewski AL, Loppnow JJ,Kodera M, Conway RM, Steeber DA (2012) Signaling through L-selectinmediates enhanced chemotaxis of lymphocyte subsets to secondarylymphoid tissue chemokine. J Immunol 188: 3223–3236. doi:10.4049/jimmunol.1101032
36. Arata-Kawai H, Singer MS, Bistrup A, van Zante A, Wang YQ, Ito Y, Bao X,Hemmerich S, Fukuda M, Rosen SD (2011) Functional contributions ofN- and O-glycans to L-selectin ligands in murine and human lymphoidorgans. Am J Pathol 178: 423–433. doi:10.1016/j.ajpath.2010.11.009
37. Hirakawa J, Tsuboi K, Sato K, Kobayashi M, Watanabe S, Takakura A, ImaiY, Ito Y, Fukuda M, Kawashima H (2010) Novel anti-carbohydrateantibodies reveal the cooperative function of sulfated N- and O-glycansin lymphocyte homing. J Biol Chem 285: 40864–40878. doi:10.1074/jbc.M110.167296
38. Watson SR, Imai Y, Fennie C, Geoffroy JS, Rosen SD, Lasky LA (1990) Ahoming receptor-IgG chimera as a probe for adhesive ligands of lymphnode high endothelial venules. J Cell Biol 110: 2221–2229. doi:10.1083/jcb.110.6.2221
39. Yang B-G, Tanaka T, Jang MH, Bai Z, Hayasaka H, Miyasaka M (2007)Binding of lymphoid chemokines to collagen IV that accumulates in thebasal lamina of high endothelial venules: Its implications in lymphocytetrafficking. J Immunol 179: 4376–4382. doi:10.4049/jimmunol.179.7.4376
40. Bai Z, Cai L, Umemoto E, Takeda A, Tohya K, Komai Y, Veeraveedu PT, HataE, Sugiura Y, Kubo A (2013) Constitutive lymphocyte transmigrationacross the basal lamina of high endothelial venules is regulated by theautotaxin/lysophosphatidic acid axis. J Immunol 190: 2036–2048.doi:10.4049/jimmunol.1202025
41. Nagakubo D, Murai T, Tanaka T, Usui T, Matsumoto M, Sekiguchi K,Miyasaka M (2003) A high endothelial venule secretory protein, mac25/angiomodulin, interacts with multiple high endothelial venule-associated molecules including chemokines. J Immunol 171: 553–561.doi:10.4049/jimmunol.171.2.553
42. Sixt M, Kanazawa N, Selg M, Samson T, Roos G, Reinhardt DP, Pabst R, LutzMB, Sorokin L (2005) The conduit system transports soluble antigensfrom the afferent lymph to resident dendritic cells in the T cell area ofthe lymph node. Immunity 22: 19–29. doi:10.1016/j.immuni.2004.11.013
43. Mueller SN, Germain RN (2009) Stromal cell contributions to thehomeostasis and functionality of the immune system. Nat Rev Immunol9: 618–629. doi:10.1038/nri2588
44. Katakai T, Hara T, Sugai M, Gonda H, Shimizu A (2004) Lymph nodefibroblastic reticular cells construct the stromal reticulum via contactwith lymphocytes. J Exp Med 200: 783–795. doi:10.1084/jem.20040254
45. Burrell BE, Warren KJ, Nakayama Y, Iwami D, Brinkman CC, Bromberg JS(2015) Lymph node stromal fiber ER-TR7 modulates CD4+ T cell lymphnode trafficking and transplant tolerance. Transplantation 99: 1119–1125.doi:10.1097/TP.0000000000000664
46. Chai Q, Onder L, Scandella E, Gil-Cruz C, Perez-Shibayama C, Cupovic J,Danuser R, Sparwasser T, Luther SA, Thiel V, et al (2013) Maturation of
lymph node fibroblastic reticular cells from myofibroblastic precursorsis critical for antiviral immunity. Immunity 38: 1013–1024. doi:10.1016/j.immuni.2013.03.012
47. Yokota T, Kawakami Y, Nagai Y, Ma JX, Tsai JY, Kincade PW, Sato S (2006)Bone marrow lacks a transplantable progenitor for smooth muscle typealpha-actin-expressing cells. Stem Cells 24: 13–22. doi:10.1634/stemcells.2004-0346
48. Yang C-Y, Vogt TK, Favre S, Scarpellino L, Huang HY, Tacchini-Cottier F,Luther SA (2014) Trapping of naive lymphocytes triggers rapid growthand remodeling of the fibroblast network in reactive murine lymphnodes. Proc Natl Acad Sci U S A 111: E109–E118. doi:10.1073/pnas.1312585111
49. Herzog BH, Fu J, Wilson SJ, Hess PR, Sen A, McDaniel JM, Pan Y, Sheng M,Yago T, Silasi-Mansat R, et al (2013) Podoplanin maintains highendothelial venule integrity by interacting with platelet CLEC-2. Nature502: 105–109. doi:10.1038/nature12501
50. Acton SE, Farrugia AJ, Astarita JL, Mourão-Sa D, Jenkins RP, Nye E, HooperS, van Blijswijk J, Rogers NC, Snelgrove KJ, et al (2014) Dendritic cellscontrol fibroblastic reticular network tension and lymph nodeexpansion. Nature 514: 498–502. doi:10.1038/nature13814
51. Astarita JL, Cremasco V, Fu J, Darnell MC, Peck JR, Nieves-Bonilla JM, SongK, Kondo Y, Woodruff MC, Gogineni A, et al (2015) The CLEC-2-podoplaninaxis controls the contractility of fibroblastic reticular cells and lymphnode microarchitecture. Nat Immunol 16: 75–84. doi:10.1038/ni.3035
52. Martinez VG, Pankova V, Krasny L, Singh T, Makris S, White IJ, Benjamin AC,Dertschnig S, Horsnell HL, Kriston-Vizi J, et al (2019) Fibroblastic reticularcells control conduit matrix deposition during lymph node expansion.Cell Rep 29: 2810–2822.e5. doi:10.1016/j.celrep.2019.10.103
53. Acton SE, Astarita JL, Malhotra D, Lukacs-Kornek V, Franz B, Hess PR,Jakus Z, Kuligowski M, Fletcher AL, Elpek KG, et al (2012) Podoplanin-richstromal networks induce dendritic cell motility via activation of the C-type lectin receptor CLEC-2. Immunity 37: 276–289. doi:10.1016/j.immuni.2012.05.022
54. Mionnet C, Sanos SL, Mondor I, Jorquera A, Laugier J-P, Germain RN,Bajenoff M (2011) High endothelial venules as traffic control pointsmaintaining lymphocyte population homeostasis in lymph nodes. Blood118: 6115–6122. doi:10.1182/blood-2011-07-367409
55. Baratin M, Simon L, Jorquera A, Ghigo C, Dembele D, Nowak J, Gentek R,Wienert S, Klauschen F, Malissen B, et al (2017) T cell zone residentmacrophages silently dispose of apoptotic cells in the lymph node.Immunity 47: 349–362.e5. doi:10.1016/j.immuni.2017.07.019
56. Satpathy AT, Kc W, Albring JC, Edelson BT, Kretzer NM, BhattacharyaD, Murphy TL, Murphy KM (2012) Zbtb46 expression distinguishesclassical dendritic cells and their committed progenitors fromother immune lineages. J Exp Med 209: 1135–1152. doi:10.1084/jem.20120030
57. Cook-Mills JM, Gallagher JS, Feldbush TL (1996) Isolation andcharacterization of high endothelial cell lines derived from mouselymph nodes. In Vitro Cell Dev Biol Anim 32: 167–177. doi:10.1007/BF02723682
58. Sumagin R, Brown CW, Sarelius IH, King MR (2008) Microvascularendothelial cells exhibit optimal aspect ratio for minimizing flowresistance. Ann Biomed Eng 36: 580–585. doi:10.1007/s10439-008-9467-2
59. Choe K, Hwang Y, Seo H, Kim P (2013) In vivo high spatiotemporalresolution visualization of circulating T lymphocytes in high endothelialvenules of lymph nodes. J Biomed Opt 18: 036005. doi:10.1117/1.JBO.18.3.036005
60. Okada T, Ngo VN, Ekland EH, Forster R, Lipp M, Littman DR, Cyster JG(2002) Chemokine requirements for b cell entry to lymph nodes andPeyer’s patches. J Exp Med 196: 65–75. doi:10.1084/jem.20020201
61. Veerman K, Tardiveau C, Martins F, Coudert J, Girard JP (2019) Single-cellanalysis reveals heterogeneity of high endothelial venules and different
Stepwise T- and B-cell transmigration in HEV Choe et al. https://doi.org/10.26508/lsa.202101086 vol 4 | no 8 | e202101086 16 of 17
regulation of genes controlling lymphocyte entry to lymph nodes. CellRep 26: 3116–3131.e5. doi:10.1016/j.celrep.2019.02.042
62. Stevens SK, Weissman IL, Butcher EC (1982) Differences in themigration of B and T lymphocytes: Organ-selective localization invivo and the role of lymphocyte-endothelial cell recognition. JImmunol 128: 844–851. https://www.jimmunol.org/content/128/2/844.long
63. Lee M, Kiefel H, LaJevic MD, Macauley MS, Kawashima H, O’Hara E, Pan J,Paulson JC, Butcher EC (2014) Transcriptional programs of lymphoidtissue capillary and high endothelium reveal control mechanisms forlymphocyte homing. Nat Immunol 15: 982–995. doi:10.1038/ni.2983
64. Soderberg KA, Payne GW, Sato A, Medzhitov R, Segal SS, Iwasaki A (2005)Innate control of adaptive immunity via remodeling of lymnh node feedarteriole. Proc Natl Acad Sci U S A 102: 16315–16320. doi:10.1073/pnas.0506190102
65. Ager A, May MJ (2015) Understanding high endothelial venules: Lessonsfor cancer immunology. Oncoimmunology 4: e1008791. doi:10.1080/2162402X.2015.1008791
66. Webster B, Ekland EH, Agle LM, Chyou S, Ruggieri R, Lu TT (2006)Regulation of lymph node vascular growth by dendritic cells. J Exp Med203: 1903–1913. doi:10.1084/jem.20052272
67. Choe K, Jang JY, Park I, Kim Y, Ahn S, Park DY, Hong YK, Alitalo K, Koh GY, KimP (2015) Intravital imaging of intestinal lacteals unveils lipid drainagethrough contractility. J Clin Invest 125: 4042–4052. doi:10.1172/JCI76509
License: This article is available under a CreativeCommons License (Attribution 4.0 International, asdescribed at https://creativecommons.org/licenses/by/4.0/).
Stepwise T- and B-cell transmigration in HEV Choe et al. https://doi.org/10.26508/lsa.202101086 vol 4 | no 8 | e202101086 17 of 17


![Soluble CD146, a cerebrospinal fluid marker for ... · blood-brain barrier endothelial cells (BBBECs) and - promotes the transmigration of inflammatory cells into the CNS [16, 17].](https://static.documents.pub/doc/80x56/5f59f879b918fa1a427b1dc7/soluble-cd146-a-cerebrospinal-fluid-marker-for-blood-brain-barrier-endothelial.jpg)


