+ All Categories
Home > Documents > Steve Cuddy Edinburgh Pore Geometry 2008

Steve Cuddy Edinburgh Pore Geometry 2008

Date post: 20-Feb-2018
Category:
Upload: valdo
View: 243 times
Download: 5 times
Share this document with a friend
16
SPWLA 49 th  Annual Logging Symposium, May 25-28, 2008 1 THE EFFECT OF PORE GEOMETRY ON THE DISTRIBUTION OF RESERVOIR FLUIDS IN U.K. NORTH SEA OIL AND GAS FIELDS  Dean Gagnon 1  , Steve Cuddy 2  , Fabrizio Conti 2  , Craig Lindsay 2  1  Nexen Petroleum UK Ltd., 2  Helix RDS Copyright 2008, held jointly by the Society of Petrophysicists and Well Log Analysts (SPWLA) and the submitting authors. This paper was prepared for presentation at the SPWLA 49 th  Annual Logging Symposium held in Edinburgh, Scotland, May 25- 28, 2008. ABSTRACT The accurate determination of hydrocarbons initially in place requires a thorough understanding of how water saturation (Sw) varies as a function of height above the free water level (FWL). Nowhere is this more important than in the transition zone. Electrical logs, core data and thin sections from fifteen North Sea fields were compared to understand how reservoir parameters determine the shape of the transition zone. These incl uded pore geometry as well as the rock quality and reservoir fluid parameters contained in the Leverett J-Function. The water saturation vs. height (SwH) function selected for this research is the so-called FOIL Function, that relates the bulk volume of water to height using only two constants ‘a’ and ‘b’ in the form BVW=aH  b . Comparison of the Leverett J- Function with the FOIL Function showed that all the reservoir parameters relating to rock quality and reservoir fluids are found within the ‘a’ constant of the FOIL Function. Although the fields studied ranged from multi-Darcy gas fields to milli-Darcy oil fields, the ‘b’ constant is surprisingly invariable: with the shape of the transition zone described by the SwH Function being controlled almost entirely by the single constant ‘a’. The constant ‘a’ is found to be predominantly dependent on reservoir pore geometry. Thin section analysis showed that the fields with a low ‘a’ value have well connected evenly spaced pores, lack pore throat bridging, blocking and grain coating clays and have simple pore pathways. This explains how the water saturation is a function of connectivity as well as porosity and height above the FWL. Analysis confirmed that the pore geometry rather than porosity and permeability determine the shape of the transition zone. A new pore geometry (PG) index is proposed that is correlated to the FOIL ‘a’ constant. This index can be used to make predictions about the quality of pore geometry within a reservoir and the shape of the SwH function. This PG index is successful in explaining how fields with very different porosity and  permeability can have very similar SwH functions and why poorer quality reservoir intervals do not necessarily have higher water saturations . The revised SwH function provides a robust method for picking the FWL even in fields where the actual fluid contact is unclear or was not penetrated. The new index better describes pore geometry and allows the hydrocarbon distributions to be understood and represented more accurately in the 3D reservoir model. INTRODUCTION  Background Accurate determination of hydrocarbons initially in  place requires a saturation vs. height (SwH) function to describe how water saturation varies with height above the free water level (FWL). Water saturation (Sw) determined from interpretation of log data can only represent the reservoir within a few feet surrounding the well bore. Sw cannot be mapped as it depends on numerous factors including  porosity and the height above the loca l FWL. SwH functions are used in a field’s reservoir model to estimate Sw away from well locations so that hydrocarbons initially in place can be calculated. The error in reserves resulting from an equation that  poorly describes t he reservoir can be significant. This study uses the FOIL 1  SwH function to compare reservoirs of different North Sea fields. The FOIL Function is an algorithm which is commonly used to determine water saturations in North Sea reservoirs (Cuddy 1993). It was developed using log data from the Southern North Sea and has since found wider 1  The term FOIL refers to free oil (or gas) above the FWL. Free water exists below the FWL.
Transcript

7/24/2019 Steve Cuddy Edinburgh Pore Geometry 2008

http://slidepdf.com/reader/full/steve-cuddy-edinburgh-pore-geometry-2008 1/16

SPWLA 49th

 Annual Logging Symposium, May 25-28, 2008

1

THE EFFECT OF PORE GEOMETRY 

ON THE DISTRIBUTION OF RESERVOIR FLUIDS IN 

U.K. NORTH SEA OIL AND GAS FIELDS 

 Dean Gagnon1 , Steve Cuddy

2 , Fabrizio Conti

2 , Craig Lindsay

1

 Nexen Petroleum UK Ltd.,

2

 Helix RDS

Copyright 2008, held jointly by the Society of Petrophysicists andWell Log Analysts (SPWLA) and the submitting authors.

This paper was prepared for presentation at the SPWLA 49 th 

Annual Logging Symposium held in Edinburgh, Scotland, May 25-28, 2008.

ABSTRACT

The accurate determination of hydrocarbons initially

in place requires a thorough understanding of how

water saturation (Sw) varies as a function of heightabove the free water level (FWL). Nowhere is this

more important than in the transition zone.

Electrical logs, core data and thin sections fromfifteen North Sea fields were compared to understand

how reservoir parameters determine the shape of the

transition zone. These included pore geometry as

well as the rock quality and reservoir fluid parameters

contained in the Leverett J-Function.

The water saturation vs. height (SwH) function

selected for this research is the so-called FOILFunction, that relates the bulk volume of water to

height using only two constants ‘a’ and ‘b’ in the

form BVW=aH b

. Comparison of the Leverett J-Function with the FOIL Function showed that all thereservoir parameters relating to rock quality and

reservoir fluids are found within the ‘a’ constant of

the FOIL Function. Although the fields studied

ranged from multi-Darcy gas fields to milli-Darcy oilfields, the ‘b’ constant is surprisingly invariable: with

the shape of the transition zone described by the SwH

Function being controlled almost entirely by thesingle constant ‘a’.

The constant ‘a’ is found to be predominantly

dependent on reservoir pore geometry. Thin section

analysis showed that the fields with a low ‘a’ valuehave well connected evenly spaced pores, lack pore

throat bridging, blocking and grain coating clays and

have simple pore pathways. This explains how the

water saturation is a function of connectivity as wellas porosity and height above the FWL. Analysis

confirmed that the pore geometry rather than porosityand permeability determine the shape of the transition

zone.

A new pore geometry (PG) index is proposed that is

correlated to the FOIL ‘a’ constant. This index can be

used to make predictions about the quality of poregeometry within a reservoir and the shape of the SwH

function. This PG index is successful in explaining

how fields with very different porosity and

 permeability can have very similar SwH functionsand why poorer quality reservoir intervals do not

necessarily have higher water saturations. The revised

SwH function provides a robust method for picking

the FWL even in fields where the actual fluid contact

is unclear or was not penetrated.

The new index better describes pore geometry and

allows the hydrocarbon distributions to be understoodand represented more accurately in the 3D reservoir

model.

INTRODUCTION

 Background

Accurate determination of hydrocarbons initially in place requires a saturation vs. height (SwH) function

to describe how water saturation varies with height

above the free water level (FWL).

Water saturation (Sw) determined from interpretation

of log data can only represent the reservoir within a

few feet surrounding the well bore. Sw cannot bemapped as it depends on numerous factors including

 porosity and the height above the local FWL.

SwH functions are used in a field’s reservoir model to

estimate Sw away from well locations so thathydrocarbons initially in place can be calculated. The

error in reserves resulting from an equation that

 poorly describes the reservoir can be significant.

This study uses the FOIL1 SwH function to compare

reservoirs of different North Sea fields. The FOIL

Function is an algorithm which is commonly used todetermine water saturations in North Sea reservoirs

(Cuddy 1993). It was developed using log data from

the Southern North Sea and has since found wider

1 The term FOIL refers to free oil (or gas) above the

FWL. Free water exists below the FWL.

7/24/2019 Steve Cuddy Edinburgh Pore Geometry 2008

http://slidepdf.com/reader/full/steve-cuddy-edinburgh-pore-geometry-2008 2/16

SPWLA 49th

 Annual Logging Symposium, May 25-28, 2008

2

application throughout the United Kingdom

Continental Shelf (UKCS). The function has a simple

form and is largely independent of porosity and

 permeability. It calculates the Bulk Volume of Water

(BVW) as a function of height (H) above the FWL.Alternatively, it can be used to calculate BVW as a

function of Capillary Pressure (Pc). BVW is the

 product of water saturation and porosity. The FOILFunction is derived from the Leverett J-Function and

has the form:

b

w aH S  BVW    =Φ=   Equation 1

where:BVW = bulk volume of water (v/v)

Ø = porosity (v/v)

Sw = water saturation (v/v)H = height above the free water level (ft)

a = constant (dimensionless)

 b = constant (dimensionless, negative value)

The function describes how BVW varies as a function

of height above the FWL. The function tells us that at

a particular depth in the net   reservoir BVW is fixed

with hydrocarbon filling the remaining pore space.

Once the function has been derived water saturation

can be calculated re-arranging equation 1:

Φ=

b

w

aH S    Equation 2

The main strengths of the FOIL Function are that it

does not require permeability and is mostly

independent of lithology. However, if a reservoir

interval contains different geological units or litho-facies with distinct and coherent porosity– 

 permeability relationships, then separate FOIL

Functions should be constructed to provide a morerobust description of the reservoir (Amabeoku et al.

2005). The predictions the function makes with

regard to pore and pore throat geometry were

investigated through thin section observations.

The FWL is the datum from which the FOIL Function

 bases its calculations as it represents the depth where

the capillary pressure is zero. In the absence ofdrilling fluids it is the depth where water andhydrocarbon would vertically separate in a large

 borehole. In water-wet reservoirs the FWL is below

the lowest occurrence of hydrocarbons. The FWL isthe depth predicted by the interception of the

formation fluid pressure gradients.

The aim of SwH functions is to estimate the water

content throughout the reservoir as accurately as

 possible. The advantage of the FOIL Function is that

it contains the BVW term which is especially

appropriate to 3D modelling (Worthington 2002)

Study Objectives

This study had five main objectives:

•  Relate pore and pore throat geometry as seen in

thin sections to FOIL Functions from log data.

•  Gain an understanding of how and why the FOILFunction works by carrying out FOIL analysis on

fields with differing depositional environments

and hydrocarbon composition.

•  Derive the FOIL Function from the Leverett J-

Function and capillary pressure versus height

relationship in order to determine which rock andfluid parameters are contained within the

function’s constants.

•  Validate the method by analysis of core capillary

 pressure, porosity and permeability data.

•  Determine the sensitivity of the FOIL Functionconstant ‘a’ to variations in the rock and fluid

 parameters that compose it. 

 Data Available

Data from fifteen UK North Sea fields (250 wells)

were used in this study. Electrical logs and

conventional core (porosity and permeability) data

were available from eleven fields. Thin section and

capillary pressure data were respectively availablefrom three and two of these fields. Capillary pressure

and conventional core data were also available fromfour additional fields.

The fields with log data used in the study are listed in

Table 1. They were selected as they represent a range

of reservoir fluids, depositional environments and porosity vs. permeability (poroperm).

The poroperm distribution for the eleven fields withlog and core data is shown in Figure 1: where average

 permeability increases with average porosity as

expected. Average permeability spans fourlogarithmic cycles: from 0.1 mD to 2 D (Darcy).

Porosities range from 8 to 32 Porosity Units (PU).

THIN SECTION ANALYSIS

Thin sections from three of the study fields (Fields E,

F, and K) were described with emphasis placed on the

geometry of pores and pore throats. The descriptions

were quantified where possible in order to facilitate

7/24/2019 Steve Cuddy Edinburgh Pore Geometry 2008

http://slidepdf.com/reader/full/steve-cuddy-edinburgh-pore-geometry-2008 3/16

SPWLA 49th

 Annual Logging Symposium, May 25-28, 2008

3

the comparison between samples. This quantification

was based on visual observation and estimation of

relative percentages.

The limitations of describing a 3-dimensional poresystem from 2-dimensional thin-sections are well

documented. For the purposes of this study,

comparative evaluation of thin sections from differentreservoirs provided fit for purpose quantification of

 pore network properties.

Fields E, F, K have similar porosity but substantially

different permeability as seen in Figure 1. This can be

explained by differences in pore throat attributes.

Pore throat attributes include pore throat shape,

radius, pore coordination number (number of outlets per pore), general connectivity (defined as the

arithmetic mean of the pore coordination number for

the entire measured volume) and quantity/type ofthroat blocking (flow impeding) minerals. Generally,

if samples have the same porosity, any differences in permeability can be explained by differences in

connectivity and amount of flow impeding materialwithin the connecting pore pathways.

Fields E and F have very similar pore and pore throat

attributes. Figure 2 (Field E) and Figure 3 (Field F)

display complex pore shapes which are evenlydistributed, have a smooth pore wall texture and lack

 pore lining materials, though minor amounts of quartz

overgrowths, pyrite crystals and grain coating claysdo occur. Most often the pore throat radii are only

moderately smaller than the adjoining pore’s

maximum dimension and the majority of pores areconnected via short non–tortuous pore pathwayswhich have a curved geometry. Overall the

connectivity between pores is excellent and most

 pores have an average coordination number of 4.

Field K shown in Figure 4 has a much different pore

and pore throat character. Pore shapes are distributed

 between complex and simple geometric shapes. Porewalls have a rough texture and are lined with detrital

grain coating clays. Pore lining, bridging, and filling

authigenic clays (platy chlorite and illite, wispy illite)

are common. Most pores are found in isolated groups

with good internal connectivity but very poor inter– group connectivity. Internal connectivity is

characterized by short curved pathways with three to

four outlets per pore, where as inter–group

connectivity is via long narrow tortuous pathways.

These observations suggest that good reservoirs arecharacterised by well connected evenly spaced pores,

minor throat obstructing material and simple pore

throat pathways. Conversely, low quality reservoirs

are characterised by isolated groups of pores

connected via long tortuous pathways that contain an

abundance of pore throat obstructing material.

FOIL FUNCTION METHODOLOGY

A FOIL Function can be determined for a well or

entire field from either log or core data. This sectiondescribes the steps involved in constructing a FOIL

Function for a field using log data. FOIL Functions

were determined from electrical logs for eleven fieldslocated throughout the UK North Sea. The fields

included both gas and oil accumulations in different

types of clastic reservoirs from different depositional

environments. The broad spectra of fields were

chosen in order to assess the robustness of thefunction. Table 1 lists the fields, their fluid type and

depositional environment.

The BVW for each well was calculated as the product

of the water saturation and porosity curves. This was plotted against the height above the FWL. Only data

away from conductive bed boundaries were includedin order to minimise the effect of shoulder bed effects

on the resistivity logs.

The FOIL Functions were calculated by plotting the

logarithm (base 10) of BVW (x-axis) against thelogarithm of the true vertical height (y-axis) above the

FWL. Then a free linear regression was used to

compute the FOIL Function parameters. This processworks because the form of the FOIL Function can

also be stated as:

a H b BVW  101010 logloglog   +=   Equation 3

which is the form of the straight-line equation y = mx

+ c, where parameter ‘b’ (m) has a negative value.

Since the FOIL Function can be written in the form of

a straight line the ‘a’ value is the y-intercept and the

‘b’ value is the slope of the line. The FOIL Functions

calculated for the study fields are shown in Figure 5.

The FOIL ‘a’ and ‘b’ parameters were calculated

from logs for the eleven study fields as listed in Table

1. A log-log plot of BVW against height above theFWL is shown in Figure 6.

It is noticeable that all the fields share a similar ‘b’

 parameter (slope) and the main difference between

the SwH Functions is due the variation of ‘a’

(intercept) between the fields.

7/24/2019 Steve Cuddy Edinburgh Pore Geometry 2008

http://slidepdf.com/reader/full/steve-cuddy-edinburgh-pore-geometry-2008 4/16

SPWLA 49th

 Annual Logging Symposium, May 25-28, 2008

4

FOIL FUNCTION ANALYSIS

The FOIL Function can be derived from the Leverett

J-Function and capillary pressure versus height

relationship as described by Cuddy (1993).

ΦΦ−

= *)(

cos β 

 ρ  ρ ϑ ασ 

K  H g BVW 

hw

  Equation 4

Re-arranging this into the form of the FOIL Function

(Equation 1) gives:

 β  β 

 ρ  ρ 

ϑ ασ 1

1

)(

cos  −

⎥⎥⎥

⎢⎢⎢

⎟⎟

 ⎠

 ⎞

⎜⎜

⎝ 

⎛    Φ

−Φ=  H 

K g BVW 

hw

  Eq. 5

Comparison with Equation 1 gives constants ‘a’ and‘b’ of the FOIL Function:

( )( )

 β 

 ρ  ρ 

ϑ ασ 

1

cos⎟⎟ ⎠

 ⎞⎜⎜⎝ 

⎛    Φ

−Φ=

K ga

hw

  Equation 6 

 β 

1−=b   Equation 7

where:σ  = interfacial tension (dyne/cm)

K = permeability (cm2)

Ø = porosity (fraction)

ϑ   = contact angle (degrees)

g = acceleration of gravity (m/sec2)ρw  = density of the water phase (g/cm3)ρg  = density of the hydrocarbon phase (g/cm3)α  = dimensionless constantβ  = dimensionless constant

It is noticeable that all parameters associated withrock quality and reservoir fluids are contained in

 parameter ‘a’. This is consistent with the empirical

observation from Figure 6.

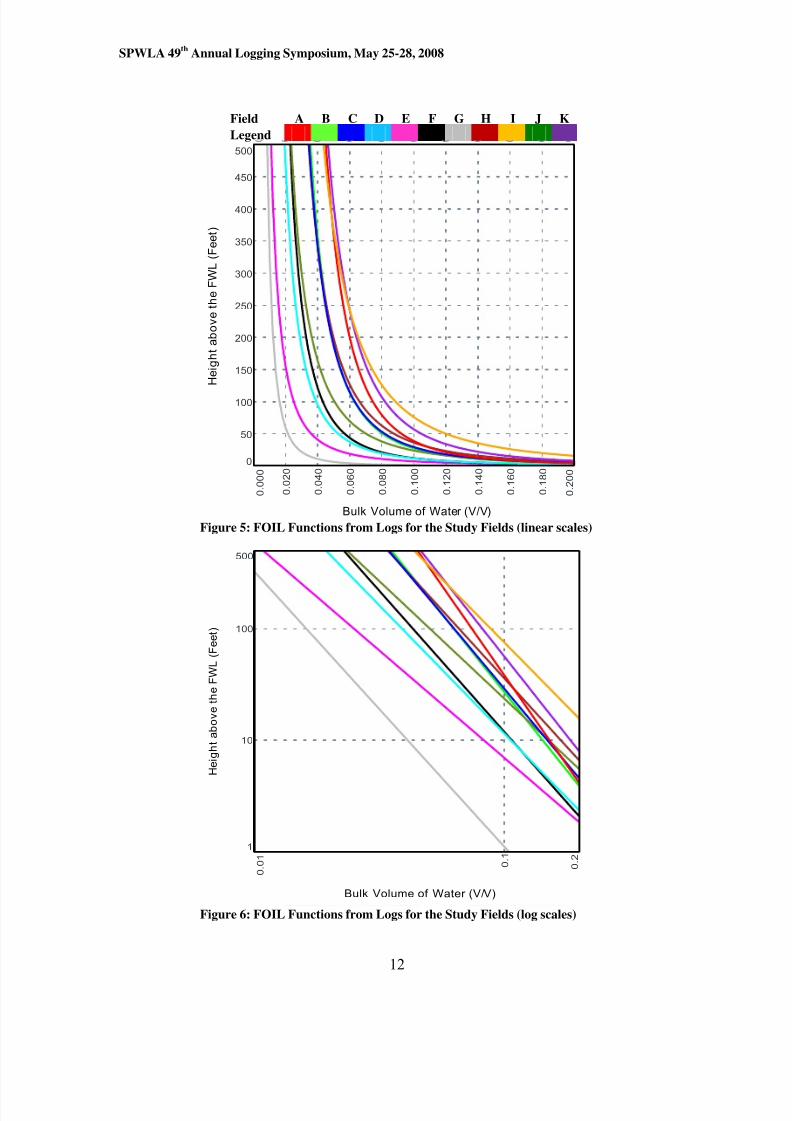
In order to compare the FOIL Functions between

fields they were recomputed using a common ‘b’value (slope). This was done by calculating the

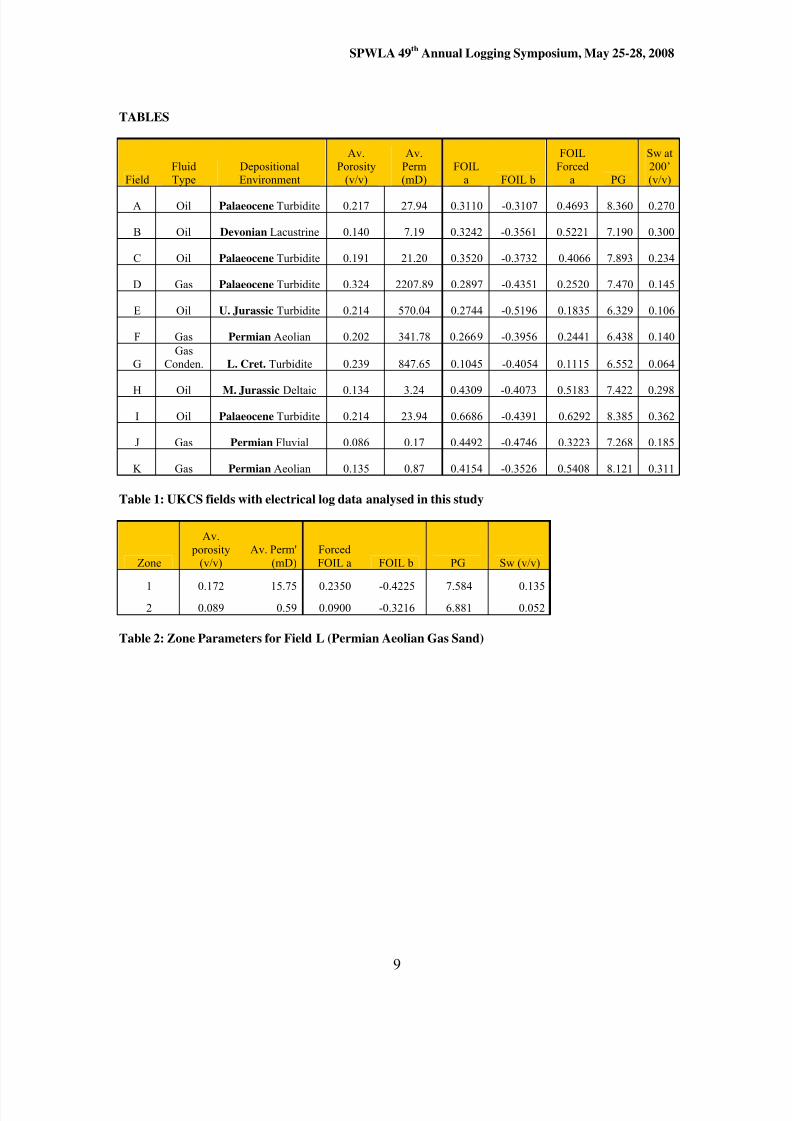
average ‘b’ value for the fields and using this to re-compute a forced regression ‘a’ value for each field

as listed in Table 1. The average ‘b’ value used was -

0.41. The ‘a’ value for each field calculated from the

average ‘b’ value is herein referred to as the forced’a’ value.

The ‘b’ of the FOIL Function is invariant to scale as it

is a dimensionless unit of measurement which is

consistent with the Leverett J-Function which itself is

dimensionless. Consequently, the same ‘b’ value is

calculated: regardless of whether the scale of the y-axis represents height (H) above the FWL in feet or

metres, or it represents capillary pressure (Pc).

Sensitivity analysis of Equation 5 confirmed that

BVW is largely independent of porosity and

 permeability for the typical porosity range seen in theeleven fields of Table 1. Equation 5 was shown to be

dependent on the reservoir parameters such as

hydrocarbon and water densities. However these

 parameters vary little in a given field.

RESERVOIR QUALITY

We define the ‘quality’ of a reservoir by its value ofwater saturation at a certain height above FWL and

given porosity: with lower Sw being considered betterquality reservoir. The computed water saturation

derived from the FOIL Function at 200’ above theFWL and assuming a porosity of 20 PU is listed for

each field in Table 1.

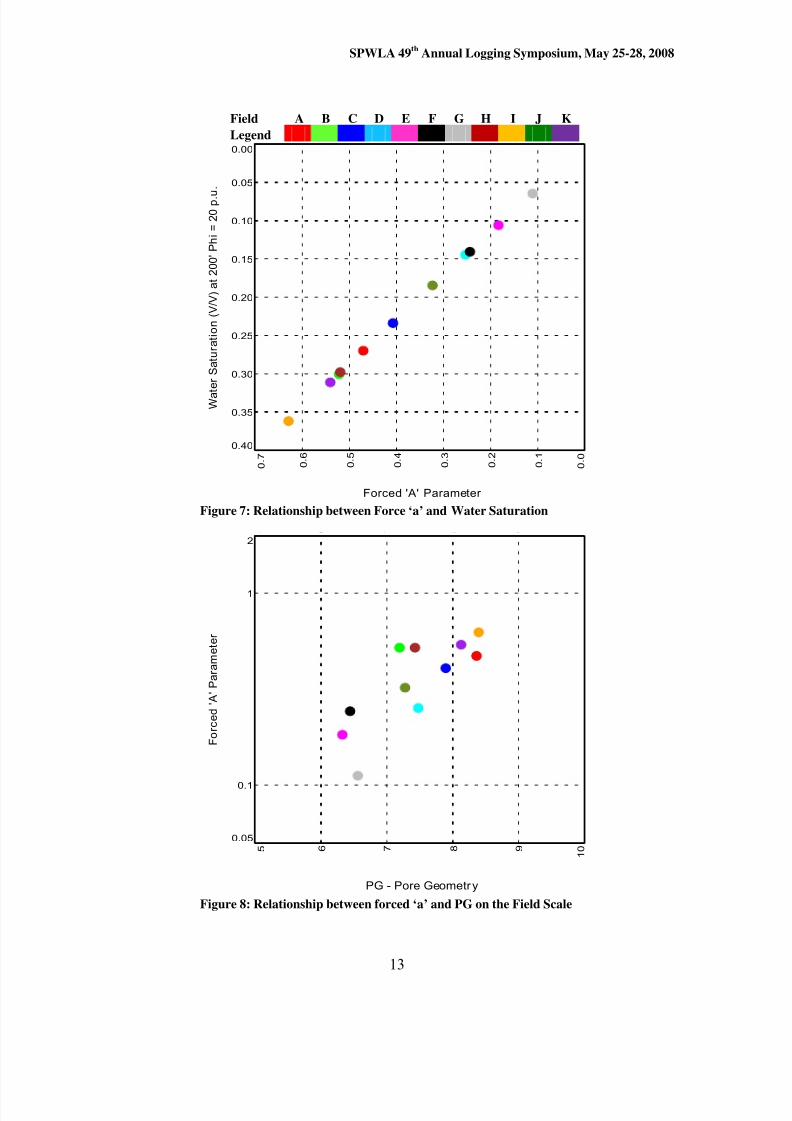
The quality of a reservoir can be defined by the value

of its forced ‘a’ parameter. Figure 7 shows reservoirquality increasing towards the top-right corner of the

cross-plot. Water saturations vary from 6 Saturation

Units (SU) in high quality reservoirs (Field G) to 36SU in low quality reservoirs (Field I). Notice that the

FOIL parameter ‘a’ varies much more between these

fields compared to the FOIL parameter ‘b’.

THE PORE GEOMETRY INDEX

We define the Pore Geometry (PG) Index as

Φ

−=

log

7log _ 

K  IndexPG   Equation 8

The PG Index is similar to (K/Ø)0.5  which Leverett

 proposed in 1941 with the dimension of mean pore

radius. The Leverett J-Function represents a sand pack as a bundle of capillary tubes with different pore

radii. Just as core plugs are a bundle of capillary tubes

with an average pore radius, hydrocarbon reservoirs

consist of a number of facies with different porosity-

 permeability characteristics. So long as these faciesare in communication, over geological time, the

whole reservoir can be considered as having a mean

 pore radius.

7/24/2019 Steve Cuddy Edinburgh Pore Geometry 2008

http://slidepdf.com/reader/full/steve-cuddy-edinburgh-pore-geometry-2008 5/16

SPWLA 49th

 Annual Logging Symposium, May 25-28, 2008

5

The constant ‘7’ was found to give the best

correlation coefficient between the values of PG

index and FOIL ‘a’ parameters from regression of log

and core data: respectively figures 8 and 11. This

constant is also a convenient scaling factor.

When the PG Index is a constant for a particular field,

Equation 4 shows that BVW is constant at givenvalue of height (H) above FWL. Therefore, any

formation with a similar PG Index will have

comparable BVW values for a given H and hencesimilar pore throat geometry. The PG Index is plotted

against the forced FOIL parameter ‘a’ in Figure 8.

Using PG to Understand Reservoir Quality

Figure 1 shows that Fields D and G have high

average porosity and permeability with Field D

having significantly better properties. Surprisingly,the computed water saturations are twice in Field D

compared to Field G, for the same height above theFWL and porosity. This can be explained by the

 better (lower) values of PG Index and forced FOIL‘a’ parameter for Field G.

The PG Index can also be used to explain the

apparent inconsistency seen in Field L. Two zones

that are thought not to be in communication have the porosity and permeability values shown in Table 2.

Zone 1 has much higher permeability and porositycompared to Zone 2. However, Zone 2 has lower

water saturations. This is explained by the PG Index

 being better (lower) in this zone.

Using PG to Predict Reservoir Permeability

Using the average ‘b’ value (-0.41), the forced ‘a’

 parameter can be determined by FOIL analysis ofelectrical logs. The forced ‘a’ parameter can provide

an estimate of the PG Index which in turn is related to

the average field permeability by using Equation 8.

Therefore, the PG Index allows the prediction of

reservoir mean permeability from electrical logs that

measure only porosity and water saturation.

Formation pressures and core are not required for thisgross field permeability estimate.

 Picking the FWL using the FOIL Function

The FWL can be determined from logs by plotting

BVW vs. true vertical depth sub sea (TVDSS) in log-log space and solving for the parameter ‘a’ and the

depth of the FWL. Only net data away from

conductive bed boundaries should be included.

Although the parameter ’b’ is not strictly a constant it

can be assumed to be -0.41 for this purpose. Solving

for two unknowns ‘a’ and FWL is more precise

compared to ‘a’, ‘b’ and FWL.

As the FOIL ‘a’ parameter represents the intercept of

the FOIL function with the y-axis, the FWL can be

determined from this intersect when the y-axis has theunits of TVDSS.

CORE ANALYSIS

The findings on the relationship between Bulk

Volume of Water (BVW) and Pore Geometry Index

(PG) derived from log data were validated by means

of core data. The database available included core porosity, permeability and capillary pressure (Pc)

measurements.

The study was focussed on 102 core plugs from six

reservoirs in the North Sea region. These represent avariety of depositional environments, including a

Permian Aeolian Sand, a Triassic Distal FluvialDelta, a Jurassic Marine Fan Conglomerate, two

Jurassic Shallow Marine Sands and a Palaeocene

Turbidite. The variety of lithological and textural

features made the database suitable for validation of

the method.

The database included all main types of core Pc

measurements: Air-Brine Porous Plate, Air-MercuryInjection and Air-Brine Centrifuge. All porosity and

 permeability measurements were executed at ambient

conditions. Similarly, all core Pc measurements wereconverted to Air-Brine Pc at laboratory conditions. In

addition all core data were quality controlled and poor

data discarded from the database.

The porous plate data was considered free of artefactsassociated with loss of capillary contact with the

 porous plate which can result in pessimistic water

saturation for a given capillary pressure. The ultra-centrifuge data was considered coherent and

consistent. All centrifuge capillary pressure data were

derived by modelling the raw production data. The

model employed for the datasets utilised appeared fit

for purpose. Mercury intrusion produces a verydetailed description of the capillary properties of a

 pore system, however, data derived from capillary

 pressures equivalent to greater than the maximum

reservoir closure are not relevant for saturation heightmodelling – these were excluded from the QC

dataset.

The QC core data at laboratory conditions were used

to generate cross-plots of Bulk Volume of Water vs.

7/24/2019 Steve Cuddy Edinburgh Pore Geometry 2008

http://slidepdf.com/reader/full/steve-cuddy-edinburgh-pore-geometry-2008 6/16

SPWLA 49th

 Annual Logging Symposium, May 25-28, 2008

6

Capillary Pressure (BVW vs. Pc) in log-log space.

Regressions were generated for 102 core plugs,

having all Pc values expressed in pounds per square

inch (psi). Figure 9 shows one core plug for each of

the six reservoirs. Figure 10 shows the results for all102 regressions.

The regressions provided the FOIL parameters foreach core plug: intercept ‘a’ and slope ‘b’. Also,

 porosity and permeability measurements on each core

 plug allowed the evaluation of the PG index, asdefined in Equation 8. As a result, values of FOIL

 parameters ‘a’ and ‘b’ were compared to values of PG

for 102 core plugs. Figures 11 and 12 show the cross-

 plots used for such comparisons.

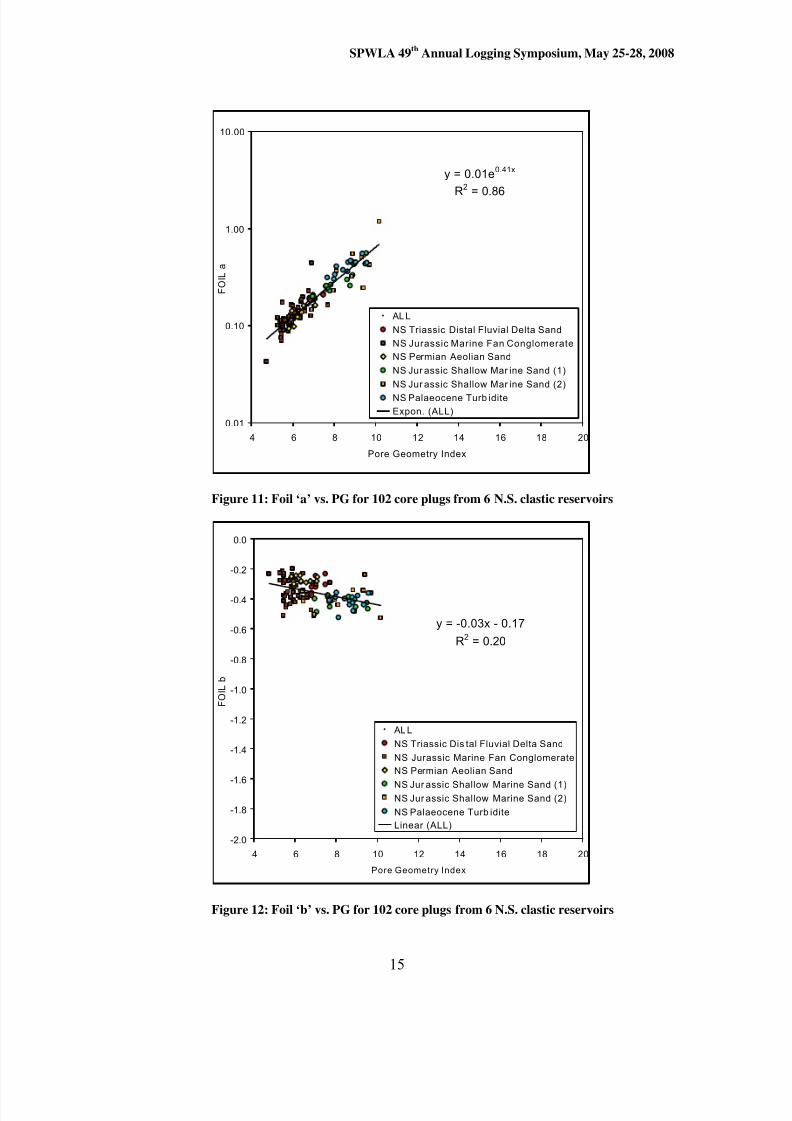
The cross-plot of Figure 11 shows the FOIL ‘a’

 parameter to be a consistent function of the Pore

Geometry (PG) index: over a large range of ‘a’ values(0.1-1). The regression shows a high correlation

coefficient (R 2=0.86) and provides a useful functionapplicable to a variety of clastic reservoir rocks and

depositional environments.

The applications of the correlations between the PG

index and the FOIL ‘a’ and ‘b’ parameters are

important. Figure 13 shows the results of a ‘blind

test’ done to verify the method. In this example core porosity, permeability and Pc data were available

from one well (Well X) and wireline logs plus core

 porosity and permeability were available from asecond well (Well Y). Both wells encountered the

same reservoir facies: Permian Aeolian Sand.

The core data available from Well X were used to predict permeability in Well Y. The method is

described here briefly and details are provided in

Appendix 1. As a first step, the core data from Well X

were used to derive the FOIL function’s parameters‘a’ and ‘b’ plus the function relating ‘a’ to the PG

index. As a second step, the FOIL function was used

to calculate a continuous ‘a’ profile in Well Y usingthe BVW profile calculated from logs.

The continuous ‘a’ profile was converted to

continuous PG and then to a continuous permeability

 profile, using total porosity computed from logs.Tracks 5 and 6 in Figure 13 show the comparison

 between predicted continuous permeability (K_PG)

and core permeability (PERM_CORE) in logarithmic

and linear scales respectively. An excellent match between the two set of data is observed over most of

the hydrocarbon column, except for the top and basewhere the resistivity log is affected by polarization

effects (highly deviated well).

The comprehensive core database also allowed the

investigation of the correlation between the FOIL ‘b’

 parameter and PG. Figure 12 shows such a

correlation, where ‘b’ exhibits a narrow range of

values: (-0.2 to -0.6). The FOIL ‘b’ parameter wasfound to have a median (P50) value equal to -0.37,

with an uncertainty range of ±37%. Despite its low

correlation coefficient (R 2=0.20), the regression onthe cross-plot of Figure 12 provides a means of

estimating ‘b’ from the Pore Geometry (PG) index.

The functions obtained from Figures 11 and 12

 provide a means of estimating the FOIL parameters

‘a’ and ‘b’ from conventional (lab) core porosity and

 permeability.

In conclusion, the analysis of core data supports the

findings from logs. The strong correlation between

FOIL ‘a’ and PG was confirmed to be consistent for avariety of depositional environments. The range of

values of the FOIL ‘b’ parameter was confirmed to benarrow, with a median value of -0.37, very close to

the average value derived from logs (-0.41).

The availability of core porosity, permeability and Pc

data allows the identification of field specific

functions: ‘a’=f(PG) and ‘b’=f(PG). These provide a

reliable link between SwH height and porosity- permeability, with important applications for

saturation-height and permeability modelling. Ideally

every reservoir facies should be characterised with itsown ‘a’, ‘b’ and PG parameters.

Two functions were derived from regressions on coredata from a variety of clastic fields:

PGea41.001.0   ⋅=   Equation 9

and

17.003.0   −−= PGb   Equation 10 

These equations are applicable to a variety of North

Sea clastic reservoirs and can be used to calculate preliminary saturation-height functions in absence of

core Pc data using just conventional core porosity and permeability. They provide values of ‘a’ and ‘b’ thatare applicable to FOIL functions where BVW is

expressed as a function of capillary pressure at

standard (lab) conditions and in psi units. Conversely,

they could be used to estimate permeability if the

FOIL parameters were known and a porosity profilewas available from logs.

7/24/2019 Steve Cuddy Edinburgh Pore Geometry 2008

http://slidepdf.com/reader/full/steve-cuddy-edinburgh-pore-geometry-2008 7/16

SPWLA 49th

 Annual Logging Symposium, May 25-28, 2008

7

Amaefule (1988) developed a method for identifying

and characterising formation zones having similar

hydraulic characteristics. The technique is based on a

modified Kozeny-Carman relationship and the

concept of mean hydraulic radius. Amaefule proposed a parameter called the flow zone indicator

(FZI) which has many useful applications in

formation evaluation. FZI was calculated for each ofthe core database elements and reviewed for

correlations with the FOIL function exponents.

Although correlations exist, the PG Index produced better correlations with respect to modelling

saturation height behaviour in the transition zone, the

objective of this study.

The core analysis focused on a variety of clastic North Sea fields that exhibit a range of poroperm,

depositional environment and geological age.

Preliminary work on a North African fluvial-glacialsands and Saudi dolomites suggest that they may also

follow the same trend especially for PG and the FOIL‘a’ parameter.

CONCLUSIONS

This study investigated electrical logs and core data

from fifteen North Sea clastic fields with different

 porosity and permeability characteristics, depositionalenvironments and geological age. The overall

objective was to understand how reservoir parameters

determine the shape of the transition zone.

The FOIL Function was found to be a simple but

robust SwH function that allows an accuratedetermination of hydrocarbons initially in place.Based on log or core data, it does not require

 permeability or knowledge of Leverett J parameters at

reservoir conditions.

Comparison of the Leverett J-Function with the FOIL

Function (equation 1) showed that most of the

reservoir parameters relating to rock quality andreservoir fluids are in the FOIL ‘a’ constant.

The ‘b’ constant was found to be a function of pore

geometry, but to a much lesser extent than the ‘a’

constant. Observation of the reservoirs in this studysuggest that ‘b’ is similar between fields and the

shape of the transition zone described by the SwH

Function is controlled almost entirely by the single

constant ‘a’. This was confirmed from core data.

The ‘b’ constant is independent of scale and is thesame whether it is derived from core plugs, electrical

logs or on the field scale. Consequently the median

value of the ‘b’ constant derived from core data can

 be used for the computation of the forced ‘a’ constant

from logs. This is believed to be more accurate than

the average ‘b’ value derived from log data.

Observations of thin sections indicate that the FOILfunction is dependent on the geometry of the pore

throats; wide non-tortuous short pore pathways with

little flow impeding mineralogy produce the bestquality FOIL shape as determined by the constant ‘a’.

The constant ‘a’ is found to be predominantlydependent on reservoir pore geometry and explains

how the water saturation is a function of connectivity

as well as porosity and height above the FWL.

Analysis confirmed that the pore geometry has a

major influence on the shape of the transition zone.

As the FOIL ‘a’ parameter represents the intercept of

the FOIL function with the y-axis in log-log space, itsdependence on scale confirms that the FWL can be

determined from this intersect when the y-axis has theunits of true vertical depth subsea (TVDSS). If ’b’ is

assumed to be relatively constant then the picking ofthe FWL is more precise with only 2 unknowns.

Therefore the revised SwH function provides a robust

method for picking the FWL even in fields where it is

unclear or was not penetrated.

One method of defining the ‘quality’ of a reservoir is

the value of water saturation at a known porosity and

height above FWL, where the lower the Sw the better.The quality of reservoirs can be compared through the

comparison of FOIL ‘a’ values.

A new Pore Geometry (PG) Index is proposed that

correlates to the FOIL ‘a’ constant. This index can be

used to make predictions about the quality of pore

geometry within a reservoir and the shape of the SwH

Function. This PG Index is successful in explaininghow fields with very different porosity and

 permeability can have very similar SwH functions

and why poorer quality reservoir intervals do notnecessarily have higher water saturations.

The PG Index depends upon the ‘mean pore radius’

of the reservoir and is a single value for the field

 provided it has been in pressure/fluid communicationover geological time. The PG Index has been shown

here to be a useful tool for predicting the shape of the

transition zone as a function of average porosity and

 permeability in the reservoir.

The investigation of core data convincingly supportsthe findings obtained from logs. The strong

correlation between FOIL ‘a’ and the PG Index was

confirmed to be consistent for a variety of

7/24/2019 Steve Cuddy Edinburgh Pore Geometry 2008

http://slidepdf.com/reader/full/steve-cuddy-edinburgh-pore-geometry-2008 8/16

SPWLA 49th

 Annual Logging Symposium, May 25-28, 2008

8

depositional environments. Also, the range of values

for the FOIL ‘b’ parameter was found to be very close

to the range of values obtained from electrical logs.

Using an average FOIL ‘b’ parameter the PG Indexallows the prediction of reservoir mean permeability

from electrical logs that measure only porosity and

water saturation. Formation pressures and core are notrequired for this gross permeability estimate for the

field. Conversely, this research provides a means of

estimating the FOIL shape of the transition zone from porosity and permeability in the absence of Pc data.

Preliminary work on a North African fluvio-glacial

sand and a Saudi dolomite suggests that they follow

the same trend for the PG Index and the FOIL ‘a’ parameter.

ACKNOWLEDGEMENTS

The Authors would like to thank Helix RDS for theuse of their data and resources, and also to the

University of Aberdeen, Geology Department, fortheir guidance.

REFERENCES

AMABEOKU, M.O. et al., 2005. Incorporating

hydraulic units concepts in saturation-height

modelling in a gas field: 2005 SPE Asia Pacific Oiland Gas Conference – Proceeding, pp. 609.

AMAEFULE J.O. et al., 1993 – Enhanced reservoirdescription: using core and log data to identifyhydraulic (flow) units and predict permeability in

uncored intervals/wells: SPE 68th  Annual technical

Conference, Houston, Texas 3-6 October 1993.

CUDDY, S., 1993. The FOIL function - a simple,

convincing model for calculating water saturations in

Southern North Sea gas fields: Transactions of the34th Annual Logging Symposium of the Society of

Professional Well Log Analysts, H1-17, Calgary,

Canada., 1993, BP Exploration.

LEVERETT, M.C., Capillary behaviour in poroussolids: Trans AIME (1941), Vol. 142.

WORTHINGTON, P.F., LOVELL, M. and

PARKINSON, N., 2002, Application of saturation-height functions in integrated reservoir description:

AAPG Methods in Exploration Series, 13, pp. 89.

ABOUT THE AUTHORS

Dean Gagnon is Geoscientist with Nexen Petroleum

UK Ltd. and holds a M.Sc.in Integrated Petroleum

Geoscience from Aberdeen University. Before joining Nexen he worked with a CBM Solutions Ltd. and

Tahera Corporation.

Steve Cuddy is a Principal Petrophysicist with Helix

RDS and holds a Ph.D. in Petrophysics from

Aberdeen University. Before joining Helix RDS heworked for Schlumberger and BP for 10 and 15 year

respectively.

Fabrizio Conti is the Petrophysics Team Leader for

Helix RDS and holds a B.Sc. in Geology from MilanUniversity. Before joining Helix RDS he worked for

Schlumberger and ENI UK Ltd.

Craig Lindsay is Principal Core Specialist with Helix

RDS and holds a B.Sc. in Geology from LiverpoolUniversity. Before joining Helix RDS he worked for

Core Laboratories Ltd. and Gearhart Industries.

NOMENCLATURE AND DEFINITIONS

BVW Bulk volume of water (v/v).The product of Sw and Phi.

FOIL SwH function describing a variation of the

free oil (gas) with heightFWL Free water level (feet).

Depth of zero capillary pressure

FZI Flow zone indicatorH Height above the FWL (feet)Pc Capillary pressure (psi)

PG Pore Geometry Index

Phi Effective Porosity (PU)

Sw Water saturation (SU)SwH Water saturation vs. height function

7/24/2019 Steve Cuddy Edinburgh Pore Geometry 2008

http://slidepdf.com/reader/full/steve-cuddy-edinburgh-pore-geometry-2008 9/16

SPWLA 49th

 Annual Logging Symposium, May 25-28, 2008

9

TABLES

FieldFluidType

DepositionalEnvironment

Av.Porosity

(v/v)

Av.Perm(mD)

FOILa FOIL b

FOILForced

a PG

Sw at200’(v/v)

A Oil Palaeocene Turbidite 0.217 27.94 0.3110 -0.3107 0.4693 8.360 0.270

B Oil Devonian Lacustrine 0.140 7.19 0.3242 -0.3561 0.5221 7.190 0.300

C Oil Palaeocene Turbidite 0.191 21.20 0.3520 -0.3732 0.4066 7.893 0.234

D Gas Palaeocene Turbidite 0.324 2207.89 0.2897 -0.4351 0.2520 7.470 0.145

E Oil U. Jurassic Turbidite 0.214 570.04 0.2744 -0.5196 0.1835 6.329 0.106

F Gas Permian Aeolian 0.202 341.78 0.2669 -0.3956 0.2441 6.438 0.140

GGas

Conden. L. Cret. Turbidite 0.239 847.65 0.1045 -0.4054 0.1115 6.552 0.064

H Oil M. Jurassic Deltaic 0.134 3.24 0.4309 -0.4073 0.5183 7.422 0.298

I Oil Palaeocene Turbidite 0.214 23.94 0.6686 -0.4391 0.6292 8.385 0.362

J Gas Permian Fluvial 0.086 0.17 0.4492 -0.4746 0.3223 7.268 0.185

K Gas Permian Aeolian 0.135 0.87 0.4154 -0.3526 0.5408 8.121 0.311

Table 1: UKCS fields with electrical log data analysed in this study

Zone

Av.

 porosity(v/v)

Av. Perm'

(mD)

Forced

FOIL a FOIL b PG Sw (v/v)

1 0.172 15.75 0.2350 -0.4225 7.584 0.135

2 0.089 0.59 0.0900 -0.3216 6.881 0.052

Table 2: Zone Parameters for Field L (Permian Aeolian Gas Sand)

7/24/2019 Steve Cuddy Edinburgh Pore Geometry 2008

http://slidepdf.com/reader/full/steve-cuddy-edinburgh-pore-geometry-2008 10/16

SPWLA 49th

 Annual Logging Symposium, May 25-28, 2008

10

FIGURES

Field A B C D E F G H I J K

Legend

       0 .

       0       0

       0 .

       0      5

       0 .

       1       0

       0 .

       1      5

       0 .

       2       0

       0 .

       2      5

       0 .

       3       0

       0 .

       3      5

0.01

0.1

1

10

100

1000

10000

   P  e  r  m  e  a   b   i   l   i   t  y   (  m   D   )

Porosity (V/V) 

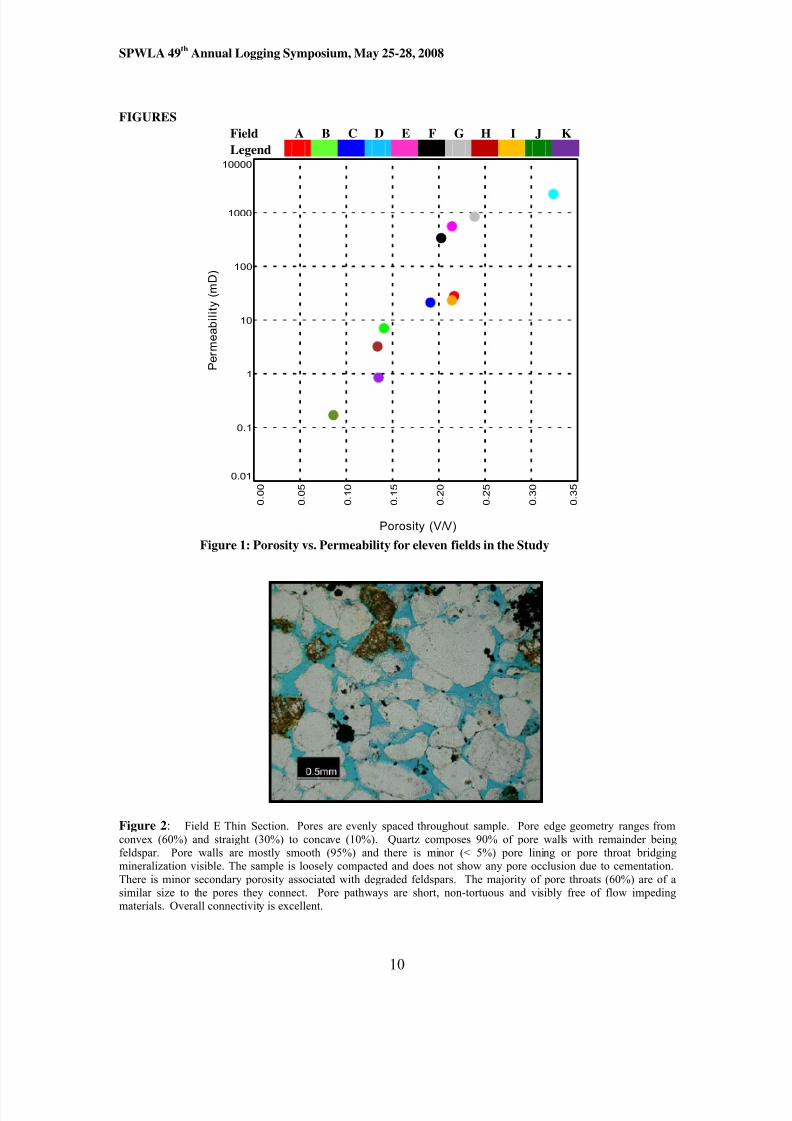
Figure 1: Porosity vs. Permeability for eleven fields in the Study

Figure 2: Field E Thin Section. Pores are evenly spaced throughout sample. Pore edge geometry ranges from

convex (60%) and straight (30%) to concave (10%). Quartz composes 90% of pore walls with remainder beingfeldspar. Pore walls are mostly smooth (95%) and there is minor (< 5%) pore lining or pore throat bridgingmineralization visible. The sample is loosely compacted and does not show any pore occlusion due to cementation.

There is minor secondary porosity associated with degraded feldspars. The majority of pore throats (60%) are of asimilar size to the pores they connect. Pore pathways are short, non-tortuous and visibly free of flow impedingmaterials. Overall connectivity is excellent. 

7/24/2019 Steve Cuddy Edinburgh Pore Geometry 2008

http://slidepdf.com/reader/full/steve-cuddy-edinburgh-pore-geometry-2008 11/16

SPWLA 49th

 Annual Logging Symposium, May 25-28, 2008

11


Figure 3:  Field F Thin Section. Visible porosity is dominated by primary intergranular pores (13.5%) with minor

secondary dissolution pores (2.0%). Primary pores are large and well connected and there is consistent pore distributionthroughout the sample. There are very few simple geometric pore shapes (10%), most pores have complex shapes(98%) and are joined together via short pore throats that are often only slightly smaller in diameter than the maximum

dimension of the adjoining pore. They are mostly clay free, smooth walled and free of blocky authigenic cements.Pore lining ferroan dolomite rhombs are the only obstacles to fluid flow. Secondary pores are associated with degradedK-feldspar and rock fragments. Secondary porosity is often isolated due to relic grain boundaries being coated by k-feldspar or clay. Trace microporosity is associated with kaolinite and illite. 

Figure 4:  Field K Thin Section. Most pores have complex shapes (63%) with the remainder having simple

geometric shapes (37%). Pore edge geometry ranges from convex (50%) and straight (30%) to concave (20%). Pore

walls are rough (95%) and there is abundant pore lining and pore throat bridging mineralization. The majority of pore

throats (95%) have a much smaller diameter than the adjoining pores. Pores are contained within isolated groups. Poregroups have good internal connectivity; however connectivity between groups is via long tortuous pathways.

7/24/2019 Steve Cuddy Edinburgh Pore Geometry 2008

http://slidepdf.com/reader/full/steve-cuddy-edinburgh-pore-geometry-2008 12/16

SPWLA 49th

 Annual Logging Symposium, May 25-28, 2008

12

Field A B C D E F G H I J K

Legend

   0 .   0

   0   0

   0 .   0

   2   0

   0 .   0

   4   0

   0 .   0

   6   0

   0 .   0

   8   0

   0 .   1

   0   0

   0 .   1

   2   0

   0 .   1

   4   0

   0 .   1

   6   0

   0 .   1

   8   0

   0 .   2

   0   0

0

50

100

150

200

250

300

350

400

450

500

   H  e   i  g   h   t  a   b  o  v  e   t   h  e   F   W   L   (   F  e  e   t   )

Bulk Volume of Water (V/V)  Figure 5: FOIL Functions from Logs for the Study Fields (linear scales)

       0 .

       0       1

       0 .

       1

       0 .

       2

1

10

100

500

   H  e   i  g   h   t  a   b  o  v  e   t   h  e   F   W   L   (   F  e  e   t   )

Bulk Volume of Water (V/V) 

Figure 6: FOIL Functions from Logs for the Study Fields (log scales)

7/24/2019 Steve Cuddy Edinburgh Pore Geometry 2008

http://slidepdf.com/reader/full/steve-cuddy-edinburgh-pore-geometry-2008 13/16

SPWLA 49th

 Annual Logging Symposium, May 25-28, 2008

13

Field A B C D E F G H I J K

Legend

       0 .

       0

       0 .

       1

       0 .

       2

       0 .

       3

       0 .

       4

       0 .

      5

       0 .

       6

       0 .

      7

0.00

0.05

0.10

0.15

0.20

0.25

0.30

0.35

0.40

   W  a   t  e  r   S  a   t  u  r  a   t   i  o  n   (   V   /   V   )  a   t   2   0   0   '    P   h   i  =   2   0  p .  u .

Forced 'A' Parameter  

Figure 7: Relationship between Force ‘a’ and Water Saturation

      5   6 7 8 9       1       0

0.05

0.1

1

2

   F  o  r  c  e   d   '   A   '    P  a  r  a  m  e   t  e  r

PG - Pore Geometry 

Figure 8: Relationship between forced ‘a’ and PG on the Field Scale

7/24/2019 Steve Cuddy Edinburgh Pore Geometry 2008

http://slidepdf.com/reader/full/steve-cuddy-edinburgh-pore-geometry-2008 14/16

SPWLA 49th

 Annual Logging Symposium, May 25-28, 2008

14

0.10

1.00

10.00

100.00

1000.00

0.010 0.100 1.000

Bulk Volume of Water [v/v]

   C  a  p   i   l   l  a  r  y   P  r  e  s  s  u  r  e   [  p  s   i   ]

NS Triassic Distal Delta Sand

NS Jurassic Marine Fan Conglomerate

NS Permian Aeolian Sand

NS Jurassic Shallow Marine Sand (1)

NS Jurassic Shallow Marine Sand (2)

NS Palaeocene Turbidite


Figure 9: BVW vs. Pc for 6 Core Plugs from 6 different N.S. clastic reservoirs

1

10

100

1000

0.01 0.1 1

Bulk Volume of Water [v/v]

   C  a  p   i   l   l  a  r  y   P  r  e  s  s  u  r  e   [  p  s   i   ]


Figure 10: BVW vs. Pc for 102 Core Plugs from 6 different N.S. clastic reservoirs

7/24/2019 Steve Cuddy Edinburgh Pore Geometry 2008

http://slidepdf.com/reader/full/steve-cuddy-edinburgh-pore-geometry-2008 15/16

SPWLA 49th

 Annual Logging Symposium, May 25-28, 2008

15

y = 0.01e0.41x

R

2

 = 0.86

0.01

0.10

1.00

10.00

4 6 8 10 12 14 16 18 20

Pore Geometry Index

   F   O   I   L

  a

 ALL

NS Triassic Distal Fluvial Delta Sand

NS Jurassic Marine Fan Conglomerate

NS Permian Aeolian Sand

NS Jur assic Shallow Mar ine Sand (1)

NS Jur assic Shallow Mar ine Sand (2)

NS Palaeocene Turb idite

Expon. (ALL)


Figure 11: Foil ‘a’ vs. PG for 102 core plugs from 6 N.S. clastic reservoirs

y = -0.03x - 0.17

R2 = 0.20

-2.0

-1.8

-1.6

-1.4

-1.2

-1.0

-0.8

-0.6

-0.4

-0.2

0.0

4 6 8 10 12 14 16 18 20

Pore Geometry Index

   F   O   I   L

   b

 ALL

NS Triassic Dis tal Fluvial Delta Sand

NS Jurassic Marine Fan Conglomerate

NS Permian Aeolian Sand

NS Jur assic Shallow Marine Sand (1)NS Jur assic Shallow Marine Sand (2)

NS Palaeocene Turb idite

Linear (ALL)


Figure 12: Foil ‘b’ vs. PG for 102 core plugs from 6 N.S. clastic reservoirs

7/24/2019 Steve Cuddy Edinburgh Pore Geometry 2008

http://slidepdf.com/reader/full/steve-cuddy-edinburgh-pore-geometry-2008 16/16

SPWLA 49th

 Annual Logging Symposium, May 25-28, 2008

16


Figure 13: Permeability prediction in Well Y using Pc data from offset Well X 

APPENDIX 1

Details of Permeability prediction in Well Y using Pc data from offset Well X (Figure 13)

Step 1 Core porosity, permeability and Pc from well X were used to derive the functions:

BVW=0.135*(Pclab)^(-0.275) the FOIL Function with Pclab in [psi] and

a=0.01*e^(0.41*PG) the relationship between ‘a’ and PG.

The FOIL Function was used to calculate the Sw profile named ‘SWE_PC_OFF’ in well Y, to be

compared to the Sw profile from the Archie equation (SWE):SWE_PC_OFF=[0.135*(H*0.42*72/50)^(-0.275)]/PHIE

Where: H = height above FWL [ft], 0.42 = differential fluid gradient [psi/ft], 72/50 = conversion

factor from gas/brine at reservoir conditions to air/brine at lab conditions and PHIE = continuous

effective porosity calculated from logs in well Y.

Step 2 The FOIL Function was used to solve a continuous ‘a’ profile (not displayed in Fig. 13) in well Yusing BVW calculated from logs (BVW=SWE*PHIE) as input:

a=BVW*(H*0.42*72/50)^0.275

Step 3 Function ‘a’=f(PG) from step 1 was re-arranged to solve PG (not displayed in Fig. 13) in well Y:

PG=ln(a/0.01)/0.41.

Step 4 Equation 8 was used to solve for continuous permeability using the continuous PG (from Step 3)

and total porosity calculated from logs (curve PHIT) as input: K_PG=10^(PG*log10(PHIT)+7).


Recommended