SEISMIC STABILITY EVALUATIONS OF CHESBRO, LENIHAN, STEVENS CREEK, AND UVAS DAMS (SSE2) PHASE A: STEVENS CREEK AND LENIHAN DAMS STEVENS CREEK DAM ENGINEERING ANALYSES (REPORT No. SC-3) Prepared for SANTA CLARA VALLEY WATER DISTRICT 5750 Almaden Expressway San Jose, CA 95118 December 2012
Transcript
SEISMIC STABILITY EVALUATIONS OF CHESBRO, LENIHAN, STEVENS CREEK, AND UVAS DAMS
(SSE2)
PHASE A: STEVENS CREEK AND LENIHAN DAMS
STEVENS CREEK DAM ENGINEERING ANALYSES (REPORT No. SC-3)
Prepared for
SANTA CLARA VALLEY WATER DISTRICT 5750 Almaden Expressway San Jose, CA 95118
1.1 General ..................................................................................................... 1-1 1.2 Purpose and Scope of Engineering Analyses ........................................... 1-1 1.3 Organization of Document ....................................................................... 1-1
SECTION 2 SUMMARY OF SITE CHARACTERIZATION .................................................................. 2-1
2.1 General ..................................................................................................... 2-1 2.2 Geometry of Dam Embankment and Dam Foundation ........................... 2-1
2.2.1 Dam Embankment ................................................................................. 2-1 2.2.2 Dam Foundation .................................................................................... 2-2
2.3 Dam Zoning ............................................................................................. 2-3 2.4 Properties of Embankment Materials....................................................... 2-3
2.4.1 Classification and Index Properties ....................................................... 2-3 2.4.2 Engineering Properties ........................................................................... 2-4
2.5 Properties of Alluvium ............................................................................. 2-5 2.5.1 Classification and Index Properties ....................................................... 2-5 2.5.2 Engineering Properties ........................................................................... 2-5
3.1 General ..................................................................................................... 3-1 3.2 Piezometer Measurements at Stevens Creek Dam................................... 3-2 3.3 Results of Seepage Analyses ................................................................... 3-2
SECTION 4 STATIC STABILITY AND PSEUDO-STATIC YIELD ACCELERATION ......................... 4-1
4.1 General ..................................................................................................... 4-1 4.2 Input Parameters ...................................................................................... 4-1 4.3 Results of Analyses .................................................................................. 4-2
5.6.1 Results of Seismic Deformation Analyses ............................................. 5-5 5.6.2 Assessment of Analyses Results and Dam Performance ....................... 5-7
TABLE OF CONTENTS
SSE2 Rpt SC-3 Final.docx ii
SECTION 6 SUMMARY AND CONCLUSIONS ................................................................................... 6-1
6.1 General ..................................................................................................... 6-1 6.2 Site Characterization, Material Properties and Ground Motions ............. 6-1 6.3 Seepage Analyses..................................................................................... 6-2 6.4 Static Stability and Pseudo-Static Yield Accelerations ........................... 6-2 6.5 Seismic Deformation Analyses ................................................................ 6-2 6.6 Conclusions .............................................................................................. 6-3 6.7 Recommendations .................................................................................... 6-4
2-1 Index Properties of Embankment and Foundation Materials
2-2 Engineering Properties of Embankment and Foundation Materials
5-1A Characteristics of Selected Earthquake Records for Stanford-Monte Vista Event
5-1B Characteristics of Selected Earthquake Records for San Andreas Event
5-2 Summary of Calculated Deformations
Figures
2-1 Regional Site Location Map
2-2 Footprint and Section Locations
2-3 Representative Cross Sections
2-4 Estimated Thickness of Soils Left in Place
2-5 Cross Sections Showing Dam Zoning
2-6 Modulus Reduction and Damping Ratio, Embankment
2-7 Modulus Reduction and Damping Ratio, Alluvium
2-8 Spectrally Matched Kobe E/Q, Nishi-Akashi (FN) Record
2-9 Spectrally Matched Loma Prieta E/Q, LGPC (FN) Record
2-10 Spectrally Matched Northridge E/Q, Sylmar County Hosp. (FN) Record
2-11 Spectrally Matched Manjil E/Q, Abbar (FN) Record
2-12 Spectrally Matched Chi Chi E/Q, TCU065 (FN) Record
2-13 Spectrally Matched Landers E/Q, Lucerne (FN) Record
3-1 Locations of Piezometers at Station 7+50
3-2 Measured Piezometric Heads
TABLE OF CONTENTS
SSE2 Rpt SC-3 Final.docx iii
3-3 Results of PLAXIS Seepage Analyses
3-4 Calculated vs. Measured Groundwater Levels in Alluvium
3-5 Pore Pressure Contours from Seepage Analyses
4-1 Calculated Shear Strength
4-2 Results of Static Stability Analyses
4-3 Results of Pseudo-Static Stability Analyses
5-1 Schematic of Liquefaction Model
5-2 Dam Zoning at Maximum Cross Section
5-3 Maximum Section Zoning and FLAC Mesh
5-4 Shear Modulus Reduction and Damping Curves
5-5 Residual Strength Relationships
5-6 Recommended Values of (N1)60 and Residual Shear Strength
5-7 Response Spectra for Evaluation Ground Motions
5-8 Time Histories and Response Spectra of SMV1 Kobe
5-9 QUAD4MU vs FLAC Response Spectra for SMV1 Kobe
5-10 Calculated Displacements for (N1)60 = 20 and Case SMV1
5-11 Displacement Vectors for (N1)60 = 20 and Case SMV1
5-12 Calculated Displacements for (N1)60 = 25 and Case SMV1
5-13 Displacement Vectors for (N1)60 = 25 and Case SMV1
5-14 Deformation Time History for Case SMV1
5-15 Newmark Displacements
5-16 Longitudinal Section along New Crest
5-17 Changes in Horizontal Effective Stress for Case SMV1
5-18 Cross Section with Zone of Concern
Appendix
Detailed Results of FLAC Analyses
SECTION 1.0 INTRODUCTION
SSE2 Rpt SC-3 Final.docx 1-1x
1. Section 1 Introduction
1.1 GENERAL
In May 2010, the Santa Clara Valley Water District (District) retained Terra / GeoPentech (TGP), a joint venture of Terra Engineers, Inc. and GeoPentech, Inc., to complete seismic stability evaluations of Chesbro, Lenihan, Stevens Creek and Uvas Dams. These evaluations were required by the Division of Safety of Dams (DSOD) in June 2008 as part of their Phase III screening process of the State’s dams located in highly seismic environments. The evaluations are also a vital part of the District’s Dam Safety Program (DSP). Phase A of the project includes work on Stevens Creek and Lenihan Dams and has a planned completion date of 2012. Phase B of the project includes work on Chesbro and Uvas Dams and is scheduled to begin in 2012 and to finish by the end of 2013. The general scope of the project consists of the field, laboratory, and office studies required to evaluate the seismic stability of the four referenced dams.
This document contains the results of our engineering analyses at Stevens Creek Dam based on the results of our site characterization at the dam that is documented in Report No. SC-2 (Terra / GeoPentech, 2012b). A summary of the relevant information contained in Report No. SC-2 is included hereinafter for completeness but the reader should refer to the referenced report for details of the site characterization, material properties, and site-specific ground motions.
1.2 PURPOSE AND SCOPE OF ENGINEERING ANALYSES
The purpose of the engineering analyses is to evaluate the seismic stability of the dam during the Maximum Credible Earthquake (MCE) and to assess the seismic deformations of the structure as a result of the MCE. To that end, the scope of the analyses included the following:
1. seepage analyses to establish total heads and pore pressures associated with steady state seepage;
2. static and pseudo-static stability analyses; and
3. non-linear dynamic analyses of seismic deformations.
1.3 ORGANIZATION OF DOCUMENT
This document contains seven sections, including this introduction. Section 2.0 provides a summary of the relevant information derived from the site characterization effort documented in Report No. SC-2. Section 3.0 documents the results of the seepage analyses and Section 4.0 presents the results of the static stability analyses and the pseudo-static yield acceleration. Section 5.0 describes the methodology used in the seismic deformation analyses and discusses the results of these analyses. Section 6.0 provides a summary of the key findings and presents recommendations based on the results of the seismic stability evaluation of the dam. Section 7.0 is a list of references. The appendix to the report contains details of the results of the non-linear seismic deformations analyses discussed in Section 5.0.
SECTION 2.0 SUMMARY OF SITE CHARACTERIZATION
SSE2 Rpt SC-3 Final.docx 2-1x
2. Section 2 Summary of Site Characterization
2.1 GENERAL
This section provides a summary of the information and data contained in Report No. SC-2 on Site Characterization, Material Properties, and Ground Motions (Terra / GeoPentech, 2012b) that are most relevant to the engineering analyses of the dam. This summary is included herein for completeness and ease of reference but the reader is referred to Report No. SC-2 for additional details.
Stevens Creek Dam is located in Santa Clara County, California, about 1 mile southwest of Monta Vista section of Cupertino, as shown on Figure 2-1. The dam is an earthfill structure that was constructed across Stevens Creek in 1935. Major modifications were made in 1986 to address seismic stability and spillway capacity issues, as discussed later in this section. The dam impounds Stevens Creek Reservoir that has a maximum capacity of 3,138 acre-feet at the nominal spillway elevation of 537.8 feet1.
Appurtenant structures include a broad-crested concrete-lined side-channel spillway located in the right abutment, an outlet conduit beneath the dam embankment connected to an inlet structure in the reservoir, on the right side of the streambed, and an outlet structure that allows reservoir water to discharge into Stevens Creek approximately 50 feet beyond the toe of the dam.
2.2 GEOMETRY OF DAM EMBANKMENT AND DAM FOUNDATION
2.2.1 Dam Embankment
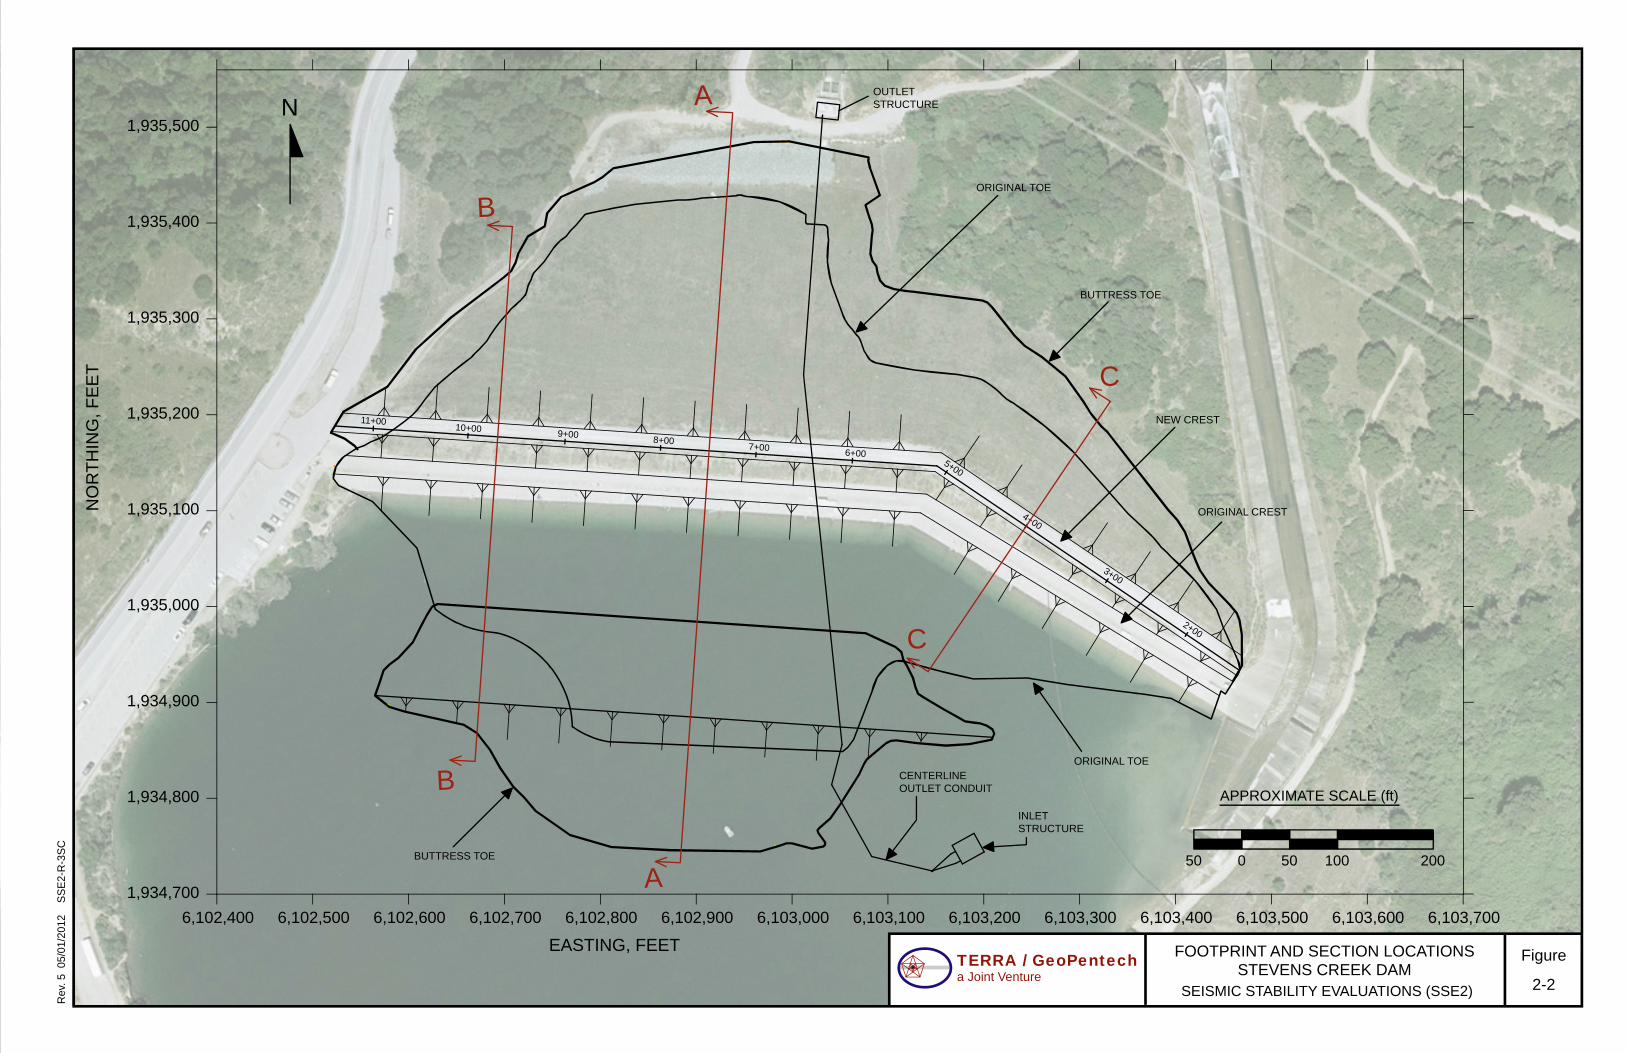
Figure 2-2 is an aerial photograph of Stevens Dam that shows the outline of the embankment, the locations of the outlet works, and the locations of three transverse sections that are representative of dam zoning and foundation conditions near the center of the valley (Station 7+50), at the left abutment (Station 9+70), and at the right abutment (Station 4+00). The outline of the original embankment is shown as well as the limits of upstream and downstream buttresses that were completed in 1986. The downstream buttress raised the crest of dam and only the stationing along the new crest is shown on Figure 2-2. The cross sections are contained in Figure 2-3.
The original dam embankment was designed as a two-zone earthfill dam, with an "impervious" upstream zone and a "pervious" downstream zone. However, subsequent studies have indicated that the dam is in fact more like a homogenous embankment. Therefore, hereinafter the embankment zones will be referred to as upstream embankment and downstream embankment. Both the upstream and downstream embankments were constructed with outside slopes inclined at 2.5 horizontal to 1 vertical (2.5H : 1V). The upstream buttress constructed in 1986 is 100 feet wide and half the dam height; the downstream buttress, also constructed in 1986, is 50 feet wide and extends to elevation 556.8 feet, nominally 19 feet above the spillway elevation, between Stations 5+10 and 10+40. The crest of the downstream buttress slopes down uniformly to the elevation of the original dam crest between Station 10+40 and the left abutment and between Station 5+10 and the spillway at the right abutment. The slopes of the upstream and downstream buttresses are 2.5 horizontal to 1 vertical (2.5H : 1V); i.e., the same as those of the original
1 Unless otherwise noted in this document, all elevations are referenced to NAVD88 vertical datum.
SECTION 2.0 SUMMARY OF SITE CHARACTERIZATION
SSE2 Rpt SC-3 Final.docx 2-2x
embankment. An inclined filter and drain was placed between the downstream slope of the original dam and the new downstream buttress fill.
2.2.2 Dam Foundation
As shown on Figure 2-3, a cutoff trench was constructed at about the midpoint of the upstream embankment by excavating through the overburden soils and into the Santa Clara Formation. The Santa Clara Formation is a poorly indurated conglomerate with lesser interbeds of sandstone, siltstone and claystone - it is essentially a very dense clayey gravel.
The foundation beneath the dam downstream of the cutoff trench includes older alluvial terrace deposits with some colluvium on the mid and upper abutments and younger alluvial deposits that underlie the channel section of the foundation downstream of the cutoff. Santa Clara Formation bedrock underlies the outlet pipe. In addition, within the channel section, fill overlies the younger alluvium at the base of the downstream buttress, as shown on Figure 2-3. This fill appears to have been placed downstream of the toe of the original embankment when the dam was built.
Overburden soils were generally removed from beneath the upstream embankment zone to the top of the Santa Clara Formation bedrock and from the cutoff trench that was excavated into the Santa Clara Formation bedrock and is located beneath the center of the upstream embankment zone. In addition, a minimum 50-foot wide strip of the upstream buttress foundation is underlain by Santa Clara Formation bedrock. Some younger alluvium appears to underlie the upstream portion of the original embankment (upstream of the cutoff trench) and the downstream margin of the upstream buttress.
Figure 2-4 is an isopach map showing the estimated distribution of alluvial and colluvial soils that remain in place within the foundation of the embankment. This map is based on a detailed review and analysis of a number of drawings documenting the conditions that existed in the foundation area prior to, and during, construction of the original dam and of the buttresses; and on the results of field investigations completed by prior investigators as well as those completed by TGP in 2010-2011.
The data provided by the existing piezometers as well as those installed by TGP in 2010-2011 clearly show that the alluvium left in place beneath the downstream embankment is functioning as a very effective horizontal drainage blanket and that there is a downward gradient within the embankment materials above the alluvium. The measured total heads in the piezometers in the younger alluvium at the maximum section of the dam indicate that water is perched on the surface of the underlying comparatively impermeable Santa Clara Formation bedrock.
The groundwater levels within the younger alluvium at the maximum section were monitored over a period of five months from December 2010 through May 2011 and were found to be low; i.e., within 2 feet of the bottom of the alluvium under the crest and within 10 feet of the bottom of the alluvium at the toe of the dam. In addition, they were found to be strongly influenced by groundwater levels downstream of the dam – not by the reservoir level. These levels are in turn controlled by precipitation and recharge from Stevens Creek at the downstream outlet structure. Similarly, the data from a piezometer located on the dam crest at Station 4+00 indicate that some
SECTION 2.0 SUMMARY OF SITE CHARACTERIZATION
SSE2 Rpt SC-3 Final.docx 2-3x
seepage probably occurs through the older terrace alluvium that remains in the foundation beneath both sides of the dam, and is likely fed by groundwater within the abutments.
2.3 DAM ZONING
As noted in Section 2.2.1, Stevens Creek Dam was originally constructed as a two-zone earthfill embankment. In 1986, upstream and downstream buttresses were added to the original embankment. An inclined filter/drain layer was placed between the original embankment and the downstream buttress and a horizontal drainage blanket was constructed on top of the foundation beneath the downstream buttress. Alluvium was left in place under the downstream portion of the original dam and the downstream buttress but excavated under most of the upstream embankment and upstream buttress.
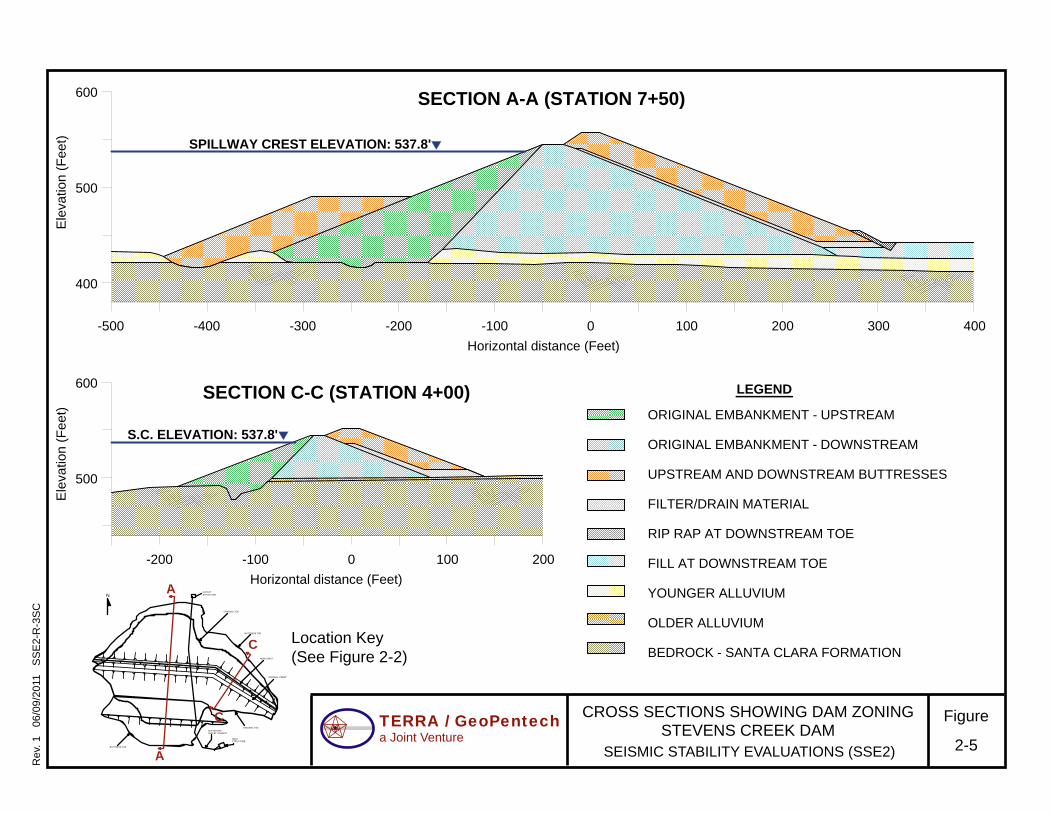
Figure 2-5 shows the generalized configuration of the dam and its foundation at the maximum section (Section A-A – Station 7+50) and at a section through the right abutment (Section C-C' – Station 4+00). The various material zones identified are: Original Embankment – Upstream and Downstream; Upstream and Downstream Buttresses; Filter/Drain; Rip Rap at Downstream Toe; Fill at Downstream Toe; Alluvium; and Bedrock – Santa Clara Formation. The alluvium is further divided into two zones: Younger Alluvium and Older Alluvium.
2.4 PROPERTIES OF EMBANKMENT MATERIALS
2.4.1 Classification and Index Properties
The material classification and index properties for the embankment zones shown on Figure 2-5 are summarized on Table 2-1.
The upstream and downstream portions of the original embankment were obtained from the alluvial and colluvial deposits and Santa Clara Formation bedrock along the floor and lower flanks of the Stevens Creek channel in the area upstream of the dam, and have similar physical/index properties. These materials are generally classified as sandy clayey gravel (GC-SC) to sandy clay (CL) in the upstream embankment and clayey sand (SC) to clayey gravel (GC) with a few samples classified as silty gravel (GM) and silty sand (SM) in the downstream embankment.
The upstream and downstream buttresses were constructed using similar source materials as the original embankment and as such their physical/index properties are similar to those of the original embankment. The buttress materials have been predominantly classified as clayey sand (SC) with a few samples classified as silty sand (SM) and clayey gravel (GC).
The Filter/Drain was an important element of the modification made to the dam in 1986. This filter/drain zone consists of a 12-foot wide inclined drain on the downstream face of the original embankment and an 8-foot thick blanket drain that underlies the new buttress beyond the original downstream toe and is founded on fill placed during the original dam construction that is underlain by alluvium. The filter/drain was designed to prevent the downstream buttress from becoming saturated and was specified during design to consist of sandy gravel (GW) which met the appropriate filter criteria.
SECTION 2.0 SUMMARY OF SITE CHARACTERIZATION
SSE2 Rpt SC-3 Final.docx 2-4x
2.4.2 Engineering Properties
Seismic stability and non-linear deformation analyses require the following material properties: unit weight, effective stress friction angle, undrained strength, and dynamic properties (i.e., shear-wave velocity, shear modulus reduction, and damping ratio curves). In addition, the permeabilities of the various materials are required as input to the seepage analyses that provide estimates of pore pressures that are necessary to calculate the initial effective stresses within the dam for input into the engineering analyses of seismic deformations.
Table 2-2 provides a summary of the engineering properties selected for each of the zones of the dam except for the shear modulus reduction and damping ratio curves that are shown on Figure 2-6. The derivation of these properties from the existing data is discussed in detail in Report No. SC-2 (Terra / GeoPentech, 2012b). It should be noted that, in some cases, the same properties were chosen for more than one zone as supported by trends observed in the available data. Also, because of its relatively small cross section, the filter/drain zone was considered equivalent to the buttress material in the engineering site response and deformation analyses. However, this zone was specifically included in the seepage analyses. No strength data are available for the fill shown of Figure 2-5 that underlies the base of the downstream buttress and was placed on top of the alluvium during original dam construction. A friction angle of 32 degrees and a shear wave velocity of 700 feet/sec have been assigned to this fill material.
The embankment materials are clayey and appear to be non-liquefiable. Nevertheless, based on discussions with DSOD, TGP made a thorough evaluation of the liquefaction potential of the embankment materials and determined that the materials behave as fine grained soils and are indeed not susceptible to loss of strength due to cyclic loading. This evaluation is discussed in detail in Report No. SC-2.
As indicated above, the physical/index properties of the upstream embankment and the downstream embankment are very similar and Wahler (1978) concluded that there was no substantial difference in the permeability of the two embankment zones. Wahler conducted triaxial permeability tests on four specimens from a 48-inch diameter bucket auger boring drilled at Station 8+26, about 30 feet upstream of the original dam crest. Pairs of specimens from nominal depths of 24 feet and 63 feet were tested: one specimen obtained from a vertically-oriented driven 5-inch diameter sample and one specimen from a horizontally-oriented pushed tube sample. The measured permeabilities were as follows:
Sample Depth, Feet
Vertical Permeability,
cm/sec
Horizontal Permeability,
cm/sec
Ratio of Horizontal to Vertical
Permeability
24 3.5 x 10⁻⁸ 9.1 x 10⁻⁶ 260
63 6.6 x 10⁻⁷ 1.4 x 10⁻⁷ 0.21
Logarithmic Average
1.5 x 10⁻⁷ 1.1 x 10⁻⁶
SECTION 2.0 SUMMARY OF SITE CHARACTERIZATION
SSE2 Rpt SC-3 Final.docx 2-5x
The vertical permeability provides the better estimate of the permeability of the clay within the specimen and we believe that the vertical permeability of the embankment is approximately 1x10⁻⁷ cm/sec (0.1 ft/year). The ratio of horizontal to vertical permeability of a compacted clayey fill is typically between 20 and 50. A ratio of 20 was used as the initial estimate in the seepage analyses described in Section 3.0.
2.5 PROPERTIES OF ALLUVIUM
2.5.1 Classification and Index Properties
The alluvial soils that underlie the downstream embankment and downstream buttress consist of two units: younger alluvium deposits and older alluvium terrace deposits. The younger alluvium underlies the embankment in the central portion of the canyon where the maximum section of the dam is located, while the older alluvium underlies the lower portions of the embankment at the left and right abutments.
Samples of younger alluvium have been predominantly classified as poorly graded sandy gravel (GP) to silty sand (SM) with a few samples classified as clayey gravel (GC) and clayey sand (SC). Samples of older alluvium (Terrace alluvium) have been predominantly classified as clayey gravel (GC) to clayey sand with gravel (SC) with a few samples classified as poorly graded gravel (GP) and silty sand (SM). The classification and index properties on these two units are summarized on Table 2-1.
2.5.2 Engineering Properties
Engineering properties were only developed for the younger alluvium, hereafter simply referred to as the alluvium, since the older alluvium exists only under the abutment areas of the dam which are less critical in terms of seismic performance. In addition to being less critical based on its location within the foundation, review of the limited information available shows that the older alluvium is Pleistocene in age, slightly higher in plasticity, slightly higher in fines content, and denser than the younger alluvium, and therefore has a low potential for liquefaction.
The following engineering properties were developed for the alluvium: unit weight, shear wave velocity, modulus reduction and damping curves and post-liquefaction residual shear strength. These properties are listed in Table 2-2 except for the shear modulus reduction and damping ratio curves that are shown on Figure 2-7.
The key parameter for evaluation of the liquefaction potential and residual shear strength is the corrected SPT blow count (N1)60. The data collected and methods used to estimate the (N1)60
values in the alluvium are discussed in detail in Report No. SC-2 (Terra / GeoPentech, 2012b). After much discussion with DSOD regarding the data for the alluvium obtained at the site, it was agreed to use the mean (N1)60 values from BPT data interpreted using the Harder method (1997) based on test results from borings at the toe of the dam and one boring on the "lower access road" (i.e., about 1/3 of the way up the downstream slope of the dam). This mean value is 20 blows/foot and was used as the DSOD-approved mean (N1)60 value for the purposes of our seismic deformation analyses. However, the 16th percentile (N1)60 values estimated from other data collected during the field investigations (i.e., SPT data, BPT data interpreted using the Sy
SECTION 2.0 SUMMARY OF SITE CHARACTERIZATION
SSE2 Rpt SC-3 Final.docx 2-6x
and Campanella method (1994), and CPT measurements) range from 25 to 31 blows/foot. Therefore, in order to understand the sensitivity of the estimated seismic deformations to the uncertainty in (N1)60 values, we recommend using an (N1)60 value of 25 blows/foot as a benchmark value for calculating and comparing seismic deformations. The values of post-liquefaction residual shear strength shown in Table 2-2 were estimated from these (N1)60 values as described in Section 5.0.
In addition to the above engineering properties, the permeability of the alluvium is required as initial input to the seepage analyses that will support the engineering analyses of seismic deformations. Borehole field permeability tests were made within the alluvium using the Casagrande and standpipe piezometers installed during the 2010-2011 investigations. The results of these tests yielded a permeability of 2 x 10⁻³cm/sec in the saturated alluvium near the toe of the dam. We believe the permeability of the partially saturated alluvium would be 10 to 100 times less than that of the saturated alluvium. Consequently, we recommend using a permeability of 2 x 10⁻³ cm/sec for saturated younger alluvium and a permeability of 2 x 10⁻⁵ cm/sec for unsaturated younger alluvium.
2.6 GROUND MOTIONS Earthquake ground motions from the controlling events on the Stanford-Monte Vista, Berrocal, and San Andreas faults were considered to develop site-specific ground motions for the seismic stability evaluation of the dam. As documented in Report No. SC-2 (Terra / GeoPentech, 2012b), these input ground motions were developed in terms of response spectral values and candidate acceleration time histories to be used in developing time histories that are compatible with the specified response spectral values.
Key elements in the development of these site specific ground motions are as follows:
1. Stevens Creek Dam is classified as a "high consequence" dam by DSOD.
2. The two seismogenic faults controlling the seismic hazard at the dam are the Stanford-Monte Vista and San Andreas faults. The Maximum Credible Earthquake (MCE) on the Stanford-Monte Vista Fault is a magnitude 6.9 event that has a peak ground acceleration of 1.17g and is located at a distance of 1.6 km from the dam. The MCE on the San Andreas Fault is a magnitude 7.9 event that has a peak ground acceleration of 0.7g and is located at a distance of 3.8 km from the dam. The Stanford-Monte Vista event controls the shaking condition at the site for periods of 2 seconds or less for the lower magnitude earthquake scenario. The San Andreas event has a larger earthquake magnitude and controls the shaking condition at the site for periods larger than about 2 seconds.
3. The VS30 for the foundation of the dam was calculated based on OYO shear wave velocity data collected at two locations beneath the dam and one location at the toe. A site-specific VS30 of 960 m/sec was determined based on these measurements and used in the development of the design response spectra for the Stanford-Monte Vista and San Andreas events.
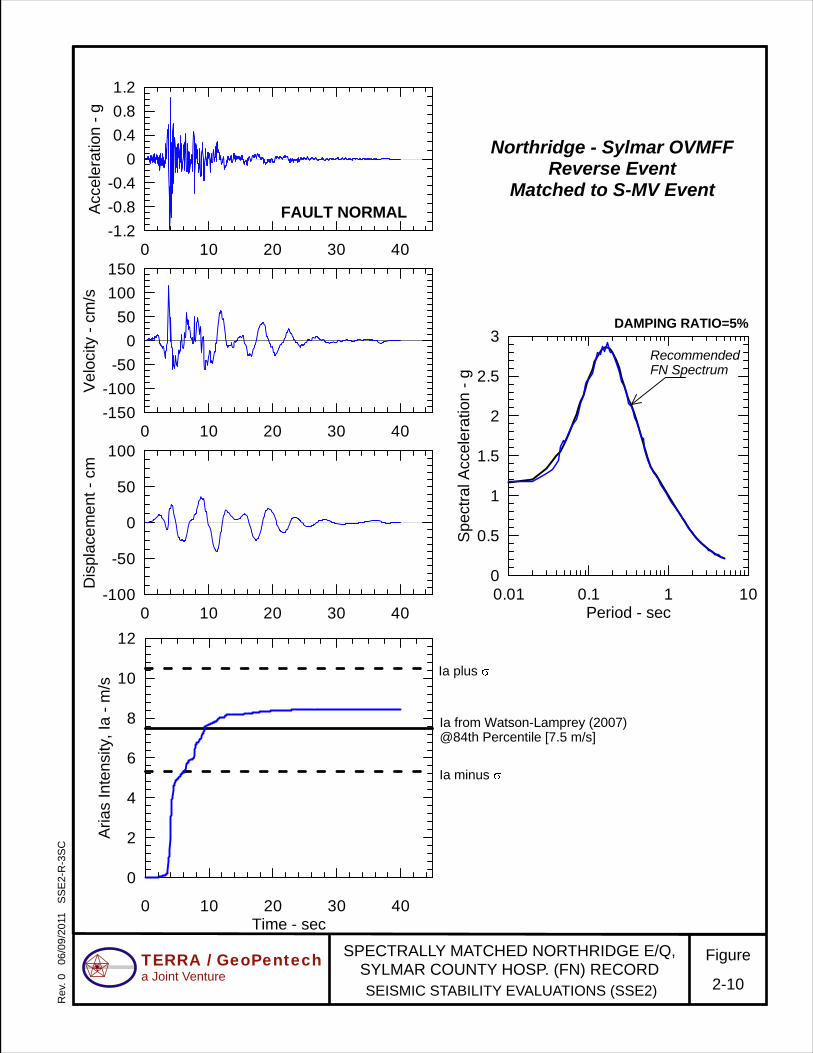
4. Three seed time histories were selected for the Stanford-Monte Vista event and adjusted to match the target response spectra. The spectrally-matched time histories are shown on Figures 2-8 to 2-10. It should be noted that the Arias Intensity values of the three selected
SECTION 2.0 SUMMARY OF SITE CHARACTERIZATION
SSE2 Rpt SC-3 Final.docx 2-7x
ground motions exceed the best estimate of Arias Intensity provided by the Watson-Lamprey and Abrahamson (1996) relationship with 84th percentile ground motion inputs.
5. Seed time histories for the San Andreas event were selected through a multi-step screening of the PEER Ground Motion Database because of the relatively small number of high quality ground motion records from stations that are very close to ruptures of very large magnitude earthquakes. The selection process screened all 3,551 records in the database and yielded eight records with values of Arias Intensity and significant duration similar to those of the San Andreas event. These eight records, as well as the Denali TAPS record, were chosen and evaluated, and three final seed time histories were selected. The final three selected seed time histories were then adjusted to match the target response spectra. The spectrally-matched time histories are shown on Figures 2-11 to 2-13. As for the Stanford-Monte Vista event, the Arias Intensity values of the three ground motions exceed the best estimate of Arias Intensity provided by the Watson-Lamprey and Abrahamson relationship with 84th percentile ground motion inputs.
SECTION 3.0 SEEPAGE ANALYSES
SSE2 Rpt SC-3 Final.docx 3-1x
3. Section 3 Seepage Analyses
3.1 GENERAL
Analyses of seepage through an earth dam provide information on the distribution of total heads and pore-water pressures (pore pressures), gradients, and flow rates within the dam. The pore pressures within the dam under steady state seepage conditions for a full reservoir are used in limiting equilibrium stability analyses to calculate effective stresses, which are then combined with the effective-stress-strength parameters and soil unit weights to calculate the factor of safety of the dam under steady state seepage conditions. The effective stresses within the dam are also used to estimate the undrained shear strength of the clayey embankment soils. These undrained shear strengths are used in limiting equilibrium stability analyses to calculate the factor of safety of the dam for undrained loading combined with steady state seepage (and other loading conditions), and to calculate the yield acceleration of the embankment under pseudo-static earthquake loading. These undrained shear strengths are also an important input parameter for the non-linear analyses of the permanent deformations caused by earthquake loading. The static and pseudo-static stability analyses are described in Section 4.0 and the seismic deformation analyses are discussed in Section 5.0.
Our approach for the seepage analyses includes the following steps:
1. Develop a finite element model for the dam and dam foundation that includes the geometry of the dam and the various internal zones and other important features within the dam; assign values of permeability (for both horizontal and vertical flow) to all the materials; and establish boundary conditions.
2. Use the model to calculate total heads throughout the dam and foundation and compare calculated total heads from the model to measured total heads from piezometers.
3. Based on comparisons of calculated to measured total heads, make reasonable adjustments in the material properties and boundary conditions to improve the agreement between calculated and measured total heads.
4. Use the final model results to make a best estimate of the distribution of total heads and pore pressures within the dam and use this information to calculate effective stresses and undrained shear strengths of the embankment materials for use in stability analyses and seismic deformation analyses, as described above.
The PLAXIS finite element computer program was used for the seepage analyses. PLAXIS is the brand of the Software and the name of the company that develops and supports the software (www.plaxis.nl). PLAXIS offers a suite of finite element computer programs for geotechnical applications that include static and dynamic deformation analyses and analyses of seepage and consolidation. The seepage analyses for this study are based on a two-dimensional plane-flow finite element model.
Section 3.2 summarizes the history of piezometer measurements at Stevens Creek Dam and the maximum measured piezometric levels that were used to validate the seepage model. Section 3.3 presents the results of the seepage analyses.
SECTION 3.0 SEEPAGE ANALYSES
SSE2 Rpt SC-3 Final.docx 3-2x
3.2 PIEZOMETER MEASUREMENTS AT STEVENS CREEK DAM
The following is a history of piezometer installations at Stevens Creek Dam:
1. Seven pneumatic piezometers and two observation wells were installed at the dam in 1976. These instruments have all been abandoned. Nine pneumatic piezometers were installed in 1985 after the dam modifications; and
2. Five Casagrande piezometers, two standpipe piezometers, and four vibrating wire piezometers were installed by TGP in 2010 and 2011 (Terra / GeoPentech, 2012a).
Eight of the 1985 pneumatic piezometers were installed at Station 7+20 (i.e., at about the maximum section of the dam) and the locations of these piezometers are shown on the upper panel of Figure 3-1. The locations of the Casagrande piezometers and vibrating wire piezometers installed by TGP in 2010 and 2011 at Station 7+50 are shown on the lower panel of Figure 3-1. The piezometric levels within the alluvium measured by the Casagrande piezometers installed at the base of the alluvium are discussed in detail in Report SC-2. The data provided by the existing pneumatic piezometers as well as those installed by TGP in 2010-2011 clearly show that the alluvium left in place beneath the downstream embankment is functioning as a very effective horizontal drainage blanket. The measured total heads in the piezometers in the younger alluvium at the maximum section of the dam indicate that water is perched on the surface of the underlying comparatively impermeable Santa Clara Formation bedrock. The groundwater levels within the younger alluvium at the maximum section were monitored over a period of five months from December 2010 through May 2011 and were found to be low; i.e., within 2 feet of the bottom of the alluvium under the crest and within 10 feet of the bottom of the alluvium at the toe of the dam.
Figure 3-2 summarizes the maximum measured piezometric levels for the pneumatic piezometers and vibrating wire piezometers within the embankment at Station 7+50. These measured piezometric levels will be compared to the piezometric levels calculated using the PLAXIS finite element seepage analyses discussed below.
3.3 RESULTS OF SEEPAGE ANALYSES
The maximum section of the dam at Station 7+50 was chosen for analyses. The upstream and downstream embankments were included in the seepage model. As discussed above, the piezometer data show that the alluvium functions as a very effective horizontal drain and, as a result, the boundary condition at the top of the alluvium was modeled as a surface where the pore pressure is zero, i.e. the piezometric head is equal to the elevation of the top of the alluvium. The sand filter that separates the original embankment from the new downstream buttress effectively prevents water seeping from the dam from entering the downstream buttress and, as a result, the filter layer and downstream buttress are not included in the seepage model.
As discussed in Section 2.0, the upstream and downstream embankment were constructed from materials obtained from the same borrow area and have similar physical properties, index properties, and engineering properties. The vertical permeability of the embankment materials was estimated to be 1 x 10 -7 cm/sec and the ratio of horizontal to vertical permeability was estimated to be 20 because of the layering inherent in compacted fills.
SECTION 3.0 SEEPAGE ANALYSES
SSE2 Rpt SC-3 Final.docx 3-3x
Figure 3-3 shows the calculated piezometric heads for steady state seepage with the reservoir full and also shows the maximum measured piezometric levels at the piezometers within the embankment. The agreement between calculated and measured piezometric levels is remarkably good. The measured piezometric levels are within 5 feet of the calculated piezometric levels for all piezometers except for piezometer B-1 located near the center of the dam about 20 feet above the top of the alluvium where the measured total head is 15 feet higher than the calculated total head. Based on the generally good agreement between measured and calculated piezometric levels it was concluded that adjustments to the modeling parameters were not necessary or appropriate. However, DSOD expressed concern about the difference between measured and calculated piezometric levels at piezometer B-1 and we understand that, in their independent analyses, they arbitrarily assigned higher-than-measured pore pressures at the base of the embankment in the vicinity of piezometer B-1 to increase the calculated head in their seepage model. We do not believe that arbitrarily assigning elevated pore pressures at the top of the alluvium to force the calculated piezometric head at B-1 to be closer than the measured head at that location is appropriate because it contradicts the fact that the alluvium is a drain, as discussed in Section 3.2.
As noted at the beginning of this section of the report, the seepage model for the embankment does not explicitly include the alluvium but models the interface between the alluvium and the embankment using a boundary condition where the pore pressure is set equal to zero. However, because of DSOD's concern, we also completed a separate analysis of the alluvium using a one-dimensional horizontal flow model based on the Dupuit approximation in which the flow from the embankment into the alluvium, calculated from the PLAXIS model, is input at the top of the alluvium. Combining this flow with the measured piezometric level at the downstream toe of the dam allows the piezometric level within the alluvium to be calculated. Figure 3-4 compares the calculated groundwater levels to those measured by piezometers in the alluvium. The agreement between measured and calculated locations of the phreatic surface within the alluvium is good and confirms that the alluvium is indeed behaving as a very effective horizontal drain at the base of the embankment.
As shown on Figure 3-3, the lines of constant groundwater head (equipotential lines) are nearly horizontal within the downstream portion of the dam as a result of the water flowing to the underlying alluvium and the fact that the horizontal permeability is 20 times greater than the vertical permeability. This is a very favorable seepage condition because the seepage forces (which are perpendicular to the equipotential lines) are nearly vertical and the pore pressures in the downstream embankment are relatively small. Figure 3-5 shows contours of constant pore pressure. These pore pressures were used to calculate the undrained shear strength of the embankment materials as discussed in Section 4.0.
SECTION 4.0 STATIC STABILITY AND PSEUDO-STATIC YIELD ACCELERATION
SSE2 Rpt SC-3 Final.docx 4-1x
4. Section 4 Static Stability and Pseudo-Static Yield Acceleration
4.1 GENERAL
The maximum cross-section of the dam (Section A-A on Figures 2-3 and 2-5) is the critical section for static stability analyses and for calculating the yield acceleration from pseudo-static stability analyses. The static stability for steady state seepage and rapid drawdown was evaluated with circular failure surfaces that were analyzed using the Spencer-Wright Method of Slices. The analysis of static stability immediately after shaking (with post-liquefaction residual strength of the alluvium) and the pseudo-static stability analyses (with post-liquefaction residual strength of the alluvium) were completed with non-circular failure surfaces that were analyzed using the Spencer-Wright Method of Slices. The analyses were made using the computer program Galena (www.galenasoftware.com). Galena is a powerful and relatively easy to use slope stability program that was developed and is supported by Clover Technology. This software is used for geotechnical and mining applications by licensed users located in over 70 countries around the world. The following cases have been analyzed and are reported herein.
Case Type of
Analyses Material Properties
Factor of Safety
Yield Acceleration
Full Reservoir with Steady State Seepage – D/S Slope
Static Drained X
Rapid Drawdown – U/S Slope
Static Undrained X
Full Reservoir – D/S Slope Pseudo-Static
Undrained Embankment with Residual Strength
for Alluvium
X
Full Reservoir Immediately after Shaking – D/S Slope
Static
Undrained Embankment with Residual Strength
for Alluvium
X
4.2 INPUT PARAMETERS The input for the slope stability analyses includes:
1. the geometry of the dam and the internal zones within the dam, and the total unit weights of the materials within the various zones of the dam;
2. for steady state seepage analyses: the reservoir level, and the pore pressures and effective stress strength parameters for the various zones of the dam; and
3. for rapid drawdown: the reservoir level and the undrained shear strengths for the various zones of the dam;
SECTION 4.0 STATIC STABILITY AND PSEUDO-STATIC YIELD ACCELERATION
SSE2 Rpt SC-3 Final.docx 4-2x
4. for pseudo-static analyses to estimate yield acceleration: the reservoir level, the undrained shear strength of the embankment materials, and the post-liquefaction strength of the alluvium; and
5. for static analyses immediately after shaking: the reservoir level, the undrained shear strength of embankment materials, and the post-liquefaction strength of the alluvium.
The engineering properties for the various materials were discussed in Section 2.0 and are summarized in Table 2-2. The post liquefaction residual strength of the alluvium was based on a residual strength, Sr , equal to 0.19 times the vertical effective consolidation stress (i.e., the strength derived from a (N1)60 of 20 as discussed in Section 5.4.2).
The undrained shear strength of the various embankment materials is a function of the vertical effective stress acting on the soil at any particular location within the dam. The vertical effective stress is calculated from the vertical total stress and the pore pressure within the dam.
Figure 3-4 shows the geometry of the maximum section of the dam and contours of pore pressures within the dam for steady state conditions based on the seepage analyses presented in Section 3.0. The vertical total stress within the dam was calculated as part of the FLAC analyses presented in Section 5.0. The vertical total stress was then combined with the pore pressures to calculate the vertical effective stress, and the undrained shear strength was calculated from the vertical effective stress. Figure 4-1 shows contours of undrained shear strength within the dam corresponding to steady state seepage under full reservoir. The vertical effective stresses and corresponding undrained shear strengths will be higher for steady state seepage conditions under lower reservoir levels but this increase in strength would take a long time to occur because of the low permeability of the soils. Consequently, we have used the undrained strength corresponding to steady state seepage under full reservoir level for all undrained loading conditions in order to be reasonably conservative.
4.3 RESULTS OF ANALYSES The distribution of piezometric heads within the dam shown in Figure 3-4 and the distribution of undrained shear strengths shown in Figure 4-1 are not simple from a modeling perspective for limiting equilibrium analyses. Nevertheless, the Galena slope stability program is capable of closely modeling them. For the drained analyses, the total heads (or piezometric levels) were modeled by dividing the embankment into 10-foot thick horizontal layers and by specifying a piezometric line for each layer to define the distribution of total heads. For the undrained analyses, the distribution of undrained shear strength was modeled by defining materials where the average undrained shear strength varied in increments of 500 pounds per square foot (lb/ft2) within the upstream embankment and increments of 1000 psf in the downstream embankment.
The calculated factors of safety and yield acceleration for the various cases analyzed are summarized below.
SECTION 4.0 STATIC STABILITY AND PSEUDO-STATIC YIELD ACCELERATION
SSE2 Rpt SC-3 Final.docx 4-3x
Case Type of
Analyses Material
Properties Factor of
Safety Yield
Acceleration
Full Reservoir with Steady State Seepage – D/S Slope
Static Drained 1.9
(2.6) NA
Rapid Drawdown – U/S Slope
Static Undrained 2.3 NA
Full Reservoir – D/S Slope Pseudo-Static
Undrained Embankment with Residual Strength
for Alluvium
NA 0.12g to 0.13g
Full Reservoir Immediately after Shaking – D/S Slope
Static
Undrained Embankment with Residual Strength
for Alluvium
1.6 NA
The locations of the critical circular failure surfaces associated with the static stability analyses under steady state seepage and rapid drawdown are shown on Figure 4-2. The minimum factor of safety for the drained analyses with steady state seepage is 1.9 and corresponds to a shallow slide at the face of the downstream buttress. The factor of safety for a more substantial sliding mass, as shown on the upper panel of Figure 4-2, was found to be 2.6. The minimum factor of safety for rapid drawdown is 2.3 for the critical surface shown on the lower panel of Figure 4-3.
A yield acceleration of 0.13g was found for the location of the critical failure surface shown in the upper part of Figure 4-3. This surface encompasses a large portion of the dam. An alternate sliding surface is also shown that includes a portion of the dam that was more significantly involved in seismic deformations based on the displacement patterns observed from the FLAC analyses discussed in Section 5.0. The calculated yield acceleration for this alternate sliding surface is 0.12g, slightly lower than the minimum value found using a global search for the critical surface. However, there were some numerical difficulties with the limiting equilibrium calculations for this alternate surface that could easily explain the difference in yield accelerations and we have concluded that the estimated minimum yield acceleration for the dam is between 0.12g and 0.14g based on the Spencer-Wright Method of Slices.
The lower portion of Figure 4-1 shows the minimum factor of safety of 1.6 and the critical failure surface from the analyses of the static stability of the dam immediately after shaking using the post-liquefaction residual strength associated with an (N1)60 value of 20.
The results of the analyses show that the factors of safety for static loading are all significantly greater than the minimum factors of safety recommended by the US Army Corps of Engineers (2003) for static loading conditions; i.e., 1.5 for the downstream slope with steady state seepage under full reservoir and 1.3 for rapid drawdown. The yield accelerations were used for Newmark-type analyses, as discussed in Section 5.0. The factor of safety immediately after shaking, assuming liquefaction were to occur, is also significantly greater than required to preclude a flow slide.
SECTION 5.0 SEISMIC DEFORMATION ANALYSES
SSE2 Rpt SC-3 Final.docx 5-1x
5. Section 5 Seismic Deformation Analyses
5.1 GENERAL
This section documents the results of the seismic deformation evaluation of the dam under the Maximum Credible Earthquake (MCE). The seismic deformation evaluation focuses on seismically-induced permanent deformations of the dam embankment that could lead to a loss of freeboard or the formation of cracks and the potential for piping.
Following this introduction, Section 5.2 describes the methodology and approach used in the evaluation; Section 5.3 discusses the cross-section used in the analyses; Section 5.4 summarizes the material properties; and Section 5.5 presents the MCE evaluation ground motions as well as the corresponding analysis input time histories. Section 5.6 summarizes the results of the seismic deformation evaluation of the dam under the MCE evaluation ground motions. The Appendix provides some details on the completed analyses and contains figures summarizing the results of the FLAC (Itasca, 2008) seismic deformation analysis cases.
5.2 ANALYSIS METHODOLOGY
5.2.1 Overview
The seismic deformation of the dam under the postulated ground motions was evaluated using FLAC (Itasca, 2008). The FLAC analyses take into account the triggering of liquefaction in the alluvium beneath the dam and the residual strength of the liquefied alluvium layer after the onset of liquefaction.
5.2.2 Analysis Platform and Soil Model
FLAC (Fast Lagrangian Analysis of Continua) is a two-dimensional explicit finite difference program for geotechnical and other applications developed by Itasca (2008). An analysis section is divided into zones (or elements) and nodal points in a way analogous to the finite element method. FLAC uses the Lagrangian formulation of momentum equations (Newton’s second law of motion) and, thereby, inherently accounts for the mass conservation law and allows elements with fixed masses to translate, rotate, or deform in space. The analysis input motion is specified at the base of the analysis section, incorporating the effects of a compliant boundary representing the bedrock in the analysis.
The calculation loop in FLAC has two main alternating components: zone (or element) calculations and nodal point calculations. In the zone calculations, the current velocities and displacements of nodal points are used to compute the strain increments in the zone formed by these nodes; these strain increments, in turn, are used to compute the stress increments of the zone. With the new state of stress, the out-of-balance force can be computed and then used to calculate the incremental displacements of the nodes.
Various stress-strain models are available in FLAC. For the evaluation documented herein the Mohr-Coulomb model and the elastic model in FLAC were used in the analyses. Details of these models are provided by Itasca (2008). For all the results presented here, the elastic model was used for the bedrock and, depending on the analysis, either the Mohr-Coulomb model or the
SECTION 5.0 SEISMIC DEFORMATION ANALYSES
SSE2 Rpt SC-3 Final.docx 5-2x
elastic model was used for all the other materials. In particular, the Mohr-Coulomb model was used for the embankment materials and alluvium layer in the seismic deformation analyses.
The Mohr-Coulomb model consists of elastic-perfectly-plastic stress-strain relationships. Therefore, the materials are elastic before yielding. To make the elastic portion of the analysis reasonable, we performed an equivalent-linear analysis using the computer program QUAD4MU (Idriss et al., 1973, updated version dated 2003) on a two-dimensional model of the dam to obtain the strain-compatible modulus and damping values for the postulated shaking conditions. The analysis results from QUAD4MU provide the basis for the strain-compatible shear modulus and damping values to be used in the elastic portion of the Mohr-Coulomb model in the FLAC analyses. The "perfectly-plastic" portion of the Mohr-Coulomb model is defined by the appropriate undrained shear strength of the material.
5.2.3 Liquefaction Model
The liquefaction model used in the analyses consists of an empirical pore pressure generation procedure that is coupled with the Mohr-Coulomb model based on an approach initiated some years ago. Dawson and Mejia (2012) describe the history of development of the main features of this model. The approach is based on the widely used quasi-empirical method for evaluating seismic liquefaction resistance described by Idriss & Boulanger (2008) and is schematically illustrated in Figure 5-1, and described below.
The time-history of shear stress at a particular point within a potentially liquefiable soil layer is estimated using a numerical analysis (incorporating the modulus and damping parameters for the elastic response together with the static shear strength of the material for the Mohr Coulomb soil model) as shown in Figure 5-1, Panel (a). Individual half-cycles of change in shear stress are identified. The incremental cyclic shear stress,cy, is then compared to the soil’s cyclic strength (described by a plot of the number of uniform cycles of loading required for liquefaction to occur at various cyclic stress ratios) to determine the number of stress cycles, Ni
L, to cause liquefaction for that incremental cyclic stress ratio, as shown on Figure 5-1, Panel (b). The increment in pore pressure ratio (ru) due to the half-cycle of incremental shear stress is then calculated as 0.5/Ni
L; e.g., if the value of Ni
L were 5, the change in pore pressure ratio, ru, would be 0.1. The initial value of ru is zero and changes in ru are tracked for each half-cycle of change in shear stress; liquefaction occurs when the value of ru reaches 1.
Once the onset of liquefaction (i.e., ru=1) is indicated at a particular point within the alluvium, residual shear strength, and a reduced shear modulus equal to 25 times the residual shear strength, are assigned to the soil at that location. The liquefaction model includes correction factors for initial static stresses and takes into account the influence of effective stress on the shear modulus and residual strength.
5.3 ANALYSIS SECTION, PORE PRESSURES, AND DISCRETIZATION
5.3.1 Analysis Section
Figure 5-2 shows the idealized section of the dam selected for the analyses. This section (Section A-A at Station 7+50) is the maximum section of the dam; its location is shown on
SECTION 5.0 SEISMIC DEFORMATION ANALYSES
SSE2 Rpt SC-3 Final.docx 5-3x
Figure 2-2 and on the plan insert contained on Figure 5-2. The generalized embankment zones and material types are also identified on Figure 5-2.
5.3.2 Pore Pressures
The initial (pre-earthquake) pore pressure conditions in the analysis section are based on the reservoir level at the spillway control elevation and the results of seepage analyses presented in Section 3.0. The pore pressure contours within the dam used in the seismic deformation analyses are shown on Figure 3-4.
5.3.3 Discretization of Analysis Section
Figure 5-3 shows the idealized analysis section and the same section discretized into a finite difference mesh for use in the FLAC analyses. For seismic analysis purposes, the filter/drain material and small rip rap section at the downstream toe are considered to have similar properties as the downstream buttress materials, and therefore are included in the downstream buttress zone. The mesh shown on Figure 5-3 was generated to: (1) allow appropriate dynamic wave propagation in the system; (2) reduce kinematic constraints provided by the linear elements used in FLAC; and (3) control numerical problems introduced by element shapes.
Although not shown on Figure 5-3, the bedrock was also discretized for the sole purpose of providing a compliant base that would appropriately and adequately allow the incoming seismic waves to be introduced in the analysis section and absorb the outgoing seismic waves out of the analysis section. The colors of the various zones of the dam on Figure 5-3 correspond to the zone colors indentified on Figure 5-2.
5.4 MATERIAL PROPERTIES
5.4.1 Material Properties
The material properties used in the analyses are documented in Section 2.0 and summarized in Table 2-2. They include: unit weight; shear wave velocity; shear modulus reduction and damping ratio curves; and shear strength. The shear wave velocity of the bedrock used in the analyses is 960 m/sec, as noted in Section 2.0. The shear modulus reduction and damping ratio curves are also discussed in Section 2.0. The material properties used in the evaluation were the same for all cases analyzed.
The shear modulus reduction and damping curves used for the embankment and buttress material (Section 2.0) are those by Vucetic and Dobry (1991). Figure 5-4 compares shear modulus reduction and damping curves based on Darendeli and Stokoe(2001) with those based on Vucetic and Dobry (1991). Figure 5-4 shows that the relationships by Vucetic and Dobry (1991) in this case provide damping values and shear modulus reduction curves that are generally comparable to those by Darendeli and Stokoe (2001) in the appropriate confining pressure ranges for soils with a PI of 12.
SECTION 5.0 SEISMIC DEFORMATION ANALYSES
SSE2 Rpt SC-3 Final.docx 5-4x
The shear modulus and damping curves used for the alluvium are those by Darendeli and Stokoe (2001) and are shown on Figure 2-7. After liquefaction, the shear modulus of the younger alluvium is estimated at 25 times the residual strength, Sr.
5.4.2 Residual Shear Strength of Younger Alluvium
The residual shear strength of liquefied soils (Sr) is estimated based on the Standard Penetration Test (SPT) blow count, N, corrected for hammer energy and confining pressures. The resulting (N1)60 values are further corrected for the fines contents to obtain the "equivalent clean sand" (N1)60-cs values ,which are used with a semi-empirical correlation to estimate Sr/σ'vc (where σ'vc is the pre-earthquake vertical effective stress) based on case histories and other considerations. There are several procedures to correct N values to obtain (N1)60-cs ; the procedure recommended by Idriss and Boulanger (2008) is used herein. In general, the correlation of (N1)60-cs with the ratio Sr/σ'vc is currently preferred over the correlation of (N1)60-cs with Sr based on theoretical and empirical considerations (e.g., Vasquez-Herrera et al., 1989; Stark and Mesri, 1992, Ishihara 1993; Baziar and Dobry, 1995; Vaid and Sivathayalan 1996; Yoshimine et al. 1999; Olson and Stark 2002; Idriss and Boulanger, 2008) as long as the Sr/σ'vc and associated Sr values are bounded in a rational manner. This bounding of Sr/σ'vc and Sr values is considered a non-issue for embankments of moderate height such as the Stevens Creek Dam embankment.
The correlation between (N1)60-cs and Sr/σ'vc by Idriss and Boulanger (2008) shown on Figure 5-5 is used herein. Figure 5-5 shows two relationships between (N1)60-cs and Sr/σ'vc from Idriss and Boulanger (2008): the upper relationship "corresponds to a condition where the effects of void redistribution are expected to be negligible" and the lower relationship "corresponds to conditions where the effects of void redistribution could be significant." As a practical matter, the lower curve has become the standard of practice for estimating residual shear strength and the amount of conservatism (if any) associated with the use of the lower curve is unknown.
As noted in Section 2.5.2, a mean (N1)60 value of 20 blows/foot was agreed-upon with DSOD for the purposes of the seismic deformation analyses. In addition, an (N1)60 value of 25 blows/foot is used as a benchmark value for calculating and comparing seismic deformations, in order to understand the sensitivity of estimated seismic deformations to the uncertainty in (N1)60 values.
The fines correction for converting (N1)60 to (N1)60-cs adds 1 blow per foot. Consequently the agreed-upon value of (N1)60 value of 20 corresponds to a (N1)60-cs value of 21. Similarly, the benchmark (N1)60 value of 25 corresponds to a (N1)60-cs value of 26. These (N1)60-cs values are shown on Figure 5-6 and the corresponding values of Sr/σ'vc are 0.19 and 0.28 for (N1)60-cs values of 21 and 26, respectively.
5.5 MCE GROUND MOTIONS
The evaluation ground motions that represent the MCE are discussed in detail in Report No. SC-2 (Terra / GeoPentech, 2012b) and summarized in Section 2-6. The earthquake ground motions for the Stanford-Monte Vista event and the ground motion associated with the San Andreas event used in the seismic deformation evaluation of the dam are shown in terms of response spectra at 5 percent damping on Figure 5-7. The following six ground motions were
SECTION 5.0 SEISMIC DEFORMATION ANALYSES
SSE2 Rpt SC-3 Final.docx 5-5x
selected and used in developing time histories that are compatible with the response spectral values shown on Figure 5-7:
1. Earthquake Records for Stanford-Monte Vista Event
a. Kobe Earthquake, Nish-Akashi Station, 1/16/1995 b. Loma Prieta Earthquake, LGPC Station, 10/18/1989 c. Northridge Earthquake, Sylmar-Olive View Med. FF Station, 1/17/1994
2. Earthquake Records for San Andreas Event
a. Chi-Chi Earthquake, TCU065 Station, 9/20/1999 b. Landers Earthquake, Lucerne Station, 6/28/1992 c. Manjil Earthquake, Abbar Station, 11/03/1990
Further details of these ground motions are provided in Tables 5-1A and 5-1B for the Stanford-Monte Vista event and the San Andreas event, respectively. The input ground motion is applied at the base of the analysis section (which is the top of the bedrock) at elevation 375 feet as an outcrop motion (Figure 5-3).
5.6 SEISMIC DEFORMATION EVALUATION UNDER MCE GROUND MOTIONS
5.6.1 Results of Seismic Deformation Analyses
This section presents the key results of the seismic deformation analyses using the evaluation input motions that have been used to represent the MCE.
The FLAC seismic deformation analyses were performed using the positive and negative polarities for each of the six input ground motions (or a total of 12 different time histories or cases). The results of these analyses are summarized in Table 5-2 in terms of crest and downstream horizontal and vertical permanent seismic displacements at the end of shaking for alluvium residual strength values corresponding to (N1)60 values of 20 and 25. For each ground motion, the critical polarity case (i.e., the case that led to larger crest displacements) was selected. The results of these cases are shown graphically in the Appendix. Each selected case is identified by "SAx" and "SMVx" for the San Andreas and Stanford-Monte Vista events, respectively, where "x" is an integer from 1 through 3 corresponding to each of the three time histories for the two events. Where appropriate, each case is further identified by the seed time history as well; for example, "SMV1 Kobe" corresponds to the critical polarity case for the Stanford-Monte Vista event represented by the adjusted acceleration time history based on the Kobe earthquake record.
As can be seen in Table 5-2, for the agreed-upon alluvium residual strength based on a (N1)60 value of 20, the calculated horizontal crest displacements range from 0.9 to 3.1 feet downstream and the calculated vertical displacements (settlements) range from 0.1 to 0.2 feet. For the alluvium residual strength based on a (N1)60 value of 25, the crest displacements drop to 0.2 to 1.5 feet downstream with a vertical settlement of about 0.1 feet. At mid-height of the downstream slope, for (N1)60 = 20, the calculated horizontal displacements range from 1.1 feet downstream to 3.7 feet downstream, whereas the calculated settlements range from 0.1 to 0.3
SECTION 5.0 SEISMIC DEFORMATION ANALYSES
SSE2 Rpt SC-3 Final.docx 5-6x
foot. The calculated horizontal crest displacements drop to 0.6 to 1.8 feet downstream with a vertical settlement of 0.1 feet for (N1)60 = 25.
The vertical displacements shown in Table 5-2 are consistent with a relatively intact block of the embankment materials sliding on top of the essentially horizontal layer of alluvium that liquefies during the earthquake, and with the use of the Mohr-Coulomb soil model for the clay-like embankment soils which remain at constant volume during undrained loading. However, the Mohr-Coulomb model for the embankment soils keeps the shear modulus of the embankment soils constant during shaking when, in fact, there may be some reduction in the shear modulus due to cyclic loading. A reduction in shear modulus due to cyclic loading would cause an additional component of permanent displacement (primarily settlement) due to shearing of the embankment soils at constant volume under gravity. This phenomenon appears to be consistent with the measured performance of Lenihan Dam during the Loma Prieta earthquake as described by TGP in the engineering analyses report for that dam [Report No. LN-4 (Terra / GeoPentech, 2012c)]. We have evaluated the effect of having a 10 to 20% reduction in shear modulus of the embankment soils at Stevens Creek Dam and found that it could increase the estimated vertical displacements from a maximum of 0.2 feet to a maximum of 0.5 to 1 foot. Consequently, we recommend that an estimated maximum vertical settlement of the crest of 1 foot be used for our seismic safety evaluation.
The analysis results for the SMV1 Kobe input motion that gave the highest crest displacement are presented graphically herein as the key example results. Figure 5-8 presents the input time histories and response spectrum for the SMV1 Kobe evaluation motion. Figure 5-9 compares the response spectra of acceleration time histories computed at four points (i.e. buttress, top of original crest, top of the new crest, and the mid-height of downstream slope) using both QUAD4MU and FLAC. Figure 5-9 indicates that the seismic responses of the FLAC equivalent linear model induced by the SMV1 Kobe input motion appear reasonable for the purposes of calculating the seismic displacements.
Figure 5-10 shows the seismic displacement contours for the SMV1 Kobe case for an alluvium residual strength equal to 0.19 σ'vc; seismic displacement vectors with numbers corresponding to the computed seismic displacements in feet are shown for four points (i.e., the crest, the mid-heights of the upstream and downstream slopes, and the top of the upstream buttress). Figure 5-11 shows the seismic displacement vectors. The calculated seismic displacement values are not large, but there is a general trend of predominantly horizontal seismically-induced movements in a downstream direction, which is consistent with the expected effect of the liquefied alluvium layer. The seismic displacement vectors shown appear reasonable and consistent with the expected trend due to liquefaction of the alluvium layer.
Figure 5-12 shows the seismic displacement contours for the SMV1 Kobe case for an alluvium residual strength equal to 0.28 σ'vc. Figure 5-13 shows that, for this case, the seismic displacement vectors are lower by a factor of about 2, but the pattern of displacement remains similar, as expected.
Figure 5-14 shows time histories of seismic displacements at three selected points on the surface of the embankment (i.e., the top of the upstream buttress, the crest, and the mid-height of the downstream slope), all for the SMV1 Kobe case, and different assignment of residual shear
SECTION 5.0 SEISMIC DEFORMATION ANALYSES
SSE2 Rpt SC-3 Final.docx 5-7x
strength. The combination of the results shown on Figures 5-10 through 5-14 provides an appreciation of the computed seismic deformations within the embankment for this case.
The sensitivity of the computed permanent seismic displacements to the timing of triggering of liquefaction was evaluated by comparing the displacements shown in Table 5-2 (that include triggering when ru equals 1) to displacements calculated assuming the soil liquefies at the start of shaking. These analyses showed that the simple but unrealistic assumption that liquefaction occurs at the start of shaking leads to a maximum calculated horizontal crest displacement of 4.6 feet (for the Chi Chi input motion), rather than a maximum horizontal crest displacement of 3.1 feet (for the Kobe input motion) considering triggering during shaking. For the Chi Chi input ground motion, assuming liquefaction occurs at the start of shaking increases the seismic displacement by 0 to 2.5 feet, with an average increase of 1 foot. For the Kobe input ground motion (that produced the maximum crest displacement considering triggering), there was no increase in seismic displacement when triggering of liquefaction was assumed to occur at the start of shaking.
Upon review of our analyses, DSOD commented that the finite different mesh should be finer than that shown on Figure 5-3, particularly in the alluvium. Thus, the sensitivity of the computed permanent seismic displacements to the fineness of the finite difference mesh was evaluated by repeating the analyses for the Kobe input ground motion using a finite difference mesh that contained four times the number of calculation points. The analyses with four times the number of calculation points gave the same results as the analyses with the grid that is shown on Figure 5-3 and showed that adjustments to the fineness of the mesh were not necessary.
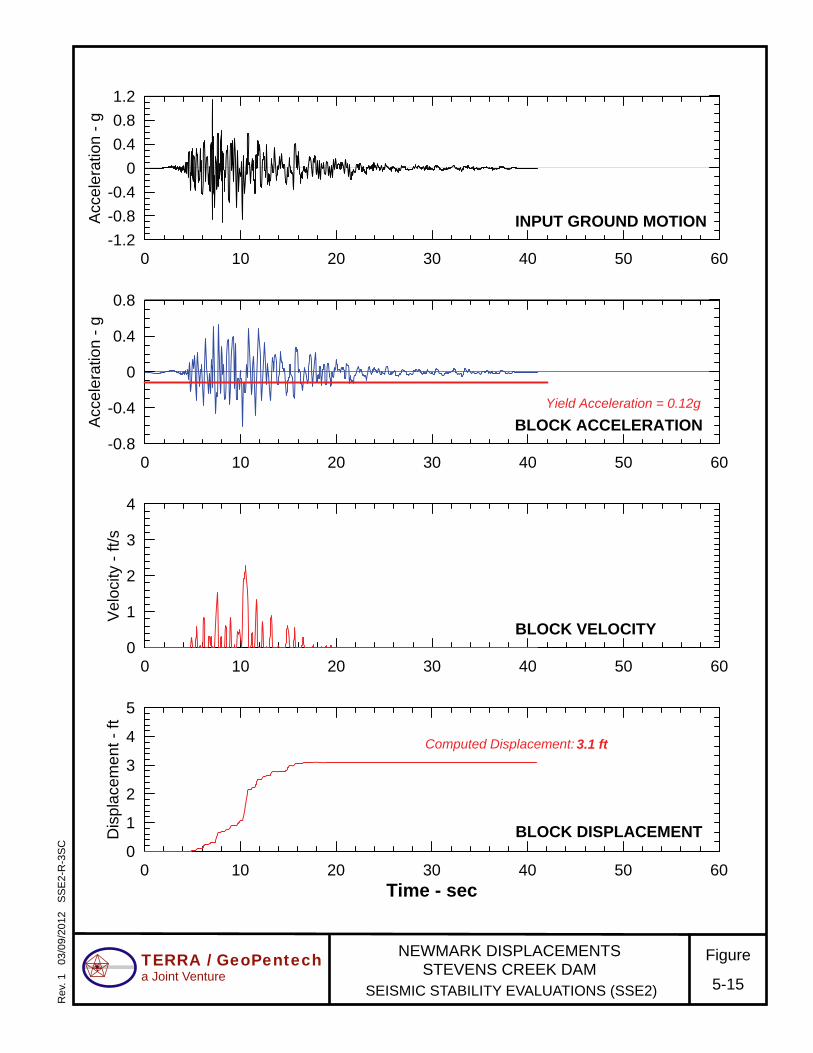
A "full-Newmark analysis" (Newmark, 1965 and Barneich et al., 1996) was run for the controlling ground motion, which was found to be the Kobe time history scaled for the Stanford-Monte Vista event. Figure 5-15 summarizes the results of this full-Newmark analysis. The top panel on Figure 5-15 shows the acceleration time history for the input ground motion. The second panel shows the average acceleration time history (as calculated by the QUAD4MU analyses) acting on a representative sliding block with a yield acceleration of 0.12 g. The lower two panels depict the time history of block velocity and block displacement. The magnitude and time history of block displacement from this full-Newmark analysis are in the same range in terms of amplitude of displacement and time history of crest displacement as those from the FLAC analyses shown on Figure 5-14.
5.6.2 Assessment of Analyses Results and Dam Performance
5.6.2.1 Seismic Deformations and Transverse Cracking
As discussed in Section 5.6.1, the maximum calculated permanent seismic displacements of the dam using a residual shear strength for the alluvium of 0.19 ’
vc (corresponding to an (N1)60 value of 20 blows/ft) are approximately 3 feet of horizontal movement and 1 foot of vertical movement (settlement) at the dam crest. Because of the downstream berm added to the dam in 1986, the freeboard was increased by 10 feet so that there is now a minimum of 19 feet of freeboard above the spillway operating level. Given 19 feet of freeboard, and a maximum of 1 foot settlement under the ground motions that represent the MCE, we have concluded there will be no significant loss of freeboard due to earthquake loading.
SECTION 5.0 SEISMIC DEFORMATION ANALYSES
SSE2 Rpt SC-3 Final.docx 5-8x
The potential for transverse cracking associated with the reduction in horizontal crest displacement from approximately 3 feet at the maximum section to smaller amounts towards the abutments of the dam was evaluated by reviewing the geometry of the dam at a longitudinal section cut along the station line for the dam crest formed by the downstream buttress constructed in 1986. This longitudinal section is shown on Figure 5-16. The reservoir level at the elevation of the spillway crest (i.e. normal maximum pool level) is at elevation 537.8 feet. The downstream buttress is 50 feet wide and extends to elevation 556.8 feet, nominally 19 feet above the spillway elevation, between Stations 5+10 and 10+40. The crest of the downstream buttress slopes down uniformly to the elevation of the original dam crest between Station 10+40 and the left abutment and between Station 5+10 and the spillway at the right abutment.
The geometry of the embankment and the valley, and the thickness and nature of soils left in place beneath the embankment are also shown on the longitudinal section on Figure 5-16. Review of this longitudinal section indicates that the maximum movements (at Station 7+50) will occur within the portion of the embankment underlain by younger alluvium where the embankment height is greatest. The movements will reduce considerably at the transitions to the older alluvium on either side of the younger alluvium. On the left side of the valley, the transition in embankment height towards the left abutment is smooth and regular, without sudden change. On the right side of the valley, the transition in embankment height from the right edge of the alluvium (at about Station 6+80) is very gradual to about Station 6+40 and is followed by a sharper transition to about Station 6+10. Beyond Station 6+10 the remaining transition in embankment height is accommodated very slowly and progressively towards the right abutment. In our opinion, none of these geometries provides significant risk of major transverse cracking for the estimated levels of displacement. Moreover, the embankment geometry and materials are unusually favorable with regard to accommodating the types of movements projected, and reducing the potential for transverse cracking associated with these movements. Nineteen feet of freeboard is available and, at the elevation of the spillway crest, the dam is 130 feet wide. Additional protection is provided by the inclined chimney drain separating the downstream berm from the original downstream embankment section. In summary, the risk of transverse cracking is very low and the dam geometry provides good protection to limit the effects of transverse cracking in the unlikely event cracking were to develop.
Based on their independent analyses, DSOD estimated that the permanent seismic deformations of the dam may range from 1 to 3 feet of crest settlement and 5 to 10 feet of lateral displacement for the range of ground motions and soil strengths they considered. DSOD concluded that their estimated vertical movements were acceptable because of the 19 feet of freeboard of the dam. They also concluded that if transverse cracking associated with their estimated lateral movements were to occur it could be controlled by the inclined filter that separates the original downstream slope of the dam from the downstream berm. In summary, although the estimates of movement developed by TGP and DSOD differ, the conclusions related to adequacy of dam freeboard and potential for transverse cracking at the crest are the same.
5.6.2.2 Longitudinal Cracking
The potential for longitudinal cracking was also evaluated by TGP at the main section. The pattern of seismic displacements shown on Figure 5-11 (where the upstream buttress meets the upstream slope) indicates there may be some potential for the development of low confining
SECTION 5.0 SEISMIC DEFORMATION ANALYSES
SSE2 Rpt SC-3 Final.docx 5-9x
stresses in that area. These low confining stresses, if they were to occur, could lead to longitudinal cracking. To further investigate this potential, the change in confining stress at this location associated with the shaking was evaluated. The results of this evaluation are presented on Figure 5-17. As can be seen, the horizontal confining stresses actually increase in this region as a result of shaking and, consequently, longitudinal cracking was not a concern based on TGP’s analyses.
However, DSOD concluded, based on their own FLAC analyses, that longitudinal cracks on the upstream slope near the connection between the upstream berm and the original dam had the potential to open following the earthquake. DSOD postulated that longitudinal cracks starting in this area could extend to the alluvium (see Figure 5-18). DSOD indicated that the potential for longitudinal cracking was of concern because such cracking could allow the full reservoir head to be applied to the underlying alluvium layer and potentially lead to erosion and piping of the underlying alluvium layer and/or high uplift pressures at the toe of the dam. DSOD indicated that remedial measures would be needed to mitigate these concerns, and suggested that, as a minimum, some treatment at the toe of the dam would be needed to prevent piping or uplift due to the cracking.
TGP and the District have concluded that the potential for longitudinal cracking, although very unlikely, cannot be completely ruled out considering the results of DSOD's analyses. Consequently, the District decided to evaluate and implement remedial measures that may include treatment at the toe of the dam to mitigate the potential for piping and/or uplift due to the cracking, and/or replacement or treatment of the alluvium in the area near the toe of the dam to reduce seismic deformations and eliminate the cracking concern.
SECTION 6.0 SUMMARY
SSE2 Rpt SC-3 Final.docx 6-1x
6. Section 6 Summary and Conclusions
6.1 GENERAL
The purpose of the engineering analyses documented in this report is to evaluate the seismic performance and safety of Stevens Creek Dam during the Maximum Credible Earthquake. The report reviews previous findings related to site characterization, material properties and ground motions; and then discusses seepage analyses, static stability analyses, pseudo-static yield acceleration, and seismic deformation analyses. A brief summary of each of these topics is presented below, followed by our conclusions and recommendations regarding the seismic safety evaluation of the dam.
6.2 SITE CHARACTERIZATION, MATERIAL PROPERTIES AND GROUND MOTIONS The key findings related to site characterization, material properties, and ground motions are as follows:
1. There is little difference in the physical and index properties and shear strength of the upstream "impervious" and downstream "pervious" embankments. However, the significance of these original embankment designations is that alluvium was removed beneath the upstream "impervious" embankment but left in place beneath the downstream "pervious" embankment.
2. The upstream and downstream embankments are generally classified as clayey sand with gravel. The clay matrix was found to control the behavior of these materials and they were determined to be non-liquefiable and to have a relatively high undrained shear strength.
3. The upstream buttress constructed in 1985-1986 was generally founded on Santa Clara Formation bedrock after removal of the alluvium.
4. The base of the downstream buttress constructed in 1985-1986 was not founded on bedrock, but on alluvium left in place in the foundation, overlain by fill material which appears to have been placed downstream of the toe of the original embankment during original dam construction.
5. The alluvium left in place beneath the downstream embankment is functioning as a very effective drainage blanket. The groundwater levels in the alluvium at the maximum dam section are low and the saturated thickness of the alluvium typically varies from 1 foot near the crest to 6 feet near the toe. The saturated thickness of the alluvium is not controlled by the elevation of the water in the reservoir but by groundwater levels in the toe area that vary with precipitation and recharge from releases through the reservoir outlet works into Stevens Creek downstream of the dam.
6. The strength of the alluvium left in place is positively influenced by the low piezometric levels and correspondingly high values of effective confining stresses in the alluvium.
7. Characterization of the liquefaction potential and post-liquefaction residual shear strength of the alluvium is based on estimates of (N1)60 (corrected standard penetration test (SPT) blow counts) derived from BPT test results interpreted using the method proposed by Harder (1997). After several discussions with DSOD, a mean (N1)60 value of 20 blows/foot was agreed-upon for the purpose of the seismic deformation analyses. In addition, an (N1)60 value of 25 blows/foot is used as a benchmark value for calculating and comparing seismic
SECTION 6.0 SUMMARY
SSE2 Rpt SC-3 Final.docx 6-2x
deformations, in order to understand the sensitivity of estimated seismic deformations to the uncertainty in (N1)60 values.
8. Acceleration response spectra were developed for 84th percentile ground motions associated with the Stanford-Monte Vista Fault and the San Andreas Fault. Three seed time histories were chosen for each of these events and spectrally-matched time histories were developed for use in the non-linear seismic deformation analyses.
6.3 SEEPAGE ANALYSES
Seepage analyses are used to define the distribution of groundwater heads and pore pressures under operating reservoir levels. These pore pressures allow effective stresses within the various embankment zones to be defined and, in turn, allow the calculation of undrained shear strengths based on these effective stresses.
The finite element seepage analyses showed good agreement between measured piezometric levels and calculated total heads and provide a reliable basis for defining pore pressures for stability and seismic deformation analyses.
6.4 STATIC STABILITY AND PSEUDO-STATIC YIELD ACCELERATIONS
The factor of safety for steady state seepage under full reservoir level is 1.9 and the factor of safety for rapid drawdown conditions is 2.3; these values exceed the minimum required values of 1.5 and 1.3, respectively, specified by the US Army Corps of Engineers (2003).
The yield acceleration from pseudo-static loading of the dam is 0.12g to 0.14g. The factor of safety of the downstream slope immediately after shaking is 1.9 using the post-liquefaction residual strength for the alluvium based on an (N1)60 value of 20 blows/foot. This indicates there is a large factor of safety against a flow slide in the event that liquefaction were to occur.
6.5 SEISMIC DEFORMATION ANALYSES
The post-liquefaction residual shear strength for the alluvium was estimated using the lower of the two correlation curves between (N1)60-cs and Sr/σ'vc by Idriss and Boulanger (2008). The fines correction for converting (N1)60 to (N1)60-cs adds 1 blow per foot. Consequently the agreed-upon value of (N1)60 value of 20 corresponds to a (N1)60-cs value of 21. Similarly, the benchmark (N1)60 value of 25 corresponds to a (N1)60-cs value of 26. It is noted that 21 and 26 are very conservative and conservative estimates for (N1)60-cs, respectively. The corresponding values of Sr/σ'vc for the alluvium are 0.19 and 0.28 for (N1)60-cs values of 21 and 26, respectively
For a residual shear strength of the alluvium based on a (N1)60 value of 20, the calculated seismically induced permanent horizontal crest displacements range from 0.9 to 3.1 feet downstream and the calculated vertical displacements (settlements) range from 0.1 to 0.2 feet. For a residual shear strength of the alluvium based on a (N1)60 value of 25, the crest displacements drop to 0.2 to 1.5 feet downstream with a vertical settlement of about 0.1 feet.
The vertical displacements associated with the earthquake loading may be somewhat underestimated by the FLAC analyses using a Mohr-Coulomb soil model and, as discussed in Section 5.6.1, we have estimated the maximum vertical displacements may be 0.5 to 1 foot.
SECTION 6.0 SUMMARY
SSE2 Rpt SC-3 Final.docx 6-3x
The sensitivity of the computed permanent seismic displacements to the timing of triggering of liquefaction was evaluated by comparing the displacements based on triggering when ru equals 1 (i.e., the excess pore pressure generated by shaking equals the vertical effective stress) to displacements calculated assuming the soil liquefies at the start of shaking. These analyses showed that the simple but unrealistic assumption that liquefaction occurs at the start of shaking leads to a maximum calculated horizontal crest displacement of 4.6 feet (for the Chi Chi input motion), rather than a maximum horizontal crest displacement of 3.1 feet (for the Kobe input motion) considering triggering during shaking. Assuming liquefaction occurs at the start of shaking increases the seismic displacement by 0 to 2.5 feet, with an average increase of 1 foot. For the Kobe input ground motion (that produced the maximum crest displacement considering triggering), there was no increase in seismic displacement when triggering of liquefaction was assumed to occur at the start of shaking.
6.6 CONCLUSIONS The engineering analyses described herein indicate that Stevens Creek Dam will perform well when subjected to the evaluation ground motions that represent the Maximum Credible Earthquake. Maximum horizontal downstream movement at the crest of about 3 feet, and maximum crest settlement of about 1 foot, have been estimated and are considered inconsequential given the freeboard of 19 feet and the 130-ft dam width at the elevation of the spillway. The likelihood of significant cracks forming in the crest and other areas is considered very low.
Based on their independent analyses, DSOD estimated that the permanent seismic deformations of the dam may range from 1 to 3 feet of crest settlement and 5 to 10 feet of lateral displacement for the range of ground motions and soil strengths they considered. DSOD concluded that their estimated vertical movements were acceptable because of the 19 feet of freeboard of the dam. They also concluded that if transverse cracking associated with their estimated lateral movements were to occur it could be controlled by the inclined filter that separates the original downstream slope of the dam from the downstream berm. In summary, although the estimates of movement developed by TGP and DSOD differ, the conclusions related to adequacy of dam freeboard and potential for transverse cracking are the same.
However, DSOD concluded, based on their own FLAC analyses, that longitudinal cracks on the upstream slope near the connection between the upstream berm and the original dam had the potential to open following the earthquake. DSOD postulated that longitudinal cracks starting in this area could extend to the alluvium. DSOD indicated that the potential for longitudinal cracking was of concern because such cracking could allow the full reservoir head to be applied to the underlying alluvium layer and potentially lead to erosion and piping of the underlying alluvium layer and/or high uplift pressures at the toe of the dam. DSOD indicated that remedial measures would be needed to mitigate these concerns, and suggested that, as a minimum, some treatment at the toe of the dam would be needed to prevent piping or uplift due to the cracking.
TGP and the District have concluded that the potential for longitudinal cracking, although very unlikely, cannot be completely ruled out considering the results of DSOD's analyses. Consequently, the District decided to evaluate and implement remedial measures that may include treatment at the toe of the dam to mitigate the potential for piping and/or uplift due to the
SECTION 6.0 SUMMARY
SSE2 Rpt SC-3 Final.docx 6-4x
cracking, and/or replacement or treatment of the alluvium in the area near the toe of the dam to reduce seismic deformations and eliminate the cracking concern.
6.7 RECOMMENDATIONS
We recommend that the District evaluate implementation of remedial measures at the toe of the dam as discussed in Section 6.6. In addition, we recommend that piezometric levels, vertical and lateral movements, and seepage flows continue to be monitored and evaluated to assure the continued safe operation of the dam. We also recommend that the condition of the dam be inspected immediately following future earthquakes to check that movements are consistent with those expected based on our engineering analyses and/or the independent engineering analyses by DSOD.
SECTION 7.0 REFERENCES
SSE2 Rpt SC-3 Final.docx 7-1x
7. Section 7 References
Barneich, J.A., Beikae, M., Luebbers, M., and Osmun, D., 1996 (July), Seismic Deformation Analysis of Eastside Reservoir Dams, The Sixteenth USCOLD Annual Meeting and Lecture.
Baziar, M.H., and Dobry, R. 1995. Residual strength and large deformation potential of loose silty sands. Journal of Geotechnical Engineering, ASCE, 121(12): 896–906.
Darendeli, M.B. and Stokoe, K.H., 2001, Development of a new family of normalized modulus reduction and material damping curves, Geotech. Engrg. Rpt. GD01-1, University of Texas, Austin, Texas.
Dawson,E.M. and Mejia, L.H. (2012), Updates to a Practice-Oriented Liquefaction Model, GeoCongress ASCE.
Electrical Power Research Institute (EPRI), 1993, Guidelines for Site Specific Ground Motions Electrical Power Research Institute, Palo Alto, CA, November-TR-102293.
Harder, L. F., Jr., 1997, Application of the Becker Penetration Test for Evaluating the Liquefaction Potential of Gravelly Soils. Proc., NCEER Workshop on Evaluation of Liquefaction Resistance of Soils, National Center for Engineering Research, Buffalo, 129–148.
Idriss, I.M., Lysmer, J., Hwang, R. and Seed, H.B., 1973, “Quad-4 A computer program for evaluating the seismic response of soil structures by variable damping finite element procedures.” Department of Civil Engineering, University of California, Berkeley, EERC 73-16.
Idriss, I.M. and Boulanger, R.W.,(2008), Soil Liquefaction During Earthquakes, EERI, MNO-12
Ishihara, K. 1993. Liquefaction and flow failure during earthquakes, Géotechnique, 43(3): 351–415.
Itasca, 2008, FLAC, version 6.0, Itasca Consulting Group Inc., Minneapolis.
Newmark, N.M., 1965, “Effects of Earthquakes on Dams and Embankments”, Géotechnique, Vol. 15, No. 2, pp. 139-160.
Olson, S.M. and Stark, T.D., 2002, Liquefied strength ratio from liquefaction flow failure case histories, Canadian Geotechnical Journal, Vol. 39
Santa Clara Valley Water District (SCVWD), 2010 (June), As-constructed foundation topography beneath Stevens Creek Dam, GIS data shape file.
Shannon & Wilson, Inc. (S&W), 1976 (December), Piezometer Installation, Stevens Creek Dam.
Stark, T.D., and Mesri, G. 1992, Undrained shear strength of liquefied sands for stability analysis. Journal of Geotechnical Engineering, ASCE, 118(11): 1727–1747.
Sy, A. and Campanella, R.G., 1994, Becker and Standard Penetration Tests (BPT-SPT) Correlations with Consideration of Casing Friction: Canadian Geotechnical Journal, v. 31, 343–356.
SECTION 7.0 REFERENCES
SSE2 Rpt SC-3 Final.docx 7-2x
Terra / GeoPentech, a Joint Venture, 2012a (February), Seismic Stability Evaluations of Chesbro, Lenihan, Stevens Creek, and Uvas Dams, Phase A: Stevens Creek and Lenihan Dams, Stevens Creek Dam, Site Investigations and Laboratory Testing Data Report (Report No. SC-1), prepared for Santa Clara Valley Water District.
Terra / GeoPentech, 2012b (May), Seismic Stability Evaluations of Chesbro, Lenihan, Stevens Creek, and Uvas Dams, Phase A: Stevens Creek and Lenihan Dams, Stevens Creek Dam, Site Characterization, Material Properties and Ground Motion (Report No. SC-2), prepared for Santa Clara Valley Water District.
Terra / GeoPentech, 2012c (November), Seismic Stability Evaluations of Chesbro, Lenihan, Stevens Creek, and Uvas Dams, Phase A: Stevens Creek and Lenihan Dams, Lenihan Dam, Engineering Analyses (Report No. LN-4), prepared for Santa Clara Valley Water District.
US Army Corps of Engineers, 2003, EM 1110-2-1902 Engineer Manual – Slope Stability.
Vaid, Y.P., and Sivathayalan, S. 1996, Static and cyclic liquefaction potential of Fraser Delta sand in simple shear and triaxial tests. Canadian Geotechnical Journal, 33(2): 281–289.
Vasquez-Herrera, A., and Dobry, R. 1989, Re-evaluation of the Lower San Fernando Dam: Report 3, the behavior of undrained contractive sand and its effect on seismic liquefaction flow failures of earth structures. U.S. Army Corps of Engineers Contract Report GL-89–2, U.S. Army Corps of Engineers Waterways Experiment Station, Vicksburg, Mississippi.
Vucetic, M. and Dobry, R., 1991, Effect of Soil Plasticity on Cyclic Response, Journal of Geotechnical Engineering Division, ASCE, Vol. 117, No. 1, pp.89-107.
W.A. Wahler and Associates, 1978 (December), Seismic Safety Evaluation, Stevens Creek Dam.
Wahler Associates, 1982 (October), Report on Preliminary Remedial Design Investigation of Stevens Creek Dam.
Wahler Associates, 1984 (August), Remedial Design Report, Stevens Creek Dam.
Watson-Lamprey, J. and Abrahamson, N.A., 2006 (February), “Selection of Ground Motion Times Series and Limits on Scaling,” Soil Dynamics and Earthquake Engineering, vol. 26, pp. 477-482.
Woodward-Clyde Consultants (WCC), 1976 (June), Part II – Field Investigations and Engineering Analyses - Seismic Stability Assessment of Four Dams, Santa Clara Valley Water District.
Yoshimine, M., Robertson, P.K., and Wride (Fear), C.E. 1999. Undrained shear strength of clean sands to trigger flow liquefaction. Canadian Geotechnical Journal, 36(5): 891–906.
TABLES
SSE2 Rpt SC-3 Final.docx X
TABLE 2-1 INDEX PROPERTIES OF EMBANKMENT AND FOUNDATION MATERIALS1
Idealized Material
Description
Generalized USCS
Classification
In-Situ Conditions2 Gradation2 Atterberg Limits2
Dry Unit
Weight, d (pcf)
Moisture Content, Wc
(%)
Compaction (%)3
Gravel (%)
Sand (%) Fines (%) Clay
Fraction, -2 (%)
Liquid Limit
LL
Plasticity Index
PI
Upstream Embankment
GC-SC-CL 123.2
(111.7 to 137.5) 12.8
(9.5 to 18.0) 96
(87 to 100) 27
(13 to 57) 44
(36 to 52) 29
(4 to 44) 12
(4 to 15) 29
(15 to 31) 12
(4 to 15)
Downstream Embankment
SC-GC-GM-SM 122.6
(109.7 to 138.5) 12.1
(7.9 to 19.1) 96
(86 to 100) 31
(10 to 63) 43
(12 to 61) 26
(12 to 51) 16
(10 to 23) 29
(23 to 37) 12
(4 to 19)
Buttresses SC-SM-GC 129.3
(114.7 to 141.7) 7.8
(2.2 to 28.8) 97
(84 to 100) 31
(8 to 65) 43
(24 to 62) 26
(5 to 56) 13
(5 to 22) 29
(NP to 35) 12
(NP to 18)
Younger Alluvium
GP-SM-GC-SC 112.0
(94.5 to 128.2) 11.0
(3.4 to 23.1) -
35 (12 to 75)
48 (21 to 88)
17 (4 to 39)
- 21
(NP to 28) 5
(NP to 11)
Older Alluvium GC-GP-SM-SC 128.7
(123.0 to 133.7) 8.9
(2.8 to 16.6) -
32 (21 to 60)
45 (36 to 60)
23 (4 to 48)
- 27
(20 to 33) 11
(4 to 15)
Notes: (1) Data in this table are averages with minimum and maximum values in parenthesis, where available. The limited data available on Filter/Drain are not presented. (2) In-situ conditions, gradation and Atterberg limits are summarized based on laboratory testing of samples performed by S&W(1976), WCC (1976), Wahler (1978, 1982, and
1984), and TGP (2011b). (3) Per D1557 modified, 20,000 ft-lbs.
.
SSE2 Rpt SC-3 Final.docx X
TABLE 2-2 ENGINEERING PROPERTIES OF EMBANKMENT AND FOUNDATION MATERIALS
Notes: (1) Effective Friction Angle, ' (with no cohesion) (2) Undrained Strength Parameter, Su (undrained shear strength)
(2-1) Su = 930 + 0.53 * vc', in psf (3) Residual Strength Parameter, Sr/vc' (residual shear strength ratio) after liquefaction
(3-1) See discussion in Section 5.4.2 of report (4) Dynamic Properties, Vs (shear wave velocity), G/Gmax (shear modulus) and Damping Ratio
(4-1) Vs = exp(0.227 * ln(vc') + 5.26), vc' in psf, Vs in fps (4-2) Vs = exp(0.148 * ln(vc') + 6.15), vc' in psf, Vs in fps (4-3) After liquefaction, the shear modulus of the liquefied alluvium is assumed to be 25 times its residual strength (Sr ) (4-4) Fill located above water table
SSE2 Rpt SC-3 Final.docx X
TABLE 5-1A CHARACTERISTICS OF SELECTED EARTHQUAKE RECORDS
FOR STANFORD-MONTE VISTA EVENT
No. Earthquake
Event Recording
Station Style of
Faulting (1) Magnitude
(Mw) Closest
Distance (km) NEHRP
Site Class/Vs30
Highest Usable Period
(sec) Event Date
1 Kobe Nishi-Akashi SS 6.9 7.1 C/609 8 1/16/1995
2 Loma Prieta LGPC RV/OBL 6.9 3.9 C/478 8 10/18/1989
3 Northridge Sylmar-Olive View Med. FF
RV 6.7 5.3 C/440 8.3 1/17/1994
TABLE 5-1B CHARACTERISTICS OF SELECTED EARTHQUAKE RECORDS
Notes: (1) Location of the Crest and Downstream are shown at right. Positive vertical displacement indicates
settlement. Positive horizontal displacement indicated movement towards downstream. (2) See Sections 2.5 and 5.4.2 for discussion on alluvium residual strength.
1. In-place soils remaining in foundation include younger alluvium in channel area, and older alluvium and/or colluvium on abutments.2. Thicknesses shown are approximate and derived by elevation difference comparison of digitized as-built foundation contours (see note 3) with digitized estimated pre-construction top of Santa Clara Fm. bedrock contours.3. 1936 as-built foundation contours (SCVWD 2010d) locally modified to accord with exploration data and extended upstream through channel area of 1986 buttress foundation using data from as-built pay quantity sections (Wahler 1986a). Note that no as-built topography available for areas of 1986 modifications including along extended outlet excavations.4. Soil thicknesses locally modified as necessary where soils known to have been completely removed along upstream and portions of downstream 1986 outlet extensions.
AREA OF OLDER ALLUVIAL CHANNEL DEPOSITS REMAINING IN UPPER LEFT ABUTMENT
A
B
A
B
C
C
TERRA / GeoPentecha Joint Venture
SEISMIC STABILITY EVALUATIONS (SSE2)
Figure
2-4
ESTIMATED THICKNESS OF SOILS LEFT IN PLACE - STEVENS CREEK DAM
Rev
. 4
04/1
4/20
11
SS
E2-
R-3
SC
CROSS SECTION SHOWING DAM ZONINGSTEVENS CREEK DAM
SEISMIC STABILITY EVALUATIONS (SSE2)
Figure5-1
SECTION A-A (STATION 7+50)
SPILLWAY CREST ELEVATION: 537.8'
SECTION C-C (STATION 4+00)
S.C. ELEVATION: 537.8'
ORIGINAL EMBANKMENT - UPSTREAM
ORIGINAL EMBANKMENT - DOWNSTREAM
UPSTREAM AND DOWNSTREAM BUTTRESSES
FILTER/DRAIN MATERIAL
RIP RAP AT DOWNSTREAM TOE
FILL AT DOWNSTREAM TOE
YOUNGER ALLUVIUM
OLDER ALLUVIUM
BEDROCK - SANTA CLARA FORMATION
LEGEND
Horizontal distance (Feet)
400
-500 -400 -300 -200 -100 0 100 200 300 400
500
600
Ele
vatio
n (F
eet)
Horizontal distance (Feet)
-200 -100 0 100 200
500
600
Ele
vatio
n (F
eet)
INLET STRUCTURE
CENTERLINE OUTLET CONDUIT
OUTLET STRUCTURE
ORIGINAL TOE
ORIGINAL TOE
BUTTRESS TOE
BUTTRESS TOE
NEW CREST
ORIGINAL CREST
N
2+00
3+00
4+00
5+00
6+007+00
8+009+00
10+0011+00
A
A
C
C
Location Key(See Figure 2-2)
Figure
2-5
CROSS SECTIONS SHOWING DAM ZONINGSTEVENS CREEK DAM
TERRA / GeoPentech a Joint Venture
SEISMIC STABILITY EVALUATIONS (SSE2)
Rev
. 1
06/0
9/20
11
SS
E2-
R-3
SC
STEVENS CREEK DAM MODULUSREDUCTION & DAMPING RATIO
SEISMIC STABILITY EVALUATIONS (SSE2)
Figure5-12
0.0001 0.001 0.01 0.1 1 10
Cyclic Shear Strain, gc - %
0
0.2
0.4
0.6
0.8
1G
/Gm
ax
All Emb. (PI=12)
0.0001 0.001 0.01 0.1 1 10
Cyclic Shear Strain, gc - %
0
5
10
15
20
25
30
Dam
pin
gR
atio
-%
All Emb. (PI=12)
Note: Modulus reduction and damping ratio curves are based on Vucetic and Dobry, 1991
Figure
2-6
MODULUS REDUCTION & DAMPING RATIO,EMBANKMENT - STEVENS CREEK DAM
TERRA / GeoPentecha Joint Venture
SEISMIC STABILITY EVALUATIONS (SSE2)
Rev
. 0
04/2
0/20
11
SS
E2-
R-3
SC
STEVENS CREEK DAM MODULUSREDUCTION & DAMPING RATIO
SEISMIC STABILITY EVALUATIONS (SSE2)
Figure5-37
0.0001 0.001 0.01 0.1 1 10
Cyclic Shear Strain, gc - %
0
0.2
0.4
0.6
0.8
1G
/Gm
ax
Alluvium vc': 0-5,000 psf
Alluvium vc': 5,000-10,000 psf
Alluvium vc': 10,000-15,000 psf
0.0001 0.001 0.01 0.1 1 10
Cyclic Shear Strain, gc - %
0
5
10
15
20
25
30
Dam
pin
gR
atio
-%
Alluvium vc': 0-5,000 psf
Alluvium vc': 5,000-10,000 psf
Alluvium vc': 10,000-15,000 psf
Note: Modulus reduction and damping ratio curves are based on Darendeli and Stokoe, 2001
Figure
2-7
MODULUS REDUCTION & DAMPING RATIO,ALLUVIUM - STEVENS CREEK DAM
TERRA / GeoPentecha Joint Venture
SEISMIC STABILITY EVALUATIONS (SSE2)
Rev
. 0
04/2
0/20
11
SS
E2-
R-3
SC
SPECTRALLY MATCHED KOBE E/Q,NISHI-AKASHI (FN) RECORD
SEISMIC STABILITY EVALUATIONS (SSE2)
Figure6-8
FAULT NORMAL
0.01 0.1 1 10Period - sec
0
0.5
1
1.5
2
2.5
3
Spe
ctra
lAcc
eler
atio
n-
g
0 10 20 30 40-1.2
-0.8
-0.4
0
0.4
0.8
1.2A
ccel
erat
ion
-g
0 10 20 30 40-150
-100
-50
0
50
100
150
Vel
ocity
-cm
/s
0 10 20 30 40-100
-50
0
50
100
Dis
plac
emen
t-cm
DAMPING RATIO=5%
0 10 20 30 40Time - sec
0
2
4
6
8
10
12
Aria
sIn
tens
ity,I
a-
m/s
RecommendedFN Spectrum
Ia from Watson-Lamprey (2007)@84th Percentile [7.5 m/s]
Kobe - Nishi-AkashiStrike Slip Event
Matched to S-MV Event
Ia minus
Ia plus
Figure
2-8
SPECTRALLY MATCHED KOBE E/Q, NISHI-AKASHI (FN) RECORD
TERRA / GeoPentecha Joint Venture
SEISMIC STABILITY EVALUATIONS (SSE2)
Rev
. 0
06/0
9/20
11
SS
E2-
R-3
SC
SPECTRALLY MATCHED LOMA PRIETA,LOS GATOS PC (FN) RECORD
SEISMIC STABILITY EVALUATIONS (SSE2)
Figure6-9
FAULT NORMAL
0.01 0.1 1 10Period - sec
0
0.5
1
1.5
2
2.5
3
Spe
ctra
lAcc
eler
atio
n-
g
0 10 20 30 40-1.2
-0.8
-0.4
0
0.4
0.8
1.2A
ccel
erat
ion
-g
0 10 20 30 40-150
-100
-50
0
50
100
150
Vel
ocity
-cm
/s
0 10 20 30 40-100
-50
0
50
100
Dis
plac
emen
t-cm
DAMPING RATIO=5%
0 10 20 30 40Time - sec
0
2
4
6
8
10
12
Aria
sIn
tens
ity,I
a-
m/s
RecommendedFN Spectrum
Ia from Watson-Lamprey (2007)@84th Percentile [7.5 m/s]
Loma Prieta - LGPCReverse Oblique EventMatched to S-MV Event
Ia minus
Ia plus
Figure
2-9
SPECTRALLY MATCHED LOMA PRIETA E/Q, LGPC (FN) RECORD
TERRA / GeoPentecha Joint Venture
SEISMIC STABILITY EVALUATIONS (SSE2)
Rev
. 0
06/0
9/20
11
SS
E2-
R-3
SC
SPECTRALLY MATCHED NORTHRIDGE,SYLMAR OVMFF (FN) RECORD
SEISMIC STABILITY EVALUATIONS (SSE2)
Figure6-10
FAULT NORMAL
0.01 0.1 1 10Period - sec
0
0.5
1
1.5
2
2.5
3
Spe
ctra
lAcc
eler
atio
n-
g
0 10 20 30 40-1.2
-0.8
-0.4
0
0.4
0.8
1.2A
ccel
erat
ion
-g
0 10 20 30 40-150
-100
-50
0
50
100
150
Vel
ocity
-cm
/s
0 10 20 30 40-100
-50
0
50
100
Dis
plac
emen
t-cm
DAMPING RATIO=5%
0 10 20 30 40Time - sec
0
2
4
6
8
10
12
Aria
sIn
tens
ity,I
a-
m/s
RecommendedFN Spectrum
Ia from Watson-Lamprey (2007)@84th Percentile [7.5 m/s]
Northridge - Sylmar OVMFFReverse Event
Matched to S-MV Event
Ia minus
Ia plus
Figure
2-10
SPECTRALLY MATCHED NORTHRIDGE E/Q, SYLMAR COUNTY HOSP. (FN) RECORD
TERRA / GeoPentecha Joint Venture
SEISMIC STABILITY EVALUATIONS (SSE2)
Rev
. 0
06/0
9/20
11
SS
E2-
R-3
SC
SPECTRALLY MATCHED MANJIL,ABBAR (FN) RECORD
SEISMIC STABILITY EVALUATIONS (SSE2)
Figure6-18
FAULT NORMAL
0.01 0.1 1 10Period - sec
0
0.5
1
1.5
2
2.5
3
Spe
ctra
lAcc
eler
atio
n-
g
0 10 20 30 40 50 60 70 80 90-0.8
-0.4
0
0.4
0.8A
ccel
erat
ion
-g
0 10 20 30 40 50 60 70 80 90-150
-100
-50
0
50
100
150
Vel
ocity
-cm
/s
0 10 20 30 40 50 60 70 80 90
-200
-100
0
100
200
Dis
plac
emen
t-cm
DAMPING RATIO=5%
0 10 20 30 40 50 60 70 80 90Time - sec
0123456789
101112131415
Aria
sIn
tens
ity,I
a-
m/s
RecommendedFN Spectrum
Ia from Watson-Lamprey (2007)@84th Percentile [5.95 m/s]
Manjil - AbbarStrike Slip Event
Matched to San Andreas
Ia minus
Ia plus
Max Est.29 sec
Min Est.16 sec
0 10 20 30 40Duration, D5-95 - sec
CurrentRecord
Figure
2-11
SPECTRALLY MATCHED MANJIL E/Q, ABBAR (FN) RECORD
TERRA / GeoPentecha Joint Venture
SEISMIC STABILITY EVALUATIONS (SSE2)
Rev
. 0
06/0
9/20
11
SS
E2-
R-3
SC
SPECTRALLY MATCHED CHI CHI,TCU065 (FN) RECORD
SEISMIC STABILITY EVALUATIONS (SSE2)
Figure6-19
FAULT NORMAL
0.01 0.1 1 10Period - sec
0
0.5
1
1.5
2
2.5
3
Spe
ctra
lAcc
eler
atio
n-
g
0 10 20 30 40 50 60 70 80 90-0.8
-0.4
0
0.4
0.8A
ccel
erat
ion
-g
0 10 20 30 40 50 60 70 80 90-150
-100
-50
0
50
100
150
Vel
ocity
-cm
/s
0 10 20 30 40 50 60 70 80 90
-200
-100
0
100
200
Dis
plac
emen
t-cm
DAMPING RATIO=5%
0 10 20 30 40 50 60 70 80 90Time - sec
0123456789
101112131415
Aria
sIn
tens
ity,I
a-
m/s
RecommendedFN Spectrum
Ia from Watson-Lamprey (2007)@84th Percentile [5.95 m/s]
Chi Chi - TCU065Reverse/Oblique Event
Matched to San Andreas
Ia minus
Ia plus
Max Est.29 sec
Min Est.16 sec
0 10 20 30 40Duration, D5-95 - sec
CurrentRecord
Figure
2-12
SPECTRALLY MATCHED CHI CHI E/Q, TCU065 (FN) RECORD
TERRA / GeoPentecha Joint Venture
SEISMIC STABILITY EVALUATIONS (SSE2)
Rev
. 0
06/0
9/20
11
SS
E2-
R-3
SC
SPECTRALLY MATCHED LANDERS,LUCERNE (FN) RECORD
SEISMIC STABILITY EVALUATIONS (SSE2)
Figure6-20
FAULT NORMAL
0.01 0.1 1 10Period - sec
0
0.5
1
1.5
2
2.5
3
Spe
ctra
lAcc
eler
atio
n-
g
0 10 20 30 40 50 60 70 80 90-0.8
-0.4
0
0.4
0.8A
ccel
erat
ion
-g
0 10 20 30 40 50 60 70 80 90-150
-100
-50
0
50
100
150
Vel
ocity
-cm
/s
0 10 20 30 40 50 60 70 80 90
-200
-100
0
100
200
Dis
plac
emen
t-cm
DAMPING RATIO=5%
0 10 20 30 40 50 60 70 80 90Time - sec
0123456789
101112131415
Aria
sIn
tens
ity,I
a-
m/s
RecommendedFN Spectrum
Ia from Watson-Lamprey (2007)@84th Percentile [5.95 m/s]
Landers - LucerneStrike Slip Event
Matched to San Andreas
Ia minus
Ia plus
Max Est.29 sec
Min Est.16 sec
0 10 20 30 40Duration, D5-95 - sec
CurrentRecord
Figure
2-13
SPECTRALLY MATCHED LANDERS E/Q, LUCERNE (FN) RECORD
TERRA / GeoPentecha Joint Venture
SEISMIC STABILITY EVALUATIONS (SSE2)
Rev
. 0
06/0
9/20
11
SS
E2-
R-3
SC
UPSTREAM BUTTRESS
UPSTEAMEMBANKMENT
SANTA CLARA FORMATION
DOWNSTREAMEMBANKMENT
FILTER/DRAINDOWNSTREAM
BUTTRESS
RIPRAP AT TOE OF DAM
DOWNSTREAM BUTTRESS CREST APPROX. ELEV. 557 FEET
ORIGINAL DAM CREST APPROX. ELEV. 547 FEET
SPILLWAY CREST ELEV. 537.8 FEET
CUT-OFF TRENCHALLUVIUM (TYP.)
LOCATIONS OF PNEUMATIC PIEZOMETERS INSTALLED IN 1985
560
540
520
500
480
460
440
420
400
560
540
520
500
480
460
440
420
400
ELE
VA
TIO
N, F
EE
T
B-5
B-9
B-8
B-7
B-4
B-2
B-1
2.51
2.51
2.51
B-3
FILL
Pneumatic Piezometer Tip
UPSTREAM BUTTRESS
UPSTEAMEMBANKMENT
SANTA CLARA FORMATION
DOWNSTREAMEMBANKMENT
FILTER/DRAIN
DOWNSTREAM BUTTRESS
RIPRAP AT TOE OF DAM
DOWNSTREAM BUTTRESS CREST APPROX. ELEV. 557 FEET
ORIGINAL DAM CREST APPROX. ELEV. 547 FEET
SPILLWAY CREST ELEV. 537.8 FEET
CUT-OFF TRENCHALLUVIUM (TYP.)
LOCATIONS OF NEW CASAGRANDE AND VIBRATING WIRE PIEZOMETERS
560
540
520
500
480
460
440
420
400
560
540
520
500
480
460
440
420
400
ELE
VA
TIO
N, F
EE
T
APPROXIMATE SCALE IN FEET
30 0 30 60
2.51
2.51
2.51
FILL
Vibrating Wire Piezometer TipCasagrande Piezometer Tip
SC-103
SC-104
SC-102
SC-101
TERRA / GeoPentecha Joint Venture
SEISMIC STABILITY EVALUATIONS (SSE2)
Figure
3-1
LOCATIONS OF PIEZOMETERS ATSTATION 7+50 - STEVENS CREEK DAM
Rev
. 0
05/1
5/20
12
SS
E2-
R-3
SC
KL
-200 -100 0 100 200
400
500
600
El. 538 ft
Alluvium
Downstream buttress / drain
Santa Clara Formation
509
485
493
481
449442452
485
473
Only embankment piezometers are shown.
Piezometric heads in alluvium are below top of alluvium.
Notes:
1.
2.
Location of pneumatic piezometer tip and maximum measured head (2001 to 2010)
Location of vibrating wire piezometer tip and measured head (February 2011)
502
493
LEGEND
Rev
.005
/16/
2012
SS
E2-
R-3
SC
Figure
3-2
MEASURED PIEZOMETRIC HEADSSTEVENS CREEK DAM
TERRA / GeoPentecha Joint Venture
SEISMIC STABILITY EVALUATIONS (SSE2)
KL
-200 -100 0 100 200
400
500
600
El. 538 ft
Alluvium
Downstream buttress / drain
Santa Clara Formation
509
485
493
481
449442452
485
473
530520
510500
480490
460470
450440
All embankment zones modeled using: Kv = 1 10-7 cm/sec Kh = 2 10-6 cm/sec
Downstream buttress/drain, alluvium and Santa Clara Formation are outside of the Plaxis model and are handled using appropriate boundary conditions.
Pressure head at top of alluvium is zero.
Santa Clara Formation modeled as impermeable.
Notes:
1.
2.
3.
4.
LEGEND
Location of pneumatic piezometer tip andmaximum measured head (2001 to 2010)
Location of vibrating wire piezometer tip and measured head (February 2011)
Equipotential line for 510 feet of piezometric head
502
493
510
Rev
.005
/16/
2012
SS
E2-
R-3
SC
Figure
3-3
RESULTS OF PLAXIS SEEPAGE ANALYSES STEVENS CREEK DAM
TERRA / GeoPentecha Joint Venture
SEISMIC STABILITY EVALUATIONS (SSE2)
-200 -100 0 100 200 300 400410
420
430
440
BOTTOM OF ALLUVIUM
TOP OF ALLUVIUM
DISTANCE FROM CENTERLINE OF NEW CREST, FEET
ELE
VA
TIO
N, F
EE
T
VERTICAL SCALE EXAGERATED 10 TIMES
CALCULATED PHREATIC SURFACE
kh = 2 x 10⁻³ cm/sec
MEASURED GROUNDWATER LEVELS (12/16/2010)
-200 -100 0 100 200 300 400400
420
440E
LEV
AT
ION
,F
EE
T
BOTTOM OF ALLUVIUM
TOP OF ALLUVIUM
DISTANCE FROM CENTERLINE OF NEW CREST, FEET
CALCULATED PHREATIC SURFACE
Figure
3-4
CALCULATED VS. MEASURED GROUNDWATER LEVELS IN ALLUVIUM - STEVENS CREEK DAM
TERRA / GeoPentecha Joint Venture
SEISMIC STABILITY EVALUATIONS (SSE2)
Rev
. 0
12/1
1/20
12
SS
E2-
R-3
SC
SPILLWAY CREST ELEVATION: 538'
400800
1,2001,600
2,0002,400
2,8003,2003,6004,000
4,8005,400
6,400
400
-500 -400 -300 -200 -100 0 100 200 300 400
500
600
Ele
vatio
n (F
eet)
Horizontal Distance (Feet)
“LOWER” PHREATIC SURFACE AT TOP OF ALLUVIUM
“UPPER” PHREATIC SURFACE
400 psf pore pressure contour400
LEGEND
Figure
3-5
PORE PRESSURE CONTOURS FROMSEEPAGE ANALYSES - STEVENS CREEK DAM
TERRA / GeoPentech a Joint Venture
SEISMIC STABILITY EVALUATIONS (SSE2)
Rev
. 0
05/1
0/20
12
SS
E2-
R-3
SC
-500 -400 -300 -200 -100 0 100 200 300 400
Horizontal Distance (feet)
400
500
600
Ele
vatio
n (f
eet)
7-8
6-7
5-64-53-42-31-2
0-1
Shear Strength (ksf)
Su (embankment) = 0.93 ksf + 0.53 ’vc (ksf)
Sr (alluvium) = 0.19 ’vc
Figure
4-1
CALCULATED SHEAR STRENGTHSTEVENS CREEK DAM
TERRA / GeoPentech a Joint Venture
SEISMIC STABILITY EVALUATIONS (SSE2)
Rev
. 0
05/1
0/20
12
SS
E2-
R-3
SC
400
-500 -400 -300 -200 -100 0 100 200 300 400
500
600
SPILLWAY CREST ELEVATION: 537.8'
Horizontal Distance (Feet)
Ele
vatio
n (F
eet)
DRAINED ANALYSES WITH STEADY STATE SEEPAGE
FS = 1.9
FS = 2.6
400
-500 -400 -300 -200 -100 0 100 200 300 400
500
600
Horizontal Distance (Feet)
Ele
vatio
n (F
eet)
RAPID DRAWDOWN ANALYSIS
FS = 2.3
Figure
4-2
RESULTS OF STATIC STABILITY ANALYSESSTEVENS CREEK DAM
1. Geometry of embankment from as-built drawings of 1986 Dam Modifications.
2. Thickness of alluvium and colluvium from Report No. SC-2 (Terra /GeoPenetch, 2012c).
MAXIMUM RESERVOIR OPERATING LEVEL ELEV. 537.8 FEET
EMBANKMENT
YOUNGER ALLUVIUM
OLDER ALLUVIUM / COLLUVIUM
SANTA CLARA FORMATION
LEGEND
TERRA / GeoPentecha Joint Venture
SEISMIC STABILITY EVALUATIONS (SSE2)
Figure
5-16
LONGITUDINAL SECTION ALONG NEW CRESTSTEVENS CREEK DAM
Rev
. 0
06/0
6/20
12
SS
E2-
R-3
SC
Horizontal Distance (feet)
-300 -200 -100 0
Horizontal Distance (feet)
-300 -200 -100 0
Horizontal Distance (feet)
-300 -200 -100 0
400
500
400
500
Ele
vatio
n (f
eet)
400
500
Ele
vatio
n (f
eet)
>12.5
10-12.5
7.5-10
5-7.5
2.5-5
0-2.5
Stress(ksf)
Change in Horizontal Effective Stressfrom Initial Stress
> 100 % decrease
50 to 100 % decrease
0 to 50 % decrease
0 to 50 % increase
50 to 100 % increase
> 100 % increase
Horizontal Effective StressBefore Shaking
Horizontal Effective StressAfter Shaking
Change in Horizontal EffectiveStress
Figure
5-17
CHANGES IN HORIZONTAL EFFECTIVE STRESS FOR CASE SMV1 - STEVENS CREEK DAM
TERRA / GeoPentecha Joint Venture
SEISMIC STABILITY EVALUATIONS (SSE2)
Rev
. 1 1
0/03
/201
2 S
SE
2-R
-3S
C
400
-500 -400 -300 -200 -100 0 100 200 300 400
500
600
SPILLWAY CREST ELEVATION: 537.8'
Horizontal Distance (Feet)
Ele
vatio
n (F
eet)
ZONE OF POTENTIAL CRACKING
ORIGINAL EMBANKMENT - UPSTREAM
ORIGINAL EMBANKMENT - DOWNSTREAM
UPSTREAM AND DOWNSTREAM BUTTRESSES
FILTER/DRAIN MATERIAL
RIP RAP AT DOWNSTREAM TOE
YOUNGER ALLUVIUM
BEDROCK - SANTA CLARA FORMATION
FILL AT DOWNSTREAM TOE
LEGEND
Figure
5-18
CROSS SECTION WITH ZONE OF CONCERNSTEVENS CREEK DAM
TERRA / GeoPentech a Joint Venture
SEISMIC STABILITY EVALUATIONS (SSE2)
Rev
. 0
11/0
5/20
12
SS
E2-
R-3
SC
APPENDIX
APPENDIX DETAILED RESULTS OF FLAC ANALYSES
SSE2 Rpt SC-3 Final.docx A-1
The following six MCE-evaluation ground motions were selected and were used in developing time histories that are compatible with the specified response spectral values.
1. Earthquake Records for Stanford-Monte Vista Event
a. Kobe Earthquake, Nish-Akashi Station, 1/16/1995 b. Loma Prieta Earthquake, LGPC Station, 10/18/1989 c. Northridge Earthquake, Sylmar-Olive View Med. FF Station, 1/17/1994
2. Earthquake Records for San Andreas Vista Event
a. Chi-Chi Earthquake, TCU065 Station, 9/20/1999 b. Landers Earthquake, Lucerne Station, 6/28/1992 c. Manjil Earthquake, Abbar Station, 11/03/1990
The analyses were performed considering normal and negative polarities for all six ground motions. The results of these analyses are summarized in Table A-1 in terms of crest, as well as upstream and downstream horizontal and vertical displacements.
As can be seen in Table A-1, for the assignment of alluvium residual strength based on (N1)60=20, the calculated horizontal crest displacements range from 0.9 to 3.1 feet downstream and the calculated vertical displacements (settlements) range from 0.1 to 0.2 feet. For the assignment of alluvium residual strength based on (N1)60=25, the crest displacements drop to 0.2 to 1.5 feet downstream with a vertical settlement of about 0.1 feet. At mid-height of the downstream slope, for (N1)60=20, the calculated horizontal displacements range from 1.1 feet downstream to 3.7 feet downstream, whereas the calculated settlement range from 0.1 to 0.3 feet. The calculated horizontal crest displacements drop to 0.6 to 1.8 feet downstream with a vertical settlement of 0.1 feet for (N1)60=25.
For each ground motion, the critical case between the normal and negative polarities was selected and the case identifier was assigned to the critical polarity (i.e. SAx, and SMVx for San Andreas, and Stanford-Monte Vista events, respectively). The critical case between the two polarities was chosen based on the magnitude of the calculated crest displacements.
The results of the critical cases identified in Table A-1 are summarized graphically in pairs of figures showing seismic displacement contours for each case.