Page 1
STI 2018 Conference Proceedings Proceedings of the 23rd International Conference on Science and Technology Indicators
All papers published in this conference proceedings have been peer reviewed through a peer review process administered by the proceedings Editors. Reviews were conducted by expert referees to the professional and scientific standards expected of a conference proceedings.
Chair of the Conference
Paul Wouters
Scientific Editors
Rodrigo Costas Thomas Franssen Alfredo Yegros-Yegros
Layout
Andrea Reyes Elizondo Suze van der Luijt-Jansen
The articles of this collection can be accessed at https://hdl.handle.net/1887/64521
ISBN: 978-90-9031204-0
© of the text: the authors © 2018 Centre for Science and Technology Studies (CWTS), Leiden University, The Netherlands
This ARTICLE is licensed under a Creative Commons Atribution-NonCommercial-NonDetivates 4.0 International Licensed
Page 2
In search of future excellence: the information value of bibliometric
indicators in predicting doctoral students’ future research performance
Jonas Lindahl*, Cristian Colliander*,** and Rickard Danell*
*[email protected] ; [email protected] ; [email protected]
INFORSK (Department of Sociology), Umeå University, Sweden, Umeå, SE-90187 (Sweden)
** [email protected]
University Library, Umeå University, Umeå (Sweden)
Introduction
In recent decades, there has been a clear shift in Swedish research policy with an increasing
emphasis on targeted initiatives to support excellent researchers and strategic research areas
(Hallonsten & Sillander 2012). This development is not unique for Sweden but is part of an
international trend towards a more active research policy motivated by an awareness of the
strategic importance of scientific knowledge production as a means to solve social problems,
and provide a competitive advantage in a globalized economy (Hallonsten & Sillander 2012;
Whitley 2006). The changing political climate, marked by a move towards more active
research policies, with targeted support for strong researchers and strong research
environments, has also coincided with an extensive institutional reform in which Swedish
university leaders have been given increased autonomy and ability to formulate their own
strategic initiatives.
An active and excellence-oriented research policy increases the need for non-experts to
evaluate and compare the outcome of research in various specialized research areas.
Indicators are needed so as to evaluate the outcome of strategic initiatives, and to identify
strong researchers and strong research environments that can be said to be excellent (Danell
2011). However, using bibliometric indicators to inform employment decisions and allocate
research funding or time for research to specific individuals is only reasonable if the
indicators are informative for future research performance.
The predictive power of bibliometric indicators has been tested in previous research (e.g.
Danell, 2011; Penner et al., 2013; Havemann & Larsen, 2015; Lindahl & Danell, 2016).
However, previous studies are based on an analysis of performance within specific research
fields, and the variation among those contributing to research in the field is large. Since
prediction of research performance relies on sufficient variation in the group whose
performance is to be predicted, it is motivated to test the validity of previous findings in a
local organizational context.
The purpose of this study is to investigate the predictive value of using bibliometric indicators
for the post-PhD research performance of Swedish doctoral students employed at a single
Swedish university. Predicting the performance of doctoral students is especially interesting
448
Page 3
STI Conference 2018 · Leiden
and challenging since they are not expected to exhibit great internal variation according to
research performance.
Previous studies
In this study, we expect that doctoral students who publish more in scientific journals and also
publish excellent work when preparing their PhD will have a higher probability of doing
excellent research in the future. Long et al. (1993) showed that publication volume is the best
predictor of career advancement in academia. In a recent review, publication volume during
doctoral studies was identified as an important factor in the formation of active early career
researchers (Sinclair, Barnacle, & Cuthbert, 2014). Previous studies have shown that citation-
based indicators are better predictors of future excellence than publication-based indicators
(see e.g. Danell, 2011; Havemann & Larsen, 2014). Lindahl (2017) examined researchers in
an early career setting and found that having many publications in top journals and many
highly cited publications, which implicitly requires a high publication volume, were two
important factors in attaining future excellence.
We expect that doctoral students who are closely integrated into their research environment
will have a higher probability for future excellence. Especially within the natural and life
sciences, with a more collective model for researcher education, the doctoral thesis work is an
important contribution to the supervisor’s project and the doctoral student is an integral part
of a larger research group, which also influences the form and content of the doctoral
student’s education (Austin 2009; Bech and Trowler 2001; Delamont, Atkinson, & Parry
2000; Golde 2005; Knorr Cetina 1999; Pyhältö, Stubb, and Lonka 2009). Doctoral students
within large research teams are usually more productive during and after graduate education
(Platow 2012), as the actual tutoring of doctoral students is distributed among more
individuals, which is important for the students’ socialization and intellectual development
(Austin 2002; Fenge 2012; Lee & Boud 2009).
We expect to observe gender bias in career development. There is a considerable number of
empirical studies that has identified gender differences in working conditions and career
development for male and female researchers, observed in various national contexts. In
summary, three statements clearly support the literature: women’s scientific efforts are valued
lower (Wennerås & Wold 1996; Bornmann et al 2007); female researchers still have a poorer
career development than their male colleagues (Xie & Shauman 2003; Ginther & Kahn 2006;
Kumar 2012; Danell & Hjerm 2013), female researchers tend to publish less than their male
colleagues (Cole and Zuckerman 1984; Long 1992; Xie & Shauman 1998; Prpic 2002; Fox
2005).
We also expect age to be a significant predictor. Completing doctoral studies at a young age is
a sign of talent, and such individuals should have a higher probability of future excellence.
Finishing doctoral studies at a more advanced age, on the other hand, presumably has a
negative influence on the probability for future excellence, because such an individual’s entry
into the scientific community implies a marked deviation from the general life cycle of age-
related research productivity pattern and age-creativity patterns that are visible in many
research fields (Jones & Weinberg, 2011; Rørstad & Aksnes, 2015).
Materials and method
Data
449
Page 4
STI Conference 2018 · Leiden
The data consists of 479 doctoral students who completed their studies at a Swedish
university between 2003 and 2009 at the faculties of natural sciences and medicine. We
performed the analyses on 304 of these authors who were employed or associated with the
university at least five years after the year of completing their thesis. Publication data were
collected from DiVA, a Swedish repository for research publications, and the citation indices
accessible through Web of Science. Everyone employed at or associated with the Swedish
university has a personal identification code, which was used to match doctoral students with
their publications. We also utilized the salary system of the Swedish university we studied to
acquire information about employment, gender, and age.
Variables
The dependent variable indicates whether an author had attained relative excellence in the
second to fifth year after the year of completing their thesis. In order to operationalize the
indicator for relative excellence, we identified documents that were among the top 10 % cited
documents in their field (subject category), taking into account document type and year. Since
a document can belong to more than one subject category, it may be equal to or above the
90th percentile in one category and not in others. We therefore calculated in what fraction of
categories the document was equal to or above the 90th percentile.
For each author, we summed the top 10 % fractions for all documents that belonged to that
author. An author that was equal to or above the 90th percentile in the distribution of summed
top 10 % fractions was defined as being an excellent author. Excellent authors had produced a
sum of top 10 % fractions of at least two and constituted 12 % of the sample.
We constructed five predictors for the analyses:
(1) Publication volume during doctoral studies is operationalized as the number of
publications indexed in the Web of Science (Coding: #Publications during doctoral studies).
(2) Relative excellence during doctoral studies was operationalized in the same way as the
relative excellence after completion of the thesis. (Coding: Top 10 % articles).
(3) Collaboration and the degree of integration into the research community was
operationalized with the collaborative coefficient (Ajiferuke, Burell, & Tague, 1988). The
collaborative coefficient is a weighted mean that incorporates the average number of authors
per paper and the proportion of multi-authored papers in a single measure that can be defined
as:
𝐶𝑜𝑙𝑙𝑎𝑏𝑜𝑟𝑎𝑡𝑖𝑣𝑒 𝑐𝑜𝑒𝑓𝑓𝑖𝑐𝑖𝑒𝑛𝑡 = 1 −𝑓1 + (1/2)𝑓2 + ⋯ + (1/𝑘)𝑓𝑘
𝑁= 1 −
∑ (1/𝑗)𝑓𝑗𝑘𝑗=1
𝑁
where 𝑓𝑗 denotes the number of j-authored papers, 𝑁 denotes the total number of publications,
and 𝑘 is the greatest number of co-authors per paper of an author (Coding: Degree of
collaboration).
(4) Age was operationalized as the age of the doctorate at the year of the defence of the thesis
(Coding: Age at completion of doctoral studies).
(5) The effect of gender bias was examined with a binary predictor where the value 1
represent males and 0 represent females (Coding: Male doctoral student).
450
Page 5
STI Conference 2018 · Leiden
Model
We used a probit model to model the probability for future excellence in research. A probit
model uses the standard normal cumulative distribution function (CDF) in order to find the
probability for an event.
Pr(𝑦 = 1|𝒙𝜷) = Φ(𝒙𝜷) ≡ ∫ 𝜙(𝑣)𝑑𝑣𝑥𝛽
−∞,
where
𝜙(𝑣) =1
√2𝜋𝑒−
𝑣2
2 ,
is the standard normal density. This means that the interpretation of value of xβ for each
observation is as a standard deviation for the standard normal CDF. It also means that the
partial effects of changes in the predictors are not constants, since changes in probabilities are
largest when xβ = 0.
A potential problem with the data set concerns the independence of the observation.1 It is
possible that the performance of an observed doctoral student is not statistically independent
from the performance of other doctoral students in the same department, since they could be
part of the same research group. Moreover, some departments for various reasons have a
higher probability of producing excellent research. This problem affects inference, since
correlated errors can lead to underestimated standard errors. We have, therefore, estimated
robust clustered standard errors which allow for intragroup correlation, relaxing the
requirement that the observations must be independent, i.e. the observations are independent
across groups, but not necessarily within groups. When we calculated the robust clustered
standard errors, the observations were grouped into research areas in accordance with the
classification scheme Standard for Swedish classification of research areas 2011 (HSV,
2011). The dissertations are classified with the second level in this scheme, where level 1 and
level 2 correspond in essence to the OECD classification scheme Field of Research and
Development.
Results
Predicting future excellence among doctoral students
Table 1 displays the robust clustered standard errors, p-values, and 95 % confidence intervals
for the estimated coefficients in the probit regression model. We found that the doctoral
students’ research performance during their education, i.e. number of publications and
attaining relative excellence during doctoral studies coded as top 10% articles, are
complicated by a significant (p < 0.05) interaction effect. The interpretation of the coefficients
for these variables must, therefore, be made with the effect of the interaction taken into
account. Degree of collaboration and age at completing doctoral studies are significant
predictors for future research excellence. However, the coefficient for the male doctoral
student variable was not significant, even though the coefficient indicates that male doctoral
1 Another potential problem with the data set was that the doctoral students who stayed at the university after
thesis completion may have been selected on the variables used in our model in such a way that the estimates
may be biased. To test for selection bias, we estimated a Heckman selection model (Greene, 2012) which
indicated that there was no selection bias in our model. The Heckman procedure was left out of the manuscript
due to space limitations.
451
Page 6
STI Conference 2018 · Leiden
students will, independent of their performances as doctoral students, have a higher
probability of future excellence.
Table 1. Probit regression estimating probability for future excellence
Predictors Coef. Robust
Std. Err.
z P>z 95% Conf. Interval
#Publications during
doctoral studies
0.047 0.014 3.46 0.001 0.020 0.073
Top 10% articles -0.885 0.481 -1.84 0.066 -1.828 0.058
Degree of collaboration 0.034 0.016 2.09 0.036 0.002 0.065
Male doctoral student 0.340 0.223 1.52 0.128 -0.098 0.777
Age at completing
doctoral studies
-0.031 0.011 -2.90 0.004 -0.053 -0.010
Top 10% articles *
#Publications during
doctoral studies
0.261 0.085 3.06 0.002 0.094 0.428
Constant -3.127 1.455 -2.15 0,032 -5.979 -0.275
Note. Std. Err. adjusted for 10 clusters. Number of obs. = 304. Wald chi2(6) = 1194.57.
Prob > chi2 = 0.0000. Log pseudolikelihood = -82.58488. Pseudo R-square = 0.2532.
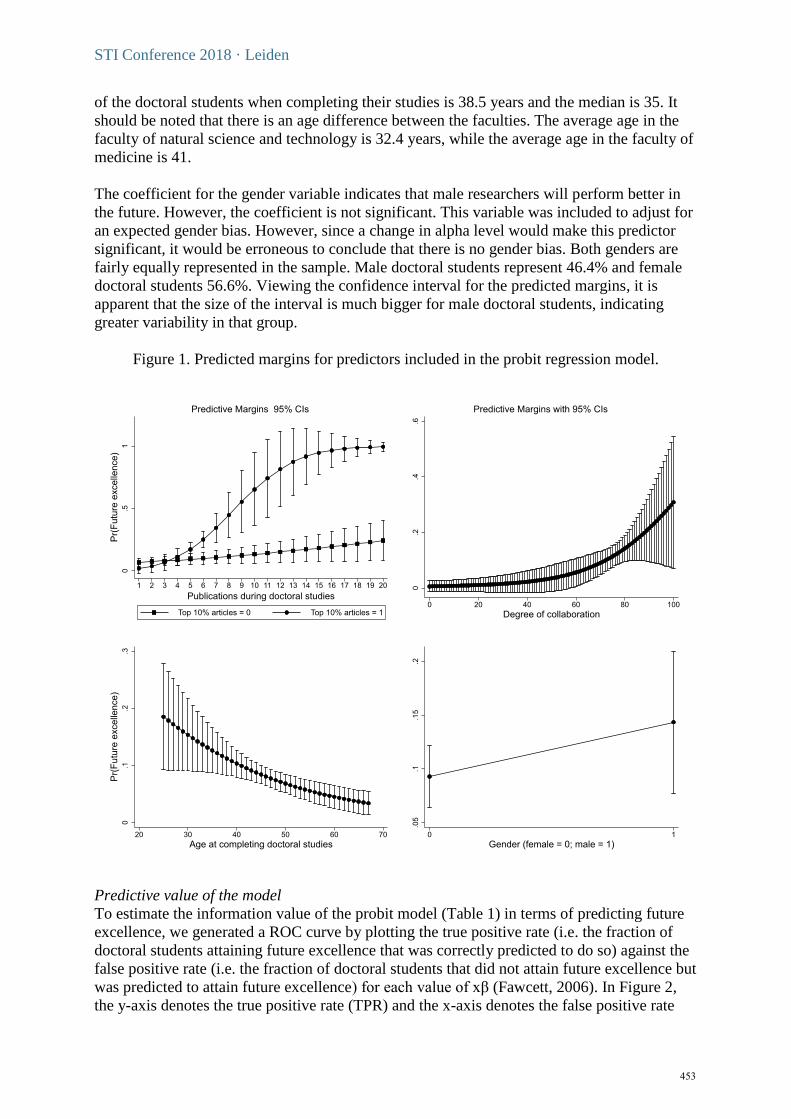
In order to interpret the coefficients, we calculated the predictive margins displayed in Figure
1. Plotting the predictive margins for the number of publications during doctoral studies and
distinguishing between doctoral students who had attained relative excellence (i.e. the sum of
at least two 10 % publications coded as Top 10 % articles) and those without, it is apparent
that the information value of publication volume differs quite considerably between the
groups. For the doctoral students in the sample who have not attained relative excellence
during their education, publication volume is a weak predictor of future excellence in
research. For the doctoral students who have attained relative excellence during their
education, the probability of future excellence in research increases quite rapidly for each
additional publication when the total number of publications is larger than five. It should be
noted that five publications is the upper quartile, so the group of doctoral students with a high
probability of future relative excellence in research is rather extreme considering both their
productivity and their citedness.
The predictive margins for degree of collaboration is flat until a value of about 50 and
increases quite rapidly thereafter. It should be noted that the tenth percentile is a collaboration
degree of 53.6, and the average collaboration degree is 71.5. The fact that the degree of
collaboration is a positive predictor can be due to the importance of social integration of
doctoral students, even though it is hard to specify exactly why this integration is of
importance for a doctoral student’s future research performance. It could be a combination of
different factors that are embedded in this predictor, such as learning tacit knowledge, future
integration into a research project or increased awareness of future research of potential
interest.
The age of the doctoral student when completing their education is a significant predictor of
future research excellence. This relationship is negative. However, the uncertainty is much
greater among younger doctoral students than among older students, indicating that we can be
more confident about the negative effect of age on future excellence among older doctoral
students (i.e., students with an age above 39) than among younger students. The average age
452
Page 7
STI Conference 2018 · Leiden
of the doctoral students when completing their studies is 38.5 years and the median is 35. It
should be noted that there is an age difference between the faculties. The average age in the
faculty of natural science and technology is 32.4 years, while the average age in the faculty of
medicine is 41.
The coefficient for the gender variable indicates that male researchers will perform better in
the future. However, the coefficient is not significant. This variable was included to adjust for
an expected gender bias. However, since a change in alpha level would make this predictor
significant, it would be erroneous to conclude that there is no gender bias. Both genders are
fairly equally represented in the sample. Male doctoral students represent 46.4% and female
doctoral students 56.6%. Viewing the confidence interval for the predicted margins, it is
apparent that the size of the interval is much bigger for male doctoral students, indicating
greater variability in that group.
Figure 1. Predicted margins for predictors included in the probit regression model.
Predictive value of the model
To estimate the information value of the probit model (Table 1) in terms of predicting future
excellence, we generated a ROC curve by plotting the true positive rate (i.e. the fraction of
doctoral students attaining future excellence that was correctly predicted to do so) against the
false positive rate (i.e. the fraction of doctoral students that did not attain future excellence but
was predicted to attain future excellence) for each value of xβ (Fawcett, 2006). In Figure 2,
the y-axis denotes the true positive rate (TPR) and the x-axis denotes the false positive rate
453
Page 8
STI Conference 2018 · Leiden
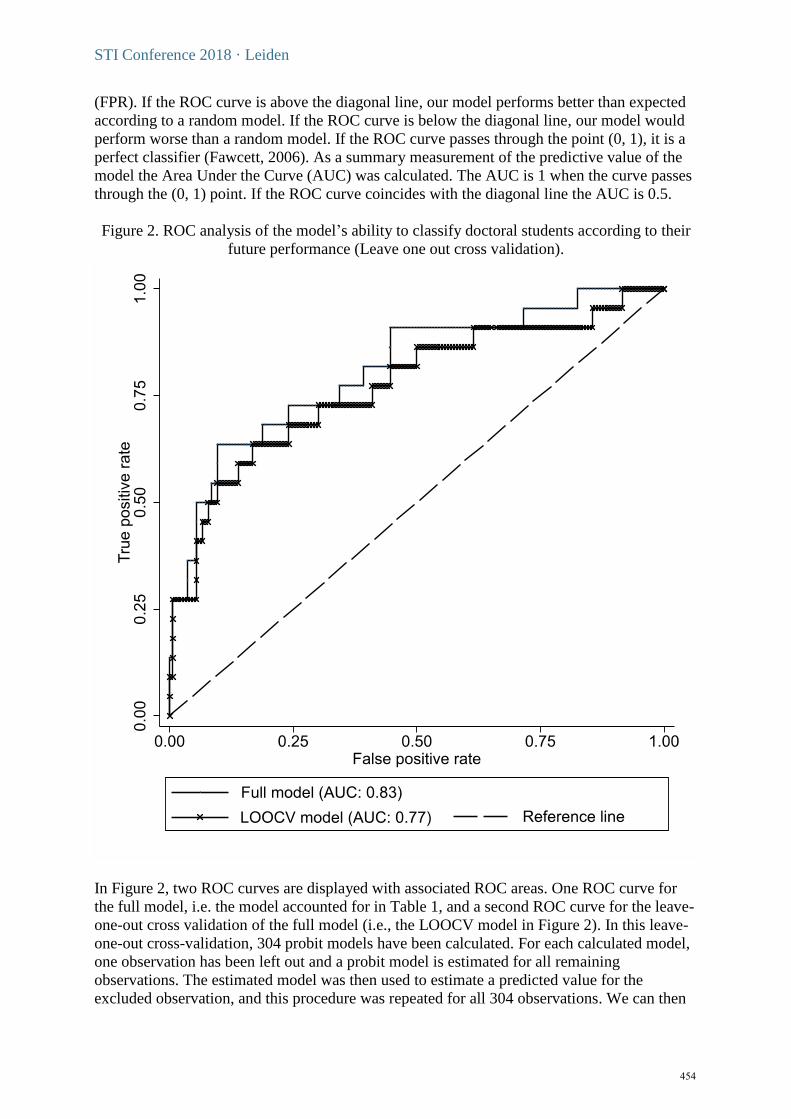
(FPR). If the ROC curve is above the diagonal line, our model performs better than expected
according to a random model. If the ROC curve is below the diagonal line, our model would
perform worse than a random model. If the ROC curve passes through the point (0, 1), it is a
perfect classifier (Fawcett, 2006). As a summary measurement of the predictive value of the
model the Area Under the Curve (AUC) was calculated. The AUC is 1 when the curve passes
through the (0, 1) point. If the ROC curve coincides with the diagonal line the AUC is 0.5.
Figure 2. ROC analysis of the model’s ability to classify doctoral students according to their
future performance (Leave one out cross validation).
In Figure 2, two ROC curves are displayed with associated ROC areas. One ROC curve for
the full model, i.e. the model accounted for in Table 1, and a second ROC curve for the leave-
one-out cross validation of the full model (i.e., the LOOCV model in Figure 2). In this leave-
one-out cross-validation, 304 probit models have been calculated. For each calculated model,
one observation has been left out and a probit model is estimated for all remaining
observations. The estimated model was then used to estimate a predicted value for the
excluded observation, and this procedure was repeated for all 304 observations. We can then
454
Page 9
STI Conference 2018 · Leiden
estimate the accuracy of our model by its ability in predicting the outcome for the excluded
observation, and, as can be seen in Figure 1, the predictive ability of the model is quite good.
Model diagnostics
We have conducted tests for model mis-specification and test for choice of functional form on
the estimated probit model presented in Table 2. In testing for mis-specification of the
arguments of the estimated function, we have followed Ruud (1984). We used the estimated
𝒙�̂�, i.e.
𝒙�̂�𝑀𝐿𝐸 = �̂�1 + �̂�2𝑥2 + ⋯ + �̂�𝑘𝑥𝑘.
In order to test for mis-specification the following procedure is suggested by Ruud (1984).
First, we estimate
𝑃(𝑦 = 1 |𝒙) = Φ(𝒙�̂� + 𝛾1(𝒙�̂�)2
+ 𝛾2(𝒙�̂�)3
).
With the coefficient on 𝒙�̂� is set equal to one and under the null hypothesis that our model is
correctly specified, we have γ1 = γ2 = 0.
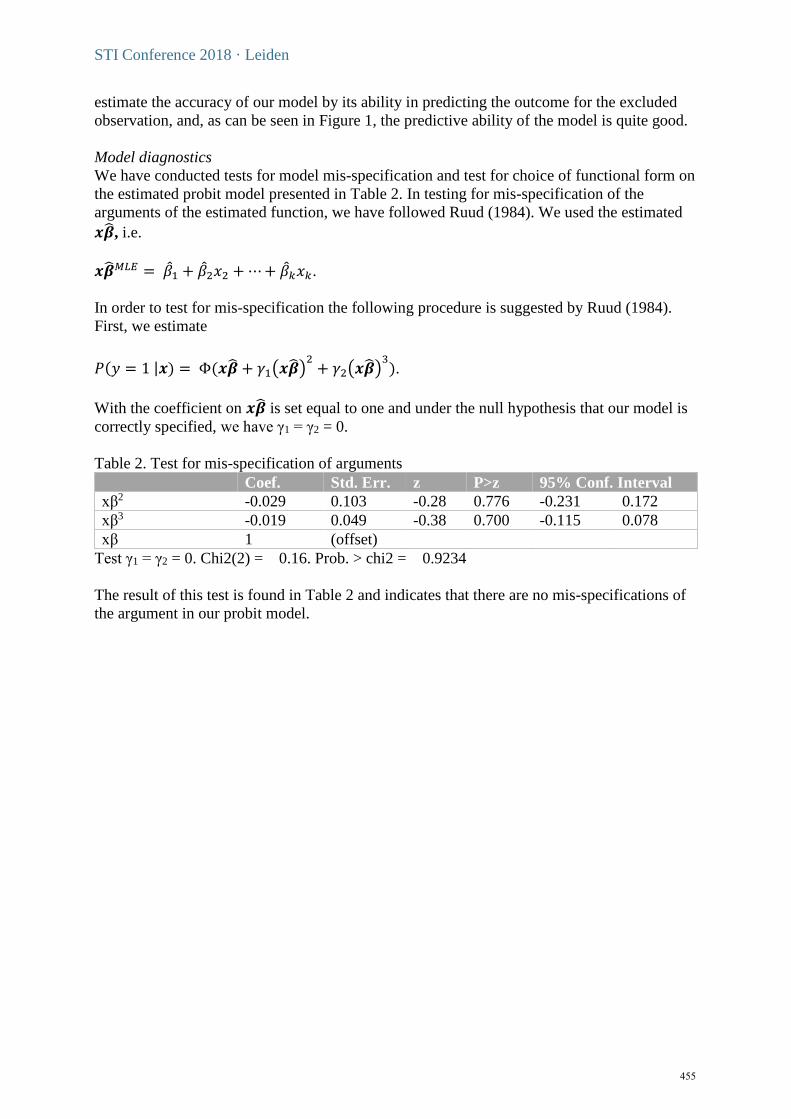
Table 2. Test for mis-specification of arguments
Coef. Std. Err. z P>z 95% Conf. Interval
xβ2 -0.029 0.103 -0.28 0.776 -0.231 0.172
xβ3 -0.019 0.049 -0.38 0.700 -0.115 0.078
xβ 1 (offset)
Test γ1 = γ2 = 0. Chi2(2) = 0.16. Prob. > chi2 = 0.9234
The result of this test is found in Table 2 and indicates that there are no mis-specifications of
the argument in our probit model.
455
Page 10
STI Conference 2018 · Leiden
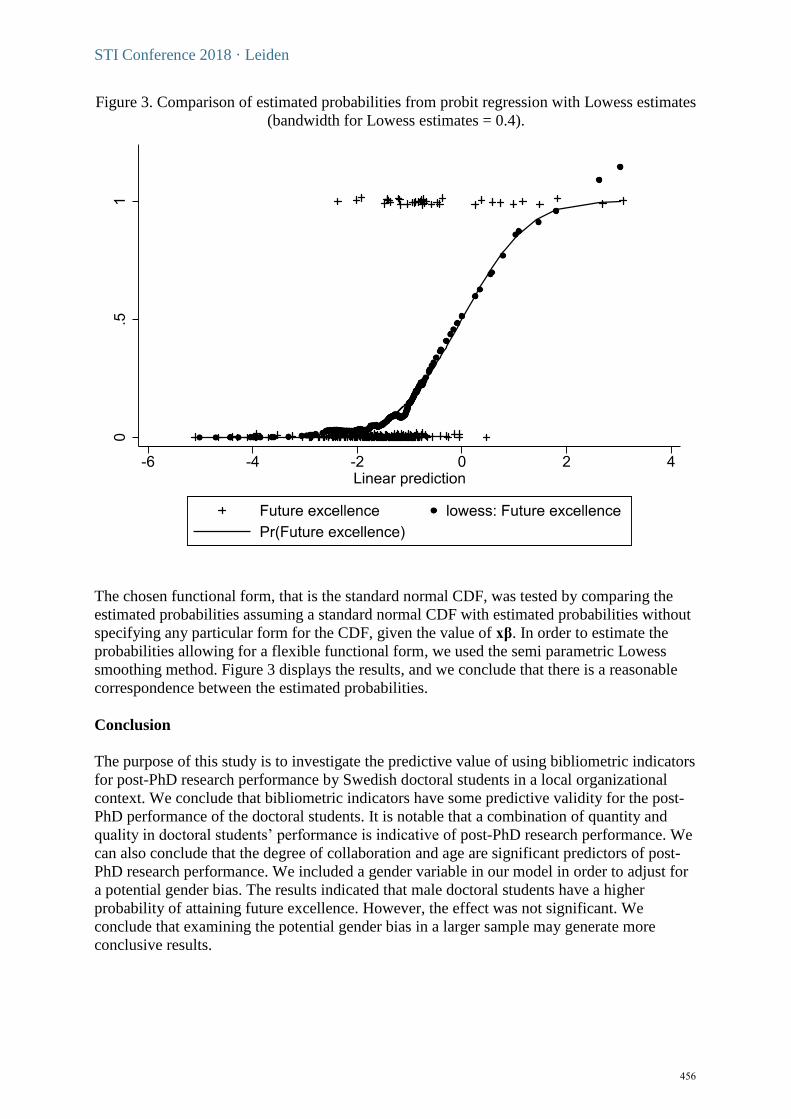
Figure 3. Comparison of estimated probabilities from probit regression with Lowess estimates
(bandwidth for Lowess estimates = 0.4).
The chosen functional form, that is the standard normal CDF, was tested by comparing the
estimated probabilities assuming a standard normal CDF with estimated probabilities without
specifying any particular form for the CDF, given the value of xβ. In order to estimate the
probabilities allowing for a flexible functional form, we used the semi parametric Lowess
smoothing method. Figure 3 displays the results, and we conclude that there is a reasonable
correspondence between the estimated probabilities.
Conclusion
The purpose of this study is to investigate the predictive value of using bibliometric indicators
for post-PhD research performance by Swedish doctoral students in a local organizational
context. We conclude that bibliometric indicators have some predictive validity for the post-
PhD performance of the doctoral students. It is notable that a combination of quantity and
quality in doctoral students’ performance is indicative of post-PhD research performance. We
can also conclude that the degree of collaboration and age are significant predictors of post-
PhD research performance. We included a gender variable in our model in order to adjust for
a potential gender bias. The results indicated that male doctoral students have a higher
probability of attaining future excellence. However, the effect was not significant. We
conclude that examining the potential gender bias in a larger sample may generate more
conclusive results.
456
Page 11
STI Conference 2018 · Leiden
References
Ajiferuke, I., Q. Burell & J. Tague (1988) “Collaborative coefficient: A single measure of the
degree of collaboration in research”, Scientometrics, 14(5–6), pp. 421–433.
Austin, A. E. (2002). “Preparing the Next Generation of Faculty: Graduate Education as
Socialization to the Academic Career.” Journal of Higher Education, 73 (2): 94–22.
Austin, A. E. (2009) “Cognitive Apprenticeship Theory and its Implications for Doctoral
Education.” International Journal of Academic Development 14(3): 173–83.
Becher, T., & Trowler, P. (2001) Academic Tribes and Territories. Berkeley, CA: University
of California Press.
Bornmann, L., Mutza, R., & Daniel, H.D. (2007) “Gender differences in grant peer review: A
meta-analysis”. Journal of Informetrics, 1(3), 226–238.
Cole, S., and Zuckerman, H. (1984) “The productivity puzzle: Persistence and change in
patterns of publication of men and women scientists”. Advances in Motivation and
Achievement, 2, 217–258.
Danell, R. (2011). Can the Quality of Scientific Work Be Predicted Using Information on the
Author's Track Record? Journal of the American Society for Information Science and
Technology, 62(1), 50–60.
Danell, R. & Hjerm, M. (2013) “Career prospects for female university researchers have not
improved”, Scientometrics, 94, 999–1006.
Delamont, S., Atkinson, P., & Parry, O. (2000) The Doctoral Experience. London: Falmer
Fawcett, T. (2006). An introduction to ROC analysis. Pattern Recognition Letters, 27(8),
861–874
Fenge, L.-A. (2012) “Enhancing the Doctoral Journey: The Role of Group Supervision in
Supporting Collaborative Learning and Creativity.” Studies in Higher Education, 37 (4), 401–
14.
Fox, M.F. (2005) “Gender, Family Characteristics, and Publication Productivity among
Scientists”. Social Studies of Science, 35, 131–150.
Greene, William H. (2012). Econometric analysis. 7. ed. Boston: Pearson
Hallonsten, O. & C. Silander (2012) “Commissioning the University of Excellence: Swedish
research policy and new public research funding programmes”, Quality in Higher Education,
18(3), pp. 367–381.
Ginther, D. and Kahn, S. (2006) “Does Science Promote Women? Evidence from Academia
1973–2001”. In Science and Engineering Careers in the United States: An Analysis of
457
Page 12
STI Conference 2018 · Leiden
Markets and Employment. National Bureau of Economic Research Conference Reports.
Chicago: University of Chicago Press
Golde, C. M. (2005) “The Role of the Department and Discipline in Doctoral Student
Attrition: Lessons Learned from Three Departments.” Journal of Higher Education, 76 (6),
669–700
Havemann, F., & Larsen, B. (2015). Bibliometric indicators of young authors in astrophysics:
Can later stars be predicted? Scientometrics, 102(2), 1413–1434.
HSV (2011) ‘Standard för svensk indelning av forskningsämnen 2011’, Stockholm:
Högskoleverket (Swedish National Agency for Higher Education).
Jones, B. F., & Weinberg, B. A. (2011). Age dynamics in scientific creativity. Proceedings of
the National Academy of Sciences, 108(47), 18910–18914. doi:10.1073/pnas.1102895108
Knorr Cetina, K. 1999. Epistemic Cultures: How the Sciences Make Knowledge. Cambridge,
MA: Harvard University Press.
Kumar, N. (ed.) (2012) Gender and Science: Studies across Cultures. Cambridge University
Press: Cambridge, UK.
Lee, A., and D. Boud. 2009. “Framing Doctoral Education as Practice.” In Changing
Practices of Doctoral Education, (eds.) D. Boud and A. Lee 10–25. London: Routledge.
Lindahl, J., & Danell, R. (2016). The information value of early career productivity in
mathematics: A ROC analysis of prediction errors in bibliometrically informed decision
making. Scientometrics, 109(3), 2241–2262.
Lindahl, J. (2018). Predicting research excellence at the individual level: The importance of
publication rate, top journal publications, and top 10% publications in the case of early career
mathematicians. Journal of Informetrics, 12(2), 518-533.
https://doi.org/10.1016/j.joi.2018.04.002
Long, J., Allison, P., & Mcginnis, R. (1979). Entrance into the academic career. American
Sociological Review, 44(5), 816–830.
Long, J. (1992) “Measures of Sex Differences in Scientific Productivity”. Social Forces,
71(1), 159–178.
Penner, O., Pan, R., Petersen, A., Kaski, K., & Fortunato, S. (2013). On the predictability of
future impact in science. Scientific Reports. doi:10.1038/srep03052.
Platow, M. J. (2012) “PhD Experience and Subsequent Outcomes: A Look at Self-perceptions
of Acquired Graduate Attributes and Supervisor Support.” Studies in Higher Education,
37(1), 103–18.
Prpic, K. (2002) “Gender and productivity differentials in science”, Scientometrics, 55(1), 27–
58.
458
Page 13
STI Conference 2018 · Leiden
Pyhältö, K., Stubb, J. & Lonka, K. (2009) “Developing Scholarly Communities as Learning
Environments for Doctoral Students.” International Journal for Academic Development, 14
(3), 221–32.
Ruud, P.A. (1984) “Tests of specification in econometrics”, Econometric Reviews, 3(2), pp.
211–242.
Rørstad, K., & Aksnes, D. W. (2015). Publication rate expressed by age, gender and academic
position – A large-scale analysis of Norwegian academic staff. Journal of Informetrics, 9(2),
317–333.
Sinclair, Jennifer, Barnacle, Robyn, & Cuthbert, Denise. (2014). How the Doctorate
Contributes to the Formation of Active Researchers: What the Research Tells Us. Studies in
Higher Education, 39(10), 1972–1986.
Whitley, R. (2006) “Changing governance of the public science: The consequences of
establishing research evaluation systems for knowledge production in different countries and
scientific fields”, in Richard Whitley & Jochen Gläser (eds.) The changing governance of the
sciences, Springer: The Netherlands
Wennerås, C. & Wold, A. (1996) “Nepotism and sexism in peer review”, Nature, 387(22),
341–343.
Xie, Y. & K.A. Shauman (1998) “Sex differences in research productivity: New evidence
about an old puzzle”. American Sociological Review, 63(6), 847–870.
Xie, Y. & Shauman, K.A. (2003). Women in Science: Career Processes and Outcomes.
Harvard University Press: Cambridge, MA.
459