29
1 Stifel Ninth Annual Investor Summit June 28, 2021

1
Stifel Ninth AnnualInvestor Summit
June 28, 2021

2
Forward Looking Statements and GAAP Disclaimer
These slides contain (and the accompanying oral discussion will contain) forward-looking statements, which are generally identifiable by use of the words "believes," "expects," "intends,"
"anticipates," "plans to," "seeks," "should," "estimates," "projects," "may," "likely" or similar expressions. Such statements may include, but are not limited to, statements about future financial and
operating results, the Company's plans, objectives, expectations and intentions and other statements that are not historical facts. Forward-looking statements are neither historical facts nor
assurances of future performance. Such statements are based upon the beliefs and expectations of Clean Harbors' management as of this date only and are subject to certain risks and
uncertainties that could cause actual results to differ materially, including, without limitation, the risks and uncertainties surrounding COVID-19 and the related impact on our business, and those
items identified as "Risk Factors,” disclosed in our periodic filings with the Securities and Exchange Commission (SEC). Therefore, readers are cautioned not to place undue reliance on these
forward-looking statements, which reflect management’s opinions only as of the date hereof. Our actual results and financial condition may differ materially from those indicated in the forward-
looking statements. Clean Harbors undertakes no obligation to revise or publicly release the results of any revision to these forward-looking statements other than through its filings with the SEC,
which may be viewed in the "Investors" section of the Clean Harbors website.
Statement Regarding use of Non-GAAP Measures:
Adjusted EBITDA, adjusted free cash flow, adjusted net income and adjusted earnings per share, as presented in these slides, are non-GAAP financial measures and should not be considered
alternatives to other measurements under generally accepted accounting principles (GAAP), but viewed only as a supplement to those measurements. These non-GAAP measures are not
calculated identically by all companies. Therefore, our measurements of Adjusted EBITDA, adjusted free cash flow, adjusted net income (loss) and adjusted earnings (loss) per share are clearly
defined and may not be comparable to similarly titled measures reported by other companies. We believe that Adjusted EBITDA provides additional useful information to investors since our loan
covenants are based upon levels of Adjusted EBITDA achieved and the fact that management routinely evaluates the performance of its businesses based upon levels of Adjusted EBITDA. We
believe adjusted free cash flow provides useful information to investors about our ability to generate cash. We believe adjusted net income (loss) and adjusted earnings (loss) per share provide
useful information about our performance excluding non-recurring or extraordinary items.
Adjusted EBITDA consists of net income (loss) plus accretion of environmental liabilities, stock-based compensation, depreciation and amortization, net interest expense, loss on early
extinguishment of debt, provision for income taxes and excludes other gains, losses and non-cash charges not deemed representative of fundamental segment results and other (income)
expense, net. Adjusted free cash flow consists of net cash from operating activities excluding cash impacts of items derived from non-operating activities, such as taxes paid in connection with
divestitures, less additions to property, plant and equipment plus proceeds from sale of fixed assets. All amounts in USD unless otherwise noted.
For a reconciliation of Adjusted EBITDA and adjusted net income to net income, a reconciliation of adjusted earnings per share to net income per share and a reconciliation of net cash from
operating activities to adjusted free cash flow, please refer to the company’s quarterly earnings releases, which are available on its investor relations website and filed with the SEC.

3
Our Mission is Based in Sustainability
“Create a Safer, Cleaner
Environment Through the
Treatment, Recycling and
Disposal of Hazardous
Materials”

4
Reasons to Invest in CLH
▪ Market Leader with High Barriers to Entry
▪ Growth Potential Beyond GDP
▪ Margin Improvement Story/Strong Free Cash Flows
▪ Sustainability and ESG Profile
▪ Highly Resilient Business

5
North America’s Environmental and Industrial Services Leader
▪ Largest hazardous waste disposal company
▪ Largest collector, recycler and re-refiner of used oil
▪ Owns more than 500 hard to replicatepermits
▪ 100+ waste management facilities
▪ More than one million waste profiles
▪ Top 30 largest private motor carrier
▪ 300,000+ customers
▪ 14,000+ employees
▪ 450+ service locations

6
Industrial
Services
Safety-Kleen
Environmental
Technical
Services
Field
Services
Safety-Kleen
Sustainability
Solutions
Sustainable Business Model – Led by Two Powerful Brands
DisposalTransfer, Treat,
Recycle & Re-Refine
Transport Waste
& Waste OilGather Waste
Perform Services1 2 3 4
(Environmental Services)

7
Maintains Unmatched Network of Locations
▪ 100+ Waste Management Facilities
• 9 Incinerators
• 9 Landfills
• 27 Treatment Storage Disposal Facilities (TSDFs)
• 8 Solvent Recycling Plants
• 9 Wastewater Treatment Operations
• 7 Re-refineries
▪ 10,000+ Company Vehicles
▪ 450+ Service Locations
• Increasing co-locations between Clean
Harbors and Safety-Kleen branches
LEGEND
CLEAN
HARBORS
SAFETY-KLEEN
Waste Facilities
Service Locations

8
Targets Large Market Opportunities
Hazardous Waste Management: $11 Billion• Technical Services and SK Branch Services
• Transportation, Treatment and Storage
• Recycling and Disposal
Remediation & Industrial Services: $14 Billion• Remediation Services and Waste Projects
• Industrial Services
• Field Services and Emergency Response
U.S. Lubricants Industry $15 Billion• Engine Oils
• Transmission and Hydraulic Fluids
Sources: Environmental Business Journal and MarketResearch.com

9
2018 2019 2020
Manufacturing 17% 16% 17%
Chemical 14% 14% 15%
Automotive Service/Repair 7% 8% 9%
Refineries 8% 9% 8%
Base and Blended Oils 8% 7% 6%
Government 6% 6% 5%
Transportation 4% 4% 5%
Utilities 5% 5% 4%
Construction 3% 3% 3%
Retail 2% 2% 3%
Other Industries 26% 26% 25%
Limits Downside Risk Through Diversification

10
REPORTING SEGMENTS
11
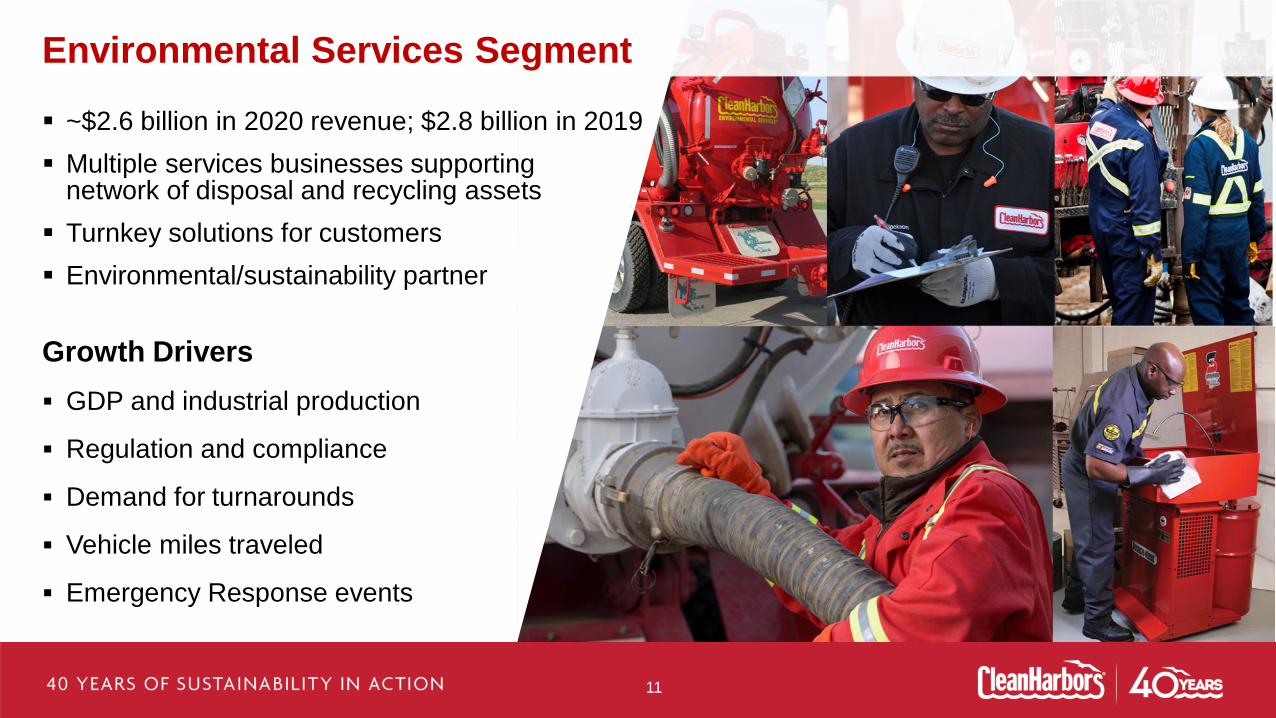
Environmental Services Segment
▪ ~$2.6 billion in 2020 revenue; $2.8 billion in 2019
▪ Multiple services businesses supporting network of disposal and recycling assets
▪ Turnkey solutions for customers
▪ Environmental/sustainability partner
Growth Drivers
▪ GDP and industrial production
▪ Regulation and compliance
▪ Demand for turnarounds
▪ Vehicle miles traveled
▪ Emergency Response events

12
COVID-19 Response Work Reflects Resiliency
▪ First-mover advantage; capitalized on
existing ER reputation
▪ Generated $28 million in Q1; $120M in
2020
▪ More than 18,000 responses as of today;
opening doors to customer relationships
▪ Varied locations: retail stores, offices,
hospitals, warehouses, manufacturing
plants, schools, transport hubs, apartment
buildings and sports stadiums
▪ Expect $30-$40 million in 2021
with work continuing through the
vaccination stage

13
Safety-Kleen Sustainability Solutions Segment
▪ ~$500 million in 2020 revenue; ~$600M in 2019
▪ Carefully managed re-refinery spread business
▪ Focused on providing most environmentally friendly products to customers
▪ Closed loop offerings including lubricants, oil filters and antifreeze
Growth Drivers
▪ Base oil market/lubricant demand
▪ Regulation and compliance
▪ Vehicle miles driven
▪ Waste oil gallons collected
▪ Industrial production

14
Safety-Kleen
OilPlus® Closed Loop
UMO Terminals
UMO Collection
Blending &
Packaging
Distribution Centers
Renewable Lubricants
Delivery
Direct Lubricant Sales Model
Re-refineries

15
▪ First-ever ESG report issued in
early 2021
▪ Demand from customers for
“green” solutions is growing
▪ Potential financial benefits
beyond increased sales include
cost savings, increased recycling
and other areas
▪ Meaningful improvement in
ESG ratings
Sustainability is Core to Clean Harbors

16
ESG Report Demonstrates Progress and Leadership

17
CORPORATE STRATEGY

18
Expand Offerings
and Geographic
Coverage
Execute Cost,
Pricing and
Productivity
Initiatives
Pursue
Acquisitions
and Divestitures
Add Network
Capacity
Cross-Sell
Across the
Businesses
Growth Strategies

19
▪ Invest capex to drive growth
▪ Evaluate acquisition and divestiture
opportunities
▪ Execute authorized buyback plan
▪ Assess current debt structure
Capital Allocation Strategy – Driven by ROIC
Organic Growth
Investments
Acquisitions
& Divestitures
Share
Repurchases
Debt
Repayment
1 2
43

20
FINANCIAL OVERVIEW

21
▪ Revenue of $808.1M – ahead of expectations; Down 6% YoY reflecting
pandemic-related impact; up sequentially from Q4
▪ GAAP EPS of $0.39 and Adjusted EPS of $0.42
▪ Adjusted EBITDA* increased to $129.5M, including $5.4M from government
pandemic relief programs; Adjusted EBITDA margin climbed 130 bps to 16.0%
▪ Adjusted free cash flow was $62.3 million compared with ($26.2) million in Q1’20
▪ Environmental Services segment benefited from high-value waste streams and
ongoing recovery in service businesses, supported by productivity, cost and
pricing measures
▪ Safety-Kleen Sustainability Solutions segment delivered flat YoY revenue but
strong profitability due to ongoing pricing gains driven by market conditions
▪ Corporate segment down YoY due to lower marketing and travel spend, and
other cost savings, which more than offset higher healthcare and incentive comp* For a reconciliation of non-GAAP measures to its nearest GAAP equivalent, please refer to the company’s first-quarter news release dated May 5, 2021.
Summary of Q1 Results

22
$2,755$2,944
$3,300$3,412
$3,144
2016 2017 2018 2019 2020
Five-Year Revenue Performance
CAGR 3.3%

23
$410.8$438.8
$507.8
$558.1 $573.8
2016 2017 2018 2019 2020
CAGR 8.7%
* For a reconciliation of Adjusted EBITDA to net income, please refer to the Company’s Annual Report on Form 10-K and Form 10-Qs filed with the Securities and Exchange Commission.
Five-Year EBITDA Performance

24
$410.8$438.8
$507.8
$558.1 $573.8
14.9% 14.9%15.4%
16.4%
18.3%
2016 2017 2018 2019 2020
Adjusted EBITDA Adjusted EBITDA Margin
* For a reconciliation of Adjusted EBITDA to net income, please refer to the Company’s Annual Report on Form 10-K and Form 10-Qs filed with the Securities and Exchange Commission.
Five-Year Margin Performance

25
3/31/21 12/31/20
Cash and securities $570.7M $571.0M
Billed & unbilled receivables $675.4M $667.2M
Inventories and supplies $219.5M $220.5M
Current and long-term debt $1,556M $1,557M
Accounts payable $213.4M $195.9M
Environmental liabilities $205.4M $202.7M
Balance Sheet Highlights

26
(USD $ in millions) 2017 2018 2019 2020
Cash Flow from Operations $285.7 $373.2 $413.2 $430.6
Capital Expenditures, net of disposals (159.9) (177.9) (204.7) (186.6)
Purchase and capital improvements of
corporate headquarters21.1
Tax liability on sale of business $14.4
Adjusted Free Cash Flow $140.2 $195.3 $208.5 $265.0
Historical Adjusted Free Cash Flow

27
Five-Year Financial Targets
1. Organic Growth
• 1-2 percentage points greater than US GDP
2. Adjusted EBITDA Margin
• 30 to 50 basis point improvement annually
3. Adjusted Free Cash Flow
• Exceed $300 million in 2025

28
QUESTIONS?

29
(NYSE: CLH)
42 Longwater Drive
Norwell, MA 02061
Jim Buckley
SVP, Investor Relations
781-792-5100
Email: [email protected]
www.cleanharbors.com


