Stochastic Actor-oriented Models for Network Dynamics Basics and Co-evolution Tom A.B. Snijders University of Groningen University of Oxford January, 2017 c Tom A.B. Snijders Groningen & Oxford Methods for Network Dynamics January, 2017 1 / 76
There are many recent approaches to this question leading toa large variety of mathematical models for network dynamics.
The approach taken here is for statistical inference:
a flexible class of stochastic modelsthat can adapt itself well to a variety of network dataand can give rise to the usual statistical procedures:estimating, testing, model fit checking.
Some example research questions: networksDevelopment of preschool children:how do well-known principles of network formation,namely reciprocity, popularity, and triadic closure,vary in importance for preschool children throughout the networkformation period as the structure itself evolves?(Schaefer, Light, Fabes, Hanish, & Martin, 2010)
Collaboration between inventors:For collaboration between inventors in biotechnologyas demonstrated by patents,what are the roles of geographic distance and triadic closureand how did this develop over time 1976-1995?(Ter Wal, 2014)
Example research questions: networks and behaviorPeer influence on adolescent smoking:Is there influence from friends on smoking and drinking?(Steglich, Snijders & Pearson, 2010)
Peer influence on adolescent smoking:How does peer influence on smoking cessation differ in magnitudefrom peer influence on smoking initiation?(Haas & Schaefer, 2014)
Weapon carrying of adolescents in US High Schools:What are the relative contributions of weapon carrying of peers,aggression, and victimizationto weapon carrying of male and female adolescents?(Dijkstra, Gest, Lindenberg, Veenstra, & Cillessen, 2012)
Dependent variables: network and behavior.
We use the term ‘behavior’ to indicate dependent actor characteristics:behavior, performance, attitudes, etc.
Friendship and power attribution:Do people befriend those whom they see as powerful?do people perceive friends of powerful others as being powerful?(Labun, Wittek & Steglich, 2016)
Gossip at the work place:What is the relation between gossip and friendship?(Ellwardt, Steglich & Wittek, 2012)
Bullying in schools:Will bullies also bully the defenders of their victims?(Huitsing, Snijders, Van Duijn & Veenstra, 2014)
Friendship and media use:Do adolescents adjust their TV viewing behaviorto that of their friends on the level of programs or of genres?(Friemel, 2015)
(Viewing TV programs represented as two-mode network.)
Partners and internal structure of organizations:Do organizations adapt their internal structureto that of partners with whom they have dealings?(Stadtfeld, Mascia, Pallotti & Lomi, 2015)
(Internal structure represented as two-mode network.)
Dependent variables: one-mode networks and two-mode networks.
This type of research question is framed better in a network approachthan a variable-centered approach,because dependencies between the actors are crucial.
This requires a network model representing actorsembedded in networks, sometimes in multiple networks.
We are used to thinking in terms of variables,as in ANOVA, linear models, generalized linear models.Thinking in terms of processes is different.
We are accustomed to basing models on independence;we are only starting to understand how to specify dependence.This implies a larger placefor explorative parts in theory-guided research.
Mathematical proofs are much harderwithout independence assumptions.
In some questions the main dependent variable is constitutedby the network,in others by a changeable characteristic of the actors (‘behavior’)or by multiple interrelated networks.
In the latter type of study, a network–behavioror network–network co-evolution model is often useful.This represents not onlythe internal feedback processes in the network,but also the interdependencebetween the dynamics of the network and the behavioror between the multiple networks.
We assume that to study such questions we have network panel data,where the set of actors = nodes is fixed,or has some exogenous change(new actors coming in, current actors dropping out, mergers, ...),and a changing network on this node set is observed repeatedlyin two or more waves.
The relation is assumed to be a state, as opposed to an event;there will be inertia; changes are possible, and meaningful.
The basic model is for directed networks.
For time-stamped network event data there are network event modelsdeveloped by Carter Butts, Christoph Stadtfeld, and others.
Number of actors usually between 20 and 2,000 (≥ 400 is large).
Number of waves usually 2 to 4; but unrestricted in principle.
A quantitative measure for the inertia is the Jaccard index,defined for two consecutive panel waves asthe number of enduring tiesdivided by the number of ties present in at least one wave;if this is larger than .2 or .3, inertia is high enough.
Many observations / high Jaccard values are not a problem.
Many waves may compensate for small networks.
Multilevel structures (many groups) can also allowanalyzing many very small networks.
The well-known basic type of statistical modelingof linear regression analysis and its generalizationscannot be transplanted to network analysis,where the focus has to be on modeling dependencies,and the network is dependent as well as explanatory variable(as in transitivity, where friends of friends become friends).
Instead, longitudinal statistical modeling of networksrelies heavily on modest process modeling:use models for network dynamics that can be simulatedas models for data– even though direct calculations are infeasible.
Repeated measurements = panel data on social networks:at least 2 measurements (preferably more).
Data requirements:
The repeated measurements must be close enough together,but the total change between first and last observationmust be large enoughin order to give information about rules of network dynamics.
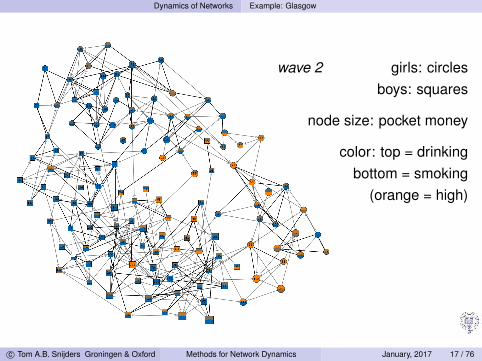
E.g.: Study of smoking initiation and friendship(following up on earlier work by P. West, M. Pearson & others).One school year group from a Scottish secondary schoolstarting at age 12-13 years, was monitored over 3 years,3 observations, at appr. 1-year intervals,160 pupils (with some turnover: 134 always present),with sociometric & behaviour questionnaires.
⇒ how to model joint dependence between networksand actor attributes such as drinking and smoking?
The Glasgow cohort data set is a panel,and it is natural to assume latent change going onbetween the observation moments:continuous-time probability model,discrete-time observations.
An advantage of using continuous-time models,even if observations are made at a few discrete time points,is that a more natural and simple representation may be found,especially in view of the endogenous dynamics.(cf. Coleman, 1964).
No problem with irregularly spaced data.
This has been done since long for non-network panel data:
For discrete data: cf. Kalbfleisch & Lawless, JASA, 1985;for continuous data:mixed state space modelling well-known in engineering,in economics e.g. Bergstrom (1976, 1988),in social science Tuma & Hannan (1984), Singer (1990s).
By controlling adequately for structural effects, it is possibleto test hypothesized effects of variables on network dynamics(without such control these tests would be incomplete).
The structural effects imply that the presence of tiesis highly dependent on the presence of other ties.
By controlling adequately for structural effects, it is possibleto test hypothesized effects of variables on network dynamics(without such control these tests would be incomplete).
The structural effects imply that the presence of tiesis highly dependent on the presence of other ties.
Stochastic Actor-Oriented Model (‘SAOM’)The change process is decomposed into two sub-models,formulated on the basis of the idea that the actors i controltheir outgoing ties:
1. waiting times until the next opportunityfor a change made by actor i :rate functions;
2. probabilities of changing (toggling) the tie variable i → j ,conditional on such an opportunity for change:objective functions.
The distinction between rate function and objective functionseparates the model for how many changes are madefrom the model for which changes are made.
This decomposition between the timing model and themodel for change can be pictured as follows:
At randomly determined moments t ,actors i have opportunity to toggle one tie variable Xij 7→ 1− Xij :
micro-step.(Actors are also permitted to leave things unchanged.)Frequency of micro-steps is determined by rate functions.
When a micro-step is taken, actors maycreate one new tie or drop one existing tie or change nothing;the change chosen depends on theobjective function for the following state;this is a function defined on the set of all networks, such thatthe probability is higher to move toward new stateshaving a higher value of the objective function.
Evaluation, creation, and maintenance functions are modeled aslinear combinations of theoretically argued componentsof preferred directions of change. The weights in the linearcombination are the statistical parameters.
This is a linear predictor like in generalized linear modeling(generalization of regression analysis).
Formally, the SAOM is a generalized statistical modelwith missing data (the micro-steps are not observed).
The focus of modeling usually is first on the evaluation function;then on the rate and creation – maintenance functions.
Model specification :Simple specification of objective function: only evaluation function;no separate creation or maintenance function,periodwise constant rate function.
Evaluation function fi reflects network effects(endogenous) and covariate effects (exogenous).
Covariates can be actor-dependentor dyad-dependent.
Convenient definition of evaluation function is a weighted sum
fi(β, x) =L∑
k=1
βk sik (x) ,
where x is the network, βk are statistical parametersindicating strength/weight of effect sik (x) (‘linear predictor’).
Model specification :Simple specification of objective function: only evaluation function;no separate creation or maintenance function,periodwise constant rate function.
Evaluation function fi reflects network effects(endogenous) and covariate effects (exogenous).Covariates can be actor-dependentor dyad-dependent.
Convenient definition of evaluation function is a weighted sum
fi(β, x) =L∑
k=1
βk sik (x) ,
where x is the network, βk are statistical parametersindicating strength/weight of effect sik (x) (‘linear predictor’).
The objective function is defined in a myopic model,considering only the immediately following state.
It does not reflect the eventual ’utility’of the situation to the actor, but short-time goalsfollowing from preferences, constraints, opportunities.
The evaluation, creation, and maintenance functions expresshow changes in the network depend on its current state:not the last observed state, butthe current state in the unobserved continuous-time process.
This model was applied to the Glasgow students friendship network.3 waves; 160 students; of these, 134 present at all waves.Average degrees 3.7; 3.3; 3.1.
Amount of stability in network ties measured by Jaccard coefficient
J =N11
N01 + N10 + N11
where Nhk = number of tie variableswith value h at one wave and value k at the next.J = 0.28; 0.31 for the two periods.
The following page shows the parameter estimates. These arenon-standardized multinomial logistic regression coefficients.
Evidence for reciprocity; transitivity;reciprocity stronger for creating than for maintaining ties;transitivity only for creating ties;those receiving many ties are less attractive;those sending many ties are more active;those with many reciprocated ties are less active;gender homophily;
here ‘active’ and ‘attractive’ is shorthand, referring to probabilitiesin creating new ties and maintaining existing tiesas senders and receivers, respectively.
Parameter are estimated based on computer simulations:frequentist MCMC, with two main approaches:
1 Method of Moments (‘MoM’) :some basic features of the observed networks are considered asestimation statistics(number of changed ties, average degrees, number of transitive triplets, etc.)
and parameters are determined solving the equationexpected = observed,while conditioning on the initial observation;the expected values are estimated from forward simulations.
Dynamics of Networks and Behavior Selection and Influence
Influence and Selection
Relational embeddedness is importantfor well-being, opportunities, etc.
Actors are influenced in their behavior, attitudes, performanceby other actors to whom they are tiede.g., network resources (social capital), social control.
(N. Friedkin, A Structural Theory of Social Influence, C.U.P., 1998).
Dynamics of Networks and Behavior Selection and Influence
Influence and Selection
In return, many types of tie (friendship, cooperation, liking, etc.)are influenced by similarity on relevant attributes: homophily(e.g., McPherson, Smith-Lovin, & Cook, Ann. Rev. Soc., 2001.)
More generally, actors choose relation partnerson the basis of their behavior and other characteristics(similarity, opportunities for future rewards, etc.).
Influence, network & behavior effects on behavior;Selection, network & behavior effects on relations.
Dynamics of Networks and Behavior Selection and Influence
The investigation of such social feedback processes is difficult:
Both the network⇒ behaviorand the behavior⇒ network effectslead ‘network autocorrelation’:“friends of smokers are smokers”“high-reputation firms don’t collaboratewith low-reputation firms”.It is hard to ascertain the strengthsof the causal relations in the two directions.
Longitudinal panel data may give information aboutinterdependent dynamics of networks and behavior.
Dynamics of Networks and Behavior Co-evolution of Networks and Behavior
Statistical Methodologyfor the evolution of networks and behavior
Integrate the influence (dep. var. = behavior)and selection (dep. var. = network) processes.
Again the model assumes an evolution in continuous time;the ‘state’ of the process now isthe combination of the network and the behavior of all actors;
each dependent variable (network, behavior)has its own rate and objective function,depending on both dependent variables,which leads to their mutual dependence /entwinement in a joint feedback process.
Dynamics of Networks and Behavior Co-evolution of Networks and Behavior
Specification for the network-and-behavior model
The network and behavior both have their own objective function,with a basis constituted by what drives the variable itself,and added to this a dependence on each other.
For the network, the basis is as above;for the behavior, the basis is a feedback model for Z(including regression to the mean) based on available variables;
Dependence on each other, e.g.:
selection : network ties i → j more likely when Zi and Zj are similar;
influence : when i ’s ‘friends’ on average are higher w.r.t. Z ,Zi will have a stronger upward tendency.
Dynamics of Networks and Behavior Example: MBA students
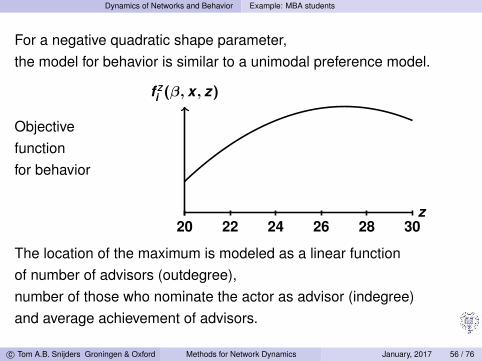
For a negative quadratic shape parameter,the model for behavior is similar to a unimodal preference model.
Objectivefunctionfor behavior
z
f Zi (β, x, z)
20 22 24 26 28 30
The location of the maximum is modeled as a linear functionof number of advisors (outdegree),number of those who nominate the actor as advisor (indegree)and average achievement of advisors.
The idea of the model for the ‘network-behaviour co-evolution’:(the unobserved sequence of micro-steps)
network is considered as one complex variable X (t);
behaviour is considered as one complex variable Z (t);
these are evolving over time in mutual dependence X (t)↔ Z (t),changes occurring in many little steps,where changes in X are a function of the current values of
(X (t),Z (t)
),
and the same holds for changes in Z .
This may be regarded as a ‘systems approach’,and is also applicable to more than one networkand more than one behavior.
The co-evolution approach can be applied also tonetwork-network co-evolution.
One or both of the networks could also be an affiliation network,i.e., a two-mode network where the first mode is the actor setand the second mode a set of binary non-exclusive attributes.
For example: individuals and clubs; firms and activities; etc.
For one-mode – two-mode co-evolution,influence and selection can be modified to the comparison ofaffiliation-based focal closure and association-based affiliation closure:(Cf. Easley & Kleinberg, 2010; Lomi & Stadtfeld, 2014)
Do we associate with those who have the same activities,or do we choose the same activities as those with whom we associate?
Parameters in the actor-oriented model determine how change occurs,but are not directly reflected by changes in network features.
Note that even though the conditional probabilitiesas determined by the objective function are constant(unless it contains time-dependent covariates),the network itself may and usually will be changingin the direction of some dynamic equilibrium(like all Markov processes).
Change and the Stochastic Actor-oriented Model (2)
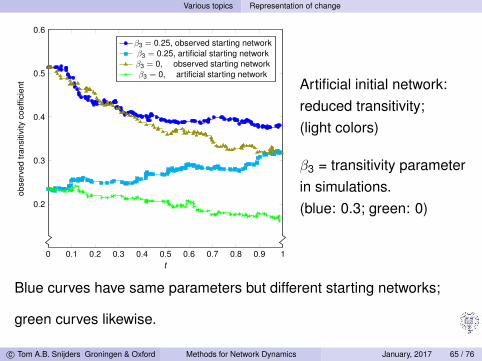
Example : a positive transitivity parameter means thatthere is a systematic tendency favoring transitivity;but it does not mean that on average transitivity is increasing,because there also are random tendencies away from transitivity.
For a network that starts with little transitive closurea positive transitivity parameter will imply increasing transitivity;but for a network that starts highly transitive,a positive transitivity parameter may go togetherwith decreasing transitivity.
Next page shows a simulation example, combiningtwo different parameters and two different starting networks.
Model specificationFor a good model specification, we need to start with reflection aboutwhat might influence the creation and disappearance of network ties,balancing between what is theoretically likely or possibleand what is empirically discernible.
But we still know little about network dynamics.
outdegree effect: balances between creation-termination of ties;reciprocity: ‘always’ there;transitivity: also ‘always’ there,but has several possible representations;degree effects:outdegrees vary because of (e.g.) response tendencies orresource differences, indegrees vary because of (e.g.) popularityor status differences, should be included by default.
For larger networks, the structure of the environmentand the associated meeting opportunities must be represented;e.g., ‘same classroom’, distance, ‘same sector’.
Interactions are possible, also between covariates and structure.
Some checks for the model specification can be obtainedby studying goodness of fit for distributions of indegree / outdegrees,triad census, distribution of geodesic distances.
It is currently unknown how robust results are for misspecification.
The transitive triplet (left) includes three subgraphs (right);actor i can create a transitive triplet by closing i → j or i → k ;therefore, to properly test transitivity, the two-pathand two-in-star configurations should be included in the model.These correspond to theoutdegree-popularity and indegree-popularity effects.
Network data are often observational, and relations are crucialfor how social actors try to attain their goals.Therefore, networks in real life are highly endogenous.
Attaining causal conclusions about network effects fromnon-experimental studies is hard, because if ties are changed, actorswill try something else that is similarly helpful for what they try to attain.
Causality in observational research, certainly in network research,is a Holy Grail: a lofty and important aim,which we should not expect to attain;cf. Shalizi & Thomas (2011):selection and influence are generically confounded.
D.R. Cox / R.A. Fisher about causality: Make your theories elaborate,construct explanations at a deeper level.
P. Hedström & P. Ylikoski: causal mechanisms.
Network approaches themselves are a deeper levelthan traditional quantitative social science approaches,representing interaction processes,and in this sense may help in coming closer to causal insights.
The approach of Stochastic Actor-oriented Modeling does notlead to causal conclusions in the Holland-Rubin counterfactual sense;it leads to conclusions about time sequentiality.
For a good network analysis, network delineation is important:the analysis proceeds as if the delineated set is the whole world –anathema to the basic tenets of the network approach.
Linked to this is the property that missing data, even randomly missing,can severely bias results of network analysis.
However, much network research suffers from difficulties in this respect.
My impression is that, if the sampled network contains, for the actorsincluded, the main parts of their relevant personal network, the generalconclusions will tend to be correct; even if parameter estimates are biased.
This is supported by some very limited simulations.
Discussion (1)Process models for networks.Theoretically: they combine agency and structure.Process-based thinking differs from variable-based thinking.The process is supposed to proceed in small steps:ties change one at a time, unobserved.Networks are quite complex entities,the number of possibilities in network processes is vast.Theory-guided network research accordingly6 needs acombination of testing and model exploration :formulate hypotheses before looking at the data,determine details of model specification depending on data,explore whether there are further non-hypothesized associations.Power for network dynamics is higher than for social influence.
SAOM available in package RSiena in the statistical system R.Find updates at R-Forge or http://www.stats.ox.ac.uk/siena/
Methods for network dynamicsand dynamics of networks & behavior (‘selection and influence’)have been applied a lot;methods for multivariate dynamics, valued networks,one-mode – two-mode co-evolution, starting to be used.
Some new developments:⇒ hierarchical multilevel: many small groups;⇒ continuous dependent variables;⇒ generalized Method of Moments for higher power co-evolution;⇒ multilevel network analysis in the sense of multiple node sets,
Some references (time-ordered)Tom A.B. Snijders (2001). The Statistical Evaluation of Social Network Dynamics.Sociological Methodology, 31, 361–395.
Tom Snijders, Christian Steglich, and Michael Schweinberger (2007),Modeling the co-evolution of networks and behaviour.Pp. 41–71 in Longitudinal models in the behavioral and related sciences,eds. Kees van Montfort, Han Oud and Albert Satorra; Lawrence Erlbaum.
Steglich, C.E.G., Snijders, T.A.B. and Pearson, M. (2010).Dynamic Networks and Behavior: Separating Selection from Influence.Sociological Methodology, 40, 329–392.
Tom A.B. Snijders, Johan Koskinen, and Michael Schweinberger (2010).Maximum Likelihood Estimation for Social Network Dynamics.Annals of Applied Statistics, 4, 567–588.
Johan H. Koskinen and Tom A.B. Snijders (2013). Longitudinal models.Pp. 130–140 in Exponential Random Graph Models,edited by Dean Lusher, Johan Koskinen, and Garry Robins. Cambridge University Press.
Tom A.B. Snijders, Alessandro Lomi, and Vanina Torlò (2013). A model for the multiplexdynamics of two-mode and one-mode networks, with an application to employmentpreference, friendship, and advice. Social Networks, 35, 265–276.
Some references (continued)Viviana Amati, Felix Schönenberger, Tom A.B. Snijders (2015). Estimation of stochasticactor-oriented models for the evolution of networks by generalized method of moments.Journal de la Société Française de Statistique, 156, 140–165.
Emmanuel Lazega and Tom A.B. Snijders, eds. (2016). Multilevel Network Analysis for theSocial Sciences; Theory, Methods and Applications. Cham: Springer.
Tom A.B. Snijders (2016). The Multiple Flavours of Multilevel Issues for Networks.Pp. 15–46 in Lazega & Snijders (2016).
Tom A.B. Snijders (2017). Stochastic Actor-Oriented Models for Network Dynamics.Annual Review of Statistics, in press
Tom A.B. Snijders and Mark Pickup (2017). Stochastic Actor-Oriented Models for NetworkDynamics. Oxford Handbook of Political Networks, edited by J.N. Victor, A.H. Montgomery,and M. Lubell. Oxford: Oxford University Press, in press.
Tom A.B. Snijders and Christian E.G. Steglich. Actor-based Models for Analyzing NetworkDynamics. Cambridge University Press, Cambridge. In preparation.
Tom A.B. Snijders and Christian E.G. Steglich, eds. Social Network Dynamics byExamples. Cambridge University Press, Cambridge. In preparation.
See SIENA manual and homepage http://www.stats.ox.ac.uk/siena/


![Stochastic Actor-Oriented Modeling for Studying Homophily ...€¦ · Open Source Software (OSS) projects are complex ecosystems of social interac-tions and technical activity [25,59].](https://static.documents.pub/doc/80x56/6062b1976c862e16e36486e2/stochastic-actor-oriented-modeling-for-studying-homophily-open-source-software.jpg)

