The Rockefeller University Press J. Exp. Med. 2018 Vol. 215 No. 1 77–90https://doi.org/10.1084/jem.20171022
The
Journ
al o
f Exp
erim
enta
l M
edic
ine
77
IntroductIonAdaptive humoral immunity depends on two systems of se-lection-coupled diversification to provide protection from a vast diversity of pathogenic threats. The first involves com-binatorial assembly of IgH and IgL V region exons during B cell development in bone marrow to form the antigen recognition piece of the B cell receptor (BCR), initially ex-pressed as IgM (Jung et al., 2006). The second involves acti-vation-induced somatic hypermutation (SHM) of V exons and IgH class switch recombination by activation-induced cytidine deaminase (AID; Hwang et al., 2015). SHM is cou-pled to affinity-based selection of BCR toward antigen in germinal centers (GCs). Clones with mutated V exons that encode higher-affinity Ig/BCR competitively secure limiting cognate T cell help, leading to antibody affinity maturation (Victora and Nussenzweig, 2012).
Burnet’s clonal selection theory posits that chance an-tigen recognition by the preimmune BCR repertoire is re-quired for the initiation and development of antigen-specific antibody responses. Under this conceptual framework, cur-rent models of how GC reactions are initiated involve initial B cell activation by antigen engagement of the BCR, fol-lowed by interactions of these B cells with antigen-specific T cells, which provide further activation stimuli (Victora and Nussenzweig, 2012; De Silva and Klein, 2015).
The degree of antigen recognition by BCR that is re-quired at this initial stage is not fully understood. Low-affinity BCRs can seed robust GC reactions in the absence of com-petition from higher-affinity clones (Dal Porto et al., 2002;
Shih et al., 2002; Schwickert et al., 2011), suggesting that competition between B cells may play a larger role than the absolute value of BCR affinity to antigen. In addition, anti-bodies cloned from activated B cells in GCs do not always bind to immunizing antigen (Di Niro et al., 2015; Kuraoka et al., 2016; Tas et al., 2016). Those studies relied on assays measuring antigen binding to secreted antibodies, which is less sensitive than testing reactivity to membrane-bound Ig/BCRs (Lingwood et al., 2012). However, they raise the pos-sibility that B cells with very low-affinity—or potentially, noncognate—B cells may be activated and allowed to enter into the GC reaction, nonspecifically, to receive activating T cell signals. Processes allowing potentially nonspecific B cells to participate in GC reactions may be caused by poorly un-derstood parameters possibly unrelated to BCR engagement, recently described as stochastic noise (Mesin et al., 2016).
Such noise mechanisms may have physiological rele-vance. In this regard, some high-affinity antibodies may have evolved from BCRs that may have had no initial recognition of antigen, as may be the case with the VRC01 class of anti–HIV-1 broadly neutralizing antibodies (Zhou et al., 2010; Scheid et al., 2011; Wu et al., 2011; Hoot et al., 2013). In ad-dition, in vitro analysis of endogenously mutating B cell lines has uncovered a surprising diversity from SHM alone (Cum-bers et al., 2002). However, whether nonspecific B cell acti-vation and SHM, supported by stochastic noise, can generate de novo antigen recognition in GCs is unclear. In addition, whether B cells activated in this way could support develop-
two immunoglobulin (Ig) diversification mechanisms collaborate to provide protective humoral immunity. combinatorial as-sembly of IgH and IgL V region exons from gene segments generates preimmune Ig repertoires, expressed as B cell receptors (Bcrs). Secondary diversification occurs when Ig V regions undergo somatic hypermutation (SHM) and affinity-based selection toward antigen in activated germinal center (Gc) B cells. Secondary diversification is thought to only ripen the antigen-bind-ing affinity of Igs that already exist (i.e., cognate Igs) because of chance generation during preimmune Ig diversification. However, whether stochastic activation of noncognate B cells can generate new affinity to antigen in Gcs is unclear. using a mouse model whose knock-in Bcr does not functionally engage with immunizing antigen, we found that chronic immunization induced antigen-specific serological responses with diverse SHM-mediated antibody affinity maturation pathways and diver-gent epitope targeting. thus, intrinsic Gc B cell flexibility allows for somatic, noncognate B cell evolution, permitting de novo antigen recognition and subsequent antibody affinity maturation without initial preimmune Bcr engagement.
Stochasticity enables BCR-independent germinal center initiation and antibody affinity maturation
Jared Silver,* Teng Zuo,* Neha Chaudhary, Rupa Kumari, Pei Tong, Sophie Giguere, Alessandra Granato, Rakesh Donthula, Colby Devereaux, and Duane R. Wesemann
Department of Medicine, Division of Rheumatology, Immunology, and Allergy, Brigham and Women's Hospital and Harvard Medical School, Boston, MA
Flexibility of somatic B cell evolution | Silver et al.78
ment of high-affinity antibodies is not well defined. The swift Darwinian nature of the GC SHM/selection process theoret-ically could enable high-affinity antibodies to be generated from any starting point regardless of initial preimmune BCR recognition. If so, this would reveal a thus-far-undefined flex-ibility of the GC system.
Here we use a strict monoclonal system in which BCR lacks the ability to physically and functionally engage with OVA in the setting of OVA-specific T cells to ex-plore BCR recognition requirements for B cell entry into the secondary/GC diversification program and to uncover possible outcomes of B cell maturation that may have had access only to evolutionary mechanisms of stochastic noise initially upon GC entry.
reSuLtS and dIScuSSIonTo examine the degree to which noncognate antigen can in-fluence GC B cell development and antibody evolution, we used a model system in which T cells, but not B cells, rec-ognize immunizing antigen. T/B monoclonal mice (which we refer to as HRO mice) have hemagglutinin (HA)-specific monoclonal B cells (via knock-in IgH and IgL V regions) and T cells with transgenic TCR specific for an OVA pep-tide (DO11.10) in the setting of Rag-1 deficiency to ensure monoclonal expression of both BCR and TCR (Curotto de Lafaille et al., 2001).
We cloned and expressed the mAb from HRO mice and measured its affinity against OVA by surface plasmon res-onance (SPR). As shown in Fig. 1 A, no binding was found, even at 10 mM OVA (the solubility limit of OVA), indicating that the association constant (Ka) of the mAb and OVA is less than 102 M-1 (Fig. 1 A, left). In contrast, the mAb binds to an HA-OVA protein conjugate at nanomolar level, as expected (Fig. 1 A, right). Because membrane-bound Ig in the form of a BCR may be able to bind to antigen better than solu-ble Ig (Lingwood et al., 2012), we examined the degree to which OVA—in either monomeric form or multimerized—could functionally engage HRO BCR on the surface of B cells. Both anti–mouse Igκ antibody and HA-OVA conjugate could trigger Ca2+ flux in HRO B cells (Fig. 1 B), indicating ability to engage BCR, as expected. However, neither mono-meric nor multimerized OVA could induce a Ca2+ flux, even at high dose (500 µg/ml; Fig. 1 B).
In addition to Ca2+ flux, BCR engagement is known to induce BCR internalization. Consistent with the Ca2+ data, we found that both anti–mouse Igκ antibody and HA-conjugated protein could trigger HRO B cell BCR in-ternalization, as indicated by reduced surface IgM, whereas monomeric or multimerized OVA could not (Fig. 1 C). OVA concentrations of up to 50 µg/ml were unable to in-duce OVA-specific T cell proliferation in co-culture assays with HRO B cells and DO11.10 T cells (Fig. S1 A). How-ever, consistent with previous reports of B cell ability to take up and present antigen nonspecifically at high concentra-tions (Rock et al., 1984), OVA concentrations of 500 µg/
ml were able to stimulate B cell–dependent T cell prolifer-ation (Fig. S1 A). Collectively, these data indicate that OVA is essentially a noncognate antigen for HRO BCR, incapa-ble of binding soluble antibody and unable to engage mem-brane-associated BCR, but capable of being processed in MHC II-containing processing compartments through what is likely a BCR-independent pathway.
To examine the degree to which OVA immunization can induce GC formation in the HRO system, we immu-nized HRO mice with OVA intraperitoneally and stained for GC B cell markers peanut agglutinin (PNA) and GL7 in CD19+ splenic, mesenteric lymph node (mLN), and Peyer’s patch (PP) B cells at 4, 8, and 12 d. At day 4, we found that some mice had clear induction of GCs in splenic and mLN B cells with OVA/alum immunization compared with alum alone (control; Fig. 1, D and E). However, GC B cells in PP were largely at background levels at baseline and were not in-duced with OVA immunization (Fig. 1, D and E). Because T cell activation is required for GC induction, the latter finding is likely caused by the absence of T cell antigen in the intes-tinal luminal compartment, sampled by PPs.
We sorted single GC B cells from HRO mice 8 and 12 d after OVA immunization and found a substantial number of sequences with a mutation frequency of 1–4 in both IgH and Igκ V regions (Fig. 1 F). Mutation analysis showed sequence changes clustering in complementary-determining regions (CDRs; Fig. 1, G and H), which are known to harbor intrin-sic AID-mediated mutability (Yeap et al., 2015). These results suggest that, if given sufficient T cell help, B cells may harbor a permissiveness to participate in the GC fate and can initiate AID-mediated Ig diversification in the absence of any evi-dence of BCR engagement or measurable affinity for antigen.
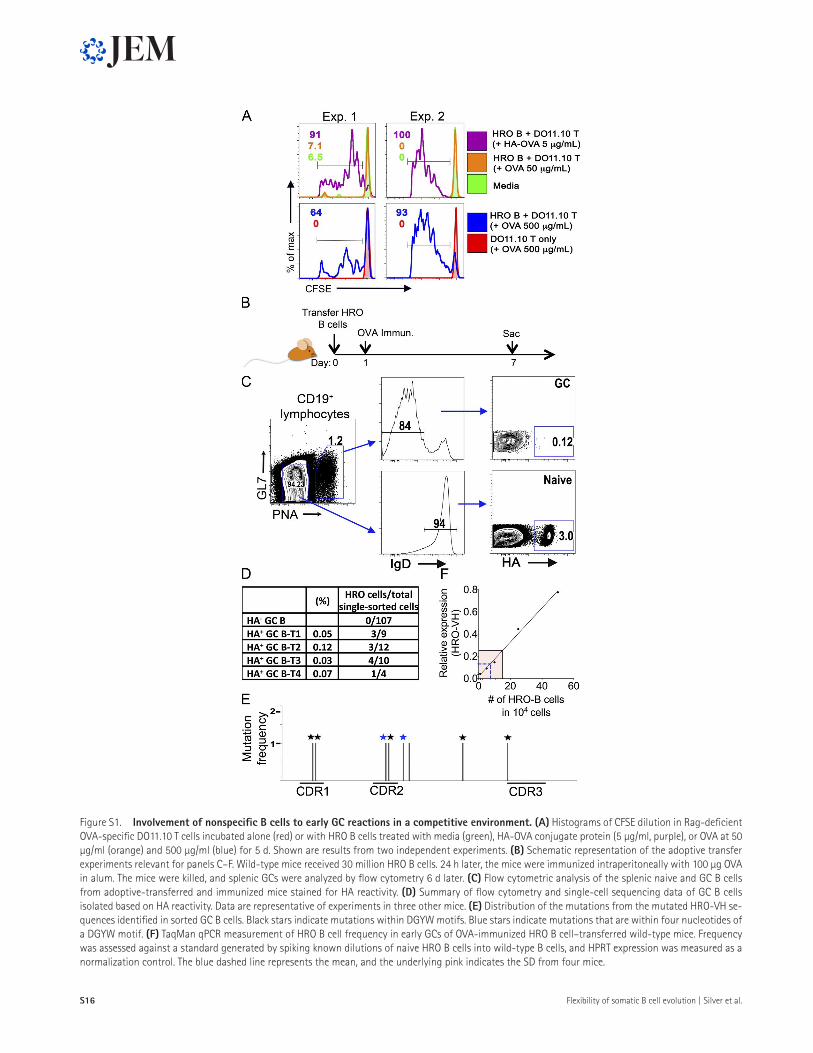
To determine whether nonspecific B cells can enter GCs in the context of a competitive B cell environment, we injected HA-reactive HRO B cells into wild-type mice and immunized them with OVA the next day (Fig. S1 B). On day 6 after immunization, we observed that 3% of naive (IgD+ PNA−) splenic B cells were HA reactive (Fig. S1 C). In this setting, ∼0.1% of GC (IgD− PNA+) B cells were HA positive, and of these, one quarter to one third of them identified with the HRO sequence, with most mutations within AID target motifs (Fig. S1, D and E). We designed a TaqMan quantitative PCR (qPCR) assay with primers and probe that leverage the unique IgH CDR3 of HRO sequence. Analysis of activated GC B cells with this assay after OVA immunization indi-cated that ∼1/1,000 (0.008 ± 0.007) are HRO B cells (Fig. S1 F). This represents the lower limit, as other HRO B cells may have mutated away from recognition in these assays. In addition, it is very likely that much more than 3% of B cells are nonspecific for any particular antigen. These experiments suggest that noncognate B cells can enter GCs and diversify through SHM in a competitive setting.
To test whether chronic stimulation with OVA can induce HRO antibody maturation toward de novo OVA reactivity, we serially immunized HRO mice with OVA in
alum adjuvant every 2–3 wk for several months and tracked OVA reactivity in plasma. All immunized HRO mice gen-erated anti-OVA antibody responses (Fig. 2 A). Responses in HRO mice were delayed and lacked consistency in the timing of their appearance (Fig. 2 A). However, this delay and inconsistency may be explained by a monoclonal T cell sys-
tem (Leung et al., 2013; Preite et al., 2015), as Tcr transgenic OT-II mice have a similar serological response upon OVA immunization (Fig. 2 A).
Flow cytometric analysis of splenic B cells of chronically immunized mice identified CD19+ B220lo OVA+ B-lineage cells (Fig. 2 B). We sorted single OVA+ B cells from three
Figure 1. Gc can be initiated by noncognate antigen in Hro mice. (a) SPR data showing the binding of OVA (left) or HA-OVA conjugate (right) to original mAb cloned from HRO mice. The box inset magnifies phases of kinetic analyses including OVA injection, association, and dissociation at millimolar OVA concentrations relative to running buffer (0 mM). The negative deflection indicates increased binding to the reference channel compared with OVA. Data are representative of three independent experiments. (B) Intracellular Ca2+flux of HRO B cells as indicated by Indo-1 acetoxymethyl violet/blue ratio upon treatment with HA-OVA conjugate protein (5 µg/ml), anti-Igκ (20 µg/ml), monomeric OVA (500 µg/ml), multimerized OVA (500 µg/ml), or no stimulus (control). Data are representative of three independent experiments. (c) HRO B cell BCR internalization as indicated by shift in IgM signal after incubation of HRO B cells for 4 h with HA-OVA (5 µg/ml), anti-Igκ (20 µg/ml), OVA (500 µg/ml), multimerized OVA (500 µg/ml), or medium. Data are representative of three independent experiments. (d and e) FACS plots showing day 4 GC B cells in the spleen (SpL), mLN, and PP from an HRO mouse immunized with OVA in alum adjuvant (OVA-imm) or alum adjuvant alone (control; D) and summary of GCs in the SpL, mLN, and PP from HRO mice immunized with OVA (n = 18) and HRO mice injected with alum adjuvant alone (n = 7; E). *, P < 0.05, calculated by unpaired t test; ns, not significant. (F) Pie charts showing the amino acid mutation frequency of VH and Vκ from GC B cells in three OVA-immunized HRO mice. (G and H) Logo graphs representing the frequency of amino acid changes observed in VH (G) and Vκ (H) sequences from sorted GC B cells 8 or 12 d after immunization as indicated. CDRs are indicated.
Flexibility of somatic B cell evolution | Silver et al.80
mice (referred to as 1, 2, and 3) and sequenced the variable re-gions of heavy and light chain (VH and VL) from individual B cells. We also cloned and expressed seven representative mAbs (1A3, 1A4, 2B11, 2C1, 3A6, 3D1, and 3D7) from the sorted OVA+ B-lineage cells and measured their binding affinities to OVA by SPR. Each of the seven antibodies cloned and tested showed clear reactivity, with an affinity constant (Ka) in the range of 107–108 M-1 (Fig. 2 C).
We analyzed VH and Vκ mutation patterns from single OVA+ HRO B cells from mouse 1, 2, and 3. We found some amino acid changes that were shared between mice, such as the N53Y, G55V, and Y59F changes in mouse 1 and 2, seen in >50% of the VH sequences. Although the N53Y and Y59F changes were seen in approximately half of the OVA+ VH sequences from mouse 3, other enriched changes were not common among the other mice (Fig. 3 A), such as S84N,
S30F, and S31Y (Fig. 3 A and Fig. S2 A). Antibody clone 3D7, from mouse 3, which has high-affinity OVA binding (Fig. 2 B), has neither the G55V or Y59F changes, and clone 3A6, also confirmed to be a high-affinity OVA binder, has the Y59F but not the G55V or N53Y changes (Fig. 3 A and Fig. S2 A). Enriched amino acid changes were also seen in Vκ sequences but were not shared between the different mice (Fig. 3 A and Fig. S2 A). These data suggest that, although there are some common shared changes, a diversity of anti-body sequences can arrive at OVA reactivity from the same nonreactive starting point through the secondary Ig SHM and selection system. Consistent with this, analysis of the clonal relationships between VH and Vκ sequences from OVA+ single cells showed a multiclade organization that was concordant between VH and Vκ pairs derived from the same cell, as shown by colored boxes linking the VH and Vκ clades in Fig. 3 B.
Figure 2. chronic oVa immunization can generate high-affinity anti-oVa IgG in Hro mice. (a) ELI SA data measuring anti-OVA IgG1 in plasma from OVA-immunized HRO mice (left, n = 8) and OT-II mice (right, n = 7) with their respective strain matched wild-type controls (n = 4 and 6, respectively) over time. Each line represents individual mice. (B) Representative flow cytometry data of OVA-reactive splenic B cells from unimmunized (control) and mice chronically immunized with OVA plus alum (OVA immun.). Dump channel includes CD4, CD8, CD11c, GR1, and F4/80. (c) SPR kinetic analyses of binding af-finity for seven monoclonal antibodies (1A3, 1A4, 2B11, 2C4, 3A6, 3D1, and 3D7) cloned and expressed from single sorted OVA+ B cells from three HRO mice chronically immunized with OVA. Each colored line graph per SPR plot represents a given OVA (analyte) concentration in the indicated ranges compared with negative control SPR running buffer (identified as 0 nM analyte concentration). RU, resonance units. At least four OVA analyte concentrations are shown per SPR plot and used for derivation of equilibrium binding constants. Each SPR kinetic analysis shown is representative of three independent experiments for each of the monoclonal antibodies. Equilibrium binding affinity constants were derived from the mean of the three separate experiments per clone.
In general, sequences derived from one mouse occupied a single clade, with the exception of one, boxed in orange in Fig. 3 B, which is shared by clones from mouse 1 and 3. The clones tested and shown to have high-affinity OVA reactivity by SPR described in Fig. 2 C are indicated by stars and are represented in each clade in Fig. 3 B.
We sorted OVA+ cells from six different mice chron-ically immunized with OVA and subjected them to deep sequencing. We found that mutations accumulate at simi-lar VH and VL locations, largely at DGYW (D = A, G, or T; Y = C or T; W = A or T) sequence motifs, which is a fa-vored AID target (Rogozin and Diaz, 2004; Fig. 3 C). Con-sistent with the single-cell clade analysis, phylogenetic analysis from the deep-sequencing data showed that sequences from individual mice are largely clustered together, suggesting that mutation pathways to OVA reactivity largely differ be-tween mice (Fig. 3 D). In addition, IgM, IgG, and IgE iso-types are represented in the OVA-reactive pool (Fig. 3 E). We also did deep sequencing on the bulk population of B cells from unimmunized mice to determine the background HRO BCR mutation frequency. We found very low levels of background mutation in the range of sequencing error rate (Schirmer et al., 2016; Fig. S2 B), indicating that ran-dom mutations in naive mice favorable for OVA binding are extremely unlikely to occur at baseline. However, we cannot fully rule out this possibility.
To determine the epitope diversity of anti-OVA anti-body response in OVA-immunized HRO mice, we con-structed a random mutagenesis library of OVA (one to five random amino acid mutations per sequence) and displayed the library on the surface of yeast. We first screened the li-brary for mutants failing to bind to OBI mAb, whose epitope is already known (Dougan et al., 2012; Fig. 4, A and B). By sequencing the mutants, we found that mutations were highly enriched on positions G65, F66, and G67, consistent with the reported epitope of OBI mAb.
We screened this OVA mutant yeast display library with OVA-reactive antibodies from single cells, namely, clones 1A3 (clade red), 2C1 (clade blue), 3D7 (clade green), and 3D1 (outside of clades; Fig. 4 A). We sorted yeast clones that failed binding and sequenced them to identify putative epitopes. We defined the positions with at least three mutations as epi-tope candidates and checked their locations on the structure of OVA. We considered that epitope candidates that are not clustered on the 3D OVA surface, or that are not exposed on the surface, as potential background signals. Among all eight candidate residues of 1A3, seven are exposed and clustered on the surface of OVA (the exception is H329), suggesting that 1A3 recognizes a conformational epitope consisting of H23, N25, R200, E203, Q204, E205, and S385 (Fig. 4, B and C). For 2C1, all the candidate residues are exposed except I158, which is partially covered. In addition, the mutations are enriched on positions E203, Q204, and E205, indicating that these are the core epitopes of 2C1. Although 3D1 has more candidate residues than 1A3 and 2C1, only eight resi-
dues (N27, V201, T202, E203, Q204, E205, E257, and S385) remain after the nonexposed and nonclustered residues are excluded (Fig. 4, B and C). Compared with the other three mAbs, 3D7 has the most candidate residues, but only nine residues (F181, G183, L184, F189, D191, T194, E337, G339, and E341) are exposed and clustered together; the others are either buried or scattered on the surface (Fig. 4, B and C). Comparing these epitopes, we found that 1A3, 2C1, and 3D1 bind to a similar epitope, whereas 3D7, which was iso-lated from the same mouse as 3D1, targets a different epitope, demonstrating that the SHM/GC selection system permits multiple epitope targeting, despite initiating from a homoge-neous sequence in the same animal.
We also serially immunized HRO mice with OVA con-jugates, namely, OVA-fluorescein and OVA-TNP, simultane-ously. Anti-fluorescein and anti-TNP responses could also be detected in chronically immunized HRO mice (Fig. 4, D and E). These results indicate that serological responses are not unique to OVA and are consistent with the findings that mul-tiple haptens can be targeted.
By juxtaposing monoclonal noncognate B cells with T cells specific for immunizing antigen, our experiments were designed to identify how flexible the GC B cell system can be to respond to activating cues without regard to deterministic BCR signals. The current paradigm is that the secondary di-versification/selection system depends on chance recognition of antigen by the preimmune Ig repertoire to engage GC processes that nurture affinities already present. The findings described here suggest that the GC system may be more flex-ible than previously anticipated.
It is possible that in vivo BCR engagement may some-how occur in a fashion not observed here experimentally, such as the association of OVA with other particles that can be recognized by the preimmune repertoire. However, several lines of evidence argue for the absence of any meaningful initial interaction of antigen and BCR in this system. First, the SPR data show no trace of binding between the HRO antibody and OVA, even at saturating concentrations of OVA. Second, BCR internalization and Ca2+ signals were not ob-served when treated with high-dose and multimerized OVA in context of naturally expressed, membrane BCR. Third, despite the monoclonal starting point, multiple distinct epi-topes can be targeted, on both OVA itself and anti-hapten responses from OVA-hapten immunization. If OVA were able to trigger the HRO HA-specific BCR in vivo, affinity matu-ration around a single OVA-epitope would be expected, and responses to two different haptens, randomly chosen, would not be expected. Together, these findings strongly suggest that recognition can be generated during the SHM process within B cells nonspecifically activated by mechanisms unrelated to BCR engagement with antigen.
Mechanistically, for B cells to acquire OVA-specific T cell help, OVA would require access into B cells. Although BCR is the most efficient way to deliver antigen through the cell to surface MHC II (Kakiuchi et al., 1983; Rock et
Flexibility of somatic B cell evolution | Silver et al.82
Figure 3. Sequence analysis of oVa+ Hro B cells. (a) Amino acid mutation frequency in HRO VH and Vκ of OVA+ single cells from three HRO mice (#1, #2, #3) isolated 268 d after the first immunization. The number of sequences represented in each plot is indicated. (B) Maximum-likelihood phylogenetic trees for paired single-cell VH (left) and Vκ (right) sequences from three HRO mice. The different color markers represent sequences from three different mice (#1 red, #2 blue, and #3 green). The blocks mark different clades in VH (left) and Vκ (right). Dashed lines link the pairing clades. Black stars indicate
al., 1984), B cells can take up and process antigen through MHC-containing processing compartments to influence T cell interactions in a BCR-independent manner (Rock et al., 1984; Jellison et al., 2007; Dwyer et al., 2014). Low-level OVA, nonspecifically taken in and presented by HRO B cells, may be sufficient for OVA-specific T cells to provide B cell activation signals—inducing Ig diversity through induc-tion of AID and SHM. B cell selection in this setting would initially be driven by BCR-independent stochastic factors. These factors could include (but are not limited to) param-eters such as proximity to limiting T cells and differences of OVA uptake caused by uneven concentration gradients. Other pathways of B cell diversity unrelated to BCR affin-ity include asymmetric GC B cell division (Barnett et al., 2012; Thaunat et al., 2012) as well as other less well-defined intracellular stochastic factors intrinsic to B cells that influ-ence behavior (Barnett et al., 2012). SHM, together with stochastic selection, can continue until BCR diversification is sufficient to generate de novo antigen recognition by the BCR within the GC itself. Because BCR involvement can increase the efficiency of B cell antigen presentation by at least ∼1,000 fold (Kakiuchi et al., 1983; Rock et al., 1984), selection based on affinity maturation would dominate after acquisition of initial BCR recognition.
Although it remains to be determined whether conver-sion of noncognate B cells to antigen reactivity occurs in real physiological conditions, the BCR-independent ability of B cell antigen uptake and presentation may be physiologically relevant. In this regard, it may provide a safety net function to cover potential deficiencies (i.e., holes) in the primary Ig repertoire to immunologically important epitopes, although perhaps at the cost of timeliness and consistency because of the rare involvement of nonspecific B cells in the setting of a competitive environment (Fig. S1, B–F). This may have rel-evance to antibody responses that appear to occur despite observations that unmutated Ig ancestors fail to bind native antigen, as is the case with the VRC01 class of broadly neu-tralizing antibodies (Zhou et al., 2010; Scheid et al., 2011; Wu et al., 2011; Hoot et al., 2013), which appear inconsistently and after unusual delays (Mascola and Haynes, 2013). In ad-dition, stochastic noise has also been observed in B cell re-sponses despite the presence of BCRs specific to immunizing antigen. Visualization of a system designed to fluorescently label B cells of identical affinity to antigen with diverse colors revealed that GC B cells were able to deviate substantially from baseline color distributions (Tas et al., 2016).
Our data may also suggest functions of a diverse primary Ig repertoire beyond providing anticipatory antigen recogni-tion. A diverse Ig repertoire also furnishes a diversity of AID substrates. In this setting, despite BCR nonreactivity to begin with, SHM in diverse—but nonspecifically activated—B cells with diverse Ig V region sequence substrates would be ex-pected to generate de novo antigen recognition more effi-ciently. Because this system may be used to target epitopes not otherwise targeted in the setting of natural preimmune BCR repertoires, our findings have implications for antibody bioengineering and vaccinology. We conclude that the GC somatic evolution system is sufficiently flexible such that pre-immune BCR engagement is not required to generate de novo B cell–mediated antigen recognition and subsequent Ig affinity maturation.
MaterIaLS and MetHodSMiceAll mice were housed at the Karp Research Building at Chil-dren’s Hospital Boston. The T/B mice, referred to as HRO, maintained on a BALB/c background, were described previ-ously (Curotto de Lafaille et al., 2001) and were provided by J. Lafaille (Skirball Institute of Biomolecular Medicine, New York, NY). Some HRO mice were interbred with BALB/c Rag 1 knockout mice, mouse strain 003145 (The Jackson Laboratory), to produce HRO mice possessing one HA- specific allele and another unassembled allele. Rag-deficient monoallelic and biallellic anti-HA BCR mice were used in the experiments. Wild-type BALB/c controls were obtained from the Jackson Laboratory were bred and maintained in a specific pathogen–free mouse facility in the Karp Re-search Building. OT-II mice (B6.Cg-Tg(TcraTcrb)425Cb-n/J) and C57BL/6J controls were obtained from the Jackson Laboratory. The Institutional Animal Care and Use Com-mittee for Children’s Hospital Boston approved all mouse experiments for this study.
ImmunizationsMice 4–8 wk of age were immunized in cohorts up to 260 d, with recurrent immunization intervals 2–3 wk apart. Mice underwent intraperitoneal immunization with either a single immunogen, OVA (Sigma-Aldrich), or simultaneous admin-istration of trinitrophenyl (TNP) (11)-OVA conjugate (Bio-search Technologies) plus fluorescein (0.8)-OVA (Biosearch Technologies). All immunogens were combined with Imject Alum (Thermo Fisher Scientific) in a 1:1 ratio and agitated
the clones tested by SPR. (c) Histograms showing stacked mutation frequencies at each position in VH and Vκ as calculated from deep sequencing data of OVA+ B cells from six HRO mice (6TR, 6TLTR, 6TL, 5TL, 5BR, and 2BR). The sequences from each mouse are represented with different colors, with the number of sequences mentioned in brackets. The CDRs, DGYW AID target motifs, and AGCT motifs, which serve as an optimal version of DGYW for AID targeting, are shown. Only productive sequences are shown. Replacement and silent mutations are indicated. (d and e) Dendrograms of unique HRO VH and Vκ from deep-sequencing data created by maximum-likelihood method. n, number of sequences. Trees are rooted at the unmutated common ancestors (indicated by black boxes). Colors represent different mice (D) or IgH isotype information (E), n = 5 (VH) and 6 (Vκ). For clarity, sequences with more than 13 mutations are shown for Vκ.
Flexibility of somatic B cell evolution | Silver et al.84
Figure 4. Hro B cells can evolve toward multiple epitopes and haptens. (a) FACS plots showing the screening of a yeast library with five anti-OVA mAbs. Yeast displaying unmutated OVA (left) or a library of OVA mutants (mut. lib., right) were stained with OBI, 1A3, 2C1, 3D1, and 3D7 together with an anti–c-myc antibody. The OBI mAb was used as a control, as it has a described epitope (Dougan et al., 2012). c-myc is a tag used to indicate the expression of OVA or OVA mutant proteins. Yeast displaying OVA mutants that fail to bind with mAb (c-myc single-positive popu-lation) were gated and sorted. Dozens of yeast clones sorted by each mAb were sequenced (n = 19–96). (B) Epitope analysis of anti-OVA mAbs. Sequences of sorted mutants were aligned with wild-type OVA, and the mutations on each amino acid position were calculated and plotted in the histograms shown. Positions with three or more mutations were defined as epitope candidates and labeled beside the corresponding column in different colors: black, buried residues; green, ex-posed but spatially scattered residues; magenta, epitope of OBI; red, epitope of 1A3, 2C1, and 3D1; blue, epitope of 3D7. The red dashed line indicates three times background mutation lev-els, which we used as a cutoff for candidate res-idues representing putative epitopes. The number of sequenced mutants for each mAb is noted in each histogram. (c) Spatial epitope mapping of anti-OVA mAbs. The residues in B are high-lighted on the 3D structure model of OVA with the same color. (d and e) ELI SA data showing anti-TNP (D) and anti-fluorescein (E) IgG1 from plasma collected from wild-type (green, n = 3) and HRO (red) mice serially immunized with OVA-TNP (n = 5) and OVA-fluorescein (n = 5) conjugate proteins, or PBS (blue, n = 4). Each line represents an individual mouse.
by vortex at room temperature for 30 min before injection. Controls for immunization included PBS 1× combined with Imject Alum in a 1:1 ratio. For administration of OVA, doses of 100 µg were used. For administration of OVA with either TNP (OVA-TNP) or fluorescein (OVA-fluorescein), doses of 30–45 µg of each conjugate were used.
Mouse plasmaMouse blood was collected by facial vein bleeding at the time of immunization. Approximately 50–250 µl of whole blood was collected for each mouse per facial vein bleed in micro-tainer K2EDTA tubes (BD). The samples were centrifuged in a benchtop microcentrifuge (Eppendorf Model 5424 or 5427R) at 400 g for 6 min. Approximately 10–50 µl of plasma was obtained for samples at varying time points.
eLI SaELI SA plates (C96 NUNC MaxiSorp; Thermo Fisher Scien-tific) were coated with OVA (50 µg/ml; Sigma-Aldrich), fluo-rescein (5)-BSA (10 µg/ml; Biosearch Technologies), or TNP (11)-BSA (10 µg/ml; Biosearch Technologies) diluted in bicar-bonate coating buffer (3.03 g Na2CO3, 6.0 g NaHCO3, and 1× PBS, with a final pH of 9.6) and incubated overnight at 4°C. The next day, plates were washed with wash buffer (1× PBS with 0.05% Tween-20; Sigma-Aldrich) and blocked with 5% BSA (Sigma-Aldrich) in wash buffer for 1.5 h at 37°C. Blocking solution was removed by rinsing with wash buffer three times. Standards were applied in dilutions (1:2) from the initial starting concentrations as follows: anti-OVA IgG1 stan-dard (Purified Anti-Chicken OVA; BioLegend) using 5 µg/ml, anti-fluorescein standard (IgG Fraction Monoclonal Mouse anti-fluorescein; Jackson ImmunoResearch) at 10 µg/ml, and anti-TNP standard (Purified Mouse IgG1 λ Isotype Control; BD Biosciences) at 10 µg/ml. Plasma was added at 1:50 to 1:500 dilutions in duplicate, followed by serial dilution of each sample (1:10) in three subsequent dilution wells for each sample. After incubation at room temperature for 2 h (or storage overnight at 4°C), plates were washed six times with wash buffer before being coated with their respective secondary antibodies as fol-lows: 10 µg/ml anti-OVA IgG1 (AKP Rat Anti-Mouse IgG1 Clone: X5C; BD PharMingen), anti-fluorescein IgG1, and αTNP IgG1 ELI SAs. Secondary antibodies were incubated for 1 h at room temperature. Plates were washed with wash buffer eight times, and 100 µl phosphatase substrate buffer (2 × 10 mg substrate tablets; S0942; Sigma-Aldrich) diluted into 10 ml ELI SA development solution (1 M glycine, 10 mM ZnCl2, and 10 mM MgCl2 in 1× PBS) was added to each well. Blank wells, coated with the target antigens and incubated with secondary antibodies without plasma or standards, were included for each plate in duplicate. Sample and standard dilutions were also per-formed in duplicate for each plate. Plate readings were taken at 5- to 10-min intervals using an ELI SA Plate Reader set to 405 nm (tunable Versa Max microplate reader; Molecular Devices). SoftMax Pro software v.5.4.1, Microsoft Excel, and GraphPad Prism software were used to analyze plate data.
B cell staining and sortingFor GC B cell staining, total splenocytes from OVA- immunized HRO mice and control mice were stained with DAPI, PNA-FITC, anti–GL-7-Percp-Cy5-5, anti–IgD-PE, anti–CD19-APC-Cy7, anti–IgM-PE-Cy7, anti–IgG1-APC, anti–CD4-BV510, anti–CD8-BV510, anti–CD11c-BV510, anti–F4/80-BV510, and anti–Gr1-BV510. GC B cells with the phenotype DAPI−, CD19+, Dump−(CD4, CD8, CD11c, F4/80, and Gr1), PNA+, GL-7+, and IgD− were gated and single-cell sorted into 96-well plates containing lysis buffer (0.5× PBS, 10 mM dithiothreitol, and 4 U RNaseOUT) on a BD FAC SAria sorter and immediately stored at −80°C. For OVA-specific B cell staining, total splenocytes from OVA-immunized HRO mice and control mice were stained with DAPI, anti–CD19-APC-Cy7, anti–B220-Percp-Cy5-5, OVA–Alexa Fluor 647, anti–IgM-PE-Cy7, anti–IgG1-APC, anti–CD4-BV510, anti–CD8-BV510, anti–CD11c-BV510, anti–F4/80-BV510, and anti–Gr1-BV510. OVA-specific B cells were selected for the phenotype DAPI−, CD19+, Dump−(CD4, CD8, CD11c, F4/80, and Gr1), B220low, and OVA+. OVA-specific B cells were single-cell sorted into 96-well plates or bulk sorted into TRIzol.
Single B cell rt-Pcr, antibody cloning, and expressionSingle B cell RT-PCR, antibody cloning, and expression were performed as previously described (Tiller et al., 2009). In brief, reverse transcription was performed with Super-Script III (18-080-044; Thermo Fisher Scientific) and ran-dom hexamer primer. Two rounds of PCR were performed to amplify the VH and Vκ. The first-round PCR reactions were performed using HotStar Taq DNA polymerase (Qia-gen 203205) with the following primers: 5′-MsVHE-HRO, GGG AAT TCG AGG TGC AGC TGG TGG AGT CTGG-3′; Cμ outer, 5′-AGG GGG CTC TCG CAG GAG ACG AGG-3′; Cγ1 outer, 5′-GGA AGG TGT GCA CAC CGC TGG AC-3′; Cγ2c outer, 5′-GGA AGG TGT GCA CAC CAC TGG AC-3′; Cγ2b outer, 5′-GGA AGG TGT GCA CAC TGC TGG AC-3′; Cγ3 outer, 5′-AGA CTG TGC GCA CAC CGC TGG AC-3′; L-Vκ_6,8,9, 5′-ATG GAA TCA CAG RCY CWG GT-3′; and mCκ, 5′-GAT GGT GGG AAG ATG GAT ACA GTT-3′. The second round of PCR reactions were performed with the following primers: MsVHE-HRO, 5′-GGG AAT TCG AGG TGC AGC TGG TGG AGT CTGG-3′; HRO-VH-Rev, 5′-TGC GAA GTC GAC GCT GCA GAG ACC GTG ACC AGAG-3′; mVkappa-HRO, 5′-GAC ATT GTG ATG ACA CAG TCT CCA-3′; and HRO-VL-Rev, 5′-GCC ACC GTA CGT TTC AGC TCC AGC TTG GTC-3′. PCR products were then sequenced by Sanger sequencing. To express the mAbs from single B cells, the selected sequences were cloned into a human IgG1- or human Igκ-mammalian expression vector for antibody expression. Then heavy chain vector and light chain vector were cotransfected into 293T cells with polyethyleneimine, and supernatants were harvested after 48 h. The antibody expression vectors were provided by G.D. Victora (The Rockefeller University, New York, NY).
Flexibility of somatic B cell evolution | Silver et al.86
Bcr internalizationHRO splenocytes were resuspended in R15 cell culture medium and seeded in a 96-well plate (2 × 10⁵ cells/well). Anti-Igκ antibody, OVA conjugated with HA, OVA mono-mer, and OVA multimer were added, and the cells were in-cubated in CO2 incubator for 4 h. Cells were harvested and stained with anti–CD19-APC-Cy7, anti–IgM-PE-Cy7, anti–CD4-APC, and DAPI. The cells were analyzed on a Canto II (BD), and FACS data were analyzed in FlowJo software (Tree Star). IgM fluorescence intensity shift was used to eval-uate BCR internalization.
calcium flux assayTotal HRO splenocytes at 107 cells/ml were loaded with 5 µM Indo-1 acetoxymethyl (I-1203; Thermo Fisher Scientific) in HBSS with 2% FCS for 30 min at 37°C. DAPI, anti–CD19-APC-Cy7, and anti–B220-PE were added for the last 15 min of incubation. Cells were washed twice and left at room tem-perature for 15 min in HBSS with 2% FCS. Cells were then equilibrated at 37°C, and signal at Indo blue and Indo violet of gated B cells was collected for 1 min to record baseline Ca2+ levels as the ratio of Indo violet/blue. Cells were then stimulated with anti-Igκ antibody, OVA conjugated with HA, OVA monomer, and OVA multimer, and Ca2+ levels were recorded for an additional 3 min. Ionomycin-stimulated cells were used as a positive control. Data were collected in a FACS LSR II Fortessa (BD) and analyzed using FlowJo.
Library preparation and sequencingFor Sanger sequencing, total RNA was extracted using the TRIzol method (Invitrogen), followed by cDNA first chain synthesis using Superscript III (Invitrogen) with random hex-amers (Random Primer 6; New England Biolabs). Amplifi-cation for heavy (IgH) and light (IgL) chains was conducted in separate reactions. For heavy chains, all isotypes were run in one reaction. First-round PCR reactions included 2 µl cDNA, 8 µl of 5× High Fidelity (HF) buffer, dNTP mix-ture (final concentration 250 µM each), forward and reverse primers (final concentration 250 nM each, primer sequences follow), 0.5 µl Phusion DNA polymerase (Thermo Fisher Scientific), adjusted to a final volume with RNase- and DNase-free water of 40 µl. First-round PCR primers for IgH (Igμ, Igγ1, Igγ2b, Igγ2c, Igγ3) were MsVHE, 5′-GGG AAT TCG AGG TGC AGC TGC AGG AGT CTGG-3′; Cμ outer, 5′-AGG GGG CTC TCG CAG GAG ACG AGG-3′; Cg1 outer, 5′-GGA AGG TGT GCA CAC CGC TGG AC-3′; Cg2c outer, 5′-GGA AGG TGT GCA CAC CAC TGG AC-3′; Cg2b outer, 5′-GGA AGG TGT GCA CAC TGC TGG AC-3′; and Cg3 outer, 5′-AGA CTG TGC GCA CAC CGC TGG AC-3′. First-round PCR primers for IgL (Igκ) were L-Vκ_3, 5′-TGC TGC TGC TCT GGG TTC CAG-3′; L-Vκ_4, 5′-ATT WTC AGC TTC CTG CTA ATC-3′; L-Vκ_5, 5′-TTT TGC TTT TCT GGA TTY CAG-3′; L-Vκ_6, 5′-TCG TGT TKC TST GGT TGT CTG-3′; L-Vκ_6,8,9, 5′-ATG GAA TCA CAG RCY CWG GT-3′; L-Vκ_14, 5′-TCT TGT TGC TCT GGT TYC
PCR primers were previously described (Tiller et al., 2009). We used the following first-round PCR program: 98°C for 30 s, then 18 cycles of 98°C for 10 s, 65°C for 30 s, 72°C for 30 s, and 72°C for 5 min. Second-round PCR reac-tions included 5 µl cDNA, 8 µl of 5× HF buffer, dNTP mix-ture (final concentration 250 µM each), forward and reverse primers (final concentration 250 nM each, primer sequences follow), and 0.5 µl Phusion DNA polymerase, followed by volume adjustment with RNase- and DNase-free water into 40 µl. Second-round PCR primers for IgH (Igμ, Igγ1, Igγ2b, Igγ2c, Igγ3) were MsVHE, 5′-GGG AAT TCG AGG TGC AGC TGC AGG AGT CTGG-3′; Cμ inner, 5′-AGG GGG AAG ACA TTT GGG AAG GAC-3′; Cg1 inner, 5′-GCT CAG GGA AAT AGC CCT TGAC-3′; Cg2c inner, 5′-GCT CAG GGA AAT AAC CCT TGAC-3′; Cg2b inner, 5′-ACT CAG GGA AGT AGC CCT TGAC-3′; and Cg3 inner, 5′-GCT CAG GGA AGT AGC CTT TGAC-3′. Second-round PCR Primers for IgL (Igκ) were mVκ, 5′-GAY ATT GTG MTS ACM CAR WCT MCA-3′, and BsiWI P-mJK04, 5′-GCC ACC GTA CGT TTC AGC TCC AGC TTG GTC-3′. The sec-ond-round PCR program was as follows: 98°C for 30 s, then 18 cycles of 98°C for 10 s, 65°C for 30 s, 72°C for 30 s, and 72°C for 5 min. Second-round PCR products were purified by gel purification kit (QIAquick Gel Extraction kit; Qia-gen), cloned into pGEM-T vector (Promega), and sequenced by Sanger method (Eton Bioscience). For deep sequencing, total RNA was extracted using the TRIzol method (Invit-rogen), followed by cDNA first-chain synthesis using SMA RTScribe reverse transcription (Clontech) and a mixture of IgH (Igμ, Igγ1, Igγ2b, Igγ2c, Igγ3, Igε) and IgL (Igκ) constant region specific primers (IDT) in which TdR is replaced with UdR as follows: Cmu outer, 5′-AGG GGG CUC UCG CAG GAG ACG AGG-3′; Cg1 outer, 5′-GGA AGG UGU GCA CAC CGC UGG AC-3′; Cg2c outer, 5′-GGA AGG UGU GCA CAC CAC UGG AC-3′; Cg2b outer, 5′-GGA AGG UGU GCA CAC UGC UGG AC-3′; Cg3 outer, 5′-AGA CUG UGC GCA CAC CGC UGG AC-3′; Cep outer, 5′-CAC UUG GCU GGU GGU GAC CUUG-3′; and mCK outer, 5′-GAU GGU GGG AAG AUG GAU ACA GUU-3′. After incubation for 90 min at 42°C, heat-inactivation of reverse transcription was performed at 70°C. Then, 1 µl Antarctic Thermolabile Uracil DNA glycosylase (New England Biolabs) was added per 20 µl cDNA products, incubated at 37°C for 60 min to remove the previously added gene-specific primers, and in-cubated at 70°C for 20 min to heat-inactivate uracil DNA glycosylase. IgH and IgL chain cDNAs were barcoded in separate reactions using Phusion DNA polymerase (Thermo Fisher Scientific) and forward barcode primers including UNI-8N-leader forward, 5′-AAG CAG TGG TAT CAA CGC AGA GNN NNN NNN GAG GTG CAG CTG CAG GAG TCT GG-3′, and UNI-8N-HRO H forward, 5′-AAG CAG TGG TAT CAA CGC AGA GNN NNN NNN GAG GTG CAG
CTG GTG GAG TCT GG-3′, for IgH, and UNI-8N-HROK forward, 5′-AAG CAG TGG TAT CAA CGC AGA GNN NNN NNN GAC ATT GTG ATG ACA CAG TCT CCA TCC-3′, for IgL. The barcoding reaction contained 5 µl cDNA products, 8 µl of 5× HF buffer, 1 µl dNTP mixture (final concentration 250 µM each), barcode primer (final concentration 400 nM), and 0.2 µl Phusion DNA polymerase, with adjusted volume using RNase- and DNase-free water to 40 µl. The barcod-ing program was as follows: 98°C for 1 min, 55°C for 30 s, 72°C for 10 min. Extraneous barcode primers were removed with 1 µl Exonuclease VII (New England Biolabs) per 40-µl reaction, incubated at 37°C for 1 h, followed by heat-inac-tivation at 95°C for 15 min. First-round PCR was designed to add adaptors at the 5′ and 3′ ends of the amplicon. Am-plifications for heavy and light chain were done in separate reactions. Specifically, for heavy chain, each isotype was run separately. The first-round PCR reaction contained 5 µl bar-coded single-stranded DNA products, 8 µl of 5× HF, dNTP mixture (final concentration 250 µM each), forward and re-verse primers (final concentration 250 nM each), and 0.5 µl Phusion DNA polymerase, with adjustment of final volume with RNase- and DNase-free water to 40 µl. First-round PCR primers for IgH (Igμ, Igγ1, Igγ2b, Igγ2c, Igγ3, Igε) were CS1-UNV forward, 5′-TAC ACT GAC GAC ATG GTT CTA CAA AGC AGT GGT ATC AACG-3′; mIgM reverse, 5′-TAC GGT AGC AGA GAC TTG GTC TAG TAG GGG GAA GAC ATT TGG GAA GGAC-3′; mIgG1 reverse, 5′-TAC GGT AGC AGA GAC TTG GTC TTC AGC TCA GGG AAA TAG CCC TTG AC-3′; mIgG2b reverse, 5′-TAC GGT AGC AGA GAC TTG GTC TTG AAC TCA GGG AAG TAG CCC TTG AC-3′; mIgG2C reverse, 5′-TAC GGT AGC AGA GAC TTG GTC TAC TGC TCA GGG AAA TAA CCC TTG AC-3′; mIgG3 reverse, 5′-TAC GGT AGC AGA GAC TTG GTC TCT AGC TCA GGG AAG TAG CCT TTG AC-3′; and mIgE reverse, 5′-TAC GGT AGC AGA GAC TTG GTC TGC TGG CAG CCC AGG GTC ATG GAAG-3′. First-round PCR primers for IgL (Igκ) chain were CS1-UNV forward, 5′-TAC ACT GAC GAC ATG GTT CTA CAA AGC AGT GGT ATC AACG-3′, and mIgK-HRO reverse, 5′-TAC GGT AGC AGA GAC TTG GTC TGT ATT TCA GCT CCA GCT TGG TC-3′.
We used the following PCR program for first-round deep-sequencing PCR: 98°C for 30 s, then 18 cycles of 98°C for 10 s, 65°C for 30 s, 72°C for 30 s, and 72°C for 5 min. Second-round PCR reaction was designed to add the Illu-mina linkers and sample barcodes. Amplifications for IgH and IgL were done in separate reactions, with each IgH isotype run separately. First-round PCR products generated in the Wesemann Laboratory were submitted to the DNA Services laboratory at the W.M. Keck Center at the University of Il-linois at Urbana-Champaign. Second-round PCR reactions included 4 µl of first-round PCR product used for each sam-ple. The following reagents were combined: 2.0 µl of 10× FastStart Reaction Buffer without MgCl2, 3.6 µl of 25 mM MgCl2, 1.0 µl DMSO, 0.4 µl of 10 mM PCR grade nucle-otide mix, 0.2 µl of 5 U/µl FastStart High Fidelity Enzyme
Blend, and 3.8 µl water. 11 µl reagent mix was combined with 4 µl diluted first-round PCR product and 4 µl Illumina linker barcodes with the primers P5-CS1, 5′-AAT GAT ACG GCG ACC ACC GAG ATC TAC ACT GAC GAC ATG GTT CTA CA-3′, and P7-index-CS2, 5′-CAA GCA GAA GAC GGC ATA CGA GAT[unique molecular identifier]TAC GGT AGC AGA GAC TTG GTCT-3′). The PCR cycling program consisted of 95°C for 10 min, 1 cycle at 95°C 15 s, 60°C for 30 s, and 72°C for 1 min. In total, 19 cycles were con-ducted followed by 72°C for a 3-min extension. A diagram of the deep-sequencing strategy is provided in Fig. S3. PCR products were quantified on a Qubit fluorimeter (Life Tech-nologies) and stored at −20°C. All samples were run on a Fragment Analyzer (Advanced Analytics), and amplicon re-gions and expected sizes were confirmed. Samples were then pooled in equal amounts according to product concentra-tion. The pooled products were size-selected on a 2% agarose E-gel (Life Technologies) and extracted from the isolated gel slice with a gel extraction kit (Qiagen). Cleaned size-selected products were run on an Agilent Bioanalyzer to confirm ap-propriate profile and determine mean size. The final pools were quantitated using Qubit (Life Technologies) and diluted to 5 nM final concentration. The 5-nM dilutions were fur-ther quantitated by qPCR on a CFX Connect Real-Time System (Bio-Rad Laboratories) and pooled evenly. The pool was denatured and spiked with 15% nonindexed PhiX con-trol library provided by Illumina and loaded onto the MiSeq V2 Nano flow cell at a concentration of 7 pM for cluster formation and sequencing. The PhiX control library provides a balanced genome for calculation of matrix, phasing, and prephasing, which are essential for accurate base calling. The libraries were sequenced from both ends of the molecules to a total read length of 250 nt from each end. The run gen-erated .bcl files, which were converted into demultiplexed compressed fastq files using bcl2fastq 2.17.1.14 (Illumina). A secondary pipeline decompressed the fastq files, generated plots with quality scores using FastX Tool Kit, and generated a report with the number of reads per sample/library. The .bcl files were also processed in bcl2fastq 2.17.1.14 without demul-tiplexing and reported. Both sorted unsorted fastq files were .tgz compressed and posted to a password-secured FTP site.
deep-sequencing analysisThe sequences obtained from Illumina MiSeq deep sequenc-ing were merged using PEAR v.0.9.10. The paired-end reads were truncated at the ends if the residues had a Phred score of less than 22. The merge criteria included minimum overlap of 20 nt and a minimum merged length of 380 nt for the heavy chain and 350 nt for the light chain. For intermittent low score (<20), nucleotides were replace by “N.” All sequences with four consecutive N’s were truncated at that point. PCR repeats were excluded using the unique molecular identifiers. Sequences with the same unique molecular identifier and a mismatch of 2% (8 nt, considered PCR error) were considered PCR repeats of the same mRNA. A consensus was generated
Flexibility of somatic B cell evolution | Silver et al.88
keeping the most frequently occurring nucleotides at each position. At this juncture, all sequences obtained by Sanger methodology were added to the analysis and subjected to the next steps alongside sequences derived from high-through-put methodology. MUS CLE v3.8.31 was used for multiple sequence alignment. Multiple sequence alignments were ed-ited with Jalview v.2.10. The N’s were either replaced during consensus formation or assumed to be unmutated. The ini-tial 15 nt (heavy chain) and 3 nt (light chain) of the heavy and light chains were removed during editing, as they had higher probability of PCR error/sequencing error. Mutation frequencies for each position and the number of mutations per sequence were calculated taking unmutated HRO heavy and light chains as reference. All analysis was done on Bio-conductor package v.3.4 (R v.3.3.1). The dendrograms were created using MEGA7 v.7.0.18.
SPrAll SPR experiments were performed using the Biacore 3000 Processing Unit (GE) in the Molecular Biology Core Facility for Proteomics at Dana Farber Cancer Institute, Boston, MA. All expression clone–derived antibodies were tested using in-dividualized runs performed in triplicate. A protein A sensor chip (GE) was used for analysis of all expression clone–de-rived IgG binding to OVA or HA-OVA conjugate. BIAnor-malizing solution (70% [wt/wt] glycerol; GE) was used for periodic normalization of flow cells. BIA regeneration buffer, pH 1.7 (GE Healthcare), was used to regenerate the sensor chip surface after each cycle for each experimental run. All SPR assays were conducted using buffer containing 0.01 M Hepes, pH 7.4, 0.15 M NaCl, 3 mM EDTA, and 0.005% vol/vol Surfactant P20 (HBS-EP; GE Healthcare). The HBS-EP running buffer was used as a sample diluent, as running buf-fer for all cycles including start-up cycles, and as a negative control for analyte affinity binding in the active and reference flow cells. Reference channels were subtracted. All SPR data shown reflects the use of expression clone–derived antibodies from 293 T cell tissue culture supernatants after transfection. Supernatants were collected from Falcon 175-cm2 sterile tissue culture flasks (Thermo Fisher Scientific) 48 h after cotransfection of 293 T cells using 250 µl polyethylenimine (stock 1 mg/ml; Polysciences) along with 25 µg of both IgH and IgL expression vectors per flask. The 293 T cells were maintained for 48 h in DMEM containing 4.5 g/L glucose, l-glutamine, sodium pyruvate, and 10% FCS (Corning Cell-gro). Supernatants were centrifuged in a Beckman Coulter GPR large benchtop centrifuge at 1,100 g for 30 min to remove cell debris before SPR.
All supernatant-derived, expression clone IgGs were used either diluted or undiluted in HBS-EP buffer and bound to the surface of the protein A chip. Different levels of IgG (li-gand) binding to the protein A surface were evaluated for mul-tiple expression clones via resonance signal, although this was neither expected nor observed to significantly alter equilib-rium binding constants. For unmutated expression clone IgGs,
IgG binding to the protein A chip was evaluated for resonance ranging from 400 to 10,000 RU. For mutated expression clone IgGs, isolated from single-cell sorting and representing biolog-ical pairings of IgH and IgL, the range of resonance studied for IgG bound to the protein A chip was 300 to 2,000 RU. Three separate SPR runs were performed for expression clone IgGs, and Ka is reported as a mean of those runs. OVA (Sigma- Aldrich) and HA-OVA analytes, diluted in HBS-EP buffer, with concentrations ranging from nanomolar to millimolar, were injected over surface-bound expression clone IgG to perform kinetic binding affinity analyses. For any given SPR run, at least one analyte concentration was performed in du-plicate, and HBS-EP buffer alone was used for initial start-up cycles and as a control cycle after each series of analytes. Addi-tionally, for any given SPR run, five to seven different analyte concentrations were tested. All binding affinity analyses were conducted using Biacore 3000 software, with a particular focus on the kinetic analysis function using kinetic wizard templates. All SPR data were analyzed first using BIA evaluation soft-ware followed by analysis of text files in Microsoft Excel and then production of figures using Adobe Photoshop CS6.
epitope mappingEpitope mapping of the five mAbs was performed by screening the OVA random mutagenesis library displayed on the surface of yeast as previously reported (Zuo et al., 2015). OVA was originally amplified from pcDNA3-OVA and then cloned to yeast surface display vector pCTC ON2. The pCTC ON2-OVA construct was chemically transformed to yeast cell line EBY100 to display OVA on the surface of yeast. Two rounds of error-prone PCR generated the OVA random mutagenesis library. The PCR products, together with linearized pCTC ON2 plasmid, were transformed into yeast competent cells using electroporation. The induced yeast library was stained with each of the five mAbs, and mutants losing binding to the mAbs were gated and sorted. Yeast displaying OVA was used as a positive control to gate the target population. Anti–c-myc antibody was used to identify yeasts displaying the transformed constructs. The sorted yeasts were sequenced, and mutations in OVA were identified by sequence alignment. OBI mAb was provided by S.K. Dougan (Dana-Farber Cancer Institute, Boston, MA) and H.L. Ploegh (Boston Children's Hospital and Harvard Medical School, Boston, MA). Plasmid pCTC ON2 and yeast strain EBY100 were provided by D.K. Wittrup (Koch Institute for Integrative Cancer Research, Massachusetts Institute of Technology, Cambridge, MA). Plasmid pcDNA3-OVA was a gift from S. Diebold and M. Zenke (Max-Delbrück-Center for Molecular Medicine, MDC, Berlin, Germany; plasmid 64599; Addgene). The structure of OVA was reported previously (Stein et al., 1991), and the structure figures were made with PYM OL (http ://pymol .org /).
t cell proliferationRBC-lysed HRO splenocytes were separated from non–B cell antigen presenting cells by treating with a biotin-labeled
cocktail of anti-CD11b (eBioscience), anti-CD11c (BioLeg-end), and anti-Ly-6G/Ly-6C (GR-1; BioLegend) followed by anti-biotin magnetic bead labeling (Miltenyi Biotec) and column separation. Unbound flow-through was subjected to further magnetic column separation with anti-CD4 (L3T4) and B220 microbeads (Miltenyi Biotec). T cells were stained with CFSE to assess proliferation. A 96-well flat-bottomed tissue culture plate was seeded with 2 × 10⁵ B cells and 5 × 10⁴ CFSE-stained CD4+ T cells with HA-OVA (5 µg/ml) conjugate or OVA (50 or 500 µg/ml) alone. T cell CFSE was assessed cytometrically after 5 d of co-culture.
t cell transfer and qPcr to analyze the frequency of Hro-B IgH in Gcs1 d before immunization with 100 µg OVA, 30 million B220+ purified HRO B cells were transferred intravenously into wild-type BALB/c mice, which were killed 7 d after transfer. HA-positive B cells were identified with a biotinylated HA peptide and streptavidin conjugated to BV711. To analyze the frequency of HRO-B cells in the GC pool, a standard curve was generated by spiking 0.01–1.0% HRO-B cells into the 104 wild-type B cells. Approximately 104 GC B cells were sorted from HRO-B cells transferred wild-type BAL-B/c mice. Total RNA was isolated from each of the samples using the Trizol method (Invitrogen). Preparation of cDNA was performed by random hexamer (New England Biolabs) priming and superscript III (Invitrogen) reverse transcrip-tion for 60 min at 50°C. To analyze the HRO-B IgH fre-quency, specific TaqMan probe and primers for HRO-B IgH CDR3 were used (forward primer, 5′-CAC CCT GTA CCT GCA AAT GA-3′; reverse primer, 5′-CCA GTA AGC AAA CCC GTT CT-3′; and TaqMan probe, 5′-ATT ACT GTG CAA GAC GGG AGA GGT-3′), and reactions were run on a Mx3005p Stratagene real-time PCR machine in triplicate. Frequency is presented as the difference in threshold cycle values normalized with HPRT.
data availabilityThe Illumina MiSeq raw sequence data for this study is accessible at the NCBI Sequence Read Archive (SRA) under BioProject accession no. PRJ NA388102 with BioSample accession nos. SAMN07199532 through SAMN07199557. The Sanger sequences are available in GenBank under accession nos. MF320741 through MF321728. Source code for sequence analysis can be found at https ://github .com /Wesemann -lab /Mutation -analysis -of -Immunoglobulin -Sequences.
online supplemental materialFig. S1 shows the involvement of nonspecific B cells to early GC reactions in a competitive environment. Fig. S2 displays multiple sequence alignment of VH and VK from paired sin-gle-cell sequences and HRO BCR background mutation frequency. Fig. S3 provides a schematic representation of the deep-sequencing strategy.
acknowLedGMentSThis work is supported by National Institutes of Health grants AI121394 and AI1113217 and a grant from Food Allergy Research and Education (to D.R. Wese-mann). N. Chaudhary was supported by AI007306-31. A. Granato was supported by the Conselho Nacional de Desenvolvimento Científico e Tecnológico/Science without Borders program, Brazil. D.R. Wesemann holds a Career Award for Medical Scientists from the Burroughs Wellcome Fund.
The authors declare no competing financial interests.Author contributions: J. Silver and T. Zuo designed experiments, performed
experiments, and prepared the manuscript; N. Chaudhary performed computational analysis of sequencing data and prepared figures; R. Kumari, P. Tong, S. Giguere, A. Granato, R. Donthula, and C. Devereaux performed experiments; and D.R. Wesemann conceptualized the study, designed experiments, supervised research, and wrote the manuscript.
Submitted: 6 June 2017
Revised: 12 October 2017
Accepted: 7 November 2017
reFerenceSBarnett, B.E., M.L. Ciocca, R. Goenka, L.G. Barnett, J. Wu, T.M. Laufer,
J.K. Burkhardt, M.P. Cancro, and S.L. Reiner. 2012. Asymmetric B cell division in the germinal center reaction. Science. 335:342–344. https ://doi .org /10 .1126 /science .1213495
Cumbers, S.J., G.T. Williams, S.L. Davies, R.L. Grenfell, S. Takeda, F.D. Batista, J.E. Sale, and M.S. Neuberger. 2002. Generation and iterative affinity maturation of antibodies in vitro using hypermutating B-cell lines. Nat. Biotechnol. 20:1129–1134. https ://doi .org /10 .1038 /nbt752
Curotto de Lafaille, M.A., S. Muriglan, M.J. Sunshine, Y. Lei, N. Kutchukhidze, G.C. Furtado, A.K. Wensky, D. Olivares-Villagómez, and J.J. Lafaille. 2001. Hyper immunoglobulin E response in mice with monoclonal populations of B and T lymphocytes. J. Exp. Med. 194:1349–1359. https ://doi .org /10 .1084 /jem .194 .9 .1349
Dal Porto, J.M., A.M. Haberman, G. Kelsoe, and M.J. Shlomchik. 2002. Very low affinity B cells form germinal centers, become memory B cells, and participate in secondary immune responses when higher affinity competition is reduced. J. Exp. Med. 195:1215–1221. https ://doi .org /10 .1084 /jem .20011550
De Silva, N.S., and U. Klein. 2015. Dynamics of B cells in germinal centres. Nat. Rev. Immunol. 15:137–148. https ://doi .org /10 .1038 /nri3804
Di Niro, R., S.J. Lee, J.A. Vander Heiden, R.A. Elsner, N. Trivedi, J.M. Bannock, N.T. Gupta, S.H. Kleinstein, F. Vigneault, T.J. Gilbert, et al. 2015. Salmonella infection drives promiscuous B cell activation followed by extrafollicular affinity maturation. Immunity. 43:120–131. https ://doi .org /10 .1016 /j .immuni .2015 .06 .013
Dougan, S.K., S. Ogata, C.C. Hu, G.M. Grotenbreg, E. Guillen, R. Jaenisch, and H.L. Ploegh. 2012. IgG1+ ovalbumin-specific B-cell transnuclear mice show class switch recombination in rare allelically included B cells. Proc. Natl. Acad. Sci. USA. 109:13739–13744. https ://doi .org /10 .1073 /pnas .1210273109
Dwyer, D.F., M.C. Woodruff, M.C. Carroll, K.F. Austen, and M.F. Gurish. 2014. B cells regulate CD4+ T cell responses to papain following B cell receptor-independent papain uptake. J. Immunol. 193:529–539. https ://doi .org /10 .4049 /jimmunol .1303247
Hoot, S., A.T. McGuire, K.W. Cohen, R.K. Strong, L. Hangartner, F. Klein, R. Diskin, J.F. Scheid, D.N. Sather, D.R. Burton, and L. Stamatatos. 2013. Recombinant HIV envelope proteins fail to engage germline versions of anti-CD4bs bNAbs. PLoS Pathog. 9:e1003106. https ://doi .org /10 .1371 /journal .ppat .1003106
Hwang, J.K., F.W. Alt, and L.S. Yeap. 2015. Related mechanisms of antibody somatic hypermutation and class switch recombination. Microbiol. Spectr. 3:MDNA3-0037-2014. https ://doi .org /10 .1128 /microbiolspec .MDNA3 -0037 -2014
Flexibility of somatic B cell evolution | Silver et al.90
Jellison, E.R., H.M. Guay, E. Szomolanyi-Tsuda, and R.M. Welsh. 2007. Dynamics and magnitude of virus-induced polyclonal B cell activation mediated by BCR-independent presentation of viral antigen. Eur. J. Immunol. 37:119–128. https ://doi .org /10 .1002 /eji .200636516
Jung, D., C. Giallourakis, R. Mostoslavsky, and F.W. Alt. 2006. Mechanism and control of V(D)J recombination at the immunoglobulin heavy chain locus. Annu. Rev. Immunol. 24:541–570. https ://doi .org /10 .1146 /annurev .immunol .23 .021704 .115830
Kakiuchi, T., R.W. Chesnut, and H.M. Grey. 1983. B cells as antigen-present-ing cells: The requirement for B cell activation. J. Immunol. 131:109–114.
Kuraoka, M., A.G. Schmidt, T. Nojima, F. Feng, A. Watanabe, D. Kitamura, S.C. Harrison, T.B. Kepler, and G. Kelsoe. 2016. Complex antigens drive permissive clonal selection in germinal centers. Immunity. 44:542–552. https ://doi .org /10 .1016 /j .immuni .2016 .02 .010
Leung, S., D. Smith, A. Myc, J. Morry, and J.R. Baker Jr. 2013. OT-II TCR transgenic mice fail to produce anti-ovalbumin antibodies upon vaccination. Cell. Immunol. 282:79–84. https ://doi .org /10 .1016 /j .cellimm .2012 .12 .006
Lingwood, D., P.M. McTamney, H.M. Yassine, J.R. Whittle, X. Guo, J.C. Boyington, C.J. Wei, and G.J. Nabel. 2012. Structural and genetic basis for development of broadly neutralizing influenza antibodies. Nature. 489:566–570. https ://doi .org /10 .1038 /nature11371
Mesin, L., J. Ersching, and G.D. Victora. 2016. Germinal center B cell dynamics. Immunity. 45:471–482. https ://doi .org /10 .1016 /j .immuni .2016 .09 .001
Preite, S., D. Baumjohann, M. Foglierini, C. Basso, F. Ronchi, B.M. Fernandez Rodriguez, D. Corti, A. Lanzavecchia, and F. Sallusto. 2015. Somatic mutations and affinity maturation are impaired by excessive numbers of T follicular helper cells and restored by Treg cells or memory T cells. Eur. J. Immunol. 45:3010–3021. https ://doi .org /10 .1002 /eji .201545920
Rock, K.L., B. Benacerraf, and A.K. Abbas. 1984. Antigen presentation by hapten-specific B lymphocytes. I. Role of surface immunoglobulin receptors. J. Exp. Med. 160:1102–1113. https ://doi .org /10 .1084 /jem .160 .4 .1102
Rogozin, I.B., and M. Diaz. 2004. Cutting edge: DGYW/WRCH is a better predictor of mutability at G:C bases in Ig hypermutation than the widely accepted RGYW/WRCY motif and probably reflects a two-step activation-induced cytidine deaminase-triggered process. J. Immunol. 172:3382–3384. https ://doi .org /10 .4049 /jimmunol .172 .6 .3382
Scheid, J.F., H. Mouquet, B. Ueberheide, R. Diskin, F. Klein, T.Y. Oliveira, J. Pietzsch, D. Fenyo, A. Abadir, K. Velinzon, et al. 2011. Sequence and structural convergence of broad and potent HIV antibodies that mimic CD4 binding. Science. 333:1633–1637. https ://doi .org /10 .1126 /science .1207227
Schirmer, M., R. D’Amore, U.Z. Ijaz, N. Hall, and C. Quince. 2016. Illumina error profiles: Resolving fine-scale variation in metagenomic sequencing data. BMC Bioinformatics. 17:125. https ://doi .org /10 .1186 /s12859 -016 -0976 -y
Schwickert, T.A., G.D. Victora, D.R. Fooksman, A.O. Kamphorst, M.R. Mugnier, A.D. Gitlin, M.L. Dustin, and M.C. Nussenzweig. 2011. A dynamic T cell-limited checkpoint regulates affinity-dependent B cell entry into the germinal center. J. Exp. Med. 208:1243–1252. https ://doi .org /10 .1084 /jem .20102477
Shih, T.A., E. Meffre, M. Roederer, and M.C. Nussenzweig. 2002. Role of BCR affinity in T cell dependent antibody responses in vivo. Nat. Immunol. 3:570–575. https ://doi .org /10 .1038 /ni803
Stein, P.E., A.G. Leslie, J.T. Finch, and R.W. Carrell. 1991. Crystal structure of uncleaved ovalbumin at 1.95 A resolution. J. Mol. Biol. 221:941–959. https ://doi .org /10 .1016 /0022 -2836(91)80185 -W
Tas, J.M., L. Mesin, G. Pasqual, S. Targ, J.T. Jacobsen, Y.M. Mano, C.S. Chen, J.C. Weill, C.A. Reynaud, E.P. Browne, et al. 2016. Visualizing antibody affinity maturation in germinal centers. Science. 351:1048–1054. https ://doi .org /10 .1126 /science .aad3439
Thaunat, O., A.G. Granja, P. Barral, A. Filby, B. Montaner, L. Collinson, N. Martinez-Martin, N.E. Harwood, A. Bruckbauer, and F.D. Batista. 2012. Asymmetric segregation of polarized antigen on B cell division shapes presentation capacity. Science. 335:475–479. https ://doi .org /10 .1126 /science .1214100
Tiller, T., C.E. Busse, and H. Wardemann. 2009. Cloning and expression of murine Ig genes from single B cells. J. Immunol. Methods. 350:183–193. https ://doi .org /10 .1016 /j .jim .2009 .08 .009
Wu, X., T. Zhou, J. Zhu, B. Zhang, I. Georgiev, C. Wang, X. Chen, N.S. Longo, M. Louder, K. McKee, et al. NISC Comparative Sequencing Program. 2011. Focused evolution of HIV-1 neutralizing antibodies revealed by structures and deep sequencing. Science. 333:1593–1602. https ://doi .org /10 .1126 /science .1207532
Yeap, L.S., J.K. Hwang, Z. Du, R.M. Meyers, F.L. Meng, A. Jakubauskaitė, M. Liu, V. Mani, D. Neuberg, T.B. Kepler, et al. 2015. Sequence-intrinsic mechanisms that target AID mutational outcomes on antibody genes. Cell. 163:1124–1137. https ://doi .org /10 .1016 /j .cell .2015 .10 .042
Zhou, T., I. Georgiev, X. Wu, Z.Y. Yang, K. Dai, A. Finzi, Y.D. Kwon, J.F. Scheid, W. Shi, L. Xu, et al. 2010. Structural basis for broad and potent neutralization of HIV-1 by antibody VRC01. Science. 329:811–817. https ://doi .org /10 .1126 /science .1192819
Zuo, T., J. Sun, G. Wang, L. Jiang, Y. Zuo, D. Li, X. Shi, X. Liu, S. Fan, H. Ren, et al. 2015. Comprehensive analysis of antibody recognition in convalescent humans from highly pathogenic avian influenza H5N1 infection. Nat. Commun. 6:8855. https ://doi .org /10 .1038 /ncomms9855
Flexibility of somatic B cell evolution | Silver et al.S16
Figure S1. Involvement of nonspecific B cells to early Gc reactions in a competitive environment. (a) Histograms of CFSE dilution in Rag-deficient OVA-specific DO11.10 T cells incubated alone (red) or with HRO B cells treated with media (green), HA-OVA conjugate protein (5 µg/ml, purple), or OVA at 50 µg/ml (orange) and 500 µg/ml (blue) for 5 d. Shown are results from two independent experiments. (B) Schematic representation of the adoptive transfer experiments relevant for panels C–F. Wild-type mice received 30 million HRO B cells. 24 h later, the mice were immunized intraperitoneally with 100 µg OVA in alum. The mice were killed, and splenic GCs were analyzed by flow cytometry 6 d later. (c) Flow cytometric analysis of the splenic naive and GC B cells from adoptive-transferred and immunized mice stained for HA reactivity. (d) Summary of flow cytometry and single-cell sequencing data of GC B cells isolated based on HA reactivity. Data are representative of experiments in three other mice. (e) Distribution of the mutations from the mutated HRO-VH se-quences identified in sorted GC B cells. Black stars indicate mutations within DGYW motifs. Blue stars indicate mutations that are within four nucleotides of a DGYW motif. (F) TaqMan qPCR measurement of HRO B cell frequency in early GCs of OVA-immunized HRO B cell–transferred wild-type mice. Frequency was assessed against a standard generated by spiking known dilutions of naive HRO B cells into wild-type B cells, and HPRT expression was measured as a normalization control. The blue dashed line represents the mean, and the underlying pink indicates the SD from four mice.
S17JEM
Figure S2. Multiple sequence alignment of VH and Vκ from paired single-cell sequences and Hro Bcr background mutation frequency. (a) The different colors and shapes represent three different mice corresponding to the phylogenetic tree of paired sequences. Stars mark the SPR-tested sequences. (B) Distribution of mutation frequencies for each nucleotide position in VH and Vκ (VL) of unimmunized HRO mouse splenic B cells from deep-sequencing data are shown. Two different mouse data from independent experiments (Expt.) are shown. n, number of sequences.
Flexibility of somatic B cell evolution | Silver et al.S18
Figure S3. Schematic representation of deep-sequencing strategy. Proceeding top to bottom on the diagram, extracted HRO B cell RNA was sub-jected to first-chain synthesis using reverse transcription and multiple IgH and IgL constant region specific primers (designated “Specific 1”). After removal of primers using uracyl DNA glycosylase, heat inactivation of this enzyme, and reverse transcription, IgH and IgL underwent barcoding reactions to add a unique molecular identification, using barcoding primers designated “Specific 2,” which also enable second-strand cDNA synthesis. The Specific 2 primer also contains a universal (UNV) linker sequence used for downstream addition of PCR adaptors. Residual Specific 2 primers were removed with exonucle-ase 1. Then, once second-strand cDNA synthesis was completed, deep-sequencing library preparation proceeded through two steps of PCR amplification. First-round PCR was designed to add adaptors at both 5′ and 3′ ends of the amplicon, designated “CS1” and “CS2.” The CS1 adaptor uses a UNV linker sequence to anneal to the cDNA template and amplify. The CS2 adaptor uses a cDNA specific sequence, designated “Specific 3,” to anneal to the cDNA tem-plate and amplify. First-round amplification for IgH and IgL, as well as different IgH isotypes, was conducted in separate reactions. Second-round PCR was designed to add the Illumina linkers and sample barcodes, designated “Illumina P5” and “Illumina P7,” to the cDNA libraries. Second-round amplification for IgH and IgL, as well as different IgH isotypes, was also conducted in separate reactions. PCR amplicons subsequently underwent quality control measures and Illumina MiSeq analyses to produce the sequencing data.