121
Stock status of Queensland’s fisheries resources 2012 Department of Agriculture, Fisheries and Forestry Great state. Great opportunity. cs2309 03/13
Stock status of Queensland’s fisheries resources 2012
Department of Agriculture, Fisheries and Forestry
Great state. Great opportunity.
cs2309 03/13

This publication has been compiled by Bonnie Holmes, Megan Leslie, Malcolm Keag, Anthony Roelofs, Michelle Winning and Brad Zeller of the Fisheries Assessment Unit of Department of Agriculture, Fisheries and Forestry. © State of Queensland, 2013. The Queensland Government supports and encourages the dissemination and exchange of its information. The copyright in this publication is licensed under a Creative Commons Attribution 3.0 Australia (CC BY) licence.
Under this licence you are free, without having to seek our permission, to use this publication in accordance with the licence terms. You must keep intact the copyright notice and attribute the State of Queensland as the source of the publication. For more information on this licence, visit http://creativecommons.org The information contained herein is subject to change without notice. The Queensland Government shall not be liable for technical or other errors or omissions contained herein. The reader/user accepts all risks and responsibility for losses, damages, costs and other consequences resulting directly or indirectly from using this information.
Stock status of Queensland’s fisheries resources 2011 1
Stock status of Queensland’s fisheries resources 2012 2
Contents Glossary .................................................................................................................................................................4
Fishery acronyms..................................................................................................................................................5
Introduction............................................................................................................................................................6
Key outcomes in 2012...........................................................................................................................................7
Queensland Statewide Recreational Fishing Survey.........................................................................................7
Stock status of Queensland fishery resources in 2012 – summary table .......................................................8
Stock background and status determination summary pages.......................................................................11
Amberjack (Seriola dumerili) East Coast ..........................................................................................................12
Barramundi (Lates calcarifer) East Coast.........................................................................................................13
Barramundi (Lates calcarifer) Gulf of Carpentaria...........................................................................................16
Blue Eye Trevalla (Hyperoglyphe antarctica) East Coast...............................................................................18
Bonito (Sarda spp.) East Coast.........................................................................................................................19
Bream–Yellowfin (Acanthopagrus australis) East Coast ................................................................................20
Bugs–Balmain (Ibacus chacei and I. brucei) East Coast.................................................................................22
Bugs–Moreton Bay (Thenus australiensis & T. parindicus) East Coast........................................................24
Cobia (Rachycentron canadum) East Coast.....................................................................................................26
Coral Trout (Plectropomus spp. and Variola spp.) East Coast.......................................................................27
Crab–Blue Swimmer (Portunus armatus) East Coast......................................................................................28
Crab–Mud (Scylla spp.) East Coast ...................................................................................................................29
Crab–Mud (Scylla spp.) Gulf of Carpentaria .....................................................................................................31
Crab–Spanner (Ranina ranina) East Coast .......................................................................................................33
Crab–Three-spotted (Portunus sanguinolentus) East Coast..........................................................................34
Cuttlefish (Sepia spp.) East Coast .....................................................................................................................36
Freshwater Eel (Anguilla australis & A.reinhardtii) East Coast......................................................................38
Emperor–Grass (Lethrinus laticaudis) East Coast ..........................................................................................39
Emperor–Red (Lutjanus sebae) East Coast......................................................................................................40
Emperor–Red (Lutjanus sebae) Gulf of Carpentaria........................................................................................41
Emperor–Redthroat (Lethrinus miniatus) East Coast .....................................................................................42
Emperor–Spangled (Lethrinus nebulosus) East Coast ...................................................................................43
Flathead–Dusky (Platycephalus fuscus) East Coast .......................................................................................44
Groper–Bass (Polyprion americanus) East Coast ...........................................................................................46
Javelin (Pomadasys spp.) East Coast ...............................................................................................................47
Javelin (Pomadasys spp.) Gulf of Carpentaria.................................................................................................48
Kingfish–Yellowtail (Seriola lalandi) East Coast ..............................................................................................49
Lobster–Red Champagne (Linuparus trigonus) East Coast ...........................................................................50
Mackerel–Grey (Scomberomorus semifasciatus) East Coast ........................................................................52
Mackerel–Grey (Scomberomorus semifasciatus) Gulf of Carpentaria ..........................................................54
Mackerel–School (Scomberomorus queenslandicus) East Coast .................................................................56
Mackerel–Shark (Grammatorcynus bicarinatus) East Coast..........................................................................57
Mackerel–Spanish (Scomberomorus commerson) East Coast......................................................................58
Mackerel–Spanish (Scomberomorus commerson) Gulf of Carpentaria........................................................60
Stock status of Queensland’s fisheries resources 2012 3
Mackerel–Spotted (Scomberomorus munroi) East Coast...............................................................................62
Mahi Mahi (Coryphaena hippurus) East Coast.................................................................................................64
Octopus (Octopodidae) East Coast ...................................................................................................................65
Pearl Perch (Glaucosoma scapulare) East Coast ............................................................................................67
Prawn–Banana (Fenneropenaeus merguiensis) East Coast...........................................................................69
Prawn–Coral (Metapenaeopsis spp.) East Coast .............................................................................................71
Prawn–Eastern King (Melicertus plebejus) East Coast ...................................................................................72
Prawn–Endeavour (Metapenaeus endeavouri and M. ensis) East Coast ......................................................74
Prawn–Greasyback (Metapenaeus bennettae) East Coast .............................................................................76
Prawn–Northern King (Melicertus longistylus and M.latisulcatus) East Coast ............................................78
Prawn–School (Metapenaeus macleayi) East Coast........................................................................................80
Prawn–Tiger (Penaeus esculentus and P. semisulcatus) East Coast ...........................................................82
Rockcod–Bar (Epinephelus ergastularius and E. septemfasciatus) East Coast..........................................84
Scallop–Mud (Amusium pleuronectes) East Coast .........................................................................................85
Scallop–Saucer (Amusium balloti) East Coast.................................................................................................86
Sea Cucumber–White Teatfish (Holothuria fuscogilva) East Coast...............................................................88
Sea Cucumber–Burrowing Blackfish (Actinopyga spinea) East Coast .........................................................89
Sea Mullet (Mugil cephalus) East Coast............................................................................................................90
Shark (Elasmobranchii) East Coast and Gulf of Carpentaria..........................................................................92
Snapper (Pagrus auratus) East Coast ...............................................................................................................93
Snapper–Crimson (Lutjanus erythropterus) East Coast .................................................................................95
Snapper–Crimson (Lutjanus erythropterus) Gulf of Carpentaria...................................................................96
Snapper–Goldband (Pristipomoides multidens) East Coast ..........................................................................97
Snapper–Hussar (Lutjanus adetii and L. vitta) East Coast .............................................................................98
Snapper–Rosy (Pristipomoides filamentosus) East Coast.............................................................................99
Snapper–Saddletail (Lutjanus malabaricus) East Coast ...............................................................................100
Snapper–Saddletail (Lutjanus malabaricus) Gulf of Carpentaria.................................................................101
Snapper–Stripey (Lutjanus carponotatus) East Coast ..................................................................................102
Squid–Pencil (Uroteuthis spp.) East Coast.....................................................................................................103
Tailor (Pomatomus saltatrix) East Coast ........................................................................................................104
Teraglin (Atractoscion aequidens) East Coast...............................................................................................106
Threadfin–Blue (Eleutheronema tetradactylum) East Coast ........................................................................107
Threadfin–Blue (Eleutheronema tetradactylum) Gulf of Carpentaria ..........................................................108
Threadfin–King (Polydactylus macrochir) East Coast ..................................................................................109
Threadfin–King (Polydactylus macrochir) Gulf of Carpentaria ....................................................................111
Trevally (Carangidae) East Coast ....................................................................................................................112
Trochus (Trochus niloticus) East Coast .........................................................................................................113
Tropical Rocklobster (Panulirus ornatus) East Coast ...................................................................................114
Tuskfish (Choerodon spp.) East Coast ...........................................................................................................115
Whiting–Sand (Sillago ciliata) East Coast.......................................................................................................116
Whiting–Stout (Sillago robusta) East Coast ...................................................................................................118
Stock status of Queensland’s fisheries resources 2012 4
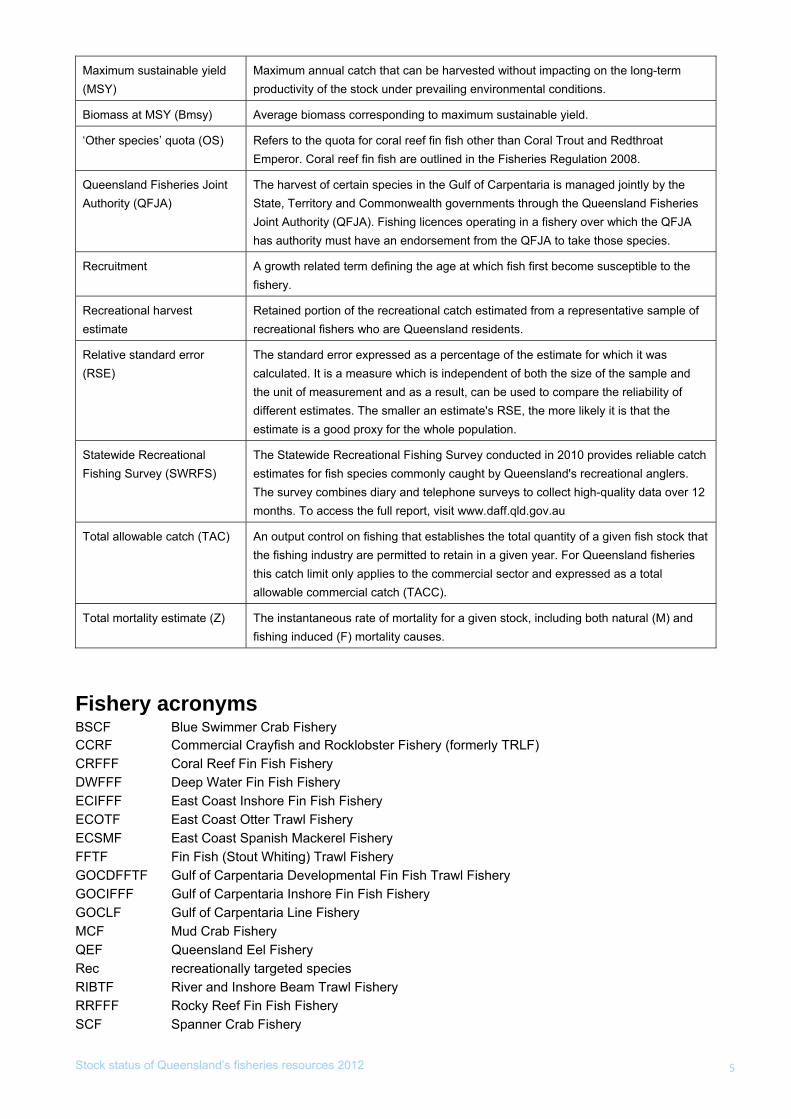
Glossary
Annual status report (ASR) /
Fishery update
Annual reports developed for each of Queensland’s major fisheries that provide catch statistics and Performance Measurement System reporting. Fishery Updates replaced Annual Status Reports in 2012.
Commercial catch The retained portion of a commercial fishers’ catch, which is recorded in a daily logbook for that fishery. Sometimes referred to as the harvested or landed component.
Catch rate and standardised catch rate
The number or weight of fish caught by a unit of fishing effort. Often used as a measure of fish abundance. Sometimes referred to as catch per unit effort (CPUE). Catch rates may be ‘standardised’ to allow for known variable factors such as location and season, or ‘nominal’ where no adjustments are made.
Charter catch The retained portion of a charter boat’s catch, which is recorded in a daily Queensland Commercial Fishing Tours logbook. Charter fishing is recreational fishing conducted from an appropriately licensed charter vessel.
East Coast The east coast of Queensland, from the Queensland/New South Wales border to the tip of Cape York in the north.
Ecological risk assessment (ERA)
A tool commonly used in fisheries management that identifies the issues or source of the risk which could impact on objectives (e.g. in a fisheries content, overfishing), assesses the consequence and likelihood associated with the issue, and then determines the relative risk (in a fisheries context, this could be risk to target and bycatch species, as well as the habitat). Can be qualitative or quantitative, and generally involves multiple stakeholders in a workshop. This process enables management agencies to identify priorities for monitoring and management action.
Fishery-dependent data Data (e.g. biological information on length and age) collected from commercial fishers or processors and recreational fishing activities.
Fishery-independent data Data collected by systematic survey, carried out by research vessels or contracted commercial fishing vessels, to gather information independently of normal fishing operations.
Gulf of Carpentaria The region from the western tip of Cape York to the Northern Territory border.
In-possession limit The maximum number of fish that a person is allowed to have in their possession at any time. It discourages the accumulation of large quantities of fish by recreational fishers.
Performance measurement system (PMS)
An assessment tool developed for each fishery to monitor and measure fishery performance against a range of operational objectives. It defines the objectives, indicators and performance measures for that fishery.
Performance measure A parameter used to assess the performance of a fishery against predetermined objectives.
Fishery symbol A fishery symbol indicates where a commercial fisher is able to fish, the regulated apparatus and what they are able to retain. Refer to the Fisheries Queensland website for the full description of fisheries symbols in Queensland www.daff.qld.gov.au
Minimum legal size (MLS) The minimum size that can be retained for a given species as defined in the Fisheries Regulations 2008. For some species, a maximum legal size also applies.
Maximum economic yield (MEY)
The sustainable catch level for a commercial fishery that allows net economic returns to be maximised.
Stock status of Queensland’s fisheries resources 2012 5
Maximum sustainable yield (MSY)
Maximum annual catch that can be harvested without impacting on the long-term productivity of the stock under prevailing environmental conditions.
Biomass at MSY (Bmsy) Average biomass corresponding to maximum sustainable yield.
‘Other species’ quota (OS) Refers to the quota for coral reef fin fish other than Coral Trout and Redthroat Emperor. Coral reef fin fish are outlined in the Fisheries Regulation 2008.
Queensland Fisheries Joint Authority (QFJA)
The harvest of certain species in the Gulf of Carpentaria is managed jointly by the State, Territory and Commonwealth governments through the Queensland Fisheries Joint Authority (QFJA). Fishing licences operating in a fishery over which the QFJA has authority must have an endorsement from the QFJA to take those species.
Recruitment A growth related term defining the age at which fish first become susceptible to the fishery.
Recreational harvest estimate
Retained portion of the recreational catch estimated from a representative sample of recreational fishers who are Queensland residents.
Relative standard error (RSE)
The standard error expressed as a percentage of the estimate for which it was calculated. It is a measure which is independent of both the size of the sample and the unit of measurement and as a result, can be used to compare the reliability of different estimates. The smaller an estimate's RSE, the more likely it is that the estimate is a good proxy for the whole population.
Statewide Recreational Fishing Survey (SWRFS)
The Statewide Recreational Fishing Survey conducted in 2010 provides reliable catch estimates for fish species commonly caught by Queensland's recreational anglers. The survey combines diary and telephone surveys to collect high-quality data over 12 months. To access the full report, visit www.daff.qld.gov.au
Total allowable catch (TAC) An output control on fishing that establishes the total quantity of a given fish stock that the fishing industry are permitted to retain in a given year. For Queensland fisheries this catch limit only applies to the commercial sector and expressed as a total allowable commercial catch (TACC).
Total mortality estimate (Z) The instantaneous rate of mortality for a given stock, including both natural (M) and fishing induced (F) mortality causes.
Fishery acronyms BSCF Blue Swimmer Crab Fishery CCRF Commercial Crayfish and Rocklobster Fishery (formerly TRLF) CRFFF Coral Reef Fin Fish Fishery DWFFF Deep Water Fin Fish Fishery ECIFFF East Coast Inshore Fin Fish Fishery ECOTF East Coast Otter Trawl Fishery ECSMF East Coast Spanish Mackerel Fishery FFTF Fin Fish (Stout Whiting) Trawl Fishery GOCDFFTF Gulf of Carpentaria Developmental Fin Fish Trawl Fishery GOCIFFF Gulf of Carpentaria Inshore Fin Fish Fishery GOCLF Gulf of Carpentaria Line Fishery MCF Mud Crab Fishery QEF Queensland Eel Fishery Rec recreationally targeted species RIBTF River and Inshore Beam Trawl Fishery RRFFF Rocky Reef Fin Fish Fishery SCF Spanner Crab Fishery
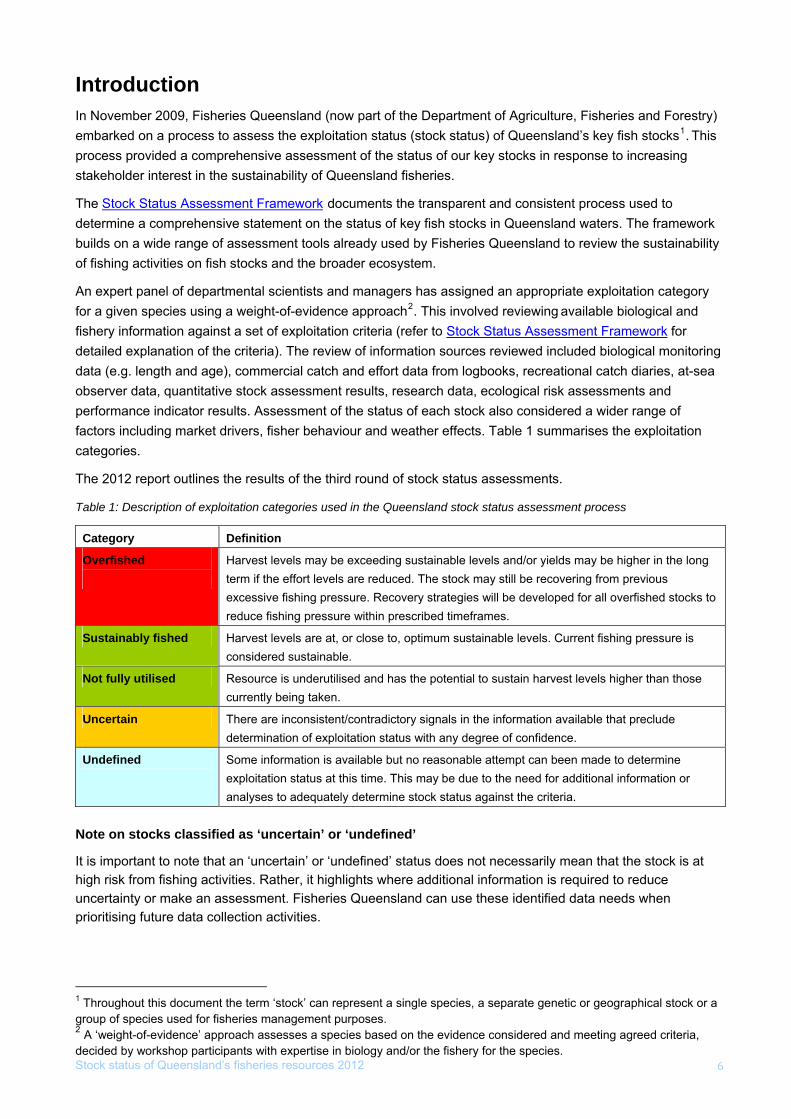
Introduction In November 2009, Fisheries Queensland (now part of the Department of Agriculture, Fisheries and Forestry) embarked on a process to assess the exploitation status (stock status) of Queensland’s key fish stocks1. This process provided a comprehensive assessment of the status of our key stocks in response to increasing stakeholder interest in the sustainability of Queensland fisheries.
The Stock Status Assessment Framework documents the transparent and consistent process used to determine a comprehensive statement on the status of key fish stocks in Queensland waters. The framework builds on a wide range of assessment tools already used by Fisheries Queensland to review the sustainability of fishing activities on fish stocks and the broader ecosystem.
An expert panel of departmental scientists and managers has assigned an appropriate exploitation category for a given species using a weight-of-evidence approach2. This involved reviewing available biological and fishery information against a set of exploitation criteria (refer to Stock Status Assessment Framework for detailed explanation of the criteria). The review of information sources reviewed included biological monitoring data (e.g. length and age), commercial catch and effort data from logbooks, recreational catch diaries, at-sea observer data, quantitative stock assessment results, research data, ecological risk assessments and performance indicator results. Assessment of the status of each stock also considered a wider range of factors including market drivers, fisher behaviour and weather effects. Table 1 summarises the exploitation categories.
The 2012 report outlines the results of the third round of stock status assessments.
Table 1: Description of exploitation categories used in the Queensland stock status assessment process
Category Definition
Overfished
Harvest levels may be exceeding sustainable levels and/or yields may be higher in the long term if the effort levels are reduced. The stock may still be recovering from previous excessive fishing pressure. Recovery strategies will be developed for all overfished stocks to reduce fishing pressure within prescribed timeframes.
Sustainably fished Harvest levels are at, or close to, optimum sustainable levels. Current fishing pressure is considered sustainable.
Not fully utilised Resource is underutilised and has the potential to sustain harvest levels higher than those currently being taken.
Uncertain There are inconsistent/contradictory signals in the information available that preclude determination of exploitation status with any degree of confidence.
Undefined Some information is available but no reasonable attempt can been made to determine exploitation status at this time. This may be due to the need for additional information or analyses to adequately determine stock status against the criteria.
Note on stocks classified as ‘uncertain’ or ‘undefined’
It is important to note that an ‘uncertain’ or ‘undefined’ status does not necessarily mean that the stock is at high risk from fishing activities. Rather, it highlights where additional information is required to reduce uncertainty or make an assessment. Fisheries Queensland can use these identified data needs when prioritising future data collection activities.
1 Throughout this document the term ‘stock’ can represent a single species, a separate genetic or geographical stock or a group of species used for fisheries management purposes.
Stock status of Queensland’s fisheries resources 2012 6
2 A ‘weight-of-evidence’ approach assesses a species based on the evidence considered and meeting agreed criteria, decided by workshop participants with expertise in biology and/or the fishery for the species.
Stock status of Queensland’s fisheries resources 2012 7
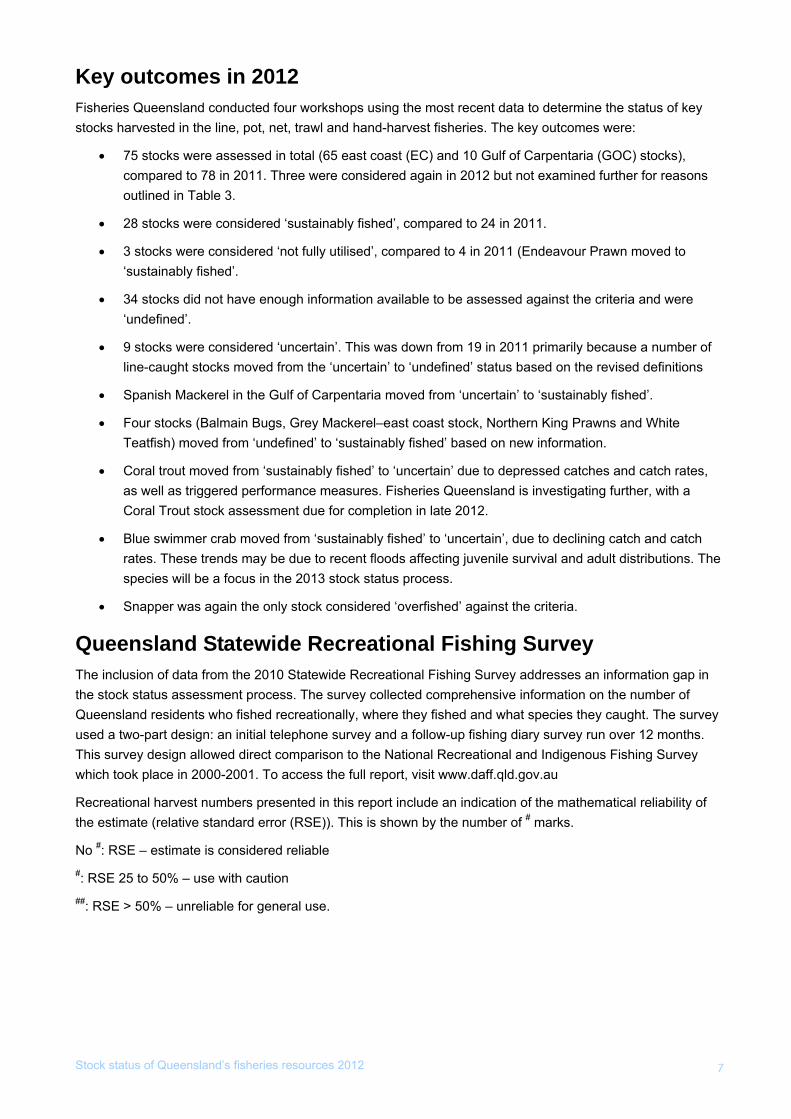
Key outcomes in 2012 Fisheries Queensland conducted four workshops using the most recent data to determine the status of key stocks harvested in the line, pot, net, trawl and hand-harvest fisheries. The key outcomes were:
• 75 stocks were assessed in total (65 east coast (EC) and 10 Gulf of Carpentaria (GOC) stocks), compared to 78 in 2011. Three were considered again in 2012 but not examined further for reasons outlined in Table 3.
• 28 stocks were considered ‘sustainably fished’, compared to 24 in 2011.
• 3 stocks were considered ‘not fully utilised’, compared to 4 in 2011 (Endeavour Prawn moved to ‘sustainably fished’.
• 34 stocks did not have enough information available to be assessed against the criteria and were ‘undefined’.
• 9 stocks were considered ‘uncertain’. This was down from 19 in 2011 primarily because a number of line-caught stocks moved from the ‘uncertain’ to ‘undefined’ status based on the revised definitions
• Spanish Mackerel in the Gulf of Carpentaria moved from ‘uncertain’ to ‘sustainably fished’.
• Four stocks (Balmain Bugs, Grey Mackerel–east coast stock, Northern King Prawns and White Teatfish) moved from ‘undefined’ to ‘sustainably fished’ based on new information.
• Coral trout moved from ‘sustainably fished’ to ‘uncertain’ due to depressed catches and catch rates, as well as triggered performance measures. Fisheries Queensland is investigating further, with a Coral Trout stock assessment due for completion in late 2012.
• Blue swimmer crab moved from ‘sustainably fished’ to ‘uncertain’, due to declining catch and catch rates. These trends may be due to recent floods affecting juvenile survival and adult distributions. The species will be a focus in the 2013 stock status process.
• Snapper was again the only stock considered ‘overfished’ against the criteria.
Queensland Statewide Recreational Fishing Survey The inclusion of data from the 2010 Statewide Recreational Fishing Survey addresses an information gap in the stock status assessment process. The survey collected comprehensive information on the number of Queensland residents who fished recreationally, where they fished and what species they caught. The survey used a two-part design: an initial telephone survey and a follow-up fishing diary survey run over 12 months. This survey design allowed direct comparison to the National Recreational and Indigenous Fishing Survey which took place in 2000-2001. To access the full report, visit www.daff.qld.gov.au
Recreational harvest numbers presented in this report include an indication of the mathematical reliability of the estimate (relative standard error (RSE)). This is shown by the number of # marks.
No #: RSE – estimate is considered reliable #: RSE 25 to 50% – use with caution ##: RSE > 50% – unreliable for general use.
Stock status of Queensland’s fisheries resources 2012 8
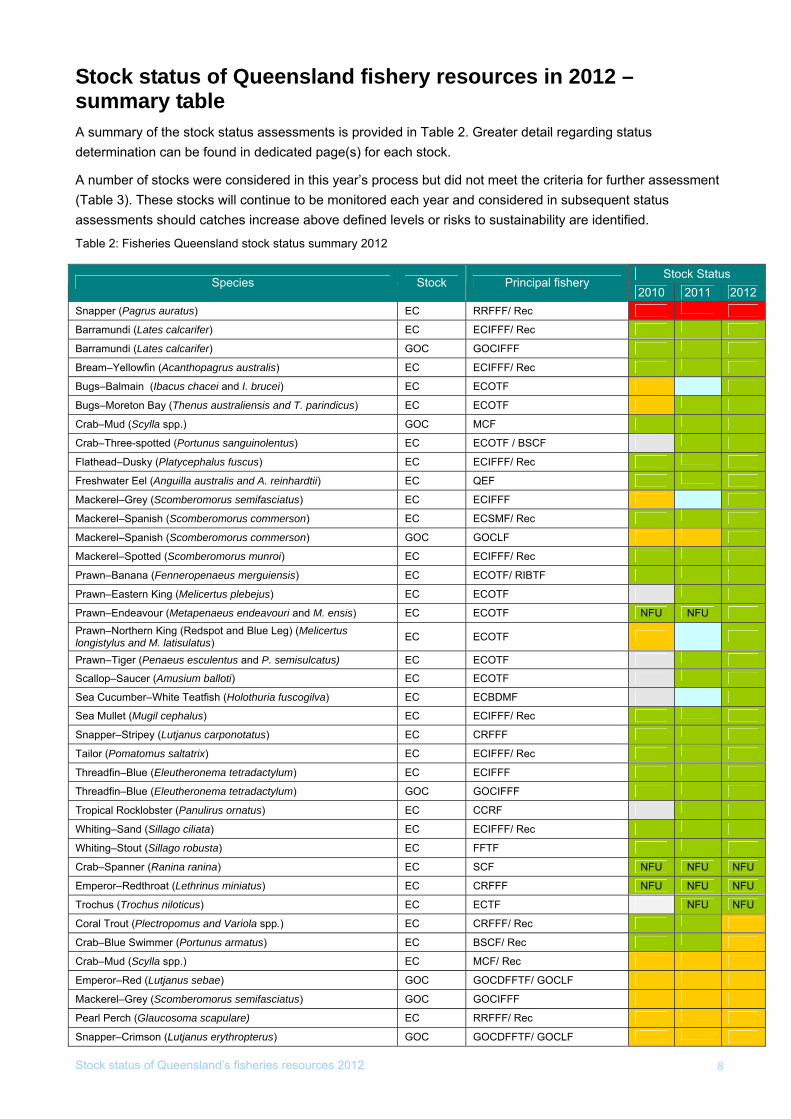
Stock status of Queensland fishery resources in 2012 – summary table A summary of the stock status assessments is provided in Table 2. Greater detail regarding status determination can be found in dedicated page(s) for each stock.
A number of stocks were considered in this year’s process but did not meet the criteria for further assessment (Table 3). These stocks will continue to be monitored each year and considered in subsequent status assessments should catches increase above defined levels or risks to sustainability are identified.
Table 2: Fisheries Queensland stock status summary 2012
Stock Status Species Stock Principal fishery
2010 2011 2012 Snapper (Pagrus auratus) EC RRFFF/ Rec
Barramundi (Lates calcarifer) EC ECIFFF/ Rec
Barramundi (Lates calcarifer) GOC GOCIFFF
Bream–Yellowfin (Acanthopagrus australis) EC ECIFFF/ Rec
Bugs–Balmain (Ibacus chacei and I. brucei) EC ECOTF
Bugs–Moreton Bay (Thenus australiensis and T. parindicus) EC ECOTF
Crab–Mud (Scylla spp.) GOC MCF
Crab–Three-spotted (Portunus sanguinolentus) EC ECOTF / BSCF
Flathead–Dusky (Platycephalus fuscus) EC ECIFFF/ Rec
Freshwater Eel (Anguilla australis and A. reinhardtii) EC QEF
Mackerel–Grey (Scomberomorus semifasciatus) EC ECIFFF
Mackerel–Spanish (Scomberomorus commerson) EC ECSMF/ Rec
Mackerel–Spanish (Scomberomorus commerson) GOC GOCLF
Mackerel–Spotted (Scomberomorus munroi) EC ECIFFF/ Rec
Prawn–Banana (Fenneropenaeus merguiensis) EC ECOTF/ RIBTF
Prawn–Eastern King (Melicertus plebejus) EC ECOTF
Prawn–Endeavour (Metapenaeus endeavouri and M. ensis) EC ECOTF NFU NFU Prawn–Northern King (Redspot and Blue Leg) (Melicertus longistylus and M. latisulatus) EC ECOTF
Prawn–Tiger (Penaeus esculentus and P. semisulcatus) EC ECOTF
Scallop–Saucer (Amusium balloti) EC ECOTF
Sea Cucumber–White Teatfish (Holothuria fuscogilva) EC ECBDMF
Sea Mullet (Mugil cephalus) EC ECIFFF/ Rec
Snapper–Stripey (Lutjanus carponotatus) EC CRFFF
Tailor (Pomatomus saltatrix) EC ECIFFF/ Rec
Threadfin–Blue (Eleutheronema tetradactylum) EC ECIFFF
Threadfin–Blue (Eleutheronema tetradactylum) GOC GOCIFFF
Tropical Rocklobster (Panulirus ornatus) EC CCRF
Whiting–Sand (Sillago ciliata) EC ECIFFF/ Rec
Whiting–Stout (Sillago robusta) EC FFTF
Crab–Spanner (Ranina ranina) EC SCF NFU NFU NFU
Emperor–Redthroat (Lethrinus miniatus) EC CRFFF NFU NFU NFU
Trochus (Trochus niloticus) EC ECTF NFU NFU
Coral Trout (Plectropomus and Variola spp.) EC CRFFF/ Rec
Crab–Blue Swimmer (Portunus armatus) EC BSCF/ Rec
Crab–Mud (Scylla spp.) EC MCF/ Rec
Emperor–Red (Lutjanus sebae) GOC GOCDFFTF/ GOCLF
Mackerel–Grey (Scomberomorus semifasciatus) GOC GOCIFFF
Pearl Perch (Glaucosoma scapulare) EC RRFFF/ Rec
Snapper–Crimson (Lutjanus erythropterus) GOC GOCDFFTF/ GOCLF
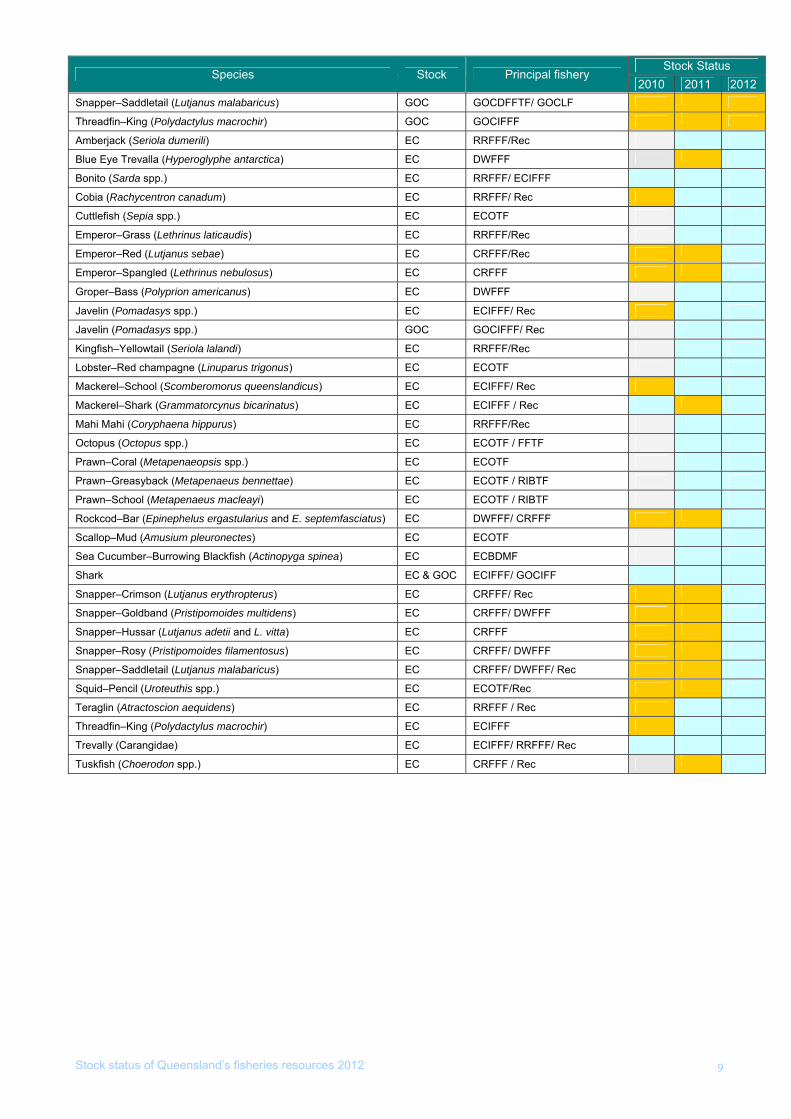
Stock status of Queensland’s fisheries resources 2012 9
Stock Status Species Stock Principal fishery
2010 2011 2012 Snapper–Saddletail (Lutjanus malabaricus) GOC GOCDFFTF/ GOCLF
Threadfin–King (Polydactylus macrochir) GOC GOCIFFF
Amberjack (Seriola dumerili) EC RRFFF/Rec
Blue Eye Trevalla (Hyperoglyphe antarctica) EC DWFFF
Bonito (Sarda spp.) EC RRFFF/ ECIFFF
Cobia (Rachycentron canadum) EC RRFFF/ Rec
Cuttlefish (Sepia spp.) EC ECOTF
Emperor–Grass (Lethrinus laticaudis) EC RRFFF/Rec
Emperor–Red (Lutjanus sebae) EC CRFFF/Rec
Emperor–Spangled (Lethrinus nebulosus) EC CRFFF
Groper–Bass (Polyprion americanus) EC DWFFF
Javelin (Pomadasys spp.) EC ECIFFF/ Rec
Javelin (Pomadasys spp.) GOC GOCIFFF/ Rec
Kingfish–Yellowtail (Seriola lalandi) EC RRFFF/Rec
Lobster–Red champagne (Linuparus trigonus) EC ECOTF
Mackerel–School (Scomberomorus queenslandicus) EC ECIFFF/ Rec
Mackerel–Shark (Grammatorcynus bicarinatus) EC ECIFFF / Rec
Mahi Mahi (Coryphaena hippurus) EC RRFFF/Rec
Octopus (Octopus spp.) EC ECOTF / FFTF
Prawn–Coral (Metapenaeopsis spp.) EC ECOTF
Prawn–Greasyback (Metapenaeus bennettae) EC ECOTF / RIBTF
Prawn–School (Metapenaeus macleayi) EC ECOTF / RIBTF
Rockcod–Bar (Epinephelus ergastularius and E. septemfasciatus) EC DWFFF/ CRFFF
Scallop–Mud (Amusium pleuronectes) EC ECOTF
Sea Cucumber–Burrowing Blackfish (Actinopyga spinea) EC ECBDMF
Shark EC & GOC ECIFFF/ GOCIFF
Snapper–Crimson (Lutjanus erythropterus) EC CRFFF/ Rec
Snapper–Goldband (Pristipomoides multidens) EC CRFFF/ DWFFF
Snapper–Hussar (Lutjanus adetii and L. vitta) EC CRFFF
Snapper–Rosy (Pristipomoides filamentosus) EC CRFFF/ DWFFF
Snapper–Saddletail (Lutjanus malabaricus) EC CRFFF/ DWFFF/ Rec
Squid–Pencil (Uroteuthis spp.) EC ECOTF/Rec
Teraglin (Atractoscion aequidens) EC RRFFF / Rec
Threadfin–King (Polydactylus macrochir) EC ECIFFF
Trevally (Carangidae) EC ECIFFF/ RRFFF/ Rec
Tuskfish (Choerodon spp.) EC CRFFF / Rec
Stock status of Queensland’s fisheries resources 2012 10
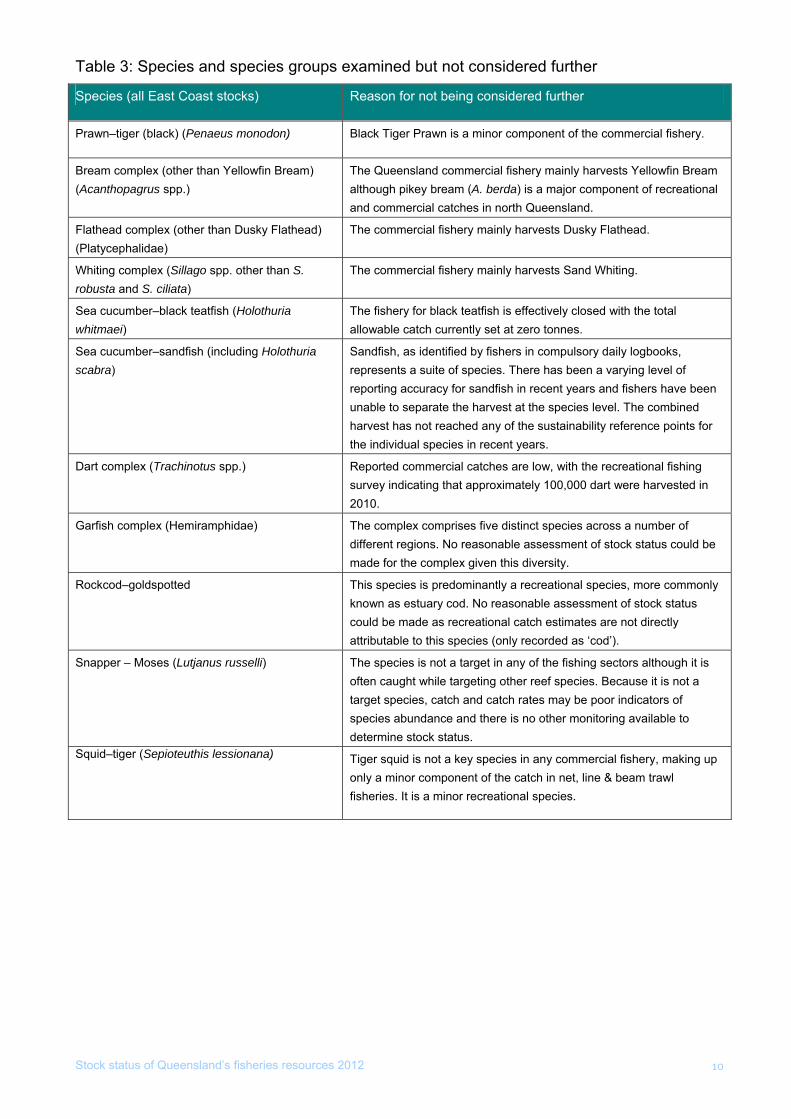
Table 3: Species and species groups examined but not considered further
Species (all East Coast stocks) Reason for not being considered further
Prawn–tiger (black) (Penaeus monodon) Black Tiger Prawn is a minor component of the commercial fishery.
Bream complex (other than Yellowfin Bream) (Acanthopagrus spp.)
The Queensland commercial fishery mainly harvests Yellowfin Bream although pikey bream (A. berda) is a major component of recreational and commercial catches in north Queensland.
Flathead complex (other than Dusky Flathead) (Platycephalidae)
The commercial fishery mainly harvests Dusky Flathead.
Whiting complex (Sillago spp. other than S. robusta and S. ciliata)
The commercial fishery mainly harvests Sand Whiting.
Sea cucumber–black teatfish (Holothuria whitmaei)
The fishery for black teatfish is effectively closed with the total allowable catch currently set at zero tonnes.
Sea cucumber–sandfish (including Holothuria scabra)
Sandfish, as identified by fishers in compulsory daily logbooks, represents a suite of species. There has been a varying level of reporting accuracy for sandfish in recent years and fishers have been unable to separate the harvest at the species level. The combined harvest has not reached any of the sustainability reference points for the individual species in recent years.
Dart complex (Trachinotus spp.) Reported commercial catches are low, with the recreational fishing survey indicating that approximately 100,000 dart were harvested in 2010.
Garfish complex (Hemiramphidae) The complex comprises five distinct species across a number of different regions. No reasonable assessment of stock status could be made for the complex given this diversity.
Rockcod–goldspotted This species is predominantly a recreational species, more commonly known as estuary cod. No reasonable assessment of stock status could be made as recreational catch estimates are not directly attributable to this species (only recorded as ‘cod’).
Snapper – Moses (Lutjanus russelli) The species is not a target in any of the fishing sectors although it is often caught while targeting other reef species. Because it is not a target species, catch and catch rates may be poor indicators of species abundance and there is no other monitoring available to determine stock status.
Squid–tiger (Sepioteuthis lessionana) Tiger squid is not a key species in any commercial fishery, making up only a minor component of the catch in net, line & beam trawl fisheries. It is a minor recreational species.
Stock status of Queensland’s fisheries resources 2012 11
Stock background and status determination summary pages The following stock status summary pages outline the following:
Stock status 2012 – determination in 2012 made using 2010-11 or 2011 data.
Stock status 2011 – determination in 2011 made using 2009-10 or 2010 data.
Principal fishery – the Queensland fishery in which the stock is primarily harvested.
Justification – outlines key reasons supporting the stock status determination.
Information sources – information/data considered by the workshop panel to determine status.
Comments – provides background information regarding the stock and greater detail supporting the key reasons for stock status determination.
Future assessment needs – outlines future information inputs that would support current or future stock status assessments. Fisheries Queensland will consider these information needs when prioritising future research and information collection programs.
Management response – for stocks that are considered overfished or where sustainability issues have been identified, a management response to address this will be provided.
Further reading – provides a list of background and associated research articles for the stock.
For more information about stocks, principle fisheries, updates and survey results visit www.daff.qld.gov.au
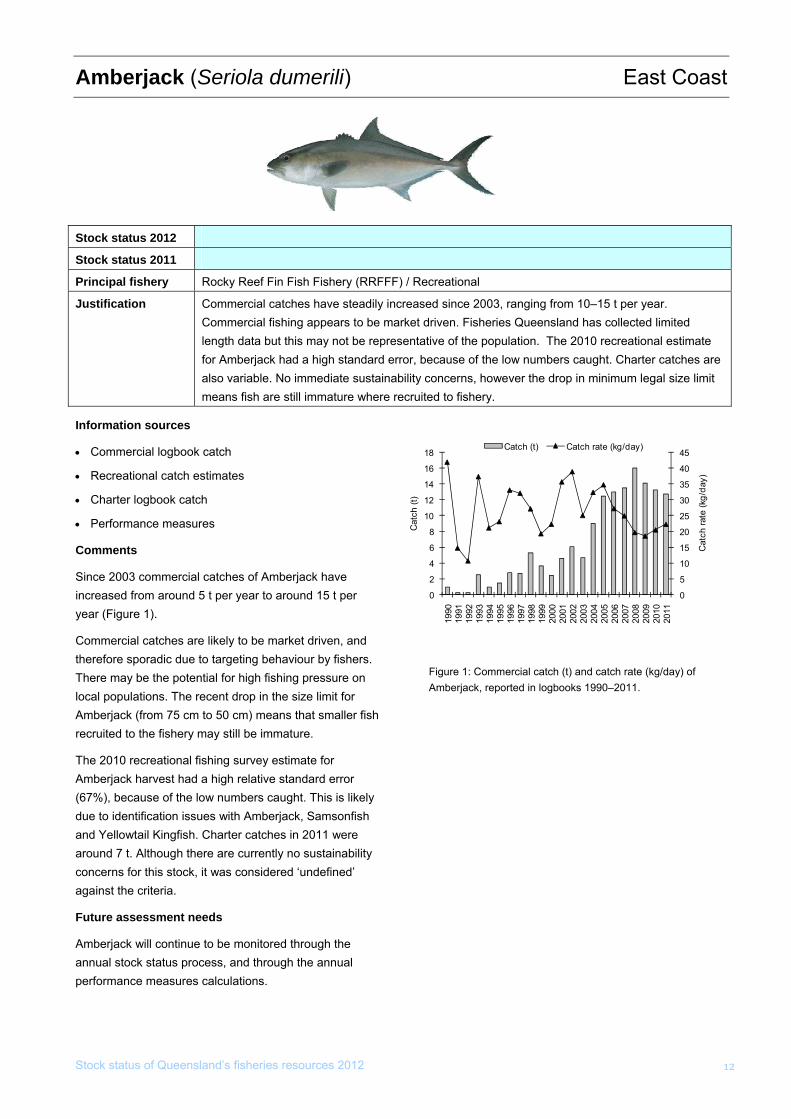
Amberjack (Seriola dumerili) East Coast
Stock status 2012 Undefined
Stock status 2011 Undefined
Principal fishery Rocky Reef Fin Fish Fishery (RRFFF) / Recreational
Justification Commercial catches have steadily increased since 2003, ranging from 10–15 t per year. Commercial fishing appears to be market driven. Fisheries Queensland has collected limited length data but this may not be representative of the population. The 2010 recreational estimate for Amberjack had a high standard error, because of the low numbers caught. Charter catches are also variable. No immediate sustainability concerns, however the drop in minimum legal size limit means fish are still immature where recruited to fishery.
Stock status of Queensland’s fisheries resources 2012 12
Information sources
• Commercial logbook catch
• Recreational catch estimates
• Charter logbook catch
• Performance measures
Comments
Since 2003 commercial catches of Amberjack have increased from around 5 t per year to around 15 t per year (Figure 1).
Commercial catches are likely to be market driven, and therefore sporadic due to targeting behaviour by fishers. There may be the potential for high fishing pressure on local populations. The recent drop in the size limit for Amberjack (from 75 cm to 50 cm) means that smaller fish recruited to the fishery may still be immature.
The 2010 recreational fishing survey estimate for Amberjack harvest had a high relative standard error (67%), because of the low numbers caught. This is likely due to identification issues with Amberjack, Samsonfish and Yellowtail Kingfish. Charter catches in 2011 were around 7 t. Although there are currently no sustainability concerns for this stock, it was considered ‘undefined’ against the criteria.
Future assessment needs
Amberjack will continue to be monitored through the annual stock status process, and through the annual performance measures calculations.
0
5
10
15
20
25
30
35
40
45
0
2
4
6
8
10
12
14
16
1819
9019
9119
9219
9319
9419
9519
9619
9719
9819
9920
0020
0120
0220
0320
0420
0520
0620
0720
0820
0920
1020
11
Cat
ch ra
te (k
g/da
y)
Cat
ch (t
)
Catch (t) Catch rate (kg/day)
Figure 1: Commercial catch (t) and catch rate (kg/day) of Amberjack, reported in logbooks 1990–2011.
Stock status of Queensland’s fisheries resources 2012
13
Barramundi (Lates calcarifer) East Coast
Stock status 2012 Sustainably fished
Stock status 2011 Sustainably fished
Principal fishery East Coast Inshore Fin Fish Fishery (ECIFFF) / Recreational
Justification Commercial catches reached record levels in 2011 and catch related performance measures triggered in 2011. This was a direct consequence of the spill over of Barramundi stocked in Awoonga Dam near Gladstone. An estimated 30 000 large stocked Barramundi entered the estuarine system over late 2010 and early 2011. Commercial catches in the central region increased proportional to this influx. All other regional harvest levels were within historical limits. Fishery-dependent biological monitoring indicated that fish lengths have not significantly changed for several years in both sampled regions. Strong recruitment was evident in the northern genetic stock. Estimates of fishing mortality were less than natural mortality and current fishing pressure is unlikely to lead to overfishing.
Information sources
• Commercial logbook catch and effort
• Recreational harvest estimates
• Charter logbook catch and effort
• Performance measures
• Fishery-dependent length and age information (2007–11) from two of the four genetic stocks
• Published local biological information
Comments
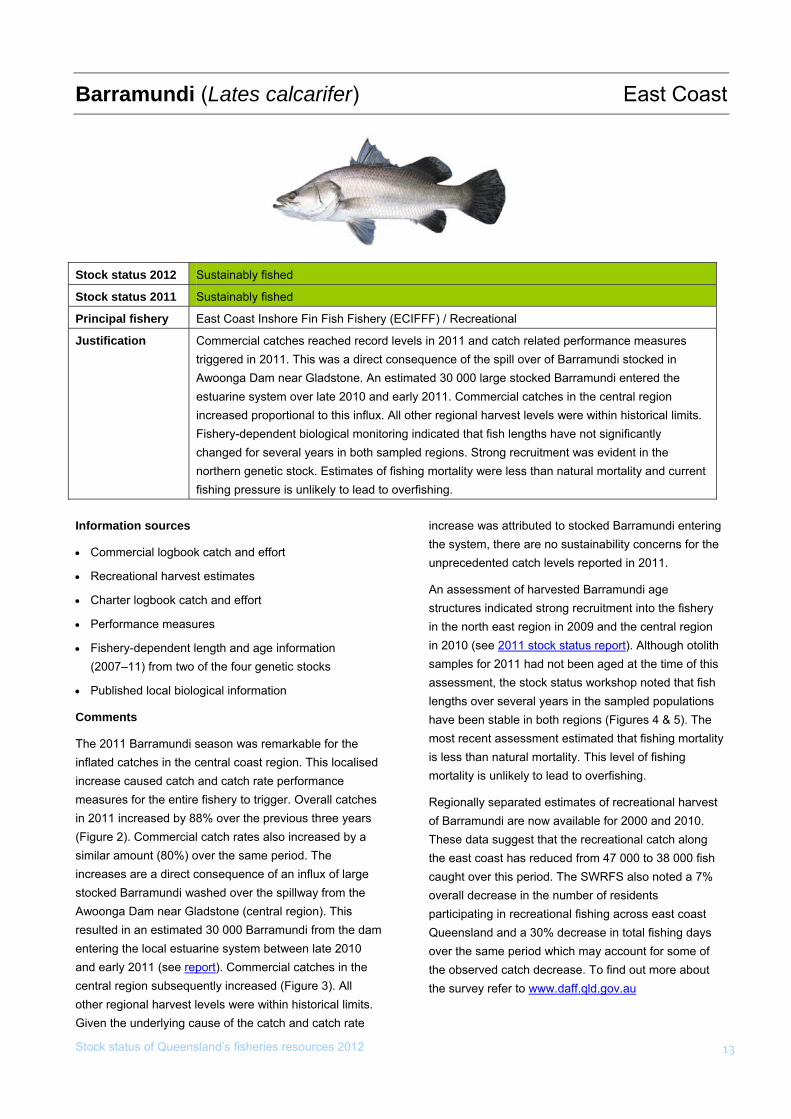
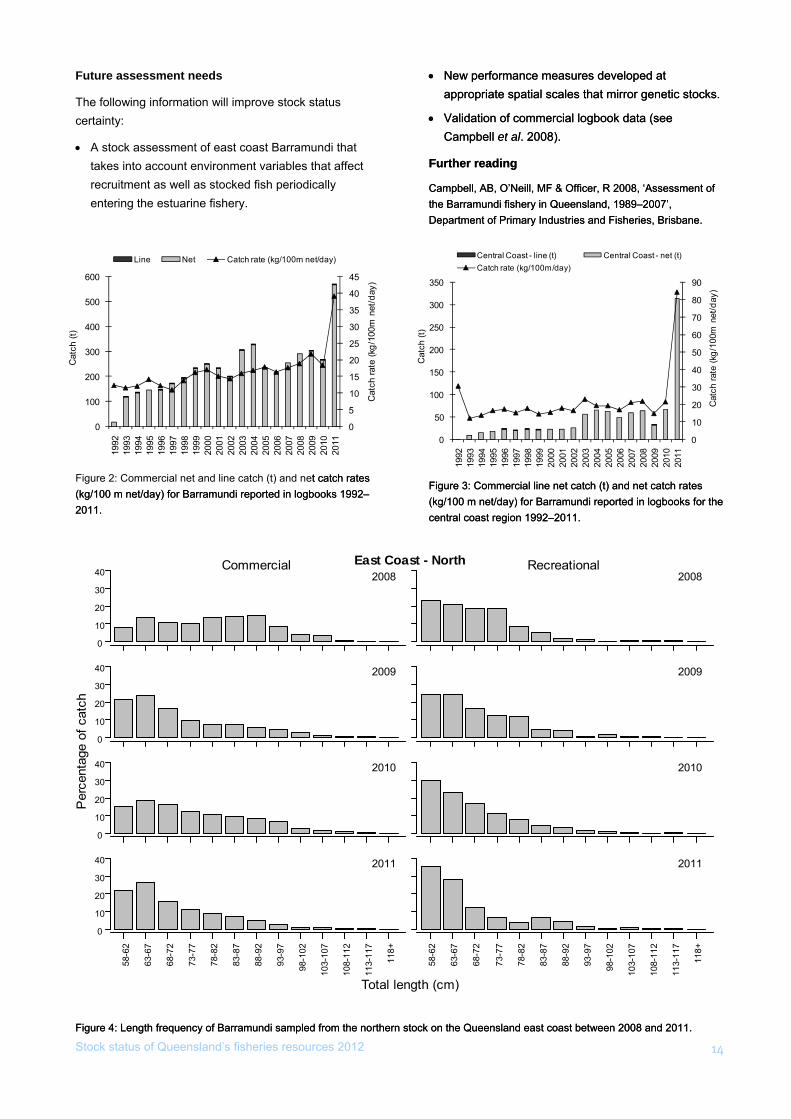
The 2011 Barramundi season was remarkable for the inflated catches in the central coast region. This localised increase caused catch and catch rate performance measures for the entire fishery to trigger. Overall catches in 2011 increased by 88% over the previous three years (Figure 2). Commercial catch rates also increased by a similar amount (80%) over the same period. The increases are a direct consequence of an influx of large stocked Barramundi washed over the spillway from the Awoonga Dam near Gladstone (central region). This resulted in an estimated 30 000 Barramundi from the dam entering the local estuarine system between late 2010 and early 2011 (see report). Commercial catches in the central region subsequently increased (Figure 3). All other regional harvest levels were within historical limits. Given the underlying cause of the catch and catch rate
increase was attributed to stocked Barramundi entering the system, there are no sustainability concerns for the unprecedented catch levels reported in 2011.
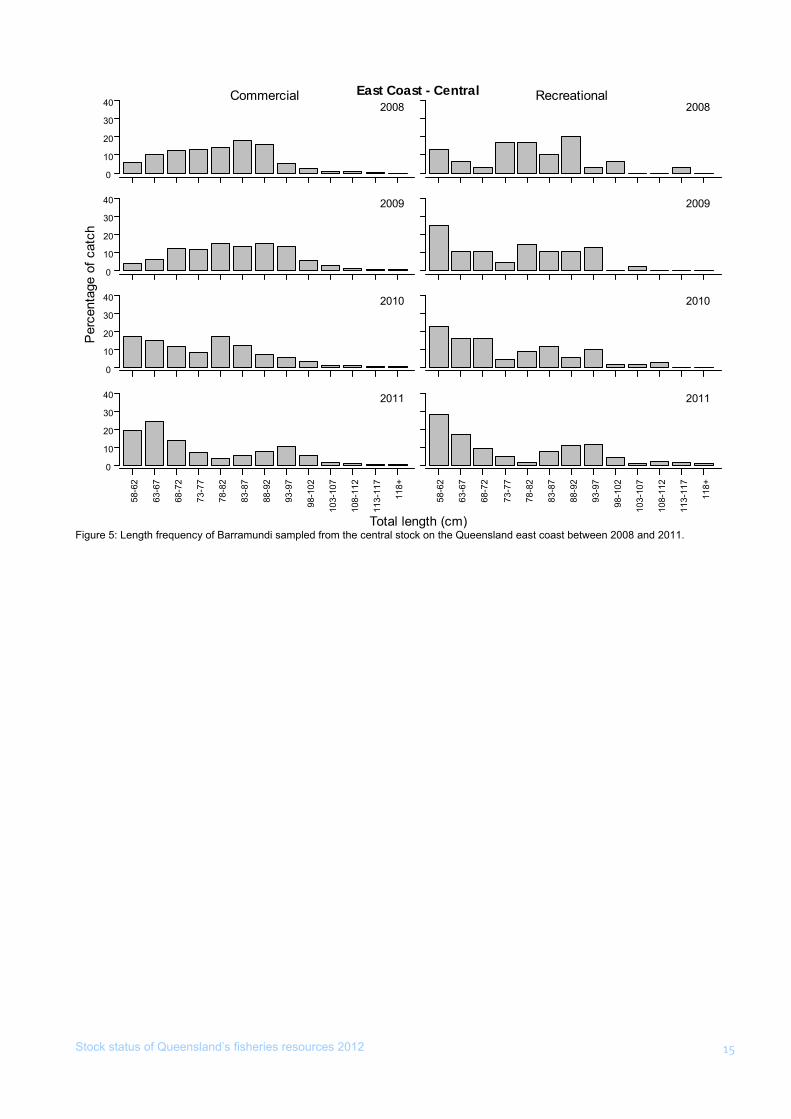
An assessment of harvested Barramundi age structures indicated strong recruitment into the fishery in the north east region in 2009 and the central region in 2010 (see 2011 stock status report). Although otolith samples for 2011 had not been aged at the time of this assessment, the stock status workshop noted that fish lengths over several years in the sampled populations have been stable in both regions (Figures 4 & 5). The most recent assessment estimated that fishing mortality is less than natural mortality. This level of fishing mortality is unlikely to lead to overfishing.
Regionally separated estimates of recreational harvest of Barramundi are now available for 2000 and 2010. These data suggest that the recreational catch along the east coast has reduced from 47 000 to 38 000 fish caught over this period. The SWRFS also noted a 7% overall decrease in the number of residents participating in recreational fishing across east coast Queensland and a 30% decrease in total fishing days over the same period which may account for some of the observed catch decrease. To find out more about the survey refer to www.daff.qld.gov.au
Stock status of Queensland’s fisheries resources 2012
14
Future assessment needs
The following information will improve stock status certainty:
• A stock assessment of east coast Barramundi that takes into account environment variables that affect recruitment as well as stocked fish periodically entering the estuarine fishery.
• New performance measures developed at appropriate spatial scales that mirror genetic stocks.
• New performance measures developed at appropriate spatial scales that mirror genetic stocks.
• Validation of commercial logbook data (see Campbell et al. 2008).
• Validation of commercial logbook data (see Campbell et al. 2008).
Further reading Further reading
Campbell, AB, O’Neill, MF & Officer, R 2008, ‘Assessment of the Barramundi fishery in Queensland, 1989–2007’, Department of Primary Industries and Fisheries, Brisbane.
Campbell, AB, O’Neill, MF & Officer, R 2008, ‘Assessment of the Barramundi fishery in Queensland, 1989–2007’, Department of Primary Industries and Fisheries, Brisbane.
0
5
10
15
20
25
30
35
40
45
0
100
200
300
400
500
600
1992
1993
1994
1995
1996
1997
1998
1999
2000
2001
2002
2003
2004
2005
2006
2007
2008
2009
2010
2011
Cat
ch ra
te (k
g/10
0m n
et/d
ay)
Cat
ch (t
)
Line Net Catch rate (kg/100m net/day)
Figure 2: Commercial net and line catch (t) and net catch rates (kg/100 m net/day) for Barramundi reported in logbooks 1992–2011.
t catch rates (kg/100 m net/day) for Barramundi reported in logbooks 1992–2011.
0
10
20
30
40
50
60
70
80
90
0
50
100
150
200
250
300
350
1992
1993
1994
1995
1996
1997
1998
1999
2000
2001
2002
2003
2004
2005
2006
2007
2008
2009
2010
2011
Cat
ch ra
te (k
g/10
0m n
et/d
ay)
Cat
ch (t
)
Central Coast - line (t) Central Coast - net (t)Catch rate (kg/100m/day)
Figure 3: Commercial line net catch (t) and net catch rates (kg/100 m net/day) for Barramundi reported in logbooks for the central coast region 1992–2011.
Figure 3: Commercial line net catch (t) and net catch rates (kg/100 m net/day) for Barramundi reported in logbooks for the central coast region 1992–2011.
0
10
20
30
40 2008Commercial
2008Recreational
0
10
20
30
40 2009 2009
0
10
20
30
40 2010 2010
58-6
2
63-6
7
68-7
2
73-7
7
78-8
2
83-8
7
88-9
2
93-9
7
98-1
02
103-
107
108-
112
113-
117
118+
0
10
20
30
40 2011
58-6
2
63-6
7
68-7
2
73-7
7
78-8
2
83-8
7
88-9
2
93-9
7
98-1
02
103-
107
108-
112
113-
117
118+
2011
Total length (cm)
Per
cent
age
of c
atch
East Coast - North
Figure 4: Length frequency of Barramundi sampled from the northern stock on the Queensland east coast between 2008 and 2011. Figure 4: Length frequency of Barramundi sampled from the northern stock on the Queensland east coast between 2008 and 2011.
Stock status of Queensland’s fisheries resources 2012
15
0
10
20
30
40 2008Commercial
2008Recreational
0
10
20
30
40 2009 2009
0
10
20
30
40 2010 2010
58-6
2
63-6
7
68-7
2
73-7
7
78-8
2
83-8
7
88-9
2
93-9
7
98-1
02
103-
107
108-
112
113-
117
118+
0
10
20
30
40 2011
58-6
2
63-6
7
68-7
2
73-7
7
78-8
2
83-8
7
88-9
2
93-9
7
98-1
02
103-
107
108-
112
113-
117
118+
2011
Total length (cm)
Per
cent
age
of c
atch
East Coast - Central
Figure 5: Length frequency of Barramundi sampled from the central stock on the Queensland east coast between 2008 and 2011.
Stock status of Queensland’s fisheries resources 2012 16
Barramundi (Lates calcarifer) Gulf of Carpentaria
Stock status 2012 Sustainably fished
Stock status 2011 Sustainably fished
Principal fishery Gulf of Carpentaria Inshore Fin Fish Fishery (GOCIFFF)
Justification
Commercial catches increased to historically high levels in 2011. Catch and catch rate performance measures were not triggered. The range of fish lengths and ages has not changed significantly in several years of sampled populations indicating a stable population biomass. The most recent estimates of fishing mortality suggest that there are no sustainability concerns for Barramundi stocks in the Queensland section of the Gulf of Carpentaria.
Information sources
• Commercial logbook catch and effort data
• Recreational catch estimates
• Charter logbook catch and effort data
• Fishery-dependent length, age and mortality information (2007–11) from one of the two genetic stocks
• Performance measures
Comments
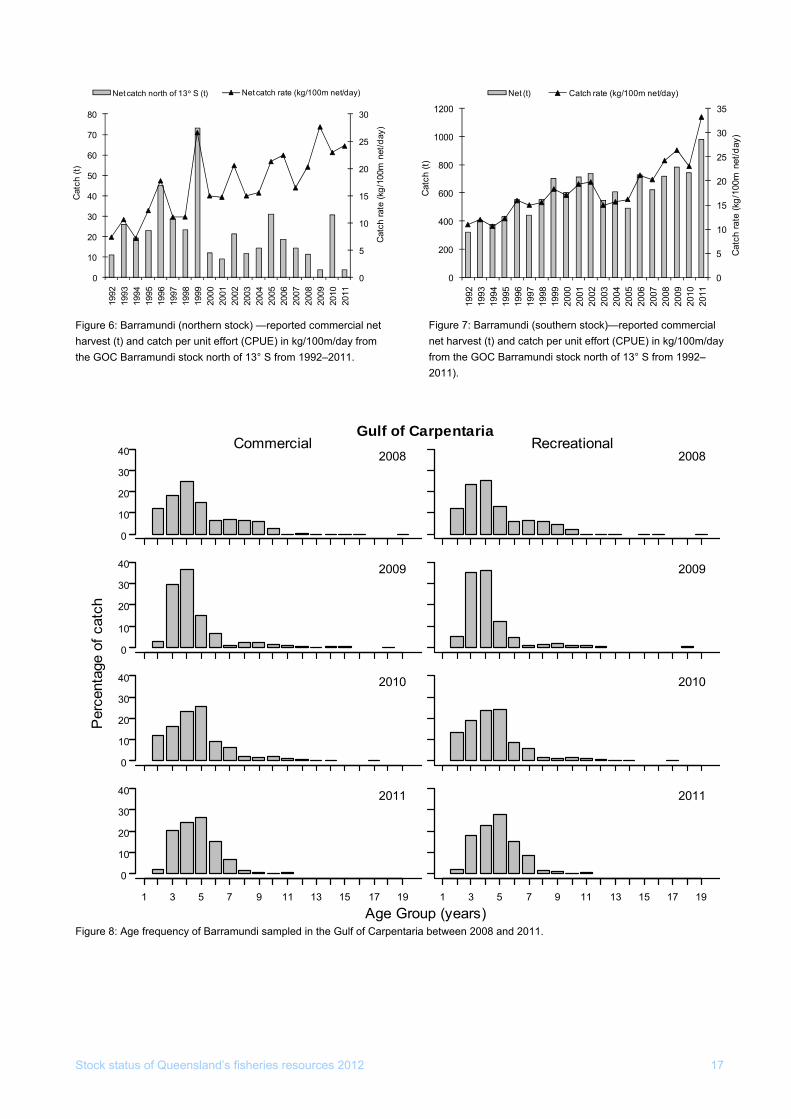
Assessment of recent information sources suggests that Barramundi stocks in the Gulf of Carpentaria are sustainably fished. Commercial harvest of Barramundi in the GOCIFFF increased in 2011 to the highest level observed (979 t) in 20 years. Catch rates (CPUE) also increased although performance measures did not trigger (26% over three years). The above evidence suggests that the overall biomass of the Barramundi stocks is being fished sustainably.
There are two main genetic stocks in the Gulf of Carpentaria fishery with the north-south separation point at about Weipa (approx. 13° S). Regional separation of catch and catch rates indicates that nearly all of the Barramundi harvest (99%) was taken from the southern stock in 2011 (Figures 6 & 7).
Good recruitment was evident in southern stock but less so in northern stock (Figure 8). There has been no significant change in the range of fish lengths and ages in several years of sampled populations. The most recent assessment estimates that fishing mortality is less than
natural mortality. This level of fishing mortality is un
Regionally separated estimates of recreational harvest of Barramundi are now available for 2000 and 2010. These data estimate that the recreational catch in the Gulf of Carpentaria has reduced from 38 000# to 22 000# over this period.
Future assessment needs
The following information will improve stock status certainty:
• New performance measures developed at appropriate spatial scales
• Validation of commercial logbook data (see Campbell et al. 2008)
• A stock assessment of GOC Barramundi
• Annual estimates of fingerlings stocked within impoundments/open systems and quantifying this into commercial and recreational catches.
Further reading
Campbell, AB, O’Neill, MF & Officer, R 2008, ‘Assessment of the Barramundi fishery in Queensland, 1989–2007’, Department of Primary Industries and Fisheries, Brisbane.
Roelofs, AJ 2003, ‘Ecological Assessment of the Gulf of Carpentaria Inshore Finfish Fishery–A report to Environment Australia on the sustainable management of a multi-species tropical gillnet fishery’, Department of Primary Industries and Fisheries, Brisbane.
likely to lead to overfishing.
Stock status of Queensland’s fisheries resources 2012 17
0
5
10
15
20
25
30
0
10
20
30
40
50
60
70
8019
9219
9319
9419
9519
9619
9719
9819
9920
0020
0120
0220
0320
0420
0520
0620
0720
0820
0920
1020
11
Cat
ch ra
te (k
g/10
0m n
et/d
ay)
Cat
ch (t
)
Net catch north of 13° S (t) Net catch rate (kg/100m net/day)
Figure 6: Barramundi (northern stock) —reported commercial net harvest (t) and catch per unit effort (CPUE) in kg/100m/day from the GOC Barramundi stock north of 13° S from 1992–2011.
0
5
10
15
20
25
30
35
0
200
400
600
800
1000
1200
1992
1993
1994
1995
1996
1997
1998
1999
2000
2001
2002
2003
2004
2005
2006
2007
2008
2009
2010
2011
Cat
ch ra
te (k
g/10
0m n
et/d
ay)
Cat
ch (t
)
Net (t) Catch rate (kg/100m net/day)
Figure 7: Barramundi (southern stock)—reported commercial net harvest (t) and catch per unit effort (CPUE) in kg/100m/day from the GOC Barramundi stock north of 13° S from 1992–2011).
0
10
20
30
40 2008Commercial
2008Recreational
0
10
20
30
40 2009 2009
0
10
20
30
40 2010 2010
1 3 5 7 9 11 13 15 17 19
0
10
20
30
40 2011
1 3 5 7 9 11 13 15 17 19
2011
Age Group (years)
Per
cent
age
of c
atch
Gulf of Carpentaria
Figure 8: Age frequency of Barramundi sampled in the Gulf of Carpentaria between 2008 and 2011.
Stock status of Queensland’s fisheries resources 2012 18
Blue Eye Trevalla (Hyperoglyphe antarctica) East Coast
Stock status 2012 Undefined
Stock status 2011 Uncertain
Principal fishery Deep Water Fin Fish Fishery (DWFFF)
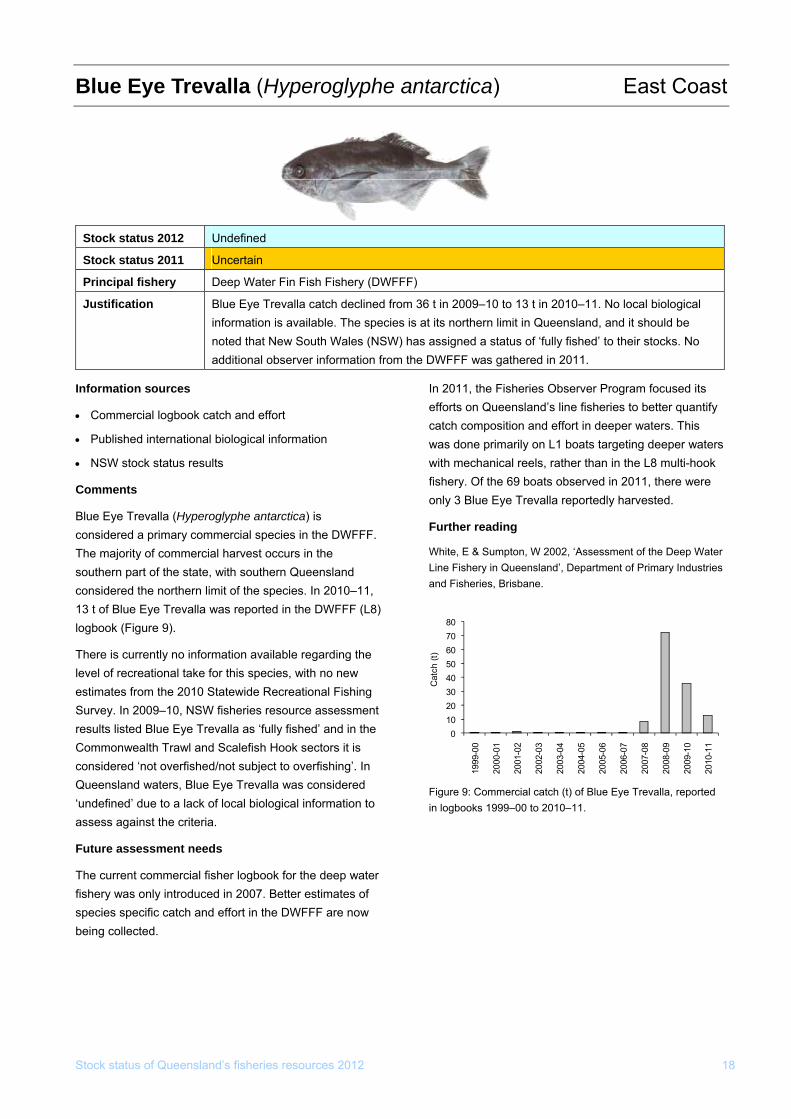
Justification Blue Eye Trevalla catch declined from 36 t in 2009–10 to 13 t in 2010–11. No local biological
information is available. The species is at its northern limit in Queensland, and it should be noted that New South Wales (NSW) has assigned a status of ‘fully fished’ to their stocks. Noadditional observer information from the DWFFF was gathered in 2011.
Information sources
• Commercial logbook catch and effort
• Published international biological information
• NSW stock status results
Comments
Blue Eye Trevalla (Hyperoglyphe antarctica) is considered a primary commercial species in the DWFFF. The majority of commercial harvest occurs in the southern part of the state, with southern Queensland considered the northern limit of the species. In 2010–11, 13 t of Blue Eye Trevalla was reported in the DWFFF (L8) logbook (Figure 9).
There is currently no information available regarding the level of recreational take for this species, with no new estimates from the 2010 Statewide Recreational Fishing Survey. In 2009–10, NSW fisheries resource assessment results listed Blue Eye Trevalla as ‘fully fished’ and in the Commonwealth Trawl and Scalefish Hook sectors it is considered ‘not overfished/not subject to overfishing’. In Queensland waters, Blue Eye Trevalla was considered ‘undefined’ due to a lack of local biological information to assess against the criteria.
Future assessment needs
The current commercial fisher logbook for the deep water fishery was only introduced in 2007. Better estimates of species specific catch and effort in the DWFFF are now being collected.
In 2011, the Fisheries Observer Program focused its y
ers
, W 2002, ‘Assessment of the Deep Water
h (t) of Blue Eye Trevalla, reported
efforts on Queensland’s line fisheries to better quantifcatch composition and effort in deeper waters. This was done primarily on L1 boats targeting deeper watwith mechanical reels, rather than in the L8 multi-hook fishery. Of the 69 boats observed in 2011, there were only 3 Blue Eye Trevalla reportedly harvested.
Further reading
White, E & SumptonLine Fishery in Queensland’, Department of Primary Industries and Fisheries, Brisbane.
Figure 9: Commercial catc
01020304050607080
1999
-00
2000
-01
2001
-02
2002
-03
2003
-04
2004
-05
2005
-06
2006
-07
2007
-08
2008
-09
2009
-10
2010
-11
Cat
ch (t
)
in logbooks 1999–00 to 2010–11.
Stock status of Queensland’s fisheries resources 2012 19
Bonito (Sarda spp.) East Coast
Stock status 2012 Undefined
Stock status 2011 Undefined
Principal fishery East Coast Inshore Fin Fish Fishery (ECIFFF) / Rocky Reef Fin Fish Fishery (RRFFF)
Justification South East Queensland is the northern extent of the species range. Better species resolution in reporting is required. If catches continue to become insignificant the species group will not likely be assessed through the stock status process in the future.
Species complex Australian Bonito (Sarda australis), Leaping Bonito (Cybiosarda elegans), Striped Bonito (Sarda orientalis)
Information sources
• Commercial logbook catch
• Charter logbook catch
• NSW stock status results
Comments
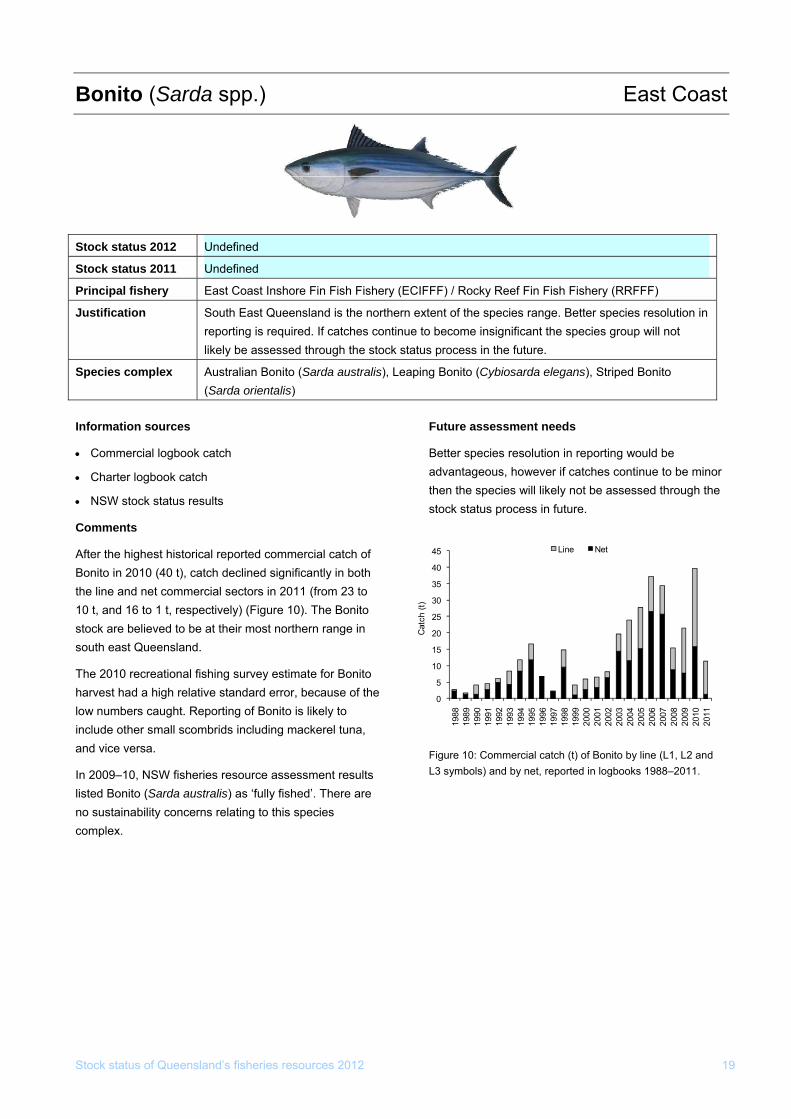
After the highest historical reported commercial catch of Bonito in 2010 (40 t), catch declined significantly in both the line and net commercial sectors in 2011 (from 23 to 10 t, and 16 to 1 t, respectively) (Figure 10). The Bonito stock are believed to be at their most northern range in south east Queensland.
The 2010 recreational fishing survey estimate for Bonito harvest had a high relative standard error, because of the low numbers caught. Reporting of Bonito is likely to include other small scombrids including mackerel tuna, and vice versa.
In 2009–10, NSW fisheries resource assessment results listed Bonito (Sarda australis) as ‘fully fished’. There are no sustainability concerns relating to this species complex.
Future assessment needs
Better species resolution in reporting would be advantageous, however if catches continue to be minor then the species will likely not be assessed through the stock status process in future.
Figure 10: Commercial catch (t) of Bonito by line (L1, L2 and L3 symbols) and by net, reported in logbooks 1988–2011.
0
5
10
15
20
25
30
35
40
45
1988
1989
1990
1991
1992
1993
1994
1995
1996
1997
1998
1999
2000
2001
2002
2003
2004
2005
2006
2007
2008
2009
2010
2011
Cat
ch (t
)
Line Net
Stock status of Queensland’s fisheries resources 2012 20
Bream–Yellowfin (Acanthopagrus australis) East Coast
Stock status 2012 Sustainably fished
Stock status 2011 Sustainably fished
Principal fishery East Coast Inshore Fin Fish Fishery (ECIFFF) / Recreational
Justification Yellowfin Bream commercial catches and catch rates increased slightly in 2011 after falling in 2010, however the catch performance measures triggered. The Minimum Legal Size (MLS) increase from introduced in 2010 coupled with the closure to fishing of areas of the Moreton Bay in 2009 are the likely causes for the lower catches. The evidence suggests that the biomass of the stock is unlikely to be recruitment overfished. Estimates of total mortality show a decreasing trend and remain below upper limits. The current level of fishing pressure is unlikely to cause the stock to become recruitment overfished.
Information sources
• Commercial logbook catch and effort
• Recreational harvest estimates
• Charter logbook catch and effort
• Fishery-dependent length and age information (2007–11)
• Published local biological information
• Performance measures
Comments
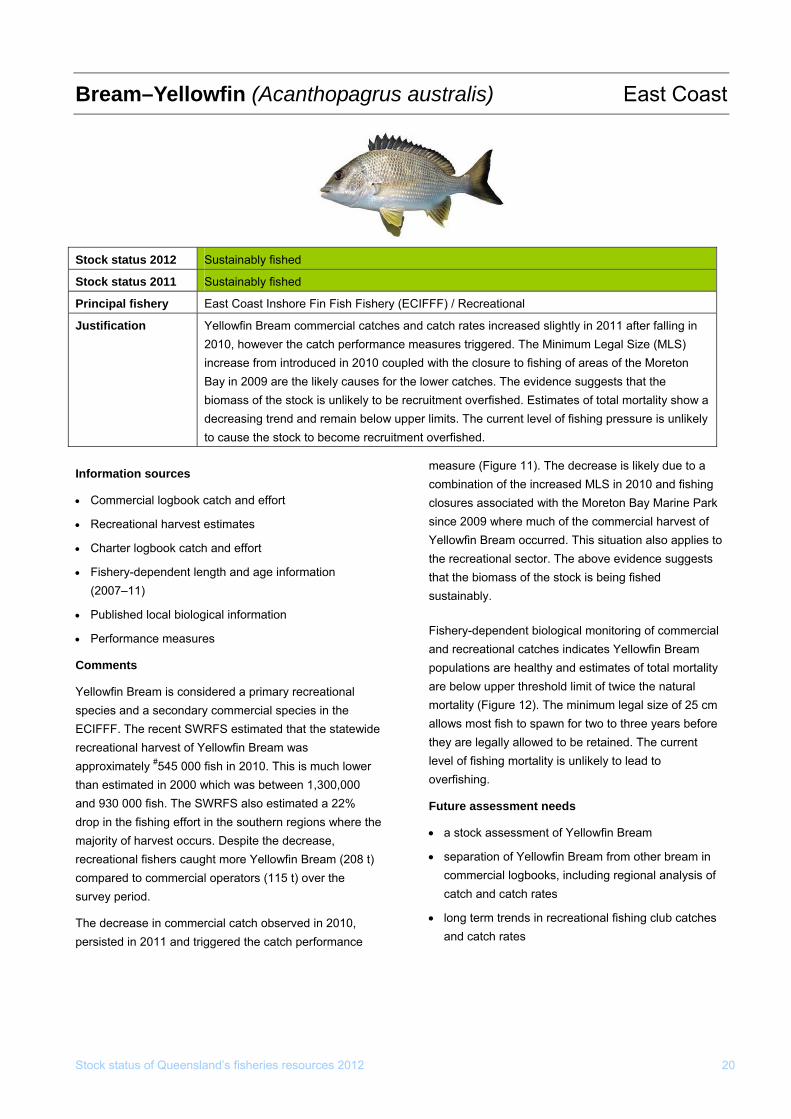
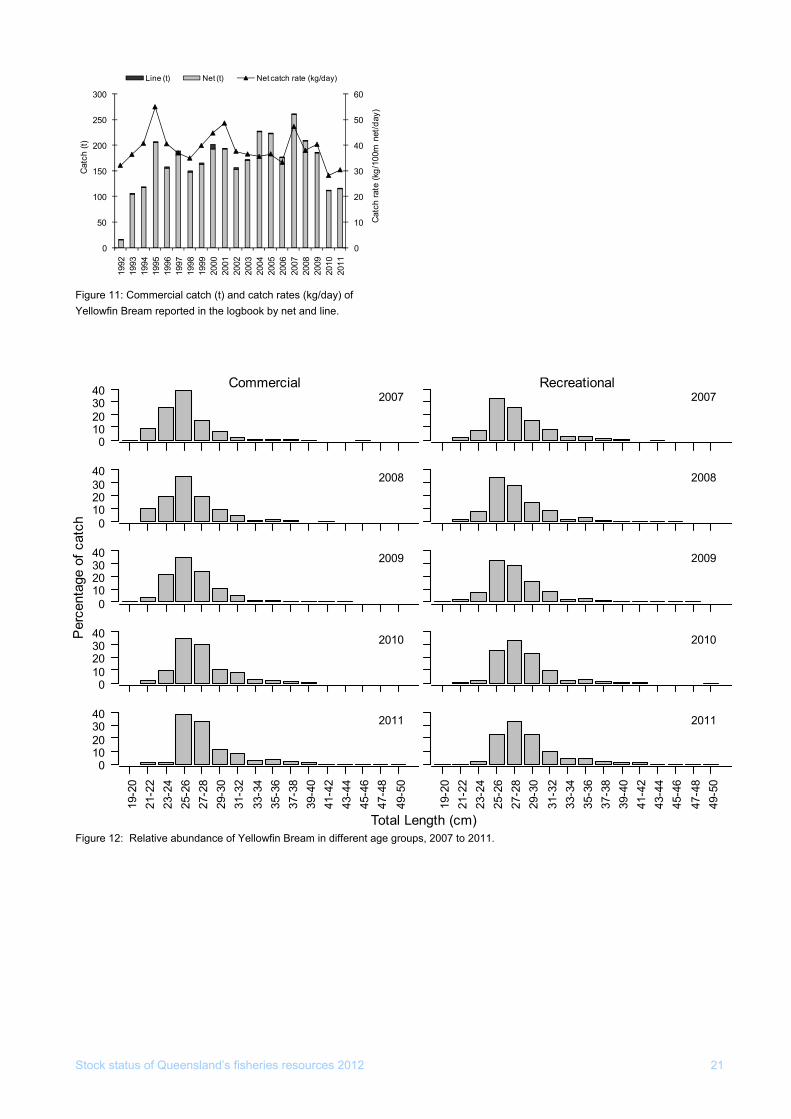
Yellowfin Bream is considered a primary recreational species and a secondary commercial species in the ECIFFF. The recent SWRFS estimated that the statewide recreational harvest of Yellowfin Bream was approximately #545 000 fish in 2010. This is much lower than estimated in 2000 which was between 1,300,000 and 930 000 fish. The SWRFS also estimated a 22% drop in the fishing effort in the southern regions where the majority of harvest occurs. Despite the decrease, recreational fishers caught more Yellowfin Bream (208 t) compared to commercial operators (115 t) over the survey period.
The decrease in commercial catch observed in 2010, persisted in 2011 and triggered the catch performance
measure (Figure 11). The decrease is likely due to a combination of the increased MLS in 2010 and fishing closures associated with the Moreton Bay Marine Park since 2009 where much of the commercial harvest of Yellowfin Bream occurred. This situation also applies to the recreational sector. The above evidence suggests that the biomass of the stock is being fished sustainably.
Fishery-dependent biological monitoring of commercial and recreational catches indicates Yellowfin Bream populations are healthy and estimates of total mortality are below upper threshold limit of twice the natural mortality (Figure 12). The minimum legal size of 25 cm allows most fish to spawn for two to three years before they are legally allowed to be retained. The current level of fishing mortality is unlikely to lead to overfishing.
Future assessment needs
• a stock assessment of Yellowfin Bream
• separation of Yellowfin Bream from other bream in commercial logbooks, including regional analysis of catch and catch rates
• long term trends in recreational fishing club catches and catch rates
Stock status of Queensland’s fisheries resources 2012 21
0
10
20
30
40
50
60
0
50
100
150
200
250
300
1992
1993
1994
1995
1996
1997
1998
1999
2000
2001
2002
2003
2004
2005
2006
2007
2008
2009
2010
2011
Cat
ch ra
te (k
g/10
0m n
et/d
ay)
Cat
ch (t
)Line (t) Net (t) Net catch rate (kg/day)
Figure 11: Commercial catch (t) and catch rates (kg/day) of Yellowfin Bream reported in the logbook by net and line.
010203040 2007
Commercial2007
Recreational
010203040 2008 2008
010203040 2009 2009
010203040 2010 2010
19-2
021
-22
23-2
425
-26
27-2
829
-30
31-3
233
-34
35-3
637
-38
39-4
041
-42
43-4
445
-46
47-4
849
-50
010203040 2011
19-2
021
-22
23-2
425
-26
27-2
829
-30
31-3
233
-34
35-3
637
-38
39-4
041
-42
43-4
445
-46
47-4
849
-50
2011
Total Length (cm)
Per
cent
age
of c
atch
Figure 12: Relative abundance of Yellowfin Bream in different age groups, 2007 to 2011.
Stock status of Queensland’s fisheries resources 2012 22
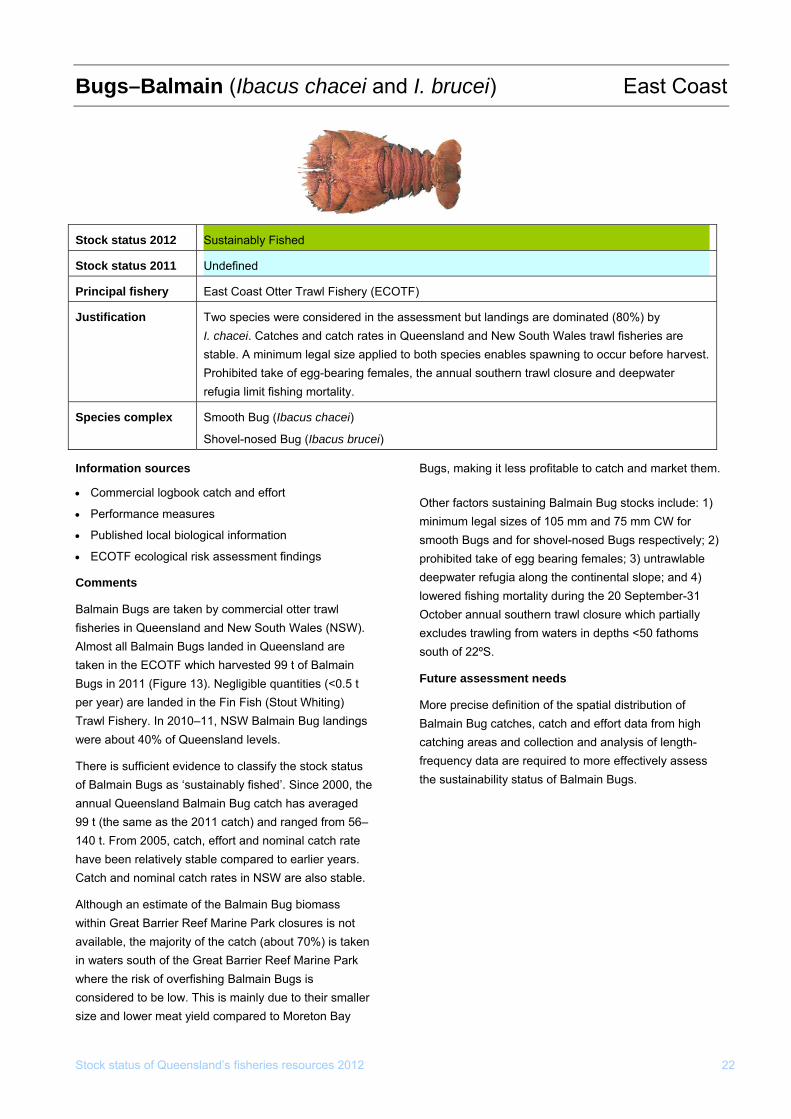
Bugs–Balmain (Ibacus chacei and I. brucei) East Coast
tock status 2012 S Sustainably Fished
Stock status 2011 Undefined
Principal fishery East Coast Otter Trawl Fishery (ECOTF)
Justification Two species were considered in the assessment but landings are dominated (80%) by I. chacei. Catches and catch rates in Queensland and New South Wales trawl fisheries are stable. A minimum legal size applied to both species enables spawning to occur before harvest. Prohibited take of egg-bearing females, the annual southern trawl closure and deepwater refugia limit fishing mortality.
Species complex Smooth Bug (Ibacus chacei)
Shovel-nosed Bug (Ibacus brucei)
Information sources
• Commercial logbook catch and effort
• Performance measures
• Published local biological information
• ECOTF ecological risk assessment findings
Comments
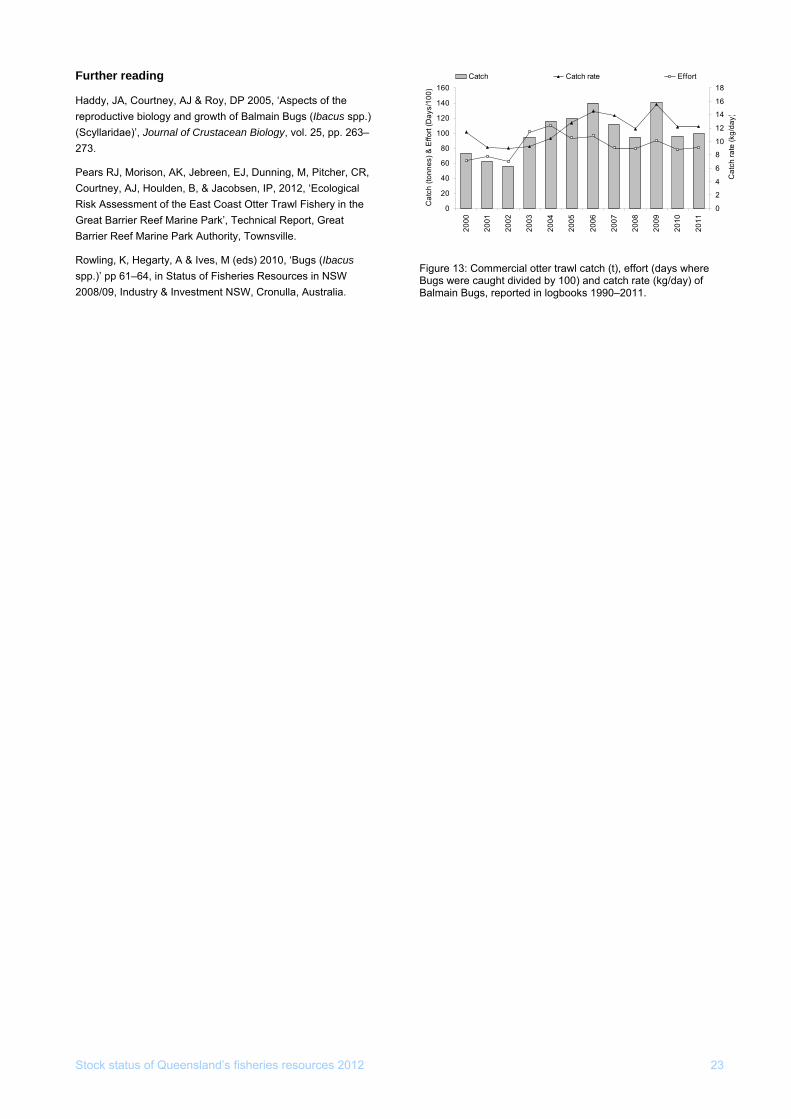
Balmain Bugs are taken by commercial otter trawl fisheries in Queensland and New South Wales (NSW). Almost all Balmain Bugs landed in Queensland are taken in the ECOTF which harvested 99 t of Balmain Bugs in 2011 (Figure 13). Negligible quantities (<0.5 t per year) are landed in the Fin Fish (Stout Whiting) Trawl Fishery. In 2010–11, NSW Balmain Bug landings were about 40% of Queensland levels.
There is sufficient evidence to classify the stock status of Balmain Bugs as ‘sustainably fished’. Since 2000, the annual Queensland Balmain Bug catch has averaged 99 t (the same as the 2011 catch) and ranged from 56–140 t. From 2005, catch, effort and nominal catch rate have been relatively stable compared to earlier years. Catch and nominal catch rates in NSW are also stable.
Although an estimate of the Balmain Bug biomass within Great Barrier Reef Marine Park closures is not available, the majority of the catch (about 70%) is taken in waters south of the Great Barrier Reef Marine Park where the risk of overfishing Balmain Bugs is considered to be low. This is mainly due to their smaller size and lower meat yield compared to Moreton Bay
Bugs, making it less profitable to catch and market them.
Other factors sustaining Balmain Bug stocks include: 1) minimum legal sizes of 105 mm and 75 mm CW for smooth Bugs and for shovel-nosed Bugs respectively; 2) prohibited take of egg bearing females; 3) untrawlable deepwater refugia along the continental slope; and 4) lowered fishing mortality during the 20 September-31 October annual southern trawl closure which partially excludes trawling from waters in depths <50 fathoms south of 22ºS.
Future assessment needs
More precise definition of the spatial distribution of Balmain Bug catches, catch and effort data from high catching areas and collection and analysis of length-frequency data are required to more effectively assess the sustainability status of Balmain Bugs.
Stock status of Queensland’s fisheries resources 2012 23
Further reading
Haddy, JA, Courtney, AJ & Roy, DP 2005, ‘Aspects of the reproductive biology and growth of Balmain Bugs (Ibacus spp.) (Scyllaridae)’, Journal of Crustacean Biology, vol. 25, pp. 263–273.
Pears RJ, Morison, AK, Jebreen, EJ, Dunning, M, Pitcher, CR, Courtney, AJ, Houlden, B, & Jacobsen, IP, 2012, ‘Ecological Risk Assessment of the East Coast Otter Trawl Fishery in the Great Barrier Reef Marine Park’, Technical Report, Great Barrier Reef Marine Park Authority, Townsville.
Rowling, K, Hegarty, A & Ives, M (eds) 2010, ‘Bugs (Ibacus spp.)’ pp 61–64, in Status of Fisheries Resources in NSW 2008/09, Industry & Investment NSW, Cronulla, Australia.
0
20
40
60
80
100
120
140
160
2000
2001
2002
2003
2004
2005
2006
2007
2008
2009
2010
2011
Cat
ch (t
onne
s) &
Effo
rt (D
ays/
100)
0
2
4
6
8
10
12
14
16
18
Cat
ch ra
te (k
g/da
y)
Catch Catch rate Effort
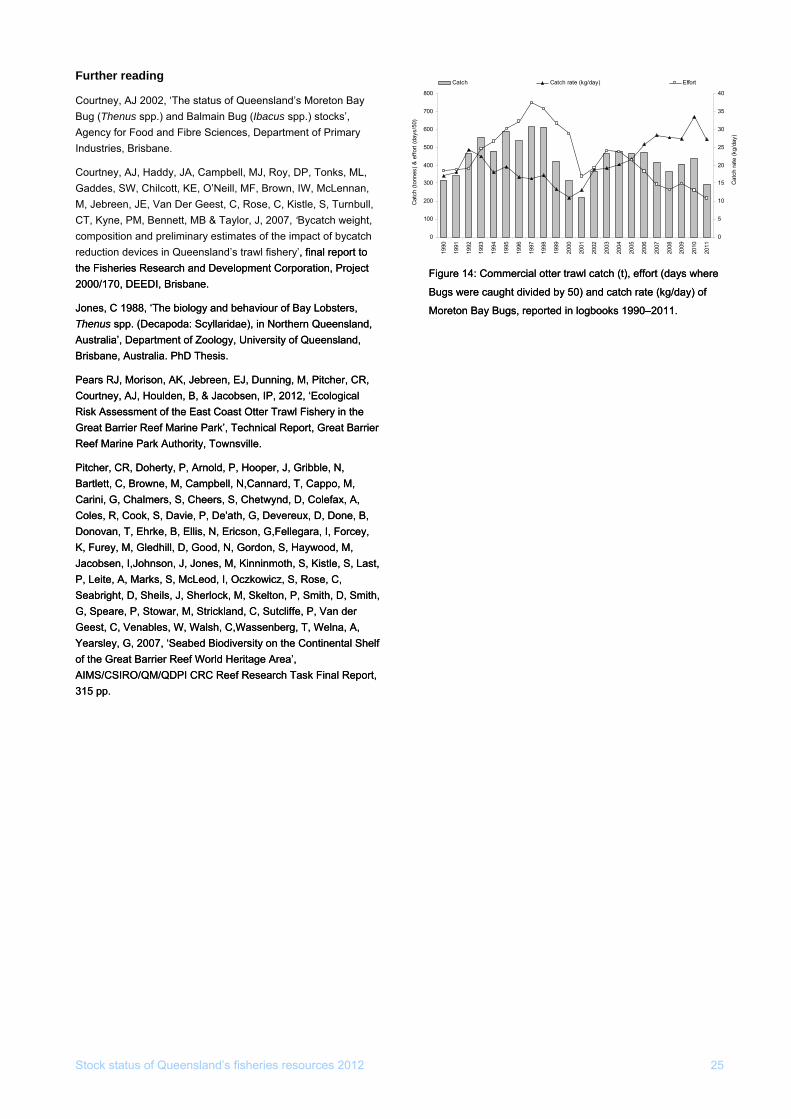
Figure 13: Commercial otter trawl catch (t), effort (days where Bugs were caught divided by 100) and catch rate (kg/day) of Balmain Bugs, reported in logbooks 1990–2011.
Stock status of Queensland’s fisheries resources 2012 24
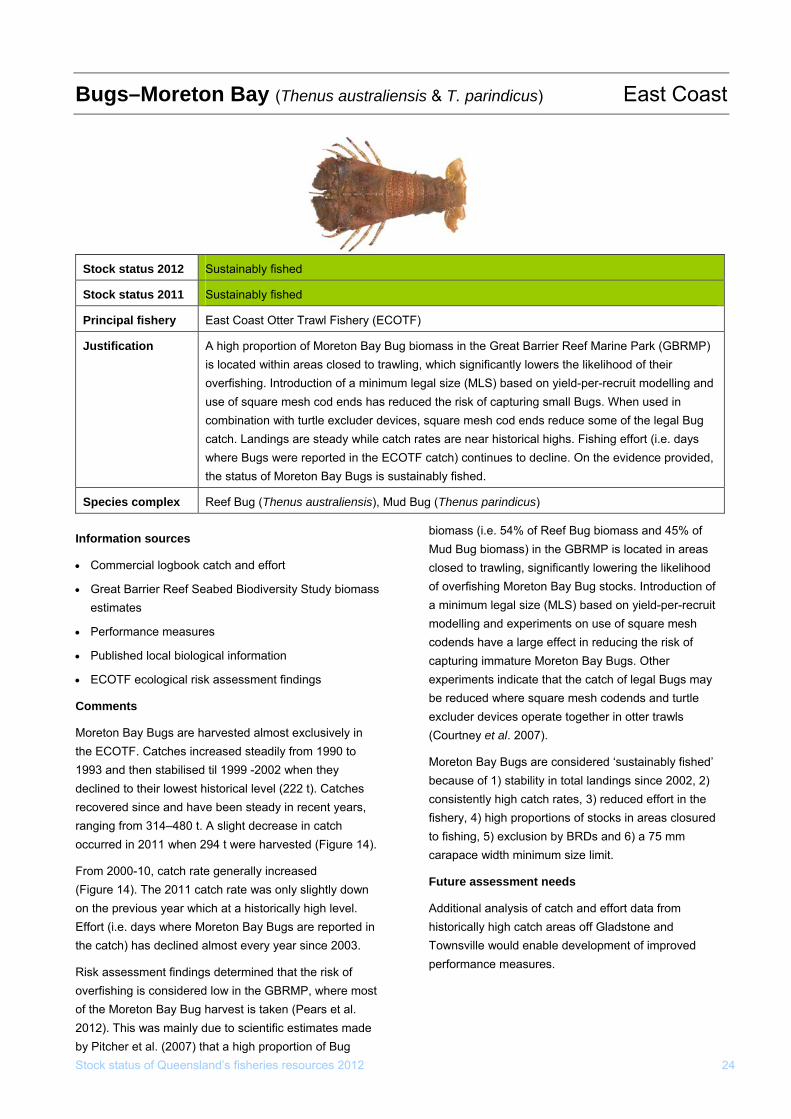
Bugs–Moreton Bay (Thenus australiensis & T. parindicus) East Coast
Stock status 2012 Sustainably fished
Stock status 2011 Sustainably fished
Principal fishery East Coast Otter Trawl Fishery (ECOTF)
Justification A high proportion of Moreton Bay Bug biomass in the Great Barrier Reef Marine Park (GBRMP) is located within areas closed to trawling, which significantly lowers the likelihood of their overfishing. Introduction of a minimum legal size (MLS) based on yield-per-recruit modelling and use of square mesh cod ends has reduced the risk of capturing small Bugs. When used in combination with turtle excluder devices, square mesh cod ends reduce some of the legal Bug catch. Landings are steady while catch rates are near historical highs. Fishing effort (i.e. days where Bugs were reported in the ECOTF catch) continues to decline. On the evidence provided, the status of Moreton Bay Bugs is sustainably fished.
Species complex Reef Bug (Thenus australiensis), Mud Bug (Thenus parindicus)
Information sources
• Commercial logbook catch and effort
• Great Barrier Reef Seabed Biodiversity Study biomass estimates
• Performance measures
• Published local biological information
• ECOTF ecological risk assessment findings
Comments
Moreton Bay Bugs are harvested almost exclusively in the ECOTF. Catches increased steadily from 1990 to 1993 and then stabilised til 1999 -2002 when they declined to their lowest historical level (222 t). Catches recovered since and have been steady in recent years, ranging from 314–480 t. A slight decrease in catch occurred in 2011 when 294 t were harvested (Figure 14).
From 2000-10, catch rate generally increased (Figure 14). The 2011 catch rate was only slightly down on the previous year which at a historically high level. Effort (i.e. days where Moreton Bay Bugs are reported in the catch) has declined almost every year since 2003.
Risk assessment findings determined that the risk of overfishing is considered low in the GBRMP, where most of the Moreton Bay Bug harvest is taken (Pears et al. 2012). This was mainly due to scientific estimates made by Pitcher et al. (2007) that a high proportion of Bug
biomass (i.e. 54% of Reef Bug biomass and 45% of Mud Bug biomass) in the GBRMP is located in areas closed to trawling, significantly lowering the likelihood of overfishing Moreton Bay Bug stocks. Introduction of a minimum legal size (MLS) based on yield-per-recruit modelling and experiments on use of square mesh codends have a large effect in reducing the risk of capturing immature Moreton Bay Bugs. Other experiments indicate that the catch of legal Bugs may be reduced where square mesh codends and turtle excluder devices operate together in otter trawls (Courtney et al. 2007).
Moreton Bay Bugs are considered ‘sustainably fished’ because of 1) stability in total landings since 2002, 2) consistently high catch rates, 3) reduced effort in the fishery, 4) high proportions of stocks in areas closured to fishing, 5) exclusion by BRDs and 6) a 75 mm carapace width minimum size limit.
Future assessment needs
Additional analysis of catch and effort data from historically high catch areas off Gladstone and Townsville would enable development of improved performance measures.
Stock status of Queensland’s fisheries resources 2012 25
Further reading
Courtney, AJ 2002, ‘The status of Queensland’s Moreton Bay Bug (Thenus spp.) and Balmain Bug (Ibacus spp.) stocks’, Agency for Food and Fibre Sciences, Department of Primary Industries, Brisbane.
Courtney, AJ, Haddy, JA, Campbell, MJ, Roy, DP, Tonks, ML, Gaddes, SW, Chilcott, KE, O’Neill, MF, Brown, IW, McLennan, M, Jebreen, JE, Van Der Geest, C, Rose, C, Kistle, S, Turnbull, CT, Kyne, PM, Bennett, MB & Taylor, J, 2007, ‘Bycatch weight, composition and preliminary estimates of the impact of bycatch reduction devices in Queensland’s trawl fishery’, final report to the Fisheries Research and Development Corporation, Project 2000/170, DEEDI, Brisbane.
, final report to the Fisheries Research and Development Corporation, Project 2000/170, DEEDI, Brisbane.
Jones, C 1988, ‘The biology and behaviour of Bay Lobsters, Thenus spp. (Decapoda: Scyllaridae), in Northern Queensland, Australia’, Department of Zoology, University of Queensland, Brisbane, Australia. PhD Thesis.
Jones, C 1988, ‘The biology and behaviour of Bay Lobsters, Thenus spp. (Decapoda: Scyllaridae), in Northern Queensland, Australia’, Department of Zoology, University of Queensland, Brisbane, Australia. PhD Thesis.
Pears RJ, Morison, AK, Jebreen, EJ, Dunning, M, Pitcher, CR, Courtney, AJ, Houlden, B, & Jacobsen, IP, 2012, ‘Ecological Risk Assessment of the East Coast Otter Trawl Fishery in the Great Barrier Reef Marine Park’, Technical Report, Great Barrier Reef Marine Park Authority, Townsville.
Pears RJ, Morison, AK, Jebreen, EJ, Dunning, M, Pitcher, CR, Courtney, AJ, Houlden, B, & Jacobsen, IP, 2012, ‘Ecological Risk Assessment of the East Coast Otter Trawl Fishery in the Great Barrier Reef Marine Park’, Technical Report, Great Barrier Reef Marine Park Authority, Townsville.
Pitcher, CR, Doherty, P, Arnold, P, Hooper, J, Gribble, N, Bartlett, C, Browne, M, Campbell, N,Cannard, T, Cappo, M, Carini, G, Chalmers, S, Cheers, S, Chetwynd, D, Colefax, A, Coles, R, Cook, S, Davie, P, De'ath, G, Devereux, D, Done, B, Donovan, T, Ehrke, B, Ellis, N, Ericson, G,Fellegara, I, Forcey, K, Furey, M, Gledhill, D, Good, N, Gordon, S, Haywood, M, Jacobsen, I,Johnson, J, Jones, M, Kinninmoth, S, Kistle, S, Last, P, Leite, A, Marks, S, McLeod, I, Oczkowicz, S, Rose, C, Seabright, D, Sheils, J, Sherlock, M, Skelton, P, Smith, D, Smith, G, Speare, P, Stowar, M, Strickland, C, Sutcliffe, P, Van der Geest, C, Venables, W, Walsh, C,Wassenberg, T, Welna, A, Yearsley, G, 2007, ‘Seabed Biodiversity on the Continental Shelf of the Great Barrier Reef World Heritage Area’, AIMS/CSIRO/QM/QDPI CRC Reef Research Task Final Report, 315 pp.
Pitcher, CR, Doherty, P, Arnold, P, Hooper, J, Gribble, N, Bartlett, C, Browne, M, Campbell, N,Cannard, T, Cappo, M, Carini, G, Chalmers, S, Cheers, S, Chetwynd, D, Colefax, A, Coles, R, Cook, S, Davie, P, De'ath, G, Devereux, D, Done, B, Donovan, T, Ehrke, B, Ellis, N, Ericson, G,Fellegara, I, Forcey, K, Furey, M, Gledhill, D, Good, N, Gordon, S, Haywood, M, Jacobsen, I,Johnson, J, Jones, M, Kinninmoth, S, Kistle, S, Last, P, Leite, A, Marks, S, McLeod, I, Oczkowicz, S, Rose, C, Seabright, D, Sheils, J, Sherlock, M, Skelton, P, Smith, D, Smith, G, Speare, P, Stowar, M, Strickland, C, Sutcliffe, P, Van der Geest, C, Venables, W, Walsh, C,Wassenberg, T, Welna, A, Yearsley, G, 2007, ‘Seabed Biodiversity on the Continental Shelf of the Great Barrier Reef World Heritage Area’, AIMS/CSIRO/QM/QDPI CRC Reef Research Task Final Report, 315 pp.
0
100
200
300
400
500
600
700
800
1990
1991
1992
1993
1994
1995
1996
1997
1998
1999
2000
2001
2002
2003
2004
2005
2006
2007
2008
2009
2010
2011
Cat
ch (t
onne
s) &
effo
rt (d
ays/
50)
0
5
10
15
20
25
30
35
40
Cat
ch ra
te (k
g/da
y)
Catch Catch rate (kg/day) Effort
Figure 14: Commercial otter trawl catch (t), effort (days where
Bugs were caught divided by 50) and catch rate (kg/day) of
Moreton Bay Bugs, reported in logbooks 1990–2011.
Figure 14: Commercial otter trawl catch (t), effort (days where
Bugs were caught divided by 50) and catch rate (kg/day) of
Moreton Bay Bugs, reported in logbooks 1990–2011.
Stock status of Queensland’s fisheries resources 2012 26
Cobia (Rachycentron canadum) East Coast
Stock status 2012 Undefined
Stock status 2011 Undefined
Principal fishery Rocky Reef Fin Fish Fishery (RRFFF) / Recreational / East Coast Inshore Fin Fish Fishery
Justification Historical catch rates are variable. Limited biological information has been collected for this species, however, there is low sustainability concern due to fast growth of juveniles—fish recruit to the fishery within 12 months. Updated recreational harvest estimates were low, but a subsequent survey is required to assess trends over time.
Information sources
• Commercial logbook catch and effort
• Recreational catch estimates
• Charter logbook catch and effort
• Fishery-dependent length information (2006–10)
• Performance measures
Comments
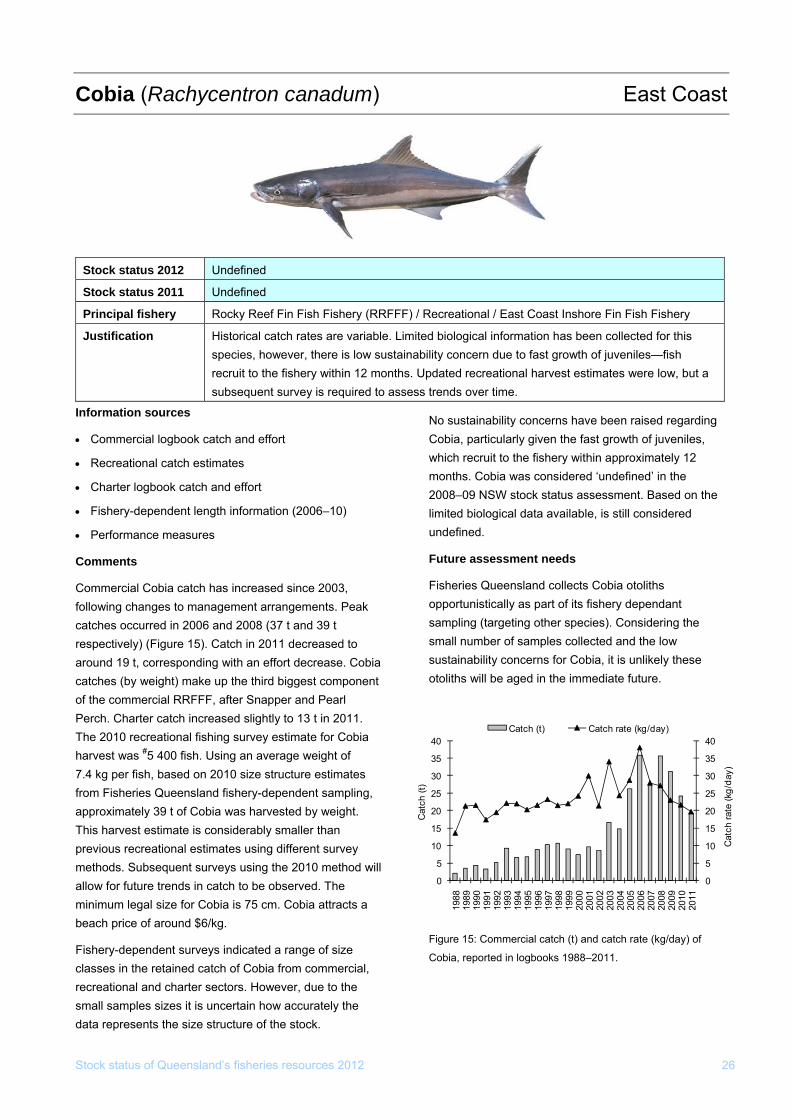
Commercial Cobia catch has increased since 2003, following changes to management arrangements. Peak catches occurred in 2006 and 2008 (37 t and 39 t respectively) (Figure 15). Catch in 2011 decreased to around 19 t, corresponding with an effort decrease. Cobia catches (by weight) make up the third biggest component of the commercial RRFFF, after Snapper and Pearl Perch. Charter catch increased slightly to 13 t in 2011. The 2010 recreational fishing survey estimate for Cobia harvest was #5 400 fish. Using an average weight of 7.4 kg per fish, based on 2010 size structure estimates from Fisheries Queensland fishery-dependent sampling, approximately 39 t of Cobia was harvested by weight. This harvest estimate is considerably smaller than previous recreational estimates using different survey methods. Subsequent surveys using the 2010 method will allow for future trends in catch to be observed. The minimum legal size for Cobia is 75 cm. Cobia attracts a beach price of around $6/kg.
Fishery-dependent surveys indicated a range of size classes in the retained catch of Cobia from commercial, recreational and charter sectors. However, due to the small samples sizes it is uncertain how accurately the data represents the size structure of the stock.
No sustainability concerns have been raised regarding Cobia, particularly given the fast growth of juveniles, which recruit to the fishery within approximately 12 months. Cobia was considered ‘undefined’ in the 2008–09 NSW stock status assessment. Based on the limited biological data available, is still considered undefined.
Future assessment needs
Fisheries Queensland collects Cobia otoliths opportunistically as part of its fishery dependant sampling (targeting other species). Considering the small number of samples collected and the low sustainability concerns for Cobia, it is unlikely these otoliths will be aged in the immediate future.
0
5
10
15
20
25
30
35
40
0
5
10
15
20
25
30
35
40
1988
1989
1990
1991
1992
1993
1994
1995
1996
1997
1998
1999
2000
2001
2002
2003
2004
2005
2006
2007
2008
2009
2010
2011
Cat
ch ra
te (k
g/da
y)
Cat
ch (t
)
Catch (t) Catch rate (kg/day)
Figure 15: Commercial catch (t) and catch rate (kg/day) of
Cobia, reported in logbooks 1988–2011.
Stock status of Queensland’s fisheries resources 2012 27
Coral trout (Plectropomus spp. and Variola spp.) East Coast
Information sources
• Commercial logbook catch and effort
• Coral trout quota usage
• Recreational catch estimates
• Charter logbook catch and effort
• Fishery-independent length and abundance information (2005–09)
• Performance measures
• Published local biological information
Comments
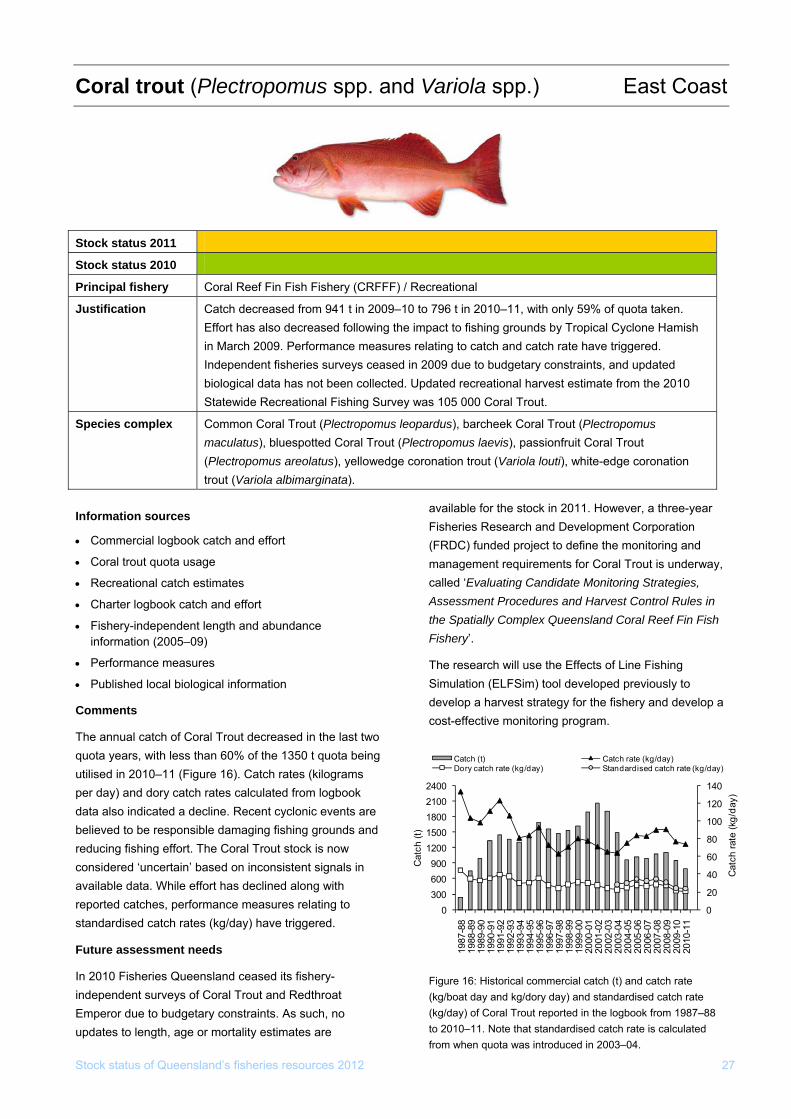
The annual catch of Coral Trout decreased in the last two quota years, with less than 60% of the 1350 t quota being utilised in 2010–11 (Figure 16). Catch rates (kilograms per day) and dory catch rates calculated from logbook data also indicated a decline. Recent cyclonic events are believed to be responsible damaging fishing grounds and reducing fishing effort. The Coral Trout stock is now considered ‘uncertain’ based on inconsistent signals in available data. While effort has declined along with reported catches, performance measures relating to standardised catch rates (kg/day) have triggered.
Stock status 2011 Uncertain
Stock status 2010 Sustainably fished
Principal fishery Coral Reef Fin Fish Fishery (CRFFF) / Recreational
Justification Catch decreased from 941 t in 2009–10 to 796 t in 2010–11, with only 59% of quota taken. Effort has also decreased following the impact to fishing grounds by Tropical Cyclone Hamish in March 2009. Performance measures relating to catch and catch rate have triggered. Independent fisheries surveys ceased in 2009 due to budgetary constraints, and updated biological data has not been collected. Updated recreational harvest estimate from the 2010 Statewide Recreational Fishing Survey was 105 000 Coral Trout.
Species complex Common Coral Trout (Plectropomus leopardus), barcheek Coral Trout (Plectropomus maculatus), bluespotted Coral Trout (Plectropomus laevis), passionfruit Coral Trout (Plectropomus areolatus), yellowedge coronation trout (Variola louti), white-edge coronation trout (Variola albimarginata).
Future assessment needs
In 2010 Fisheries Queensland ceased its fishery-independent surveys of Coral Trout and Redthroat Emperor due to budgetary constraints. As such, no updates to length, age or mortality estimates are
available for the stock in 2011. However, a three-year Fisheries Research and Development Corporation (FRDC) funded project to define the monitoring and management requirements for Coral Trout is underway, called ‘Evaluating Candidate Monitoring Strategies, Assessment Procedures and Harvest Control Rules in the Spatially Complex Queensland Coral Reef Fin Fish Fishery’.
Figure 16: Historical commercial catch (t) and catch rate (kg/boat day and kg/dory day) and standardised catch rate (kg/day) of Coral Trout reported in the logbook from 1987–88 to 2010–11. Note that standardised catch rate is calculated from when quota was introduced in 2003–04.
0
20
40
60
80
100
120
140
0300600900
12001500180021002400
1987
-88
1988
-89
1989
-90
1990
-91
1991
-92
1992
-93
1993
-94
1994
-95
1995
-96
1996
-97
1997
-98
1998
-99
1999
-00
2000
-01
2001
-02
2002
-03
2003
-04
2004
-05
2005
-06
2006
-07
2007
-08
2008
-09
2009
-10
2010
-11
Cat
ch ra
te (k
g/da
y)
Cat
ch (t
)
Catch (t) Catch rate (kg/day)Dory catch rate (kg/day) Standardised catch rate (kg/day)
The research will use the Effects of Line Fishing Simulation (ELFSim) tool developed previously to develop a harvest strategy for the fishery and develop a cost-effective monitoring program.
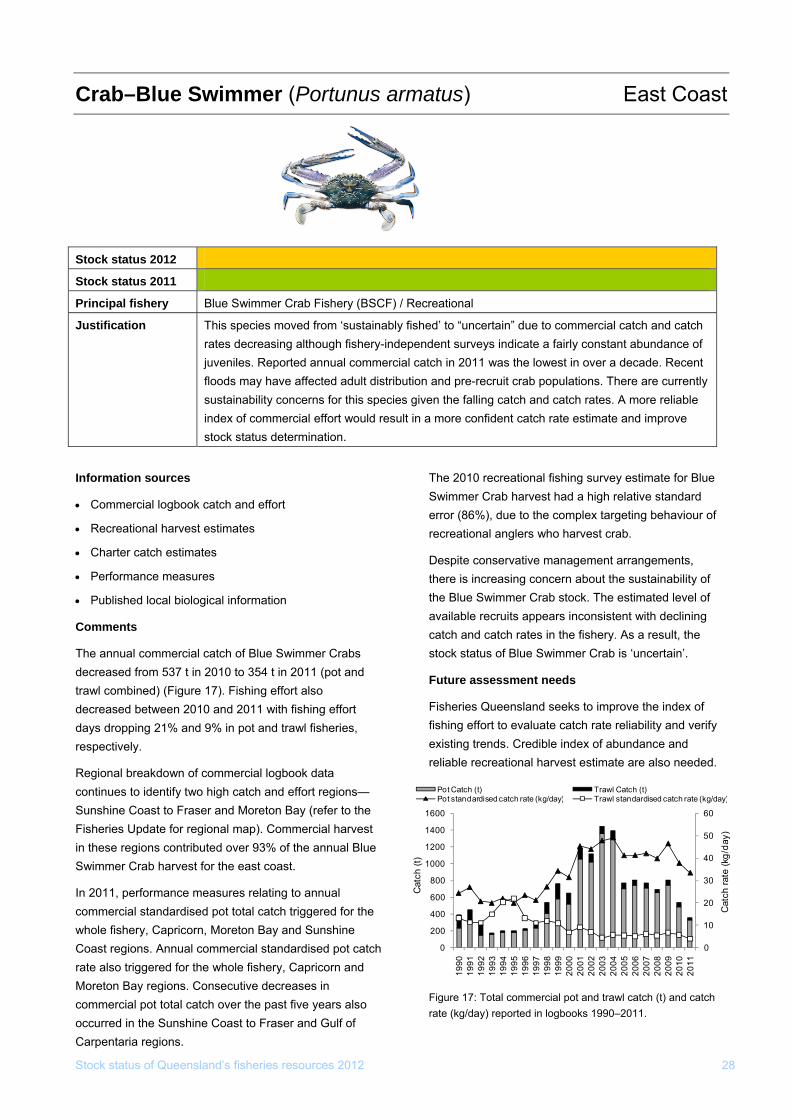
Stock status of Queensland’s fisheries resources 2012 28
Crab–Blue Swimmer (Portunus armatus) East Coast
Stock status 2012 Uncertain
Stock status 2011 Sustainably fished
Principal fishery Blue Swimmer Crab Fishery (BSCF) / Recreational
Justification This species moved from ‘sustainably fished’ to “uncertain” due to commercial catch and catch rates decreasing although fishery-independent surveys indicate a fairly constant abundance of juveniles. Reported annual commercial catch in 2011 was the lowest in over a decade. Recent floods may have affected adult distribution and pre-recruit crab populations. There are currently sustainability concerns for this species given the falling catch and catch rates. A more reliable index of commercial effort would result in a more confident catch rate estimate and improve stock status determination.
Information sources
• Commercial logbook catch and effort
• Recreational harvest estimates
• Charter catch estimates
• Performance measures
• Published local biological information
Comments
The annual commercial catch of Blue Swimmer Crabs decreased from 537 t in 2010 to 354 t in 2011 (pot and trawl combined) (Figure 17). Fishing effort also decreased between 2010 and 2011 with fishing effort days dropping 21% and 9% in pot and trawl fisheries, respectively.
Regional breakdown of commercial logbook data continues to identify two high catch and effort regions—Sunshine Coast to Fraser and Moreton Bay (refer to the Fisheries Update for regional map). Commercial harvest in these regions contributed over 93% of the annual Blue Swimmer Crab harvest for the east coast.
In 2011, performance measures relating to annual commercial standardised pot total catch triggered for the whole fishery, Capricorn, Moreton Bay and Sunshine Coast regions. Annual commercial standardised pot catch rate also triggered for the whole fishery, Capricorn and Moreton Bay regions. Consecutive decreases in commercial pot total catch over the past five years also occurred in the Sunshine Coast to Fraser and Gulf of Carpentaria regions.
The 2010 recreational fishing survey estimate for Blue Swimmer Crab harvest had a high relative standard error (86%), due to the complex targeting behaviour of recreational anglers who harvest crab.
Despite conservative management arrangements, there is increasing concern about the sustainability of the Blue Swimmer Crab stock. The estimated level of available recruits appears inconsistent with declining catch and catch rates in the fishery. As a result, the stock status of Blue Swimmer Crab is ‘uncertain’.
Future assessment needs
Fisheries Queensland seeks to improve the index of fishing effort to evaluate catch rate reliability and verify existing trends. Credible index of abundance and reliable recreational harvest estimate are also needed.
0
10
20
30
40
50
60
0
200
400
600
800
1000
1200
1400
1600
1990
1991
1992
1993
1994
1995
1996
1997
1998
1999
2000
2001
2002
2003
2004
2005
2006
2007
2008
2009
2010
2011
Cat
ch ra
te (k
g/da
y)
Cat
ch (t
)
Pot Catch (t) Trawl Catch (t) Pot standardised catch rate (kg/day) Trawl standardised catch rate (kg/day)
Figure 17: Total commercial pot and trawl catch (t) and catch rate (kg/day) reported in logbooks 1990–2011.
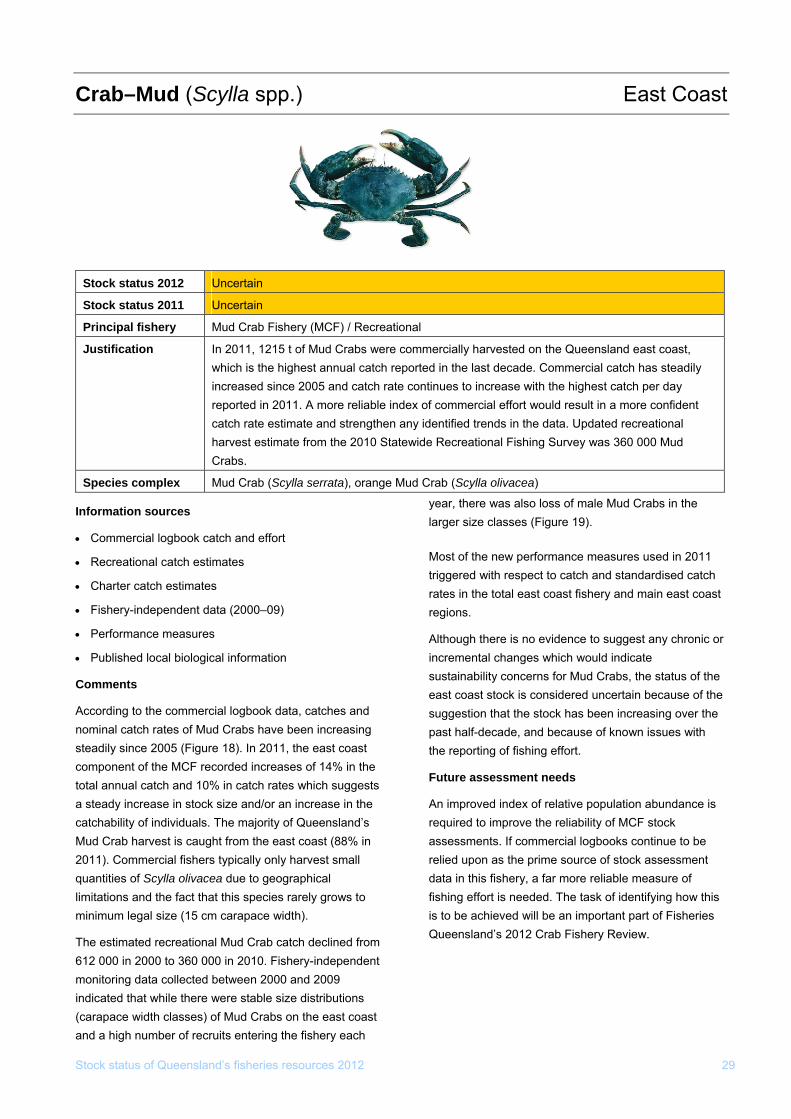
Stock status of Queensland’s fisheries resources 2012 29
Crab–Mud (Scylla spp.) East Coast
Stock status 2012 Uncertain
Stock status 2011 Uncertain
Principal fishery Mud Crab Fishery (MCF) / Recreational
Justification In 2011, 1215 t of Mud Crabs were commercially harvested on the Queensland east coast, which is the highest annual catch reported in the last decade. Commercial catch has steadily increased since 2005 and catch rate continues to increase with the highest catch per day reported in 2011. A more reliable index of commercial effort would result in a more confident catch rate estimate and strengthen any identified trends in the data. Updated recreational harvest estimate from the 2010 Statewide Recreational Fishing Survey was 360 000 Mud Crabs.
Species complex Mud Crab (Scylla serrata), orange Mud Crab (Scylla olivacea)
Information sources
• Commercial logbook catch and effort
• Recreational catch estimates
• Charter catch estimates
• Fishery-independent data (2000–09)
• Performance measures
• Published local biological information
Comments
According to the commercial logbook data, catches and nominal catch rates of Mud Crabs have been increasing steadily since 2005 (Figure 18). In 2011, the east coast component of the MCF recorded increases of 14% in the total annual catch and 10% in catch rates which suggests a steady increase in stock size and/or an increase in the catchability of individuals. The majority of Queensland’s Mud Crab harvest is caught from the east coast (88% in 2011). Commercial fishers typically only harvest small quantities of Scylla olivacea due to geographical limitations and the fact that this species rarely grows to minimum legal size (15 cm carapace width).
The estimated recreational Mud Crab catch declined from 612 000 in 2000 to 360 000 in 2010. Fishery-independent monitoring data collected between 2000 and 2009 indicated that while there were stable size distributions (carapace width classes) of Mud Crabs on the east coast and a high number of recruits entering the fishery each
year, there was also loss of male Mud Crabs in the larger size classes (Figure 19).
Most of the new performance measures used in 2011 triggered with respect to catch and standardised catch rates in the total east coast fishery and main east coast regions.
Although there is no evidence to suggest any chronic or incremental changes which would indicate sustainability concerns for Mud Crabs, the status of the east coast stock is considered uncertain because of the suggestion that the stock has been increasing over the past half-decade, and because of known issues with the reporting of fishing effort.
Future assessment needs
An improved index of relative population abundance is required to improve the reliability of MCF stock assessments. If commercial logbooks continue to be relied upon as the prime source of stock assessment data in this fishery, a far more reliable measure of fishing effort is needed. The task of identifying how this is to be achieved will be an important part of Fisheries Queensland’s 2012 Crab Fishery Review.
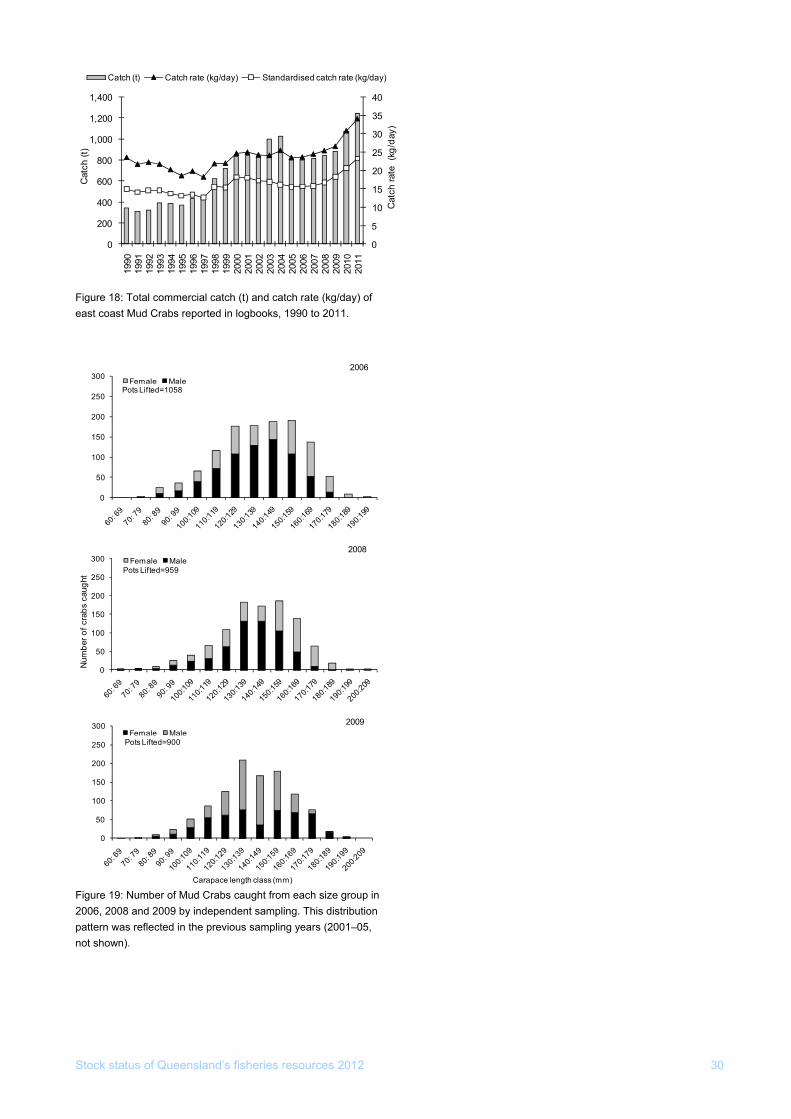
Stock status of Queensland’s fisheries resources 2012 30
igure 19: Number of Mud Crabs caught from each size group in
0
5
10
15
20
25
30
35
40
0
200
400
600
800
1,000
1,200
1,400
1990
1991
1992
1993
1994
1995
1996
1997
1998
1999
2000
2001
2002
2003
2004
2005
2006
2007
2008
2009
2010
2011
Cat
ch ra
te (
kg/d
ay)
Cat
ch (t
)Catch (t) Catch rate (kg/day) Standardised catch rate (kg/day)
Figure 18: Total commercial catch (t) and catch rate (kg/day) of east coast Mud Crabs reported in logbooks, 1990 to 2011.
0
50
100
150
200
250
3002006
Female MalePots Lifted=1058
0
50
100
150
200
250
300
Carapace length class (mm)
2009Female Male
Pots Lifted=900
0
50
100
150
200
250
3002008
Female Male
Num
ber o
f cra
bs c
augh
t Pots Lifted=959
F2006, 2008 and 2009 by independent sampling. This distribution pattern was reflected in the previous sampling years (2001–05, not shown).
Stock status of Queensland’s fisheries resources 2012 31
Crab–Mud (Scylla spp.) Gulf of Carpentaria
Stock status 2012 Sustainably fished
Stock status 2011 Sustainably fished
Principal fishery Mud Crab Fishery (MCF)
Justification Historical commercial catch levels and catch rates are variable. Between 2008 and 2011 the harvest of Mud Crabs in the Gulf of Carpentaria (GOC) was high, but within historically sustained levels. Catch rates continue to illustrate fluctuating trends. Size frequencies show no significant change in the distribution of individuals across size classes and consistently show a high representation of large males. Updated recreational harvest estimate from the 2010 Statewide Recreational Fishing Survey was approximately 7000 Mud Crabs.
Species complex Mud Crab (Scylla serrata), orange Mud Crab (Scylla olivacea)
Information sources
• Commercial logbook catch and effort
• Recreational catch estimates
• Charter catch estimates
• Fishery-independent data (2000–09)
• Performance measures
• Published local biological information
Comments
Commercial catch and catch rate of Mud Crabs in the GOC has been variable over the long term (Figure 20). In recent years (2008–11) total annual catch has been high but within historically sustained levels—potentially resulting from an increase in fishing effort, a larger abundance of legal size males and/or an increase in the catchability of individuals. In 2011, Mud Crab catch in the GOC contributed approximately 12% to the total Queensland catch.
Regional breakdown of the GOC logbook data identifies the GOC South as the high catch region, taking approximately 93% of total GOC catch. Commercial fishers typically only harvest small quantities of Scylla olivacea due to geographical limitations and the fact that this species rarely grows to minimum legal size (15 cm carapace width). Updated recreational harvest estimate from the 2010 Statewide Recreational Fishing Survey was #7000 Mud Crabs from the Gulf region.
Fishery-independent monitoring data collected between 2000 and 2009 indicates that there has been no significant change in the size distributions of Mud Crabs in the GOC (Figure 21). The GOC shows a higher number of males in the larger size classes than the east coast, which may be due to lower fishing pressure in the area. Fishery-independent catch rate has been variable over time, which may reflect environmental factors such as river/freshwater flows or consistency in sampling.
In 2011, new performance measures were used. Both the whole fishery area, and the north region, recorded catch rates above the trigger limits. Fisheries Queensland will continue to monitor catches in 2012.
Future assessment needs
Updated fishery-independent data is now required in order to maintain biological monitoring of the stock.
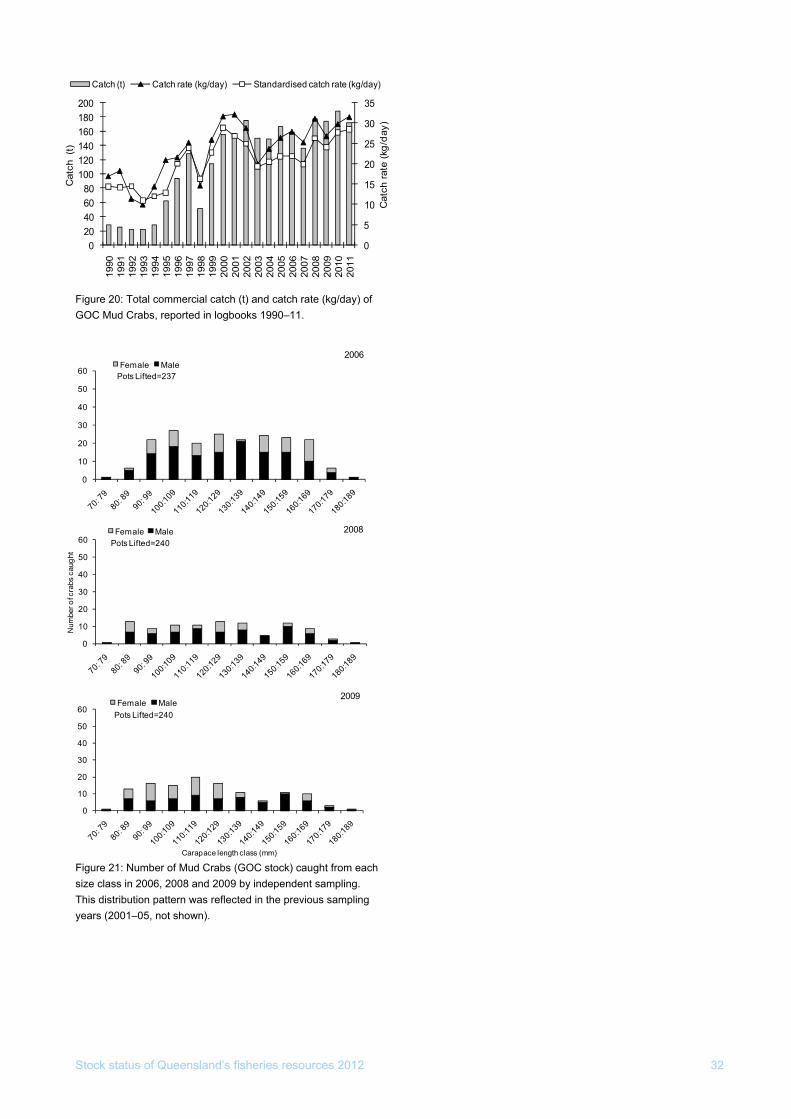
Stock status of Queensland’s fisheries resources 2012 32
0
5
10
15
20
25
30
35
020406080
100120140160180200
1990
1991
1992
1993
1994
1995
1996
1997
1998
1999
2000
2001
2002
2003
2004
2005
2006
2007
2008
2009
2010
2011
Cat
ch ra
te (k
g/da
y)
Cat
ch (
t)Catch (t) Catch rate (kg/day) Standardised catch rate (kg/day)
Figure 20: Total commercial catch (t) and catch rate (kg/day) of GOC Mud Crabs, reported in logbooks 1990–11.
0
10
20
30
40
50
60
Num
ber o
f cra
bs c
augh
t
2008Female MalePots Lifted=240
0
10
20
30
40
50
60
2006Female Male
Pots Lifted=237
0
10
20
30
40
50
60
Carapace length class (mm)
2009Female Male
Pots Lifted=240
Figure 21: Number of Mud Crabs (GOC stock) caught from each size class in 2006, 2008 and 2009 by independent sampling. This distribution pattern was reflected in the previous sampling years (2001–05, not shown).
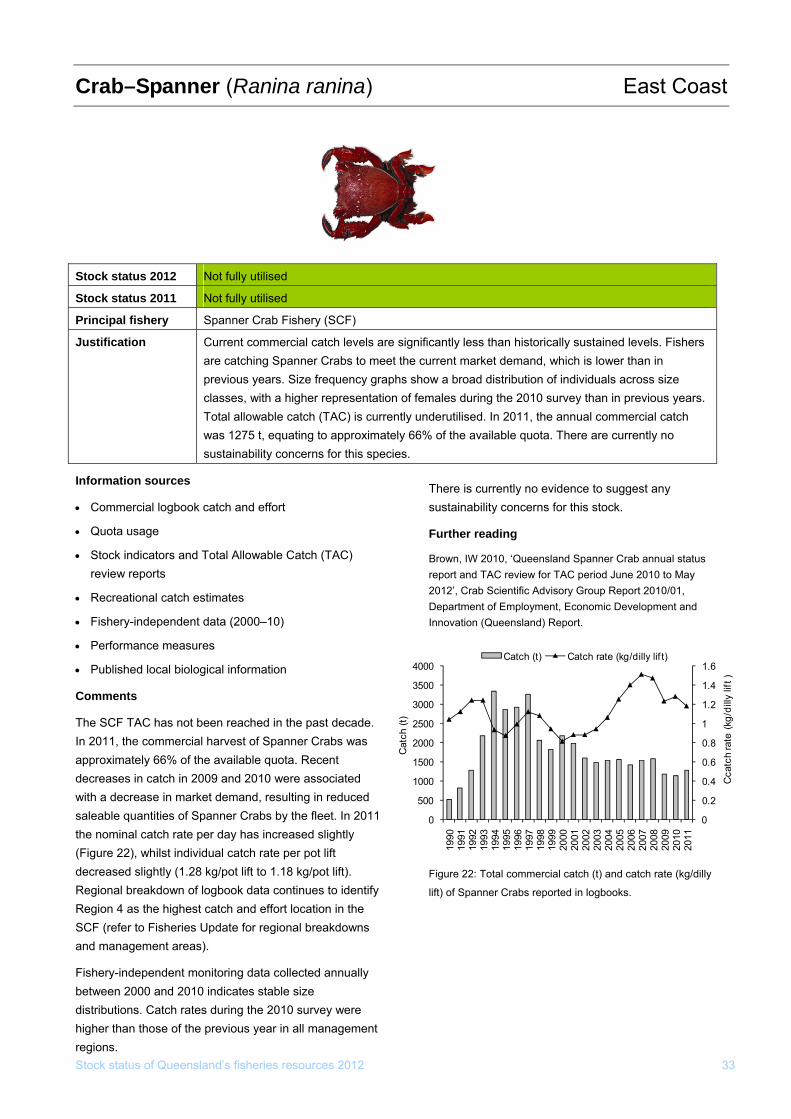
Crab–Spanner (Ranina ranina) East Coast
Stock status 2012 Not fully utilised
Stock status 2011 Not fully utilised
Principal fishery Spanner Crab Fishery (SCF)
Justification Current commercial catch levels are significantly less than historically sustained levels. Fishers are catching Spanner Crabs to meet the current market demand, which is lower than in previous years. Size frequency graphs show a broad distribution of individuals across size classes, with a higher representation of females during the 2010 survey than in previous years. Total allowable catch (TAC) is currently underutilised. In 2011, the annual commercial catch was 1275 t, equating to approximately 66% of the available quota. There are currently no sustainability concerns for this species.
Information sources
• Commercial logbook catch and effort
• Quota usage
• Stock indicators and Total Allowable Catch (TAC) review reports
• Recreational catch estimates
• Fishery-independent data (2000–10)
• Performance measures
• Published local biological information
Comments
The SCF TAC has not been reached in the past decade. In 2011, the commercial harvest of Spanner Crabs was approximately 66% of the available quota. Recent decreases in catch in 2009 and 2010 were associated with a decrease in market demand, resulting in reduced saleable quantities of Spanner Crabs by the fleet. In 2011 the nominal catch rate per day has increased slightly (Figure 22), whilst individual catch rate per pot lift decreased slightly (1.28 kg/pot lift to 1.18 kg/pot lift). Regional breakdown of logbook data continues to identify Region 4 as the highest catch and effort location in the SCF (refer to Fisheries Update for regional breakdowns and management areas).
Fishery-independent monitoring data collected annually between 2000 and 2010 indicates stable size distributions. Catch rates during the 2010 survey were higher than those of the previous year in all management regions.
There is currently no evidence to suggest any sustainability concerns for this stock.
Further reading
Brown, IW 2010, ‘Queensland Spanner Crab annual status report and TAC review for TAC period June 2010 to May 2012’, Crab Scientific Advisory Group Report 2010/01, Department of Employment, Economic Development and Innovation (Queensland) Report.
Stock status of Queensland’s fisheries resources 2012 33
Figure 22: Total commercial catch (t) and catch rate (kg/dilly
lift) of Spanner Crabs reported in logbooks.
0
0.2
4
0.6
0.8
1
1.2
1.4
1.6
50
100
150
2000
250
300
3500
4000
20 20 20 20 20 20 20 20 20
Cca
tch
rate
(kg
/dill
y lif
t )
Cat
ch (t
)
0.
0
0
0
1990
1991
1992
1993
1994
1995
1996
1997
1998
1999
2000
2001
2002 03 04 05 06 07 08 09 10 11
0
0
0
Catch (t) Catch rate (kg/dilly lif t)
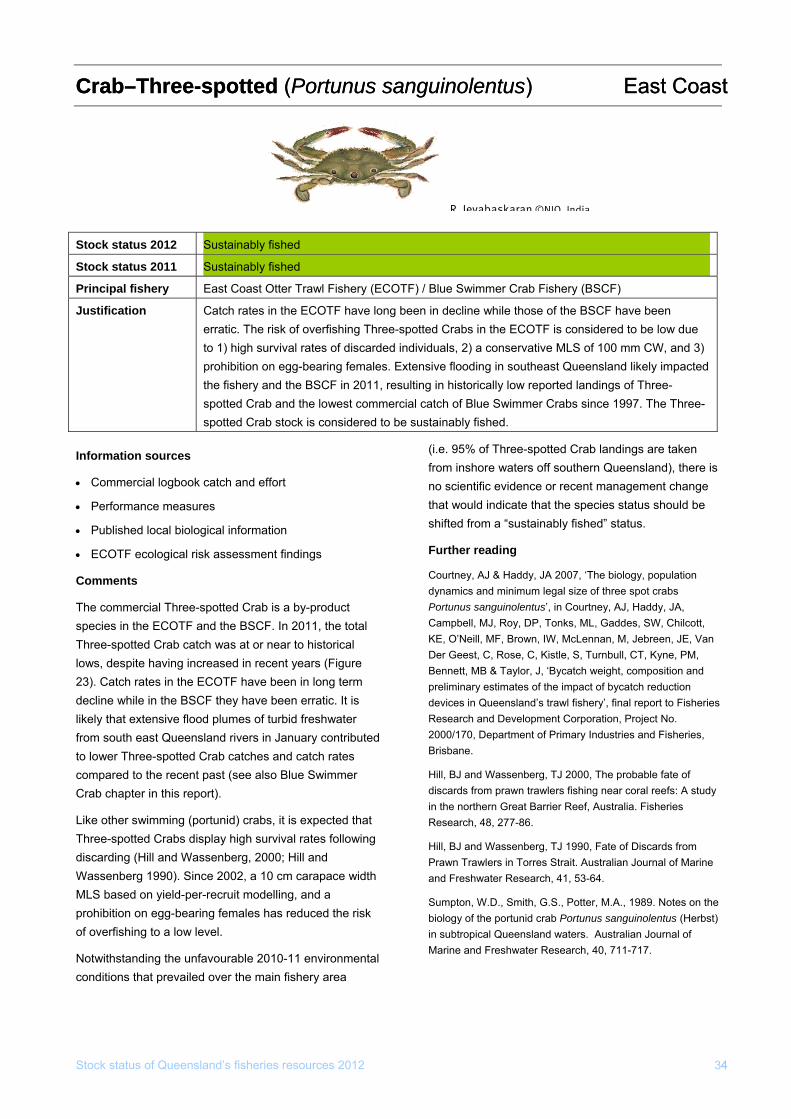
Stock status of Queensland’s fisheries resources 2012 34
) East Coast
4
) East Coast Crab–Three-spotted (Portunus sanguinolentusCrab–Three-spotted (Portunus sanguinolentus
R Jeyabaskaran ©NIO India Stock status 2012 Sustainably fished
Stock status 2011 Sustainably fished
Principal fishery East Coast Otter Trawl Fishery (ECOTF) / Blue Swimmer Crab Fishery (BSCF)
Justification Catch rates in the ECOTF have long been in decline while those of the BSCF have been erratic. The risk of overfishing Three-spotted Crabs in the ECOTF is considered to be low due to 1) high survival rates of discarded individuals, 2) a conservative MLS of 100 mm CW, and 3) prohibition on egg-bearing females. Extensive flooding in southeast Queensland likely impacted the fishery and the BSCF in 2011, resulting in historically low reported landings of Three-spotted Crab and the lowest commercial catch of Blue Swimmer Crabs since 1997. The Three-spotted Crab stock is considered to be sustainably fished.
Information sources
• Commercial logbook catch and effort
• Performance measures
• Published local biological information
• ECOTF ecological risk assessment findings
Comments
The commercial Three-spotted Crab is a by-product species in the ECOTF and the BSCF. In 2011, the total Three-spotted Crab catch was at or near to historical lows, despite having increased in recent years (Figure 23). Catch rates in the ECOTF have been in long term decline while in the BSCF they have been erratic. It is likely that extensive flood plumes of turbid freshwater from south east Queensland rivers in January contributed to lower Three-spotted Crab catches and catch rates compared to the recent past (see also Blue Swimmer Crab chapter in this report).
Like other swimming (portunid) crabs, it is expected that Three-spotted Crabs display high survival rates following discarding (Hill and Wassenberg, 2000; Hill and Wassenberg 1990). Since 2002, a 10 cm carapace width MLS based on yield-per-recruit modelling, and a prohibition on egg-bearing females has reduced the risk of overfishing to a low level.
Notwithstanding the unfavourable 2010-11 environmental conditions that prevailed over the main fishery area
(i.e. 95% of Three-spotted Crab landings are taken from inshore waters off southern Queensland), there is no scientific evidence or recent management change that would indicate that the species status should be shifted from a “sustainably fished” status.
Further reading
Courtney, AJ & Haddy, JA 2007, ‘The biology, population dynamics and minimum legal size of three spot crabs Portunus sanguinolentus’, in Courtney, AJ, Haddy, JA, Campbell, MJ, Roy, DP, Tonks, ML, Gaddes, SW, Chilcott, KE, O’Neill, MF, Brown, IW, McLennan, M, Jebreen, JE, Van Der Geest, C, Rose, C, Kistle, S, Turnbull, CT, Kyne, PM, Bennett, MB & Taylor, J, ‘Bycatch weight, composition and preliminary estimates of the impact of bycatch reduction devices in Queensland’s trawl fishery’, final report to Fisheries Research and Development Corporation, Project No. 2000/170, Department of Primary Industries and Fisheries, Brisbane.
Hill, BJ and Wassenberg, TJ 2000, The probable fate of discards from prawn trawlers fishing near coral reefs: A study in the northern Great Barrier Reef, Australia. Fisheries Research, 48, 277-86.
Hill, BJ and Wassenberg, TJ 1990, Fate of Discards from Prawn Trawlers in Torres Strait. Australian Journal of Marine and Freshwater Research, 41, 53-64.
Sumpton, W.D., Smith, G.S., Potter, M.A., 1989. Notes on the biology of the portunid crab Portunus sanguinolentus (Herbst) in subtropical Queensland waters. Australian Journal of Marine and Freshwater Research, 40, 711-717.
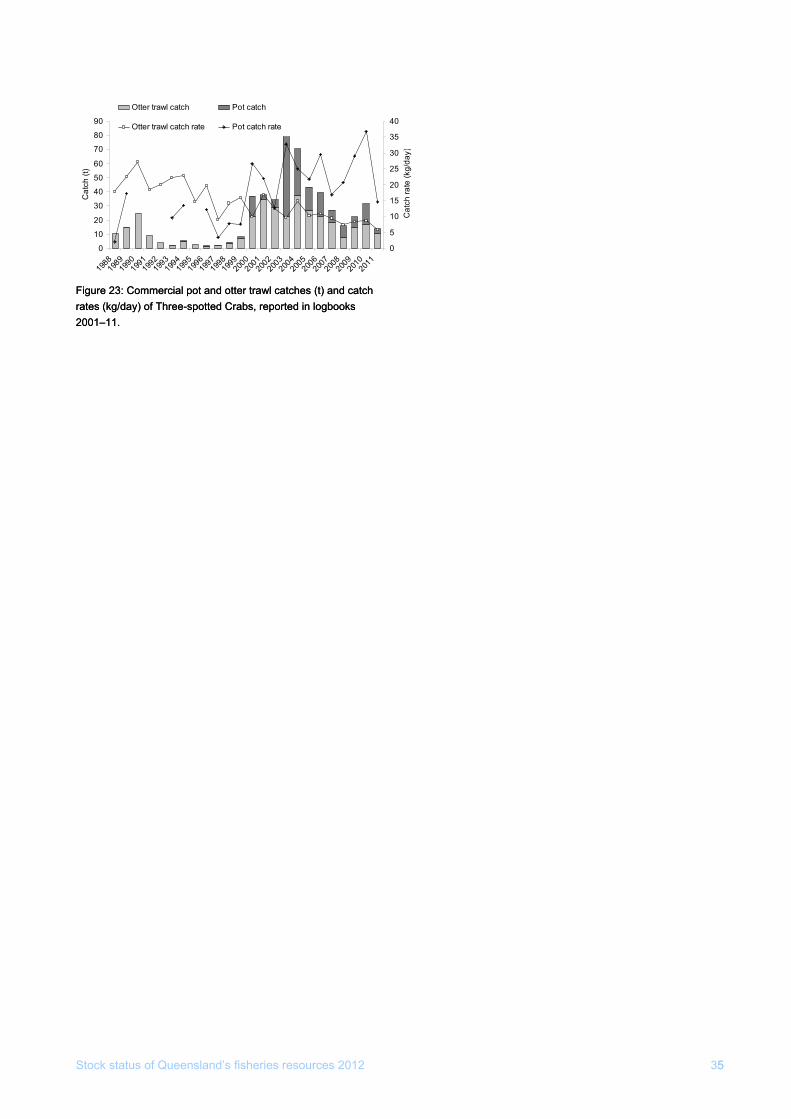
Stock status of Queensland’s fisheries resources 2012 355
Figure 23: Figure 23: ComCommmerciaercial pol pot and ot and otter tratter trawwl catchesl catches (t) and catch (t) and catch rates (kg/darates (kg/day) ofy) of ThreeThree--spspotted Cotted Crrabs, reporteabs, reported in logbooks d in logbooks 2001–11. 2001–11.
0
10
1988
1989
1990
1991
1992
1993
1994
1995 99
719
9819
920
020
0120
0220
0320
0420
0520
20
30
40
50
60
70
80
90
1996
19 0 06
2007
2008
2009
2010
2011
Cat
ch (t
)
0
5
10
15
20
25
30
35
40
Cat
ch ra
te (k
g/da
y
Otter trawl catch Pot catch
Otter trawl catch rate Pot catch rate
)
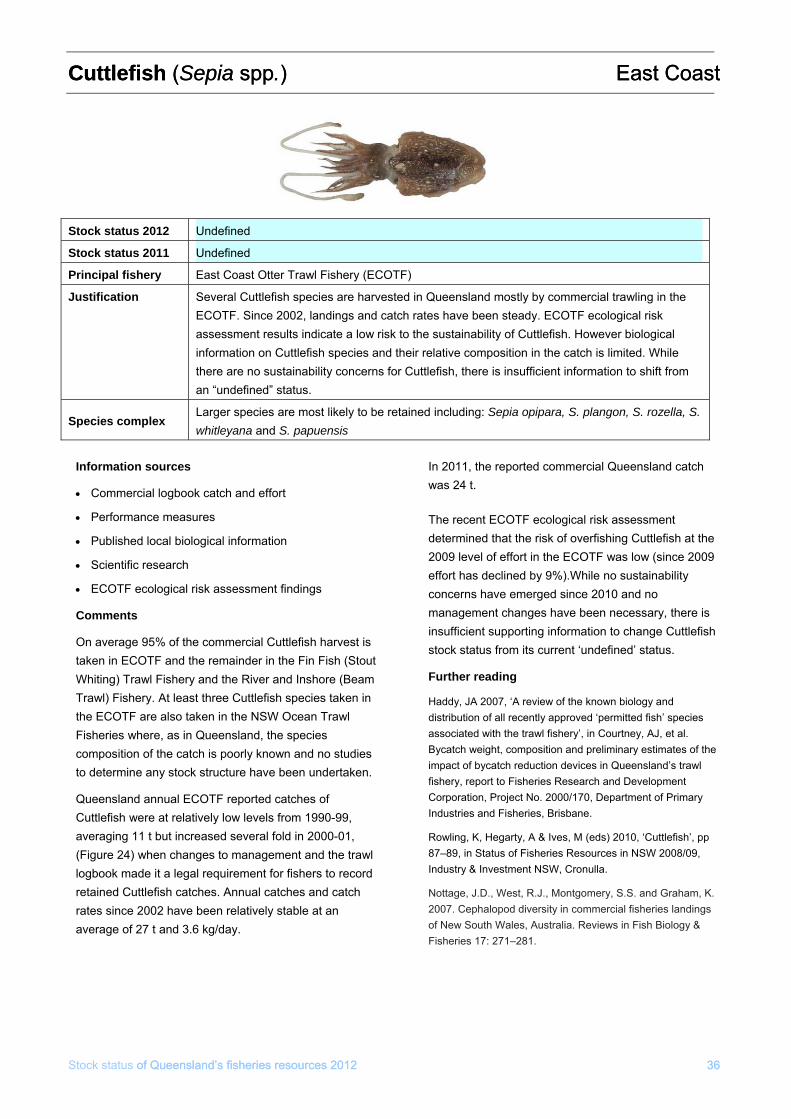
Stock status of Queensland’s fisheries resources 2012 36
Cuttlefish Cuttlefish ((Sepia Sepia sppspp..) East) East CoastCoast
of Queensland’s fisheries resources 2012 36
Stock status 2012 Undefined
Stock status 2011 Undefined
Principal fishery East Coast Otter Trawl Fishery (ECOTF)
Justification ested in Queensland mostly by commercial trawling in the Several Cuttlefish species are harvnd catch rates have been steady. ECOTFECOTF. Since 2002, landings a ecological risk
assessment results indicate a low risk to the sustainability of Cuttlefish. However biological information on Cuttlefish species and their relative composition in the catch is limited. While there are no sustainability concerns for Cuttlefish, there is insufficient information to shift from an “undefined” status.
Species complex Larger species are most likely to be retained including: Sepia opipara, whitleyana and S. papuensis
S. plangon, S. rozella, S.
Information sources In 2011, the reported commercial Queensland catch
was 24 t. • Commercial logbook catch and effort
• Performance measures The recent ECOTF ecological risk assessment
• Published local biological information determined that the risk of overfishing Cuttlefish at the 2009 level of effort in the ECOTF was low (since 2009
• Scientific research effort has declined by 9%).While no sustainability
• ECOTF ecological risk assessment findings concerns have emerged since 2010 and no
Comments management changes have been necessary, there is insufficient supporting information to change Cuttlefish
On average 95% of the commercial Cuttlefish harvest is stock status from its current ‘undefined’ status. taken in ECOTF and the remainder in the Fin Fish (Stout Whiting) Trawl Fishery and the River and Inshore (Beam Further reading
Trawl) Fishery. At least three Cuttlefish species taken in Haddy, JA 2007, ‘A review of the known biology and the ECOTF are also taken in the NSW Ocean Trawl distribution of all recently approved ‘permitted fish’ species
Fisheries where, as in Queensland, the species associated with the trawl fishery’, in Courtney, AJ, et al.
composition of the catch is poorly known and no studies Bycatch weight, composition and preliminary estimates of the impact of bycatch reduction devices in Queensland’s trawl to determine any stock structure have been undertaken. fishery, report to Fisheries Research and Development
Queensland annual ECOTF reported catches of Corporation, Project No. 2000/170, Department of Primary
Cuttlefish were at relatively low levels from 1990-99, Industries and Fisheries, Brisbane.
averaging 11 t but increased several fold in 2000-01, Rowling, K, Hegarty, A & Ives, M (eds) 2010, ‘Cuttlefish’, pp
(Figure 24) when changes to management and the trawl 87–89, in Status of Fisheries Resources in NSW 2008/09,
logbook made it a legal requirement for fishers to record Industry & Investment NSW, Cronulla.
retained Cuttlefish catches. Annual catches and catch Nottage, J.D., West, R.J., Montgomery, S.S. and Graham, K.
rates since 2002 have been relatively stable at an 2007. Cephalopod diversity in commercial fisheries landings
average of 27 t and 3.6 kg/day. of New South Wales, Australia. Reviews in Fish Biology & Fisheries 17: 271–281.
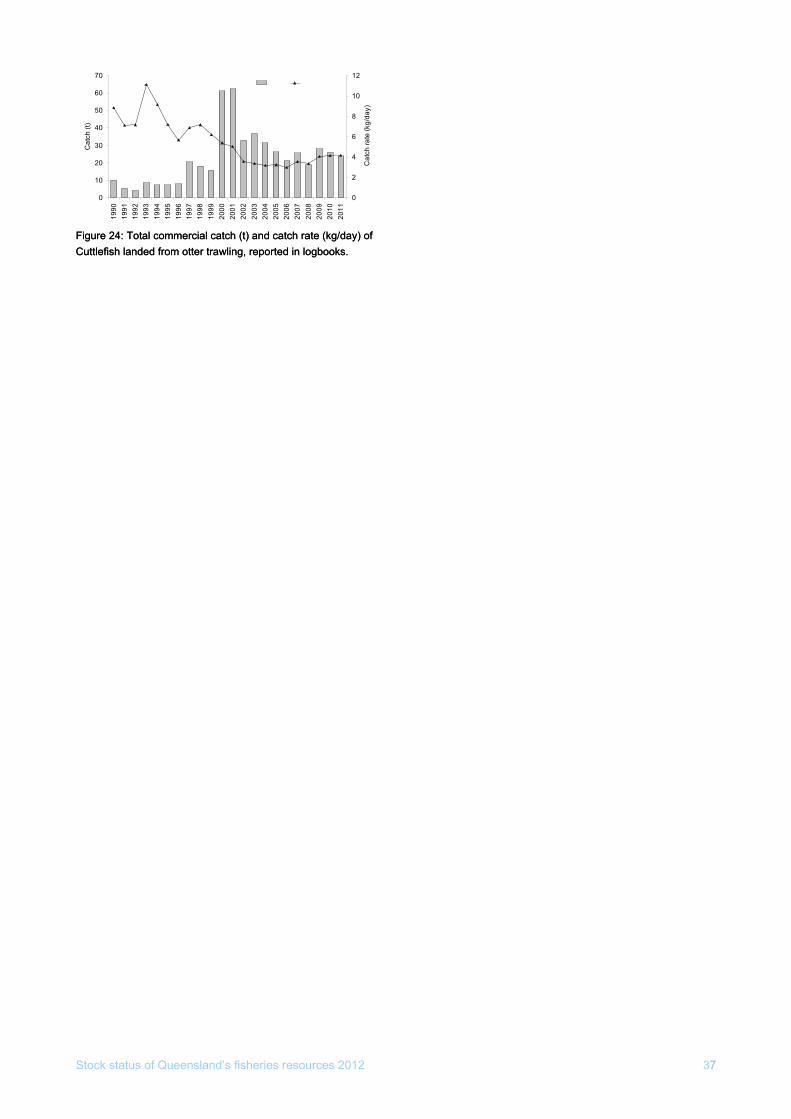
er nd catch rate (kg/day) of ott ported in logbooks. er nd catch rate (kg/day) of
ott ported in logbooks. Figure 24: Total commFigure 24: Total comm cial catch (t) acial catch (t) aCuttlefish landed fromCuttlefish landed from er trawling, reer trawling, re
70 12Catch Catch rate
0
10
20
30
40
50
60
1990
1991
1992
1993
1994
1995
1996
1997
1998
1999
2000
2001
2002
2003
2004
2005
2006
2007
2008
2009
2010
2011
Cat
ch (t
)
0
2
4
6
8
10
Cat
ch ra
te (k
g/da
y)
Stock status of Queensland’s fisheries resources 2012 377
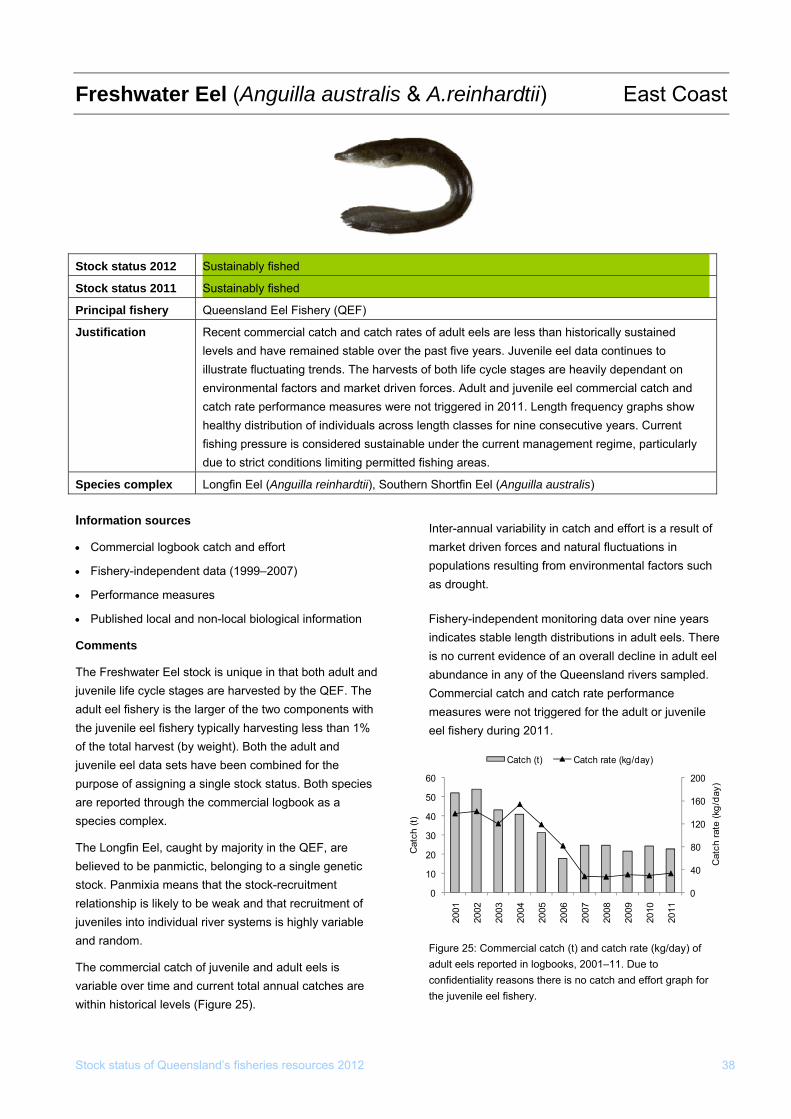
Freshwater Eel (Anguilla australis & A.reinhardtii) East Coast
Stock status of Queensland’s fisheries resources 2012 38
Stock status 2012 Sustainably fished
Stock status 2011 Sustainably fished
Principal fishery Queensland Eel Fishery (QEF)
Justification Recent commercial catch and catch rates of adult eels are less than historically sustained levels and have remained stable over the past five years. Juvenile eel data continues to illustrate fluctuating trends. The harvests of both life cycle stages are heavily dependant on environmental factors and market driven forces. Adult and juvenile eel commercial catch and catch rate performance measures were not triggered in 2011. Length frequency graphs show healthy distribution of individuals across length classes for nine consecutive years. Current fishing pressure is considered sustainable under the current management regime, particularly due to strict conditions limiting permitted fishing areas.
Species complex Longfin Eel (Anguilla reinhardtii), Southern Shortfin Eel (Anguilla australis) Information sources
• Commercial logbook catch and effort
• Fishery-independent data (1999–2007)
• Performance measures
• Published local and non-local biological information
Comments
The Freshwater Eel stock is unique in that both adult andjuvenile life cycle stages are harvested by the QEF. The adult eel fishery is the larger of the two components with the juvenile eel fishery typically harvesting less than 1% of the total harvest (by weight). Both the adult and juvenile eel data sets have been combined for the purpose of assigning a single stock status. Both species are reported through the commercial logbook as a species complex.
The Longfin Eel, caught by majority in the QEF, are believed to be panmictic, belonging to a single genetic stock. Panmixia means that the stock-recruitment relationship is likely to be weak and that recruitment of juveniles into individual river systems is highly variable and random.
The commercial catch of juvenile and adult eels is variable over time and current total annual catches are within historical levels (Figure 25).
Inter-annual variability in catch and effort is a result of market driven forces and natural fluctuations in populations resulting from environmental factors such as drought.
Fishery-independent monitoring data over nine years indicates stable length distributions in adult eels. Theris no current evidence of an overall decline in adult eelabundance in any of the Queensland rivers sampled. Commercial catch and catch rate performance measures were not triggered for the adult or juvenile eel fishery during 2011.
e
Figure 25: Commercial catch (t) and catch rate (kg/day) of adult eels reported in logbooks, 2001–11. Due to confidentiality reasons there is no catch and effort graph for the juvenile eel fishery.
Catch (t) Catch rate (kg/day)
0
40
80
120
160
200
0
10
20
30
40
50
60
2001
2002
2003
2004
2005
2006
2007
2008
2009
2010
2011
Cat
ch ra
te (k
g/da
y)
Cat
ch (t
)

Emperor–Grass (Lethrinus laticaudis) East Coast
Stock status 2012 Undefined
Stock status 2011 Undefined
Principal fishery Rocky Reef Fin Fish Fishery (RRFFF) / Recreational
Justification Since quota was introduced to the reef linEmperor have increased from appr
e fishery in 2004, commercial catches of Grass oximately 3 t per year to around 20 t per year. This species
te’s on
is considered a key species for some fishers. Commercial harvest occurs more in the stanorth, whereas recreational harvest occurs more in the south. No biological informationage or length frequencies is available; however there are currently no sustainability concerns. Catch trends are monitored through the Performance Measurement System for the fishery.
Information sources
• Commercial logbook
• Recreational catch e
catc
es
ef Fin Fish
05 logbook was introduced to
from approximately 3 t per year to approximately 15–20 t per year (Figure 26). Charter
ore in or is
st estimates for the species from the 2010 Statewide Recreational Fishing Survey was around
nce measurement system and the annual
(t) and catch rate (kg/day) of Grass Emperor reported in logbooks, 1994–2011.
catch
stimates
Future assessment needs
Grass Emperor will continue to be monitored throughthe performa
• Charter logbook h stock status process.
• Performance measur
Comments
Stock status of Queensland’s fisheries resources 2012 39
Since quota was introduced in the Coral ReFishery (CRFFF) in 2004, targeting of non-quota species has increased. Since the LFthe fishery in 2007, reporting of Grass Emperor harvesthas increased
catches in 2011 were around 4 t. Grass Emperor is considered to be a key species for some fishers. Since 2007, commercial and charter spatial harvest has alternated between the north and south of the state, whereas recreational harvest consistently occurs mthe south. The minimum legal size for Grass Emper30 cm with a bag limit of 10 fish for recreational fishers.
Recreational harve
#27 000 fish. There are currently no sustainability concerns for the stock.
Figure 26: Commercial catch
0
5
10
0
5
10
1994
1995
1996
1997
1998
1999
2000
2001
2002
2003
2004
2005
2006
2007
2008
2009
2010
20
Ca
1515
11
tch
rate
(kg/
day)
Cat
ch (t
)
20
25
20
25
30Catch (t) Catch rate (kg/day)
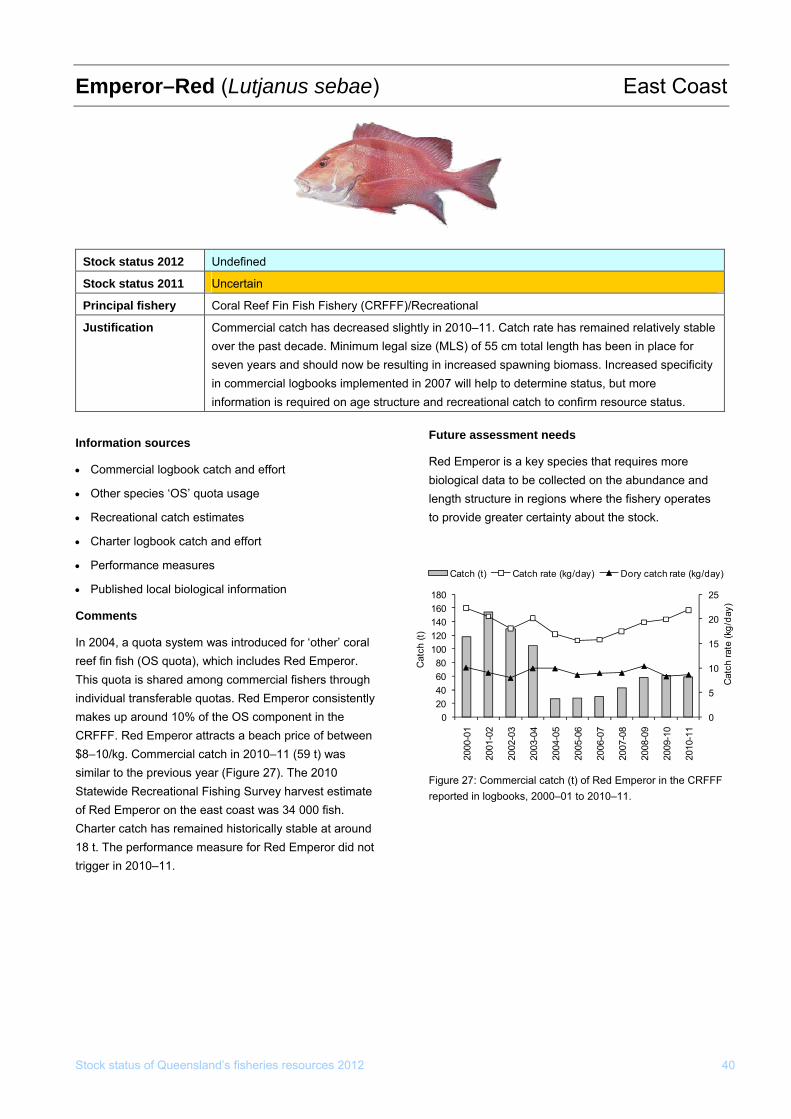
Stock status of Queensland’s fisheries resources 2012 40
Emperor–Red (Lutjanus sebae) East Coast
Stock status 2012 Undefined
Stock status 2011 Uncertain
Principal fishery Coral Reef Fin Fish Fishery (CRFFF)/Recreational
Justification Cos ity ii
ommercial catch has decreased slightly in 2010–11. Catch rate has remained relatively stable ver the past decade. Minimum legal size (MLS) of 55 cm total length has been in place for even years and should now be resulting in increased spawning biomass. Increased specificn commercial logbooks implemented in 2007 will help to determine status, but more nformation is required on age structure and recreational catch to confirm resource status.
Information sources
• Commercial logbook catch and effort
• Other species ‘OS’ quota usage
ates
book catch and effort
coral . gh
en
llected on the abundance and length structure in regions where the fishery operates to provide greater certainty about the stock.
Figure 27: Commercial catch (t) of Red Emperor in the CRFFF reported in logbooks, 2000–01 to 2010–11.
• Recreational catch estim
• Charter log
• Performance measures
• Published local biological information
Comments
In 2004, a quota system was introduced for ‘other’reef fin fish (OS quota), which includes Red EmperorThis quota is shared among commercial fishers throuindividual transferable quotas. Red Emperor consistentlymakes up around 10% of the OS component in theCRFFF. Red Emperor attracts a beach price of betwe$8–10/kg. Commercial catch in 2010–11 (59 t) was similar to the previous year (Figure 27). The 2010 Statewide Recreational Fishing Survey harvest estimate of Red Emperor on the east coast was 34 000 fish. Charter catch has remained historically stable at around 18 t. The performance measure for Red Emperor did not trigger in 2010–11.
Future assessment needs
Red Emperor is a key species that requires more biological data to be co
Catch (t) Catch rate (kg/day) Dory catch rate (kg/day)
0
5
10
15
20
25
020406080
100120140160180
Cat
ch ra
te (k
g/da
y)
Cat
ch (t
)
2000
-01
2001
-02
2002
-03
2003
-04
2004
-05
2005
-06
2006
-07
2007
-08
2008
-09
2009
-10
2010
-11
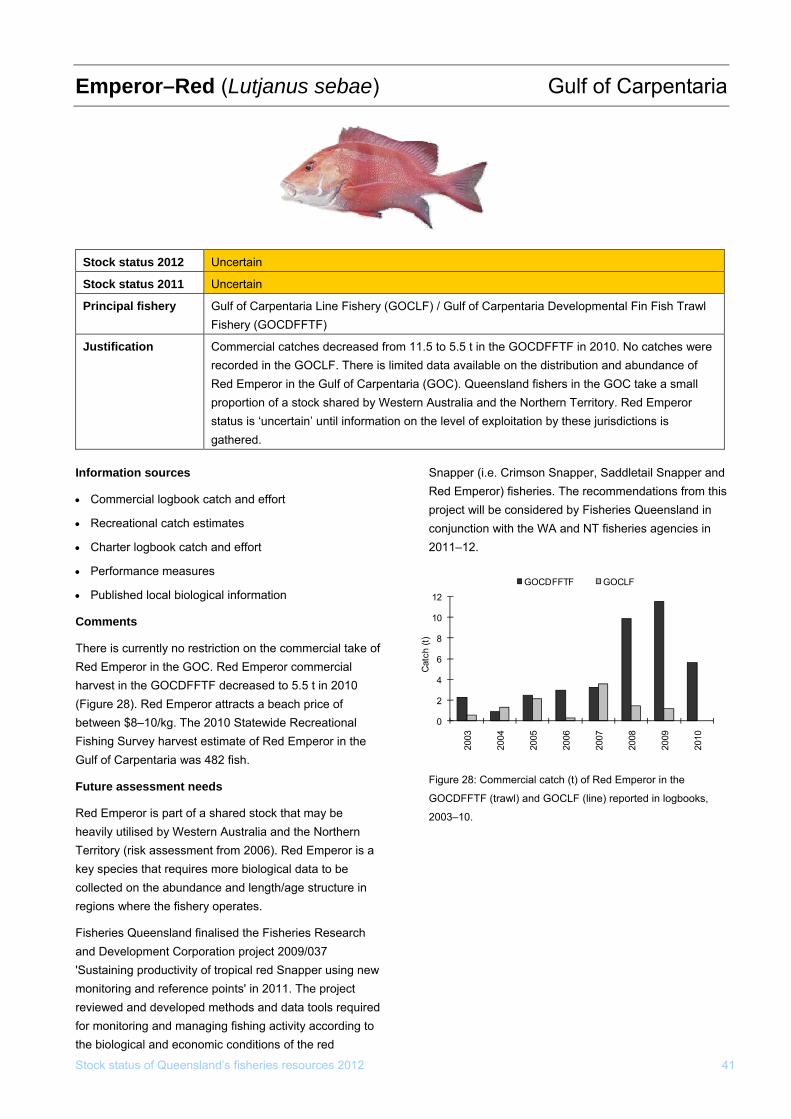
Stock status of Queensland’s fisheries resources 2012 41
Gulf of CEmperor–Red (Lutjanus sebae) arpentaria
Stock status 2012 Uncertain
Stock status 2011 Uncertain
Principal fishery Gulf of Carpentaria Line Fishery (GOCLF) / Gulf of Carpentaria Developmental Fin Fish Trawl Fishery (GOCDFFTF)
Justification re
small
status is ‘uncertain’ until information on the level of exploitation by these jurisdictions is gathered.
Commercial catches decreased from 11.5 to 5.5 t in the GOCDFFTF in 2010. No catches werecorded in the GOCLF. There is limited data available on the distribution and abundance of Red Emperor in the Gulf of Carpentaria (GOC). Queensland fishers in the GOC take aproportion of a stock shared by Western Australia and the Northern Territory. Red Emperor
d
es in 011–12.
d in logbooks,
2003–10.
Information sources
• Commercial logbook catch and effort
• Recreational catch estimates
• Charter logbook catch and effort
• Performance measures
• Published local biological information
Comments
There is currently no restriction on the commercial take of Red Emperor in the GOC. Red Emperor commercial harvest in the GOCDFFTF decreased to 5.5 t in 2010 (Figure 28). Red Emperor attracts a beach price of between $8–10/kg. The 2010 Statewide Recreational Fishing Survey harvest estimate of Red Emperor in the Gulf of Carpentaria was 482 fish.
Future assessment needs
Red Emperor is part of a shared stock that may be heavily utilised by Western Australia and the Northern Territory (risk assessment from 2006). Red Emperor is a key species that requires more biological data to be collected on the abundance and length/age structure in regions where the fishery operates.
Fisheries Queensland finalised the Fisheries Research and Development Corporation project 2009/037 'Sustaining productivity of tropical red Snapper using new monitoring and reference points' in 2011. The project reviewed and developed methods and data tools required for monitoring and managing fishing activity according to the biological and economic conditions of the red
Snapper (i.e. Crimson Snapper, Saddletail Snapper anRed Emperor) fisheries. The recommendations from this project will be considered by Fisheries Queensland in conjunction with the WA and NT fisheries agenci2
GOCDFFTF GOCLF
0
2
4
6
8
10
12
2003
2004
2005
2006
2007
2008
2009
2010
Cat
ch (t
)
Figure 28: Commercial catch (t) of Red Emperor in the
GOCDFFTF (trawl) and GOCLF (line) reporte
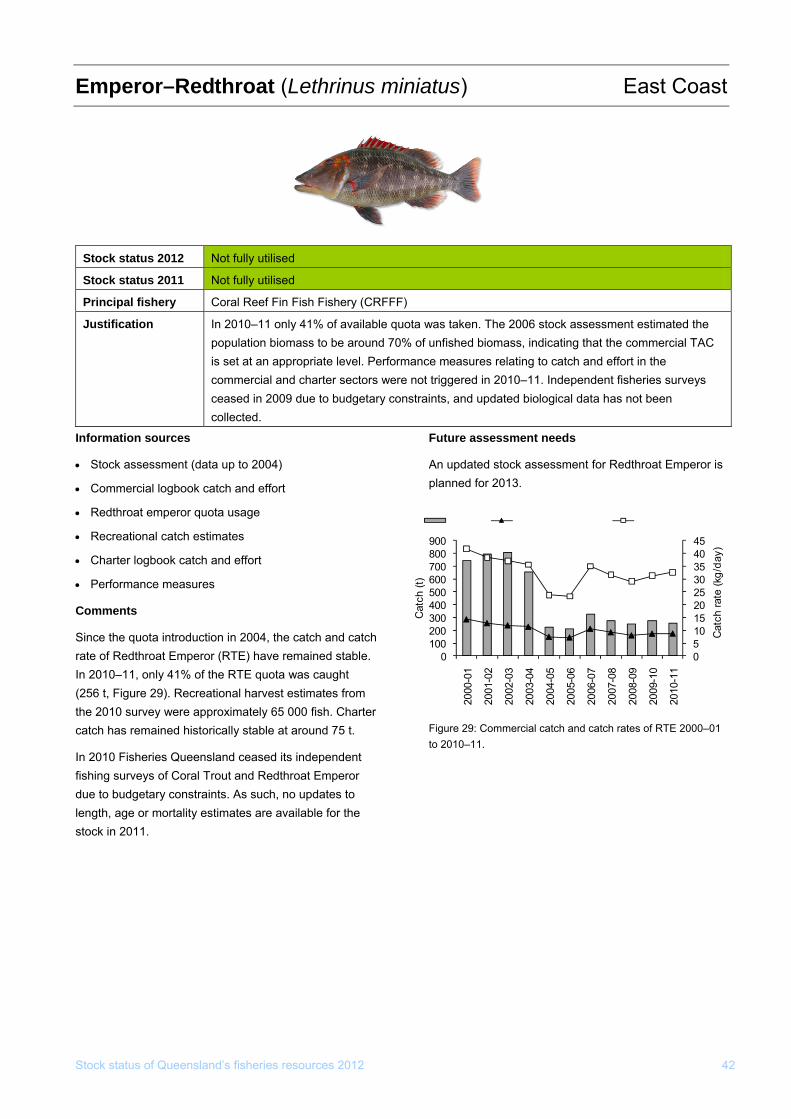
Stock status of Queensland’s fisheries resources 2012 42
iniatus) Emperor–Redthroat (Lethrinus m East Coast
Stock status 2012 Not fully utilised
Stock status 2011 Not fully utilised
Principal fishery Coral Reef Fin Fish Fishery (CRFFF)
Justification f available quota was taken. The 2006 stock assessment estimated the In 2010–11 only 41% opopulation biomass to be around 70% of unfished biomass, indicating that the commercial TAC is set at an appropriate level. Performance measures relating to catch and effort in the commercial and charter sectors were not triggered in 2010–11. Independent fisheries surveys ceased in 2009 due to budgetary constraints, and updated biological data has not been collected.
Information sources
• Stock assessment (data up to 2004)
• Commercial logbook catch and effort
• Redthroat emperor quota usage
• Recreational catch estimates
• Charter logbook catch and effort
• Performance measures
Comments
Since the quota introduction in 2004, the catch and catch rate of Redthroat Emperor (RTE) have remained stable. In 2010–11, only 41% of the RTE quota was caught (256 t, Figure 29). Recreational harvest estimates from the 2010 survey were approximately 65 000 fish. Charter catch has remained historically stable at around 75 t.
In 2010 Fisheries Queensland ceased its independent fishing surveys of Coral Trout and Redthroat Emperor due to budgetary constraints. As such, no updates to length, age or mortality estimates are available for the stock in 2011.
Future assessment needs
An updated stock assessment for Redthroat Emperor is planned for 2013.
Figure 29: Commercial catch and catch rates of RTE 2000–01 to 2010–11.
Weight (t) Dory catch rate (kg/day) Catch rate (kg/day)
051015202530354045
0100200300400500600700
2000
-01
2001
-02
2002
-03
2003
-04
2004
-05
2005
-06
2006
-07
2007
-08
2008
-09
2009
-10
2010
-11
Cat
ch ra
te (k
g/da
y)
Cat
ch (t
)
800900
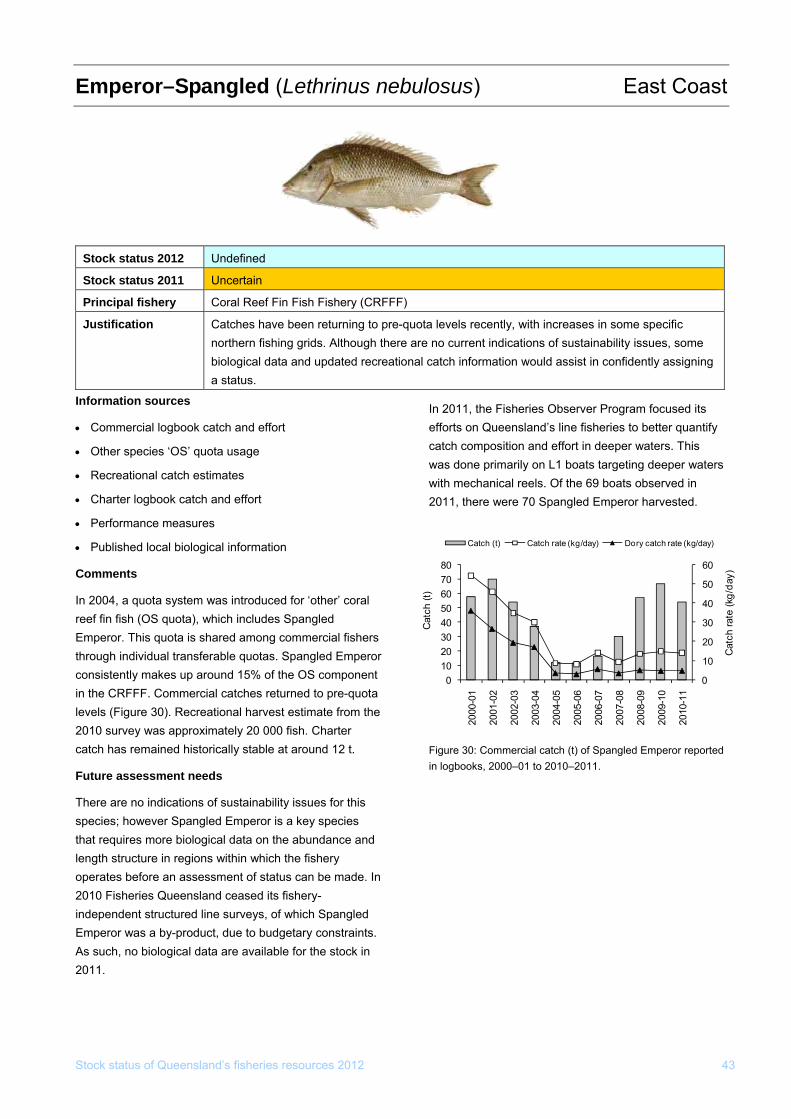
Stock status of Queensland’s fisheries resources 2012 43
Emperor–Spangled (Lethrinus nebulosus) East Coast
Stock status 2012 Undefined
Stock status 2011 Uncertain
Principal fishery Coral Reef Fin Fish Fishery (CRFFF)
Justification Catches have been returning to pre-quota levels recently, with increases in some specific northern fishing grids. Although there are no current indications of sustainability issues, some biological data and updated recreational catch information would assist in confidently asa status.
signing
Information sources
• Commercial logbook catch and effort
• Other species ‘OS’ quota usage
• Recreational catch estimates
• Charter logbook catch and effort
• Performance measures
• Published local biological information
Comments
In 2004, a quota system was introduced for ‘other’ coral reef fin fish (OS quota), which includes Spangled Emperor. This quota is shared among commercial fishers through individual transferable quotas. Spangled Emperor consistently makes up around 15% of the OS component in the CRFFF. Commercial catches returned to pre-quota levels (Figure 30). Recreational harvest estimate from the 2010 survey was approximately 20 000 fish. Charter catch has remained historically stable at around 12 t.
Future assessment needs
There are no indications of sustainability issues for this species; however Spangled Emperor is a key species that requires more biological data on the abundance and length structure in regions within which the fishery operates before an assessment of status can be made. In 2010 Fisheries Queensland ceased its fishery-independent structured line surveys, of which Spangled Emperor was a by-product, due to budgetary constraints. As such, no biological data are available for the stock in 2011.
ed its efforts on Queensland’s line fisheries to better quantify
n deeper waters. This
ls. Of the 69 boats observed in 2011, there were 70 Spangled Emperor harvested.
In 2011, the Fisheries Observer Program focus
catch composition and effort iwas done primarily on L1 boats targeting deeper waters with mechanical ree
0
10
20
30
40
50
60
01020304050607080
2000
-01
2001
-02
2002
-03
2003
-04
2004
-05
2005
-06
2006
-07
2007
-08
2008
-09
2009
-10
2010
-11
Cat
ch (t
)
Cat
ch ra
te (k
g/da
y)
Catch (t) Catch rate (kg/day) Dory catch rate (kg/day)
Figure 30: Commercial catch (t) of Spangled Emperor reported in logbooks, 2000–01 to 2010–2011.
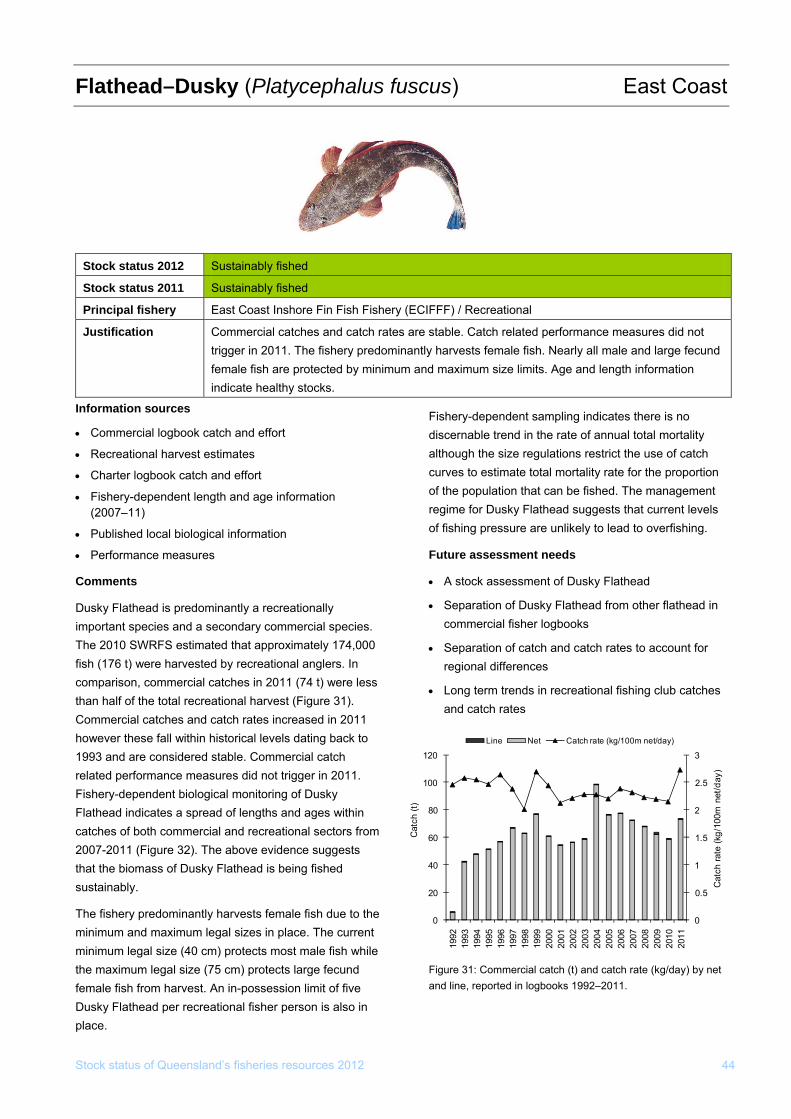
Flathead–Dusky (Platycephalus fuscus) East Coast
Stock status 2012 Sustainably fished
Stock status 2011 Sustainably fished
Principal fishery East Coast Inshore Fin Fish Fishery (ECIFFF) / Recreational
Justification Commercial catches and catch rates are stable. Catch related performance measures did ntrigger in 2011. The fishery predominantly harvests female fish. Nearly all male and large fecunfemale fish are protected by minimum and maximum size limits. Age and length information indicate healthy stocks.
ot d
Information sources
• Commercial logbook catch and effort
nformation
l information
monitoring of Dusky
m
due to the
sh from harvest. An in-possession limit of five Dusky Flathead per recreational fisher person is also in place.
ls of fishing pressure are unlikely to lead to overfishing.
Future assessment needs
• A stock assessment of Dusky Flathead
• Separation of Dusky Flathead from other flathead in commercial fisher logbooks
• Separation of catch and catch rates to account for regional differences
• Long term trends in recreational fishing club catches and catch rates
Figure 31: Commercial catch (t) and catch rate (kg/day) by net and line, reported in logbooks 1992–2011.
• Recreational harvest estimates
• Charter logbook catch and effort
• Fishery-dependent length and age i(2007–11)
• Published local biologica
• Performance measures
Comments
Dusky Flathead is predominantly a recreationally important species and a secondary commercial species. The 2010 SWRFS estimated that approximately 174,000 fish (176 t) were harvested by recreational anglers. In comparison, commercial catches in 2011 (74 t) were less than half of the total recreational harvest (Figure 31). Commercial catches and catch rates increased in 2011 however these fall within historical levels dating back to 1993 and are considered stable. Commercial catch related performance measures did not trigger in 2011.
Stock status of Queensland’s fisheries resources 2012 44
Fishery-dependent biological Flathead indicates a spread of lengths and ages within catches of both commercial and recreational sectors fro2007-2011 (Figure 32). The above evidence suggests that the biomass of Dusky Flathead is being fished sustainably.
The fishery predominantly harvests female fish minimum and maximum legal sizes in place. The currentminimum legal size (40 cm) protects most male fish while the maximum legal size (75 cm) protects large fecund female fi
Fishery-dependent sampling indicates there is no discernable trend in the rate of annual total mortality although the size regulations restrict the use of catch curves to estimate total mortality rate for the proportion of the population that can be fished. The management regime for Dusky Flathead suggests that current leve
Line Net Catch rate (kg/100m net/day)
0
0.5
1
1.5
2
0
20
40
60
80
1
1
1992
1993
1994
1995
1996
1997
1998
1999
2000
2001
2002
2003
2004
2005
2006
2007
2008
2009
2010
2011
Cat
ch ra
te (k
g/10
0m n
et/
Cat
ch (t
)
2.500 day)
320
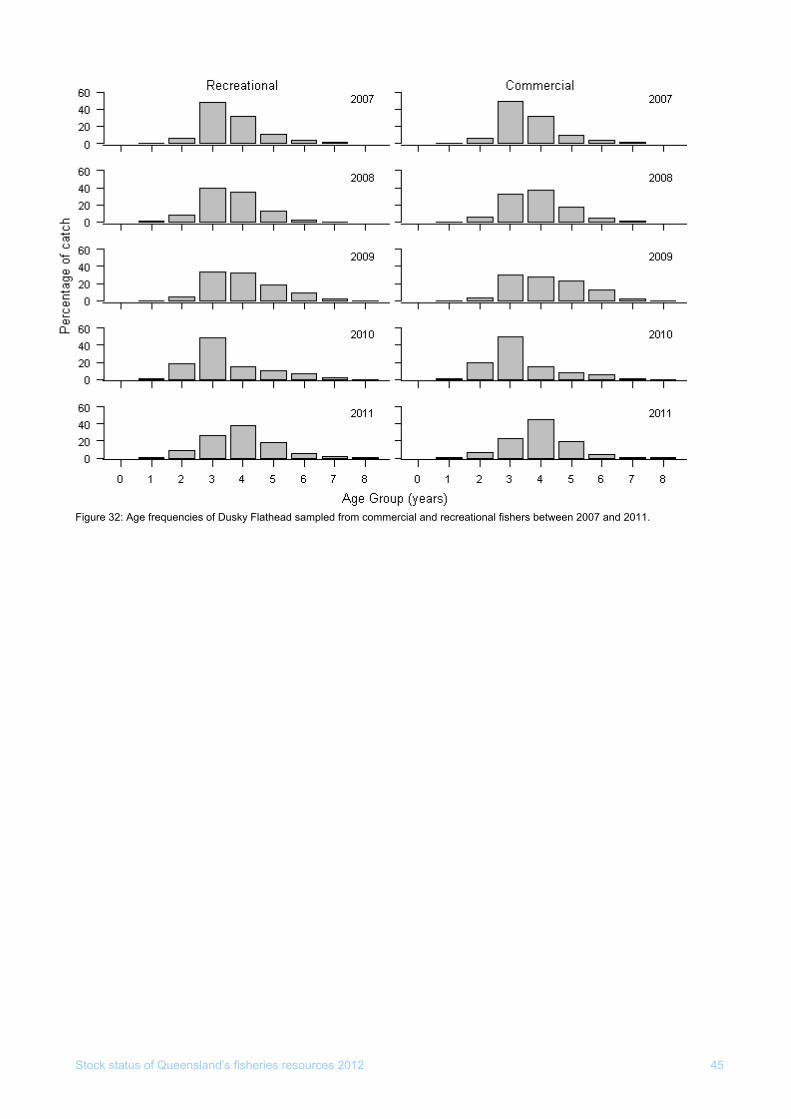
Stock status of Queensland’s fisheries resources 2012 45
requencies of Dusky Flathead sampled from commercial aFigure 32: Age f nd recreational fishers between 2007 and 2011.
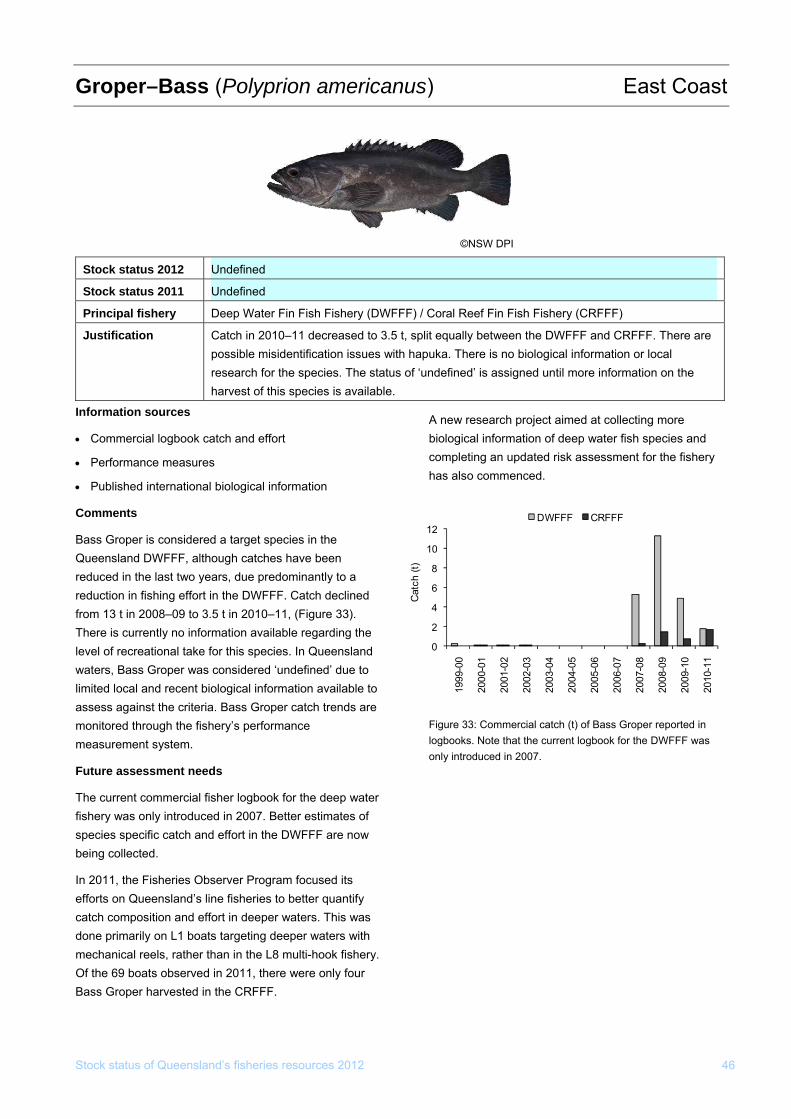
Groper–Bass (Polyprion americanus
Stock status of Queensland’s fisheries resources 2012 46
) East Coast
©NSW DPI
Stock status 2012 Undefined
Stock status 2011 Undefined
Principal fishery Deep Water Fin Fish Fishery (DWFFF) / Coral Reef Fin Fish Fishery (CRFFF)
Justification Catch in 2010–11 decreased to 3.5 t, split equally between the DWFFF and CRFFF. There are possible misidentification issues with hapuka. There is no biological information or local research for the species. The status of ‘undefined’ is assigned until more information on the harvest of this species is available.
Information sources
• Commercial logbook catch and effort
• Performance measures
• Published international biological information
Comments
Bass Groper is considered a target species in the Queensland DWFFF, although catches have been reduced in the last two years, due predominantly to a reduction in fishing effort in the DWFFF. Catch declined from 13 t in 2008–09 to 3.5 t in 2010–11, (Figure 33). There is currently no information available regarding the level of recreational take for this species. In Queensland waters, Bass Groper was considered ‘undefined’ due to limited local and recent biological information available to assess against the criteria. Bass Groper catch trends are monitored through the fishery’s performance measurement system.
Future assessment needs
The current commercial fisher logbook for the deep water fishery was only introduced in 2007. Better estimates of species specific catch and effort in the DWFFF are now being collected.
In 2011, the Fisheries Observer Program focused its efforts on Queensland’s line fisheries to better quantify catch composition and effort in deeper waters. This was done primarily on L1 boats targeting deeper waters with mechanical reels, rather than in the L8 multi-hook fishery. Of the 69 boats observed in 2011, there were only four Bass Groper harvested in the CRFFF.
A new research project aimed at collecting more biological information of deep water fish species and completing an updated risk assessment for the fishery has also commenced.
Figure 33: Commercial catch (t) of Bass Groper reported in logbooks. Note that the current logbook for the DWFFF was only introduced in 2007.
0
2
4
6
8
12
1999
-00
2000
-01
2001
-02
2002
-03
2003
-04
2004
-05
2005
-06
2006
-07
2007
-08
2008
-09
2009
-10
2010
-11
Cat
ch (t
)
DWFFF CRFFF
10
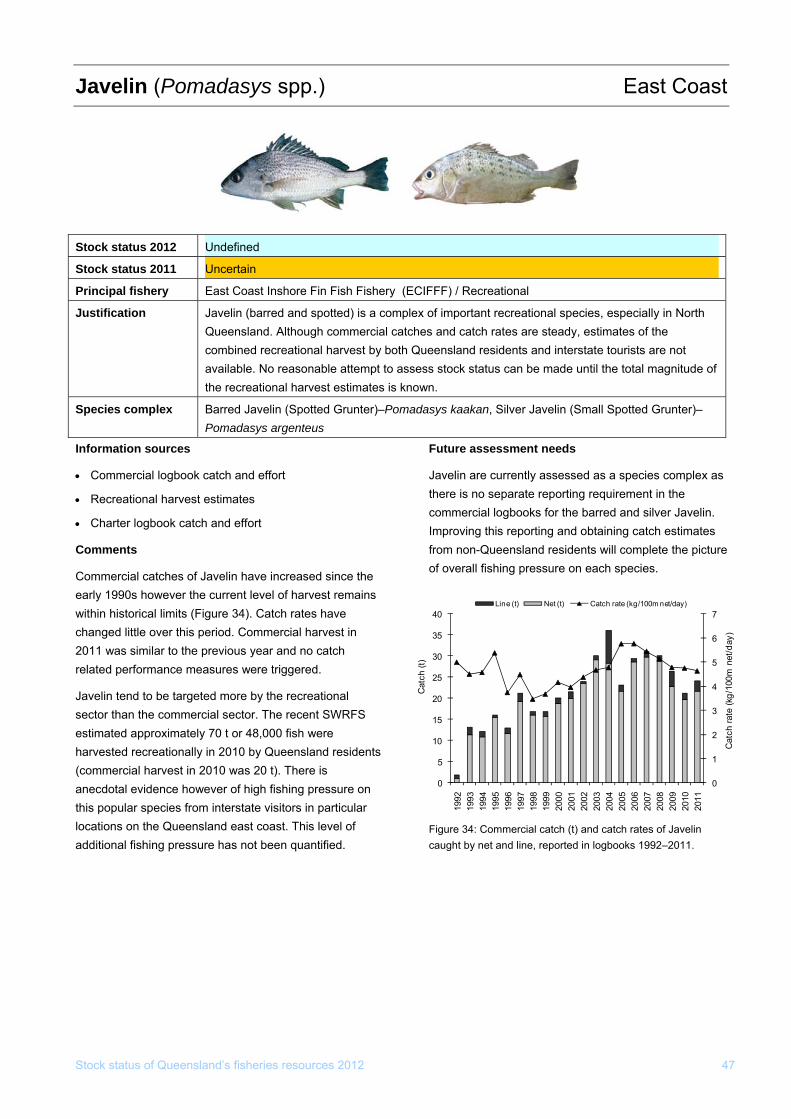
Javelin (Pomadasys spp.) East Coast
Stock status of Queensland’s fisheries resources 2012 47
Stock status 2012 Undefined
Stock status 2011 ncertain U
rincipal fisheryP ast Coast InE shore Fin Fish Fishery (ECIFFF) / Recreational
ustificationJ avelin (barred and spotted) is a complex of important recreational species, espeJ cially in North ueensland. Although commercial catches and catch rates are steady, estimates of the Qombined recreational harvest by both Queensland residents and interstate tourists are noc t vailable. No reasonable attempt to assess stock status can be made until the total magnitude of a
he recreational harvest estimates is kt nown.
Species complex Barred Javelin (Spotted Grunter)–Pomadasys kaakan, Silver Javelin (Small Spotted Grunter)–usPomadasys argente
Information sources
• Commercial logbook catch and effort
• Recreational harvest estimates
book catch and effort
e
ere in 2010 by Queensland residents
was 20 t). There is
essed as a species complex as there is no separate reporting requirement in the commercial logbooks for the barred and silver Javelin. Improving this reporting and obtaining catch estimates from non-Queensland residents will complete the picture of overall fishing pressure on each species.
Figure 34: Commercial catch (t) and catch rates of Javelin caught by net and line, reported in logbooks 1992–2011.
• Charter log
Comments
Commercial catches of Javelin have increased since thearly 1990s however the current level of harvest remainswithin historical limits (Figure 34). Catch rates have changed little over this period. Commercial harvest in 2011 was similar to the previous year and no catch related performance measures were triggered.
Javelin tend to be targeted more by the recreational sector than the commercial sector. The recent SWRFS estimated approximately 70 t or 48,000 fish wharvested recreationally(commercial harvest in 2010 anecdotal evidence however of high fishing pressure on this popular species from interstate visitors in particular locations on the Queensland east coast. This level of additional fishing pressure has not been quantified.
Future assessment needs
Javelin are currently ass
0
1
3
4
5
6
7
0
20
25
30
35
40
1992
1993
1994
1995
1996
1997
1998
1999
2000
2001
2002
2003
2004
2005
2006
2007
2008
2009
2010
2011
Cat
ch ra
te (k
g/10
0m n
et/d
ay)
Cat
ch (t
)
Line (t) Net (t) Catch rate (kg/100m net/day)
2
5
10
15
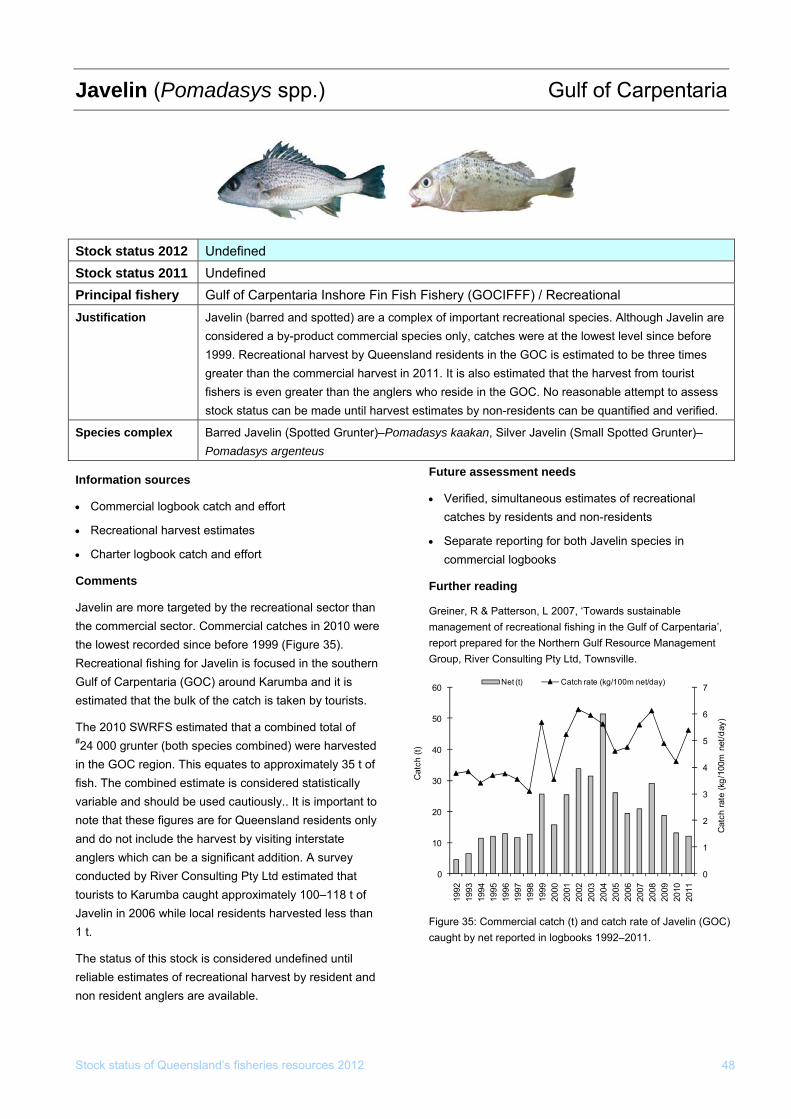
Stock status of Queensland’s fisheries resources 2012 48
Gulf of CJavelin (Pomadasys spp.) arpentaria
ffort
gbook catch and effort
than ere
southern Gulf of Carpentaria (GOC) around Karumba and it is
ts.
of
nly
anglers which can be a significant addition. A survey conducted by River Consulting Pty Ltd estimated that
urists to Karumba caught approximately 100–118 t of Javelin in 2006 while local residents harvested less than 1 t.
The status of this stock is considered undefined until reliable estimates of recreational harvest by resident and non resident anglers are available.
l
Further reading
Greiner, R & Patterson, L 2007, ‘Towards sustainable management of recreational fishing in the Gulf of Carpentaria’, report prepared for the Northern Gulf Resource Management Group, River Consulting Pty Ltd, Townsville.
Figure 35: Commercial catch (t) and catch rate of Javelin (GOC) caught by net reported in logbooks 1992–2011.
Information sources
• Commercial logbook catch and e
• Recreational harvest estimates
• Charter lo
Comments
Javelin are more targeted by the recreational sector the commercial sector. Commercial catches in 2010 wthe lowest recorded since before 1999 (Figure 35). Recreational fishing for Javelin is focused in the
estimated that the bulk of the catch is taken by touris
The 2010 SWRFS estimated that a combined total#24 000 grunter (both species combined) were harvested in the GOC region. This equates to approximately 35 t of fish. The combined estimate is considered statistically variable and should be used cautiously.. It is important tonote that these figures are for Queensland residents oand do not include the harvest by visiting interstate
to
Future assessment needs
• Verified, simultaneous estimates of recreationacatches by residents and non-residents
• Separate reporting for both Javelin species in commercial logbooks
Stock status 2012 Undefined Stock status 2011 Undefined Principal fishery / Recreational Gulf of Carpentaria Inshore Fin Fish Fishery (GOCIFFF)Justification Javelin (barred and spotted) are a complex of important recreational species. Although Javelin are
considered a by-product commercial species only, catches were at the lowest level since1999. Recreational harvest by Queensland residents in the GOC is estimated to be three timgreater than the commercial harvest in 2011. It is also estimated that the harvest from tourist fishers is even greater than the anglers who re
before es
side in the GOC. No reasonable attempt to assess d. stock status can be made until harvest estimates by non-residents can be quantified and verifie
Species complex Grunter)–Pomadasys kaakan, Silver Javelin (Small Spotted Grunter)–Pomadasys argenteus Barred Javelin (Spotted
0
1
3
4
5
6
7
0
20
30
40
50
60
1992
1993
1994
1995
1996
1997
1998
1999
2000
2001
2002
2003
2004
2005
2006
2007
2008
2009
2010
2011
Cat
ch ra
te (k
g/10
0m n
et/d
ay)
Cat
ch (t
)
Net (t) Catch rate (kg/100m net/day)
2
10
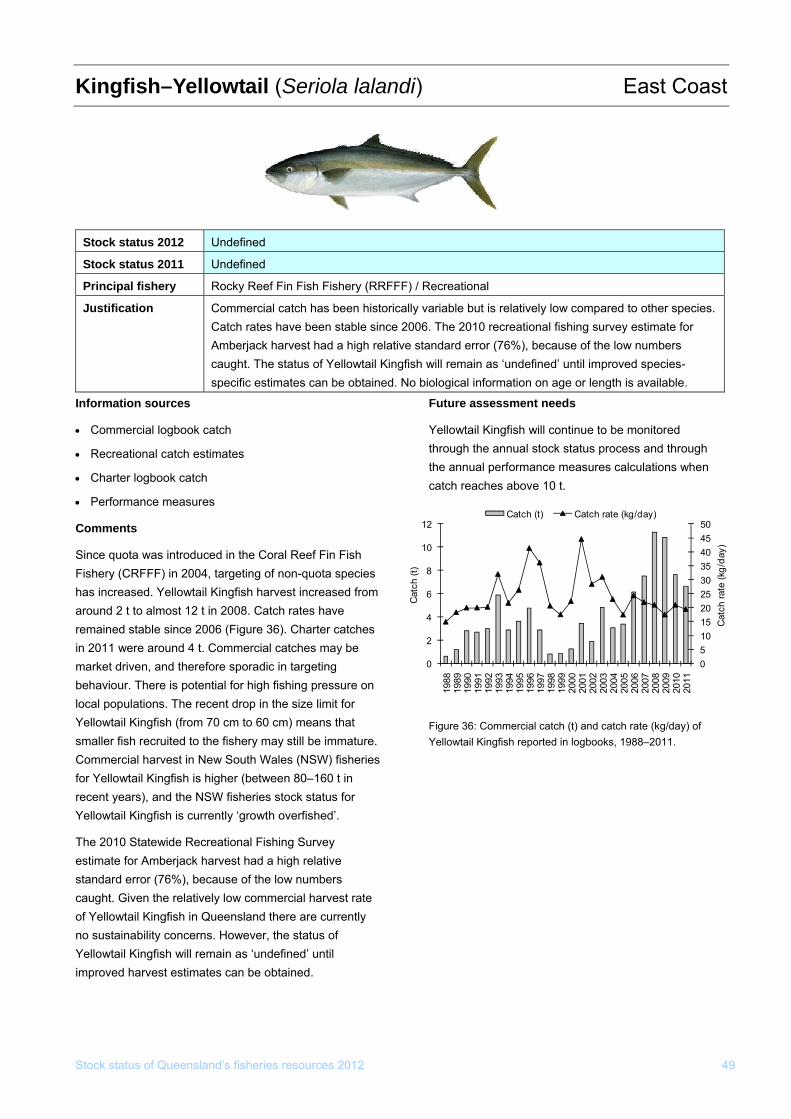
Kingfish–Yellowtail (Seriol East Coast a lalandi)
Stock status 2012 Undefined
Stock status 2011 Undefined
Principal fishery Rocky Reef Fin Fish Fishery (RRFFF) / Recreational
Justification Commercial catch has been historically variable but is relatively low compared to other species. Catch rates have been stable since 2006. The 2010 recreational fishing survey estimate for Amberjack harvest had a high relative standard error (76%), because of the low numbers caught. The status of Yellowtail Kingfish will remain as ‘undefined’ until improved species-specific estimates can be obtained. No biological information on age or length is available.
Information sources
ook
• Recreational catch es
h
ral Reef Fin Fish
d. Yellowtail Kingfish harvest increased from
e
stainability concerns. However, the status of
through the annual stock status process and through sures calculations when
catch reaches above 10 t.
Figure 36: Commercial catch (t) and catch rate (kg/day) of Yellowtail Kingfish reported in logbooks, 1988–2011.
• Commercial logb catch
timates
Yellowtail Kingfish will continue to be monitored
• Charter logbook catc
• Performance measures
Comments
Since quota was introduced in the CoFishery (CRFFF) in 2004, targeting of non-quota species has increasearound 2 t to almost 12 t in 2008. Catch rates have remained stable since 2006 (Figure 36). Charter catches in 2011 were around 4 t. Commercial catches may bmarket driven, and therefore sporadic in targeting behaviour. There is potential for high fishing pressure on local populations. The recent drop in the size limit for Yellowtail Kingfish (from 70 cm to 60 cm) means that smaller fish recruited to the fishery may still be immature. Commercial harvest in New South Wales (NSW) fisheries for Yellowtail Kingfish is higher (between 80–160 t in recent years), and the NSW fisheries stock status for Yellowtail Kingfish is currently ‘growth overfished’.
The 2010 Statewide Recreational Fishing Survey estimate for Amberjack harvest had a high relative standard error (76%), because of the low numbers caught. Given the relatively low commercial harvest rateof Yellowtail Kingfish in Queensland there are currently no suYellowtail Kingfish will remain as ‘undefined’ until improved harvest estimates can be obtained.
Future assessment needs
the annual performance mea
0
20253035404550
0
1988
1989
1990
1991
1992
1993
1994
1995
1996
1997
1998
1999
2000
2001
2002
2003
2004
2005
2006
2007
2008
2009
2010
2011
atch
rate
(kg/
day)
Cat
ch (
51015
2
4 C
6
8
10
t)
12Catch (t) Catch rate (kg/day)
Stock status of Queensland’s fisheries resources 2012 49
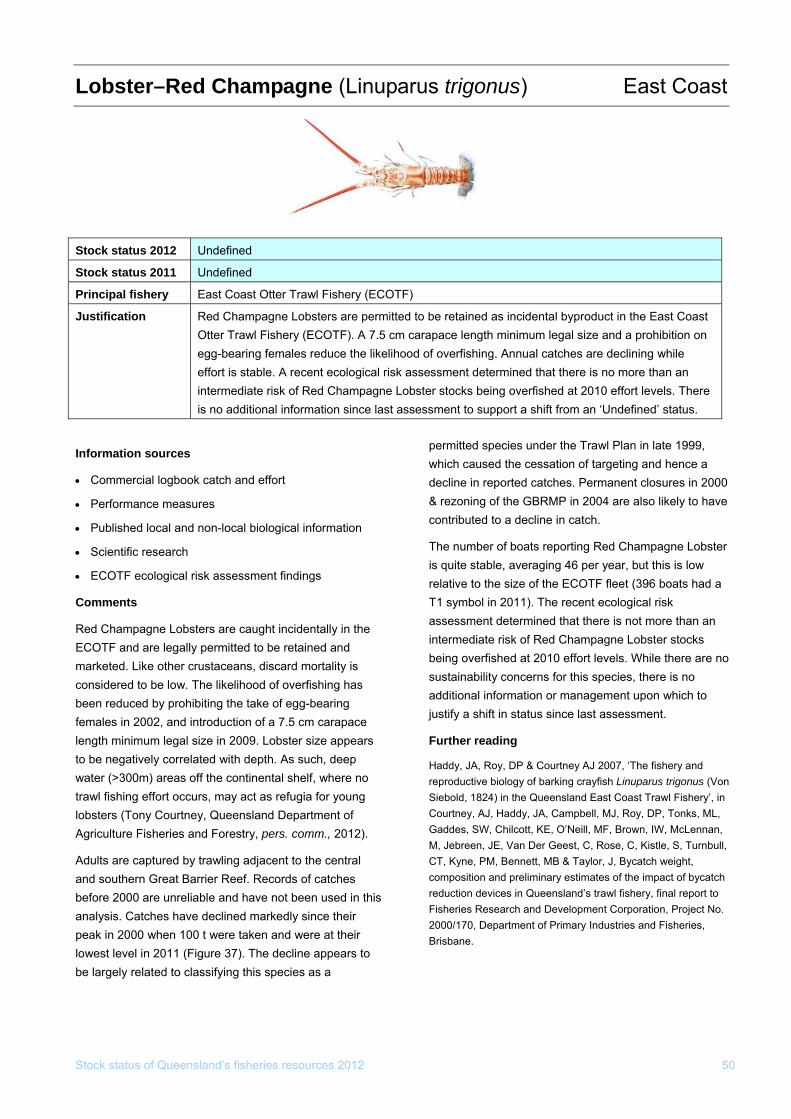
Stock status of Queensland’s fisheries resources 2012 50
Lobster–Red Champagne (Linuparus Coast trigonus) East
Information sources
• Commercial logbook catch and effort
ocal and non-local biological information
is
o
f 2).
ral s
eir ars to
a
S
• Performance measures
• Published l
• Scientific research
• ECOTF ecological risk assessment findings
Comments
Red Champagne Lobsters are caught incidentally in the ECOTF and are legally permitted to be retained and marketed. Like other crustaceans, discard mortalityconsidered to be low. The likelihood of overfishing has been reduced by prohibiting the take of egg-bearing females in 2002, and introduction of a 7.5 cm carapace length minimum legal size in 2009. Lobster size appears to be negatively correlated with depth. As such, deep water (>300m) areas off the continental shelf, where ntrawl fishing effort occurs, may act as refugia for younglobsters (Tony Courtney, Queensland Department oAgriculture Fisheries and Forestry, pers. comm., 201
Adults are captured by trawling adjacent to the centand southern Great Barrier Reef. Records of catchebefore 2000 are unreliable and have not been used in thisanalysis. Catches have declined markedly since their peak in 2000 when 100 t were taken and were at thlowest level in 2011 (Figure 37). The decline appebe largely related to classifying this species as
permitted species under the Trawl Plan in late 1999, which caused the cessation of targeting and hence a decline in reported catches. Permanent closures in 2000 & rezoning of the GBRMP in 2004 are also likely to have contributed to a decline in catch.
The number of boats reporting Red Champagne Lobster is quite stable, averaging 46 per year, but this is low relative to the size of the ECOTF fleet (396 boats had a T1 symbol in 2011). The recent ecological risk assessment determined that there is not more than an intermediate risk of Red Champagne Lobster stocks being overfished at 2010 effort levels. While there are no sustainability concerns for this species, there is no additional information or management upon which to justify a shift in status since last assessment.
Further reading
Haddy, JA, Roy, DP & Courtney AJ 2007, ‘The fishery and reproductive biology of barking crayfish Linuparus trigonus (Von Siebold, 1824) in the Queensland East Coast Trawl Fishery’, in Courtney, AJ, Haddy, JA, Campbell, MJ, Roy, DP, Tonks, ML, Gaddes, SW, Chilcott, KE, O’Neill, MF, Brown, IW, McLennan, M, Jebreen, JE, Van Der Geest, C, Rose, C, Kistle, S, Turnbull, CT, Kyne, PM, Bennett, MB & Taylor, J, Bycatch weight, composition and preliminary estimates of the impact of bycatch reduction devices in Queensland’s trawl fishery, final report to Fisheries Research and Development Corporation, Project No. 2000/170, Department of Primary Industries and Fisheries, Brisbane.
tock status 2012 Undefined
Stock status 2011 Undefined
P Earincipal fishery st Coast Otter Trawl Fishery (ECOTF)
J ReO n egef in re
ditional information since last asses an ‘Undefined’ status.
ustification d Champagne Lobsters are permitted to be retained as incidental byproduct in the East Coast tter Trawl Fishery (ECOTF). A 7.5 cm carapace length minimum legal size and a prohibition og-bearing females reduce the likelihood of overfishing. Annual catches are declining while fort is stable. A recent ecological risk assessment determined that there is no more than antermediate risk of Red Champagne Lobster stocks being overfished at 2010 effort levels. The
is no ad sment to support a shift from
R e Lobster catch (t) and ne Lobster
00
0
20
40
60
8020
00
2001
2002
2003
2004
2005
2006
2007
2008
2009
2010
2011
Cat
ch (t
)
0
10
20
30
40
50
Effo
rt (b
oats
repo
rting
cat
ch)
Figure 37: Commercialeffort (number of boats reporting
ed ChampagnRed Champag
catches) in logbooks, 2 1–11.
100
120
60
70Catch Effort
Stock status of Queensland’s fisheries resources 2012 51
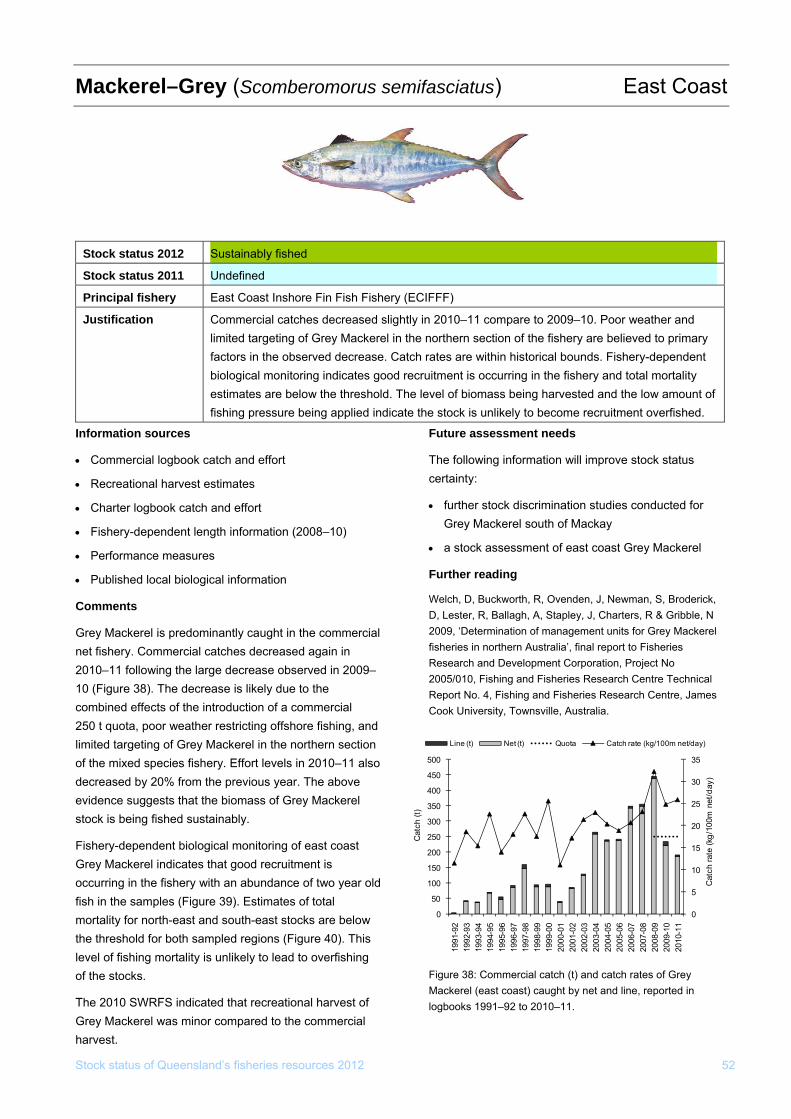
Mackerel–Grey (Scomberomorus semifasciatus) East Coast
Stock status of Queensland’s fisheries resources 2012 52
Stock status 2012 Sustainably fished
Stock status 2011 Undefined
Principal fishery East Coast Inshore Fin Fish Fishery (ECIFFF)
Justification Commercial catches decreased slightly in 2010–11 compare to 2009–10. Poor weather and limited targeting of Grey Mackerel in the northern section of the fishery are believed to primary factors in the observed decrease. Catch rates are within historical bounds. Fishery-dependent biological monitoring indicates good recruitment is occurring in the fishery and total mortality estimates are below the threshold. The level of biomass being harvested and the low amount of fishing pressure being applied indicate the stock is unlikely to become recruitment overfished.
Information sources
• Commercial logbook catch and effort
• Recreational harvest estimates
• Charter logbook catch and effort
• Fishery-dependent length information (2008–10)
• Performance measures
• Published local biological information
Comments
Grey Mackerel is predominantly caught in the commercial net fishery. Commercial catches decreased again in 2010–11 following the large decrease observed in 2009–10 (Figure 38). The decrease is likely due to the combined effects of the introduction of a commercial 250 t quota, poor weather restricting offshore fishing, and limited targeting of Grey Mackerel in the northern section of the mixed species fishery. Effort levels in 2010–11 also decreased by 20% from the previous year. The above evidence suggests that the biomass of Grey Mackerel stock is being fished sustainably.
Fishery-dependent biological monitoring of east coast Grey Mackerel indicates that good recruitment is occurring in the fishery with an abundance of two year old fish in the samples (Figure 39). Estimates of total mortality for north-east and south-east stocks are below the threshold for both sampled regions (Figure 40). This level of fishing mortality is unlikely to lead to overfishing of the stocks.
The 2010 SWRFS indicated that recreational harvest of Grey Mackerel was minor compared to the commercial harvest.
Future assessment needs
The following information will improve stock status certainty:
• further stock discrimination studies conducted for Grey Mackerel south of Mackay
• a stock assessment of east coast Grey Mackerel
Further reading
Welch, D, Buckworth, R, Ovenden, J, Newman, S, Broderick, D, Lester, R, Ballagh, A, Stapley, J, Charters, R & Gribble, N 2009, ‘Determination of management units for Grey Mackerel fisheries in northern Australia’, final report to Fisheries Research and Development Corporation, Project No 2005/010, Fishing and Fisheries Research Centre Technical Report No. 4, Fishing and Fisheries Research Centre, James Cook University, Townsville, Australia.
Figure 38: Commercial catch (t) and catch rates of Grey Mackerel (east coast) caught by net and line, reported in logbooks 1991–92 to 2010–11.
Line (t) Net (t) Quota Catch rate (kg/100m net/day)
0
5
10
15
20
25
30
35
0
50
100
150
200
250
300
350
400
450
500
1991
-92
1992
-93
1993
-94
1994
-95
1995
-96
1996
-97
1997
-98
1998
-99
1999
-00
2000
-01
2001
-02
2002
-03
2003
-04
2004
-05
2005
-06
2006
-07
2007
-08
2008
-09
2009
-10
2010
-11
Cat
ch ra
te (k
g/10
0m n
et/d
ay)
Cat
ch (t
)
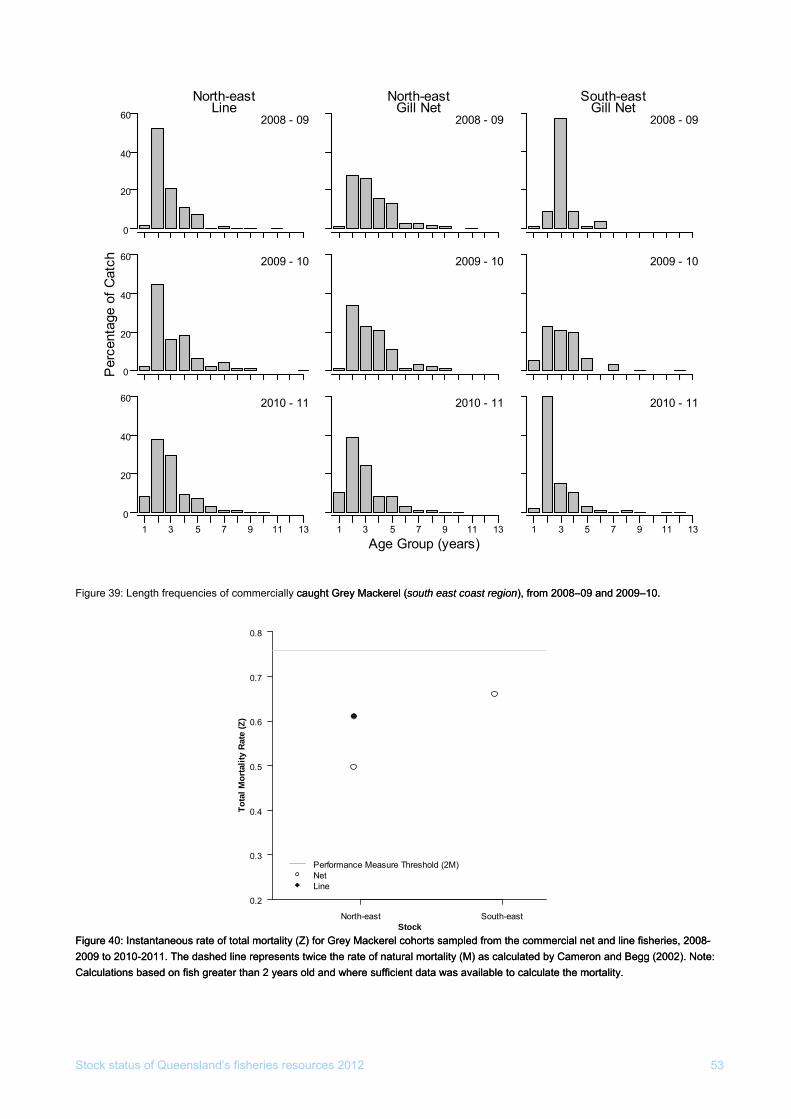
Stock status of Queensland’s fisheries resources 2012 53
Figure 39: Length frequencies of commercially caught Grey Mackerel (sou caught Grey Mackerel (south east coast region), from 2008–09 and 2009–10. th east coast region), from 2008–09 and 2009–10.
North-east
0
20
40
60 2008 - 09Line
0
20
40
60 2009 - 10
2010 - 11
1 3 5 7 9 11 130
20
40
60
2008 - 09Gill Net
North-east
2009 - 10
1 3 5 7 9 11 13
2010 - 11
2008 - 09
South-Gill Net
east
2009 - 10
A
Per
cen
1 3 5 7 9 11 13
2010 - 11
tage
of C
atch
ge Group (years)
erel cohorts sampled from the commercial net and line fisheries, 2008-f natural mortality (M) as calculated by Cameron and Begg (2002). Note:
ed on fish greater than 2 years old and where sufficient da
erel cohorts sampled from the commercial net and line fisheries, 2008-f natural mortality (M) as calculated by Cameron and Begg (2002). Note:
ed on fish greater than 2 years old and where sufficient da
Figure 40: Instantaneous rate of total mortality (Z) for Grey Mack2009 to 2010-2011. The dashed line represents twice the rate oCalculations bas
Figure 40: Instantaneous rate of total mortality (Z) for Grey Mack2009 to 2010-2011. The dashed line represents twice the rate oCalculations bas ta was available to calculate the mortality. ta was available to calculate the mortality.
0.2
0.3
0.4
0.5
0.6
0.7
0.8
North-eas
Tota
l Mor
talit
y Ra
te (Z
)
PerformNetLine
ance Measure Threshold (2M)
t South-eastStock

Stock status of Queensland’s fisheries resources 2012 54
MackerMackerel–Grey el–Grey ((Scomberomorus semifasciScomberomorus semifasciaatustus)) Gulf Gulf of of CarpentCarpentariaaria
4
Stock status 2012 Uncertain
Stock status 2011 Uncertain
Principal fishery Gulf of Carpentaria Inshore Fin Fish Fishery (GOCIFFF)
Justification mercial catches and catch rates of 2010 wereThe high com again evident in 2011 and triggered performance measures. There is uncertainty as to whether these catches indicate increased fishing pressure on stocks or simply fishers taking advantage of a highly variable resource. Anecdotal reports suggest 2010 and 2011 have been particularly good years for Grey Mackerel catches however there has been no biological evidence collected to validate these reports. New precautionary management arrangements limiting the amount of net that can be used to harvest Grey Mackerel were introduced for the 2012 season.
Information sources The ERA review by Fisheries Queensland in 2010
downgraded Grey Mackerel from a high to a moderate• Commercial logbook catch and effort
risk due to the outcomes of research on the stock • Recreational harvest estimates differentiation across northern Australia (Welch et al. • Charter logbook catch and effort 2009). This research found evidence, although
• inconclusive, that multiple localised sub-stocks of Grey Performance measures Mackerel may exist within the GOC.
• Ecological risk assessment (2004 & 2010 review)
• Published local biological information The SWRFS estimated that recreational harvest of Grey Mackerel is minimal. The stock status of Grey Comments Mackerel remains ‘uncertain’ until the causes of catch
The commercial catch of Grey Mackerel in 2011 was variability, and how these relate to population levels, isslightly less than 2010 however this was still the second better understood. highest reported harvest on record (Figure 41). Anecdotal
Future assessment needs reports by commercial fishers suggest that in 2010 and 2011 Grey Mackerel were plentiful, however there has Fishery-dependent monitoring stocks and a stock been no biological evidence collected to validate these assessment of GOC Grey Mackerel is required. For reports. The high sustained catch rates tend to support more information see the latest Fishery Update for the that there are high abundances of fish, although catch GOCIFFF. rates of schooling mackerel species can be subject to Further reading hyperstability.
Welch, D, Buckworth, R, Ovenden, J, Newman, S, Broderick, Catch related performance measures for Grey Mackerel D, Lester, R, Ballagh, A, Stapley, J, Charters, R & Gribble, N in the GOCIFFF triggered in 2010 and again in 2011. 2009, ‘Determination of management units for Grey Mackerel
New precautionary arrangements were introduced in fisheries in northern Australia’, final report to FRDC No.
2012 that reduce the total overall length of net that can be 2005/010, Fishing and Fisheries Research Centre, James Cook University, Townsville.
used for Grey Mackerel and tropical Sharks by >50%.
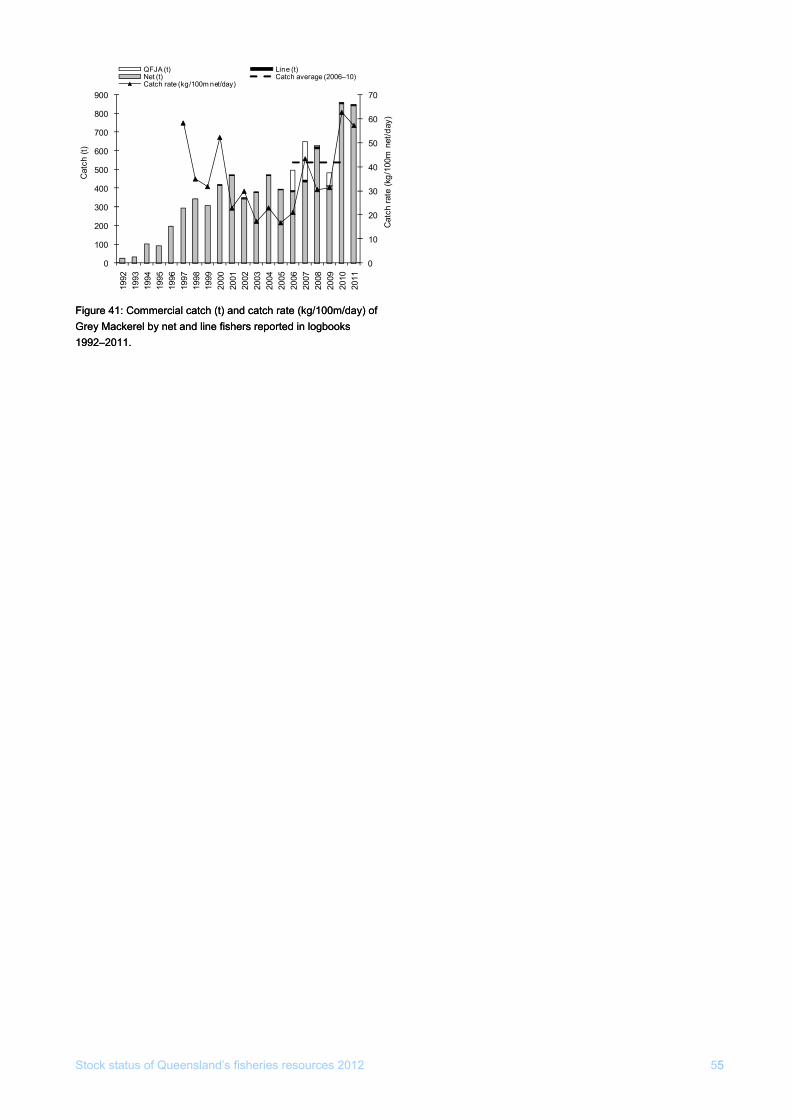
Stock status of Queensland’s fisheries resources 2012 55
F rcial catch Grey Mackerel by net and line1992–2011.
F rcial catch Grey Mackerel by net and line1992–2011.
igure 41: Commeigure 41: Comme (t) and catch rate (kg/100m/day) of fishers reported in logbooks (t) and catch rate (kg/100m/day) of fishers reported in logbooks
0
10
20
30
40
50
60
200
300
400
500
600
700
800
1998
1999 0
Cat
ch ra
te (k
g/10
0m n
et/d
ay)
Cat
ch (t
)70900
QFJA (t)Net (t) Catch average (2006–10)Catch rate (kg/100m net/day)
0
100
1992
1993
1994
1995
1996
1997
200
2001
2002
2003
2004
2005
2006
2007
2008
2009
2010
2011
Line (t)
5
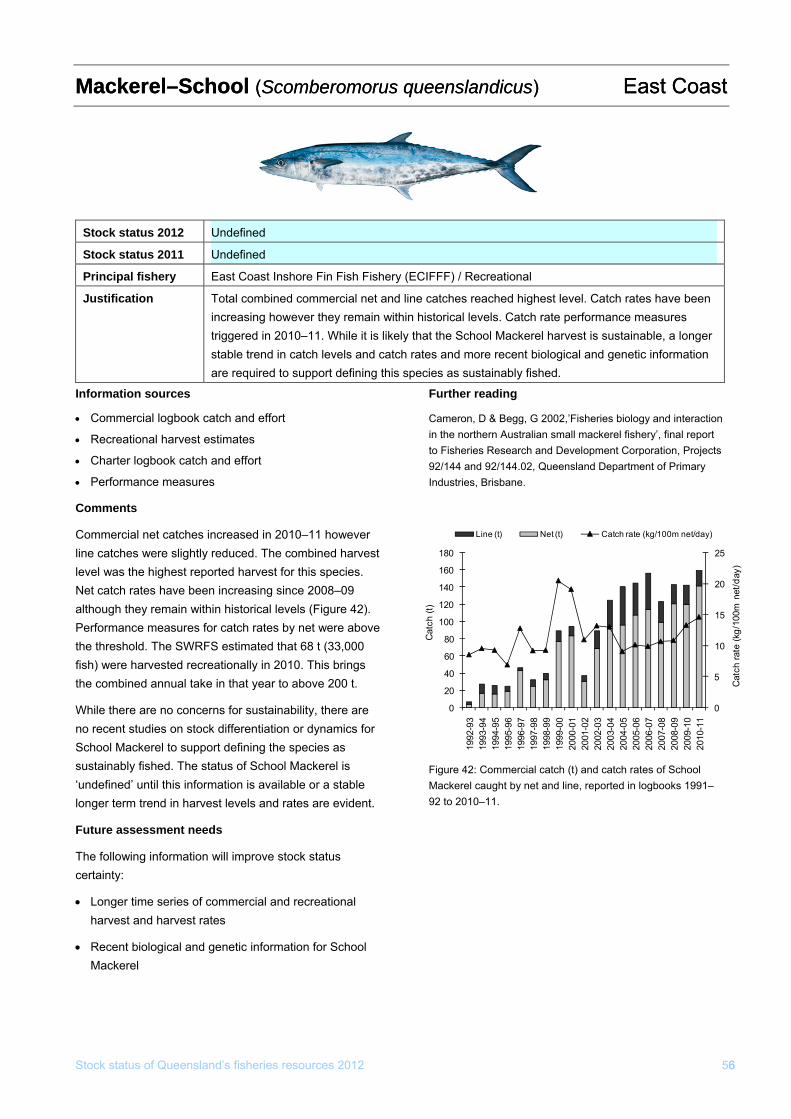
Stock status of Queensland’s fisheries resources 2012 566
MackerMackerel–Schoel–Schoool l ((Scomberomorus queenslScomberomorus queenslandicusandicus)) East East CoastCoast
Stock status 2012 Undefined
Stock status 2011 Undefined
Principal fishery East Coast Inshore Fin Fish Fishery (ECIFFF) / Recreational
Justification Total combined commercial net and line catches reached highest level. Catch rates have been increasing however they remain within historical levels. Catch rate performance measures
y that the School Mackerel harvest is sustainable, a longer triggered in 2010–11. While it is likelstable trend in catch levels and catch rates and more recent biological and genetic information are required to support defining this species as sustainably fished.
Information sources
• Commercial logbook catch and effort
• Recreational harvest estimates
• Charter logbook catch and effort
• Performance measures
Comments
Commercial net catches increased in 2010–11 however line catches were slightly reduced. The combined harvest level was the highest reported harvest for this species. Net catch rates have been increasing since 2008–09 although they remain within historical levels (Figure 42). Performance measures for catch rates by net were above the threshold. The SWRFS estimated that 68 t (33,000 fish) were harvested recreationally in 2010. This brings the combined annual take in that year to above 200 t.
While there are no concerns for sustainability, there are no recent studies on stock differentiation or dynamics for School Mackerel to support defining the species as sustainably fished. The status of School Mackerel is ‘undefined’ until this information is available or a stable longer term trend in harvest levels and rates are evident.
Future assessment needs
The following information will improve stock status certainty:
• Longer time series of commercial and recreational harvest and harvest rates
• Recent biological and genetic information for School Mackerel
Further reading
Cameron, D & Begg, G 2002,’Fisheries biology and interaction in the northern Australian small mackerel fishery’, final report to Fisheries Research and Development Corporation, Projects 92/144 and 92/144.02, Queensland Department of Primary Industries, Brisbane.
Figure 42: Commercial catch (t) and catch rates of School Mackerel caught by net and line, reported in logbooks 1991–92 to 2010–11.
Line (t) Net (t) Catch rate (kg/100m net/day)
0
5
10
15
20
25
0
20
40
60
80
100
120
140
160
180
1992
-93
1993
-94
1994
-95
1995
-96
1996
-97
1997
-98
1998
-99
1999
-00
2000
-01
2001
-02
2002
-03
2003
-04
2004
-05
2005
-06
2006
-07
2007
-08
2008
-09
2009
-10
2010
-11
Cat
ch ra
te (k
g/10
0m n
et/d
ay)
Cat
ch (t
)
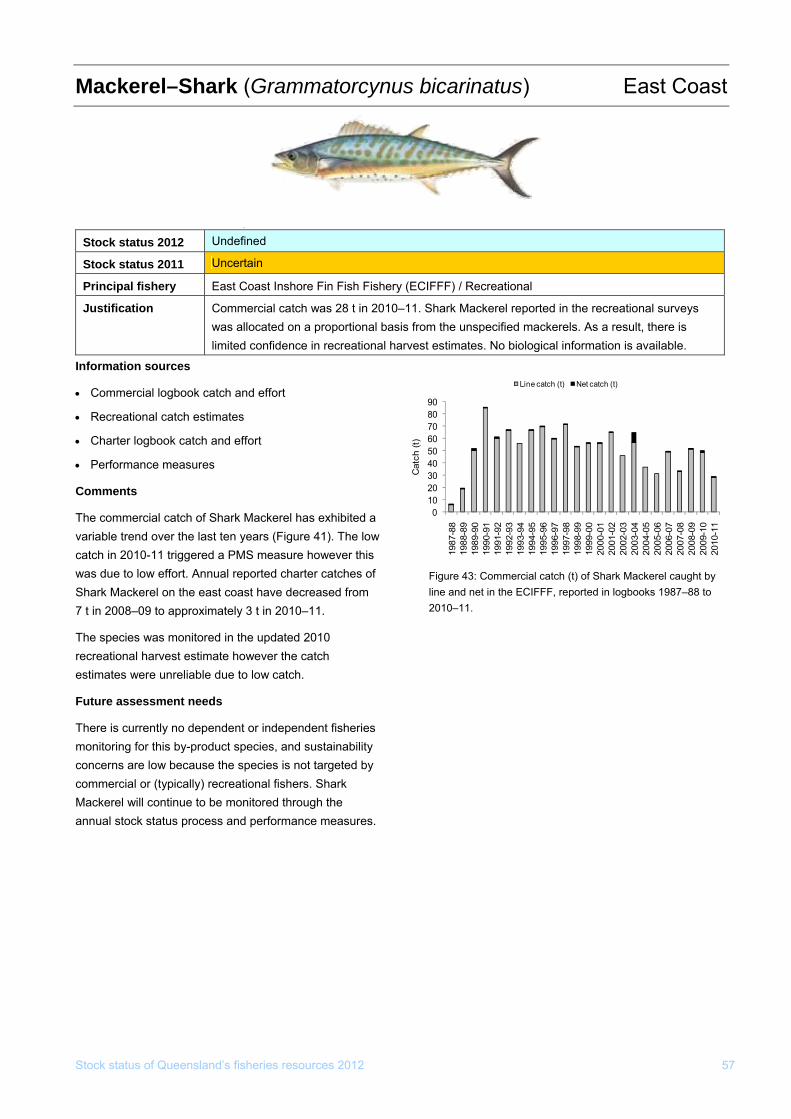
Mackerel–Shark (Grammatorcynus bicarinatus) East Coast
.
Stock status 2012 Undefined
Stock status 2011 Uncertain
Principal fishery East Coast Inshore Fin Fish Fishery (ECIFFF) / Recreational
Justification Commercial catch was 28 t in 2010–11. Shark Mackerel reported in the recreational surveys was allocated on a proportional basis from the unspecified mackerels. As a result, there is limited confidence in recreational harvest estimates. No biological information is available.
Information sources
igure 43: Commercial catch (t) of Shark Mackerel caught by F, reported in logbooks 1987–88 to
Stock status of Queensland’s fisheries resources 2012 57
• Commercial logbook catch and effort
• Recreational catch estimates
• Charter logbook catch and effort
• Performance measures
Comments
The commercial catch of Shark Mackerel has exhibited a variable trend over the last ten years (Figure 41). The low catch in 2010-11 triggered a PMS measure however this was due to low effort. Annual reported charter catches of Shark Mackerel on the east coast have decreased from 7 t in 2008–09 to approximately 3 t in 2010–11.
The species was monitored in the updated 2010 recreational harvest estimate however the catch estimates were unreliable due to low catch.
Future assessment needs
There is currently no dependent or independent fisheries monitoring for this by-product species, and sustainability concerns are low because the species is not targeted by commercial or (typically) recreational fishers. Shark Mackerel will continue to be monitored through the annual stock status process and performance measures.
Fline and net in the ECIFF2010–11.
0102030405060708090
1987
-88
1988
-89
1989
-90
1990
-91
1991
-92
1992
-93
1993
-94
1994
-95
1995
-96
1996
-97
1997
-98
1998
-99
1999
-00
2000
-01
2001
-02
2002
-03
2003
-04
2004
-05
2005
-06
2006
-07
2007
-08
2008
-09
2009
-10
2010
-11
Cat
ch (t
)
Line catch (t) Net catch (t)
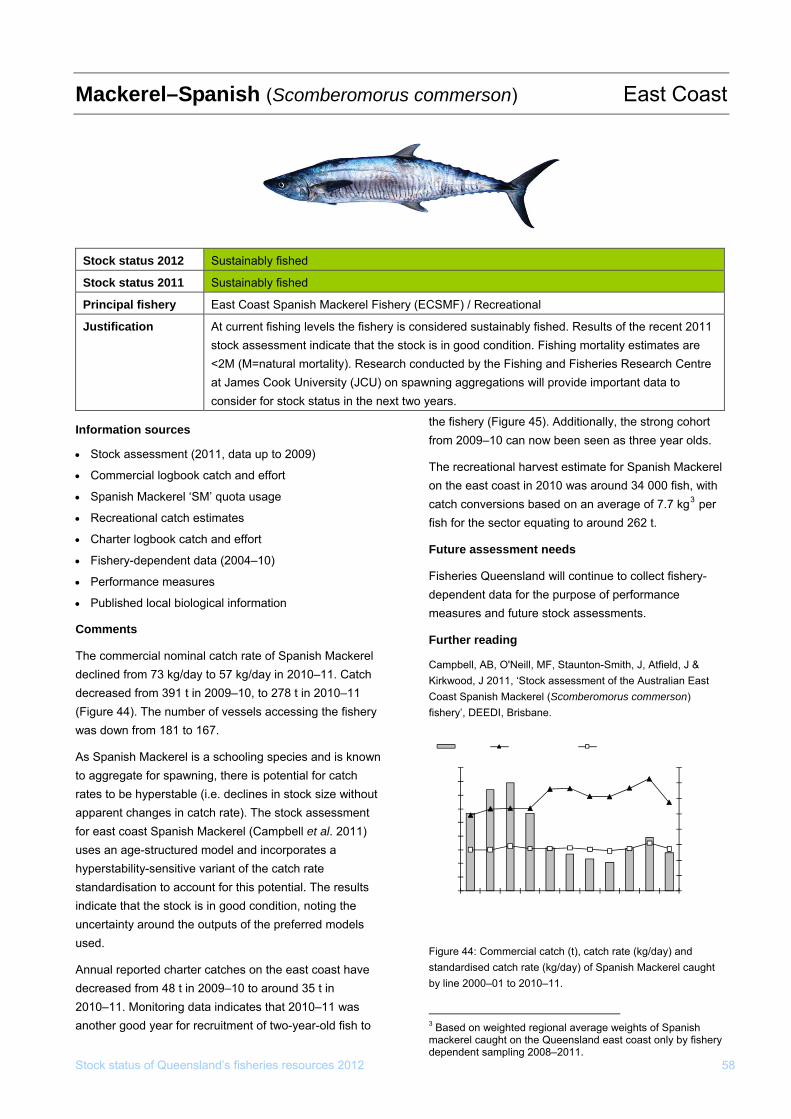
Mackerel–Spanish (Scomberomorus commerson) East Coast
Stock status of Queensland’s fisheries resources 2012 58
Stock status 2012 Sustainably fished
Stock status 2011 Sustainably fished
Principal fishery East Coast Spanish Mackerel Fishery (ECSMF) / Recreational
Justification 011 e
<2M (M=natural mortality). Research conducted by the Fishing and Fisheries Research Centre University (JCU) on spawning aggregations will provide important data to ck status in the next two years.
At current fishing levels the fishery is considered sustainably fished. Results of the recent 2stock assessment indicate that the stock is in good condition. Fishing mortality estimates ar
at James Cookconsider for sto
Information sources from 2009–10 can now been seen as three year olds.
• Stock assessment (2011, data up to 2009) The recreational harvest estimate for Spanish Mackerel
• Commercial logbook catch and effort on the east coast in 2010 was around 34 000 fish, with
• Spanish Mackerel ‘SM’ quota usage catch conversions based on an average of 7.7 kg3 per • Recreational catch estimates fish for the sector equating to around 262 t. • Charter logbook catch and effort
Future assessment needs • Fishery-dependent data (2004–10)
Fisheries Queensland will continue to collect fishery-• Performance measures dependent data for the purpose of performance
• Published local biological information measures and future stock assessments.
Comments Further reading
The commercial nominal catch rate of Spanish Mackerel Campbell, AB, O'Neill, MF, Staunton-Smith, J, Atfield, J &
declined from 73 kg/day to 57 kg/day in 2010–11. Catch Kirkwood, J 2011, ‘Stock assessment of the Australian East decreased from 391 t in 2009–10, to 278 t in 2010–11 Coast Spanish Mackerel (Scomberomorus commerson) (Figure 44). The number of vessels accessing the fishery fishery’, DEEDI, Brisbane.
was down from 181 to 167. Catch (t) Catch rate (kg/day) Standardised catch rate (kg/day)
As Spanish Mackerel is a schooling species and is known 900 80
to aggregate for spawning, there is potential for catch 800 70
)y
rates to be hyperstable (i.e. declines in stock size without
a/d) 700 60 g
apparent changes in catch rate). The stock assessment
t
600 k ( 50
( hc tet 500for east coast Spanish Mackerel (Campbell et al. 2011)
a
Ca 40 r
400 htc
uses an age-structured model and incorporates a 30300 aC
20hyperstability-sensitive variant of the catch rate 200
100 10standardisation to account for this potential. The results 0 0
indicate that the stock is in good condition, noting the 01 02 03 04 05 06 07 08 09 10 11
uncertainty around the outputs of the preferred models 000-
001-
002-
003-
004-
005-
006-
007-
008-
009-
010-
2 2 2 2 2 2 2 2 2 2 2
used. Figure 44: Commercial catch (t), catch rate (kg/day) and
Annual reported charter catches on the east coast have standardised catch rate (kg/day) of Spanish Mackerel caught by line 2000–01 to 2010–11. decreased from 48 t in 2009–10 to around 35 t in
2010–11. Monitoring data indicates that 2010–11 was another good year for recruitment of two-year-old fish to 3 Based on weighted regional average weights of Spanish
the fishery (Figure 45). Additionally, the strong cohort
mackerel caught on the Queensland east coast only by fishery dependent sampling 2008–2011.
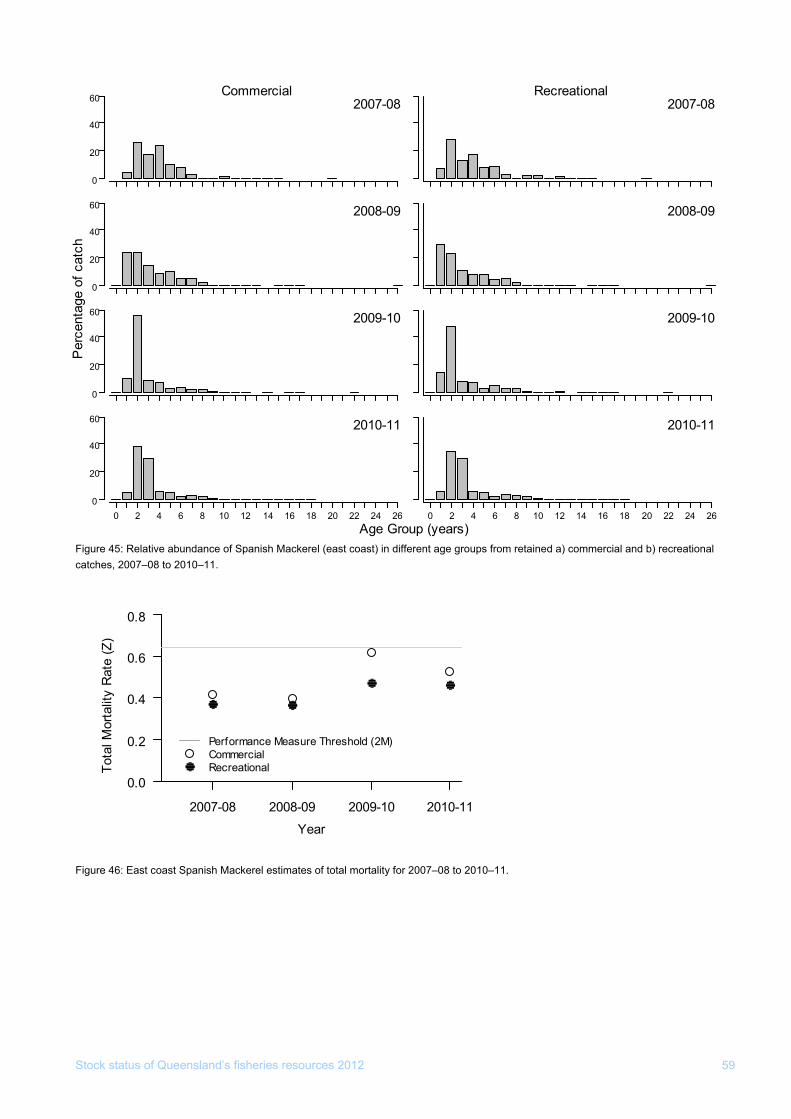
Stock status of Queensland’s fisheries resources 2012 59
l (east coast) in differen mercial and b) recreational t age groups from retained a) comcFigure 45: Relative abundance of Spanish Mackereatches, 2007–08 to 2010–11.
0
20
40
60 2007-08Commercial
2007-08Recreational
40
60 2008-09 2008-09
0
20
40
60 2009-10 2009-10
0
20
60 2010-11
0 2 4 6 8 10 12 14 16 18 20 22 24 260
20
40
Age Group
Per
cent
age
of c
atch
0 2 4 6 8 10 12 14 16 18 20 22 2 26
2010-11
4(years)
tal mortality for 2007–08 to 2010–11. Figure 46: East coast Spanish Mackerel estimates of to
0.8
0.0
0.2
0.4
0.6
2007-08 2008-09 2009-10 2010-11
Perl Mor
talit
y R
ate
(Z
CommercialRecreational
Year
Tota
)
formance Measure Threshold (2M)
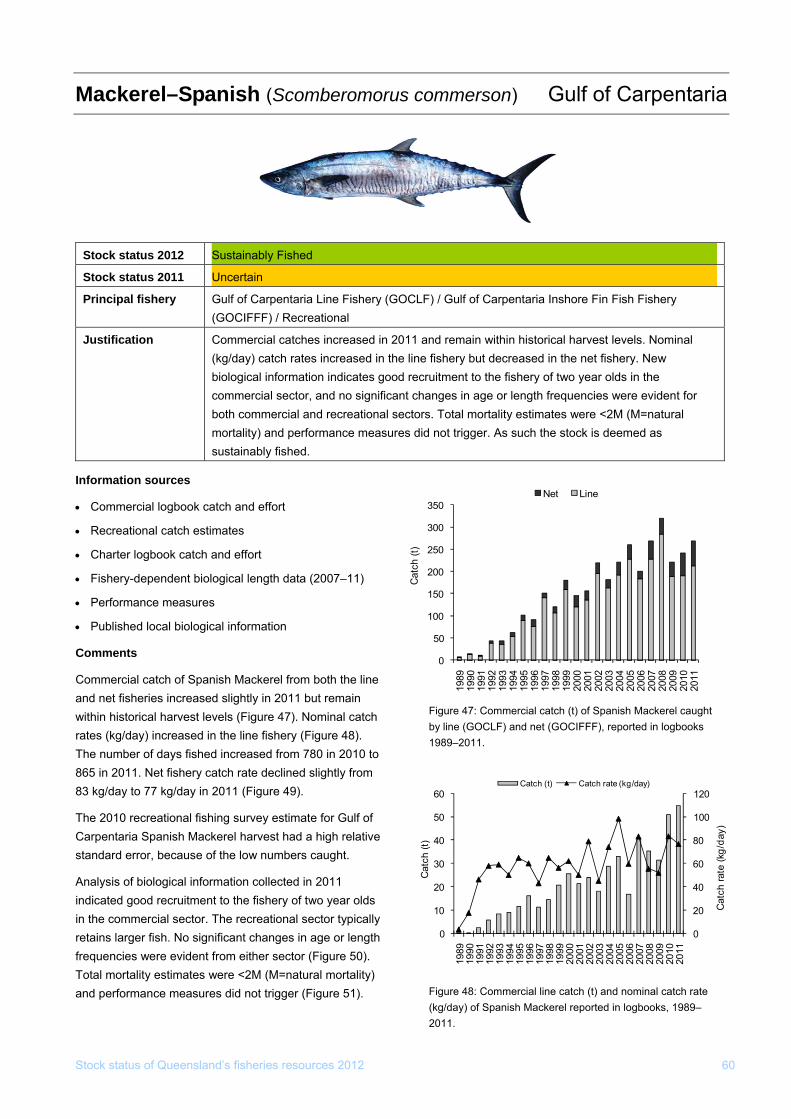
Mackerel–Spanish (Scomberomorus commerson) Gulf of Carpentaria
Stock status of Queensland’s fisheries resources 2012 60
Stock status 2012 Sustainably Fished
Stock status 2011 Uncertain
Principal fishery Gulf of Carpentaria Line Fishery (GOCLF) / Gulf of Carpentaria Inshore Fin Fish Fishery F) / Recreational (GOCIFF
Justification Commercial catches increased in 2011 and remain within historical harvest levels. Nominal (kg/day) catch rates increased in the line fishery but decreased in the net fishery. New biological information indicates good recruitment to the fishery of two year olds in the commercial sector, and no significant changes in age or length frequencies were evident for both commercial and recreational sectors. Total mortality estimates were <2M (M=natural mortality) and performance measures did not trigger. As such the stock is deemed as sustainably fished.
Information sources
• Commercial logbook catch and effort
• Recreational catch estimates
• Charter logbook catch and effort
• Fishery-dependent biological length data (2007–11)
• Performance measures
• Published local biological information
Comments
Commercial catch of Spanish Mackerel from both the line and net fisheries increased slightly in 2011 but remain within historical harvest levels (Figure 47). Nominal catch rates (kg/day) increased in the line fishery (Figure 48). The number of days fished increased from 780 in 2010 to 865 in 2011. Net fishery catch rate declined slightly from 83 kg/day to 77 kg/day in 2011 (Figure 49).
The 2010 recreational fishing survey estimate for Gulf of Carpentaria Spanish Mackerel harvest had a high relative standard error, because of the low numbers caught.
Analysis of biological information collected in 2011 indicated good recruitment to the fishery of two year olds in the commercial sector. The recreational sector typically retains larger fish. No significant changes in age or length frequencies were evident from either sector (Figure 50). Total mortality estimates were <2M (M=natural mortality) and performance measures did not trigger (Figure 51).
Figure 47: Commercial catch (t) of Spanish Mackerel caught by line (GOCLF) and net (GOCIFFF), reported in logbooks 1989–2011.
Figure 48: Commercial line catch (t) and nominal catch rate (kg/day) of Spanish Mackerel reported in logbooks, 1989–2011.
0
50
100
150
200
300
350
1989
1990
1991
1992
1993
1994
1995
1996
1997
1998
1999
2000
2001
2002
2003
2004
2005
2006
2007
2008
2009
2010
2011
Cat
ch
Net Line
250 (t)
0
20
40
60
80
100
120
0
10
20
40
50
60
1989
1990
1991
1992
1993
1994
1995
1996
1997
1998
1999
2000
2001
2002
2003
2004
2005
2006
2007
2008
2009
2010
2011
Cat
ch ra
te (k
g/da
y)
h (t)
Catch (t) Catch rate (kg/day)
30
Cat
c
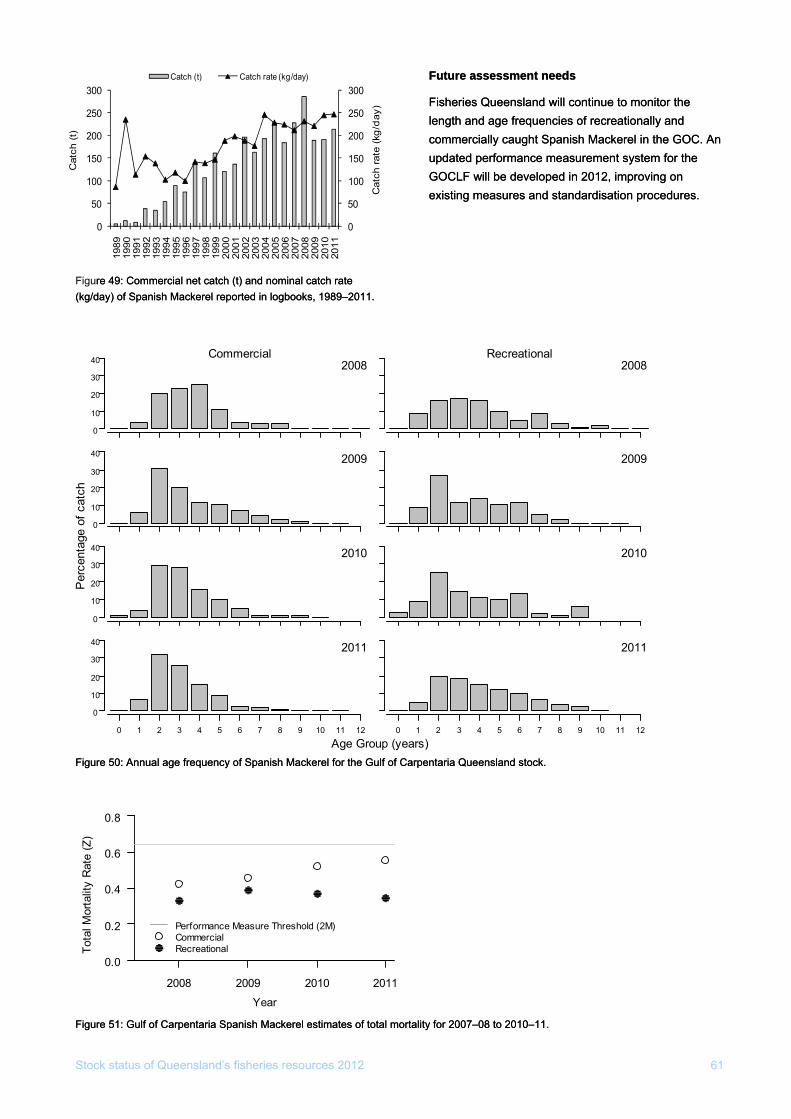
Fi et c( kere
et c( kere
gure 49: Commercial nre 49: Commercial n atch (t) and nominal catch rate atch (t) and nominal catch rate kg/day) of Spanish Mackg/day) of Spanish Mac l reported in logbooks, 1989–2011. l reported in logbooks, 1989–2011.
50
100
150
200
250
00
50
100
150
200
250
1997
1998 999
2010
2011
Cat
ch r
ate
(kg/
day
Cat
ch (t
)
300300
)
Catch (t) Catch ra
1989
1990
1991
1992
1993
1994
1995
1996
1 2000
2001
2002
2003
2004
2005
2006
2007
2008
2009
te (kg/day)
Stock status of Queensland’s fisheries resources 2012 61
FFuuttuure assesre assesssmenment nt needeeds s
FFiisheries Qusheries Queeeenslansland nd wwiill contll continuinuee to monitor to monitor the the lenlenggth anth and agd agee frequenc frequencies ofies of recreatio recreationalnalllyy and and commerciacommercialllly cy caugaught Spanht Spanish ish Mackerel iMackerel inn the the GOC. An GOC. An updupdated pated peerforrformance memance measurasurement sement syystem for the stem for the GOCLFGOCLF wwiillll be be devedevellopoped ied inn 2 2012, impr012, improvinovingg on on existinexistingg measu measurres and stanes and standadardisatirdisation procon proceedures. dures.
of Carpentaria Queensland stock. of Carpentaria Queensland stock. Figure 50: Annual age frequency of Spanish Mackerel for the GulfFigure 50: Annual age frequency of Spanish Mackerel for the Gulf
0
10
20
30
40 2008Commercial
2008Recreational
0
10
20
30
40 2009 2009
0
10
20
30
40 2010 2010
0 1 2 3 4 5 6 7 8 9 10 11 12
0
10
20
30
40 2011
0 1
2011
oup (years
c
2 3 4 5 6 7 8 9 10 11 12
)Age Gr
Per
cent
age
of c
ath
Figure 51: Gulf of Carpentaria Spanish Mackerel estimates of total mortalit 07–08 to 2010–11.
Figure 51: Gulf of Carpentaria Spanish Mackerel estimates of total mortalit 07–08 to 2010–11. y for 20y for 20
0.0
0.2
0.4
0.6
0.8
2008 2009 2010 20
Performance Measure Threshold (2M)CommercialRecreational
Year
Tota
l Mor
talit
y R
ate
(Z)
11
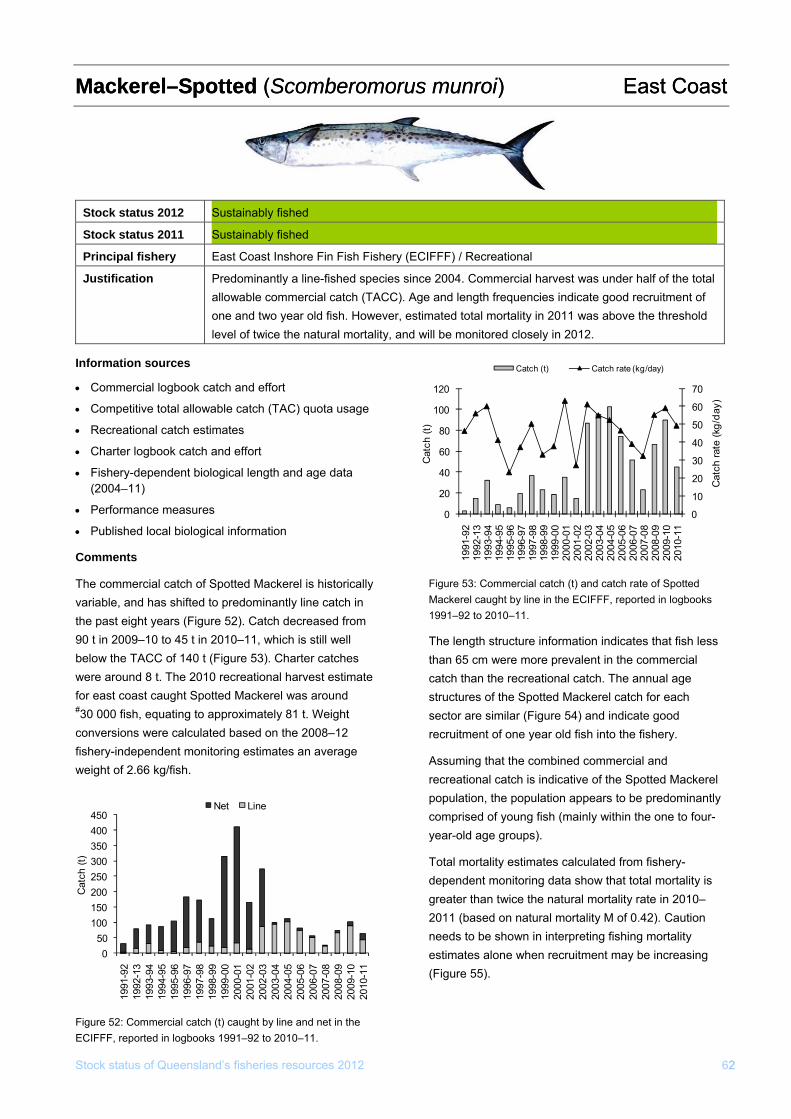
MackerMackerel–Sel–Spotpotted ted ((Scomberomorus munroiScomberomorus munroi) ) East Coast East Coast
Stock status of Queensland’s fisheries resources 2012 622
Stock status 2012 Sustainably fished
Stock status 2011 Sustainably fished
Principal fishery East Coast Inshore Fin Fish Fishery (ECIFFF) / Recreational
Justification Predominantly a line-fished species since 2004. Commercial harvest was under half of the total allowable commercial catch (TACC). Age and length frequencies indicate good recruitment of one and two year old fish. However, estimated total mortality in 2011 was above the threshold level of twice the natural mortality, and will be monitored closely in 2012.
Information sources
• Commercial logbook catch and effort
• Competitive total allowable catch (TAC) quota usage
• Recreational catch estimates
• Charter logbook catch and effort
• Fishery-dependent biological length and age data (2004–11)
• Performance measures
• Published local biological information
Comments
The commercial catch of Spotted Mackerel is historically variable, and has shifted to predominantly line catch in the past eight years (Figure 52). Catch decreased from 90 t in 2009–10 to 45 t in 2010–11, which is still well below the TACC of 140 t (Figure 53). Charter catches were around 8 t. The 2010 recreational harvest estimate for east coast caught Spotted Mackerel was around #30 000 fish, equating to approximately 81 t. Weight conversions were calculated based on the 2008–12 fishery-independent monitoring estimates an average weight of 2.66 kg/fish.
Figure 52: Commercial catch (t) caught by line and net in the ECIFFF, reported in logbooks 1991–92 to 2010–11.
Figure 53: Commercial catch (t) and catch rate of Spotted Mackerel caught by line in the ECIFFF, reported in logbooks 1991–92 to 2010–11.
The length structure information indicates that fish less than 65 cm were more prevalent in the commercial catch than the recreational catch. The annual age structures of the Spotted Mackerel catch for each sector are similar (Figure 54) and indicate good recruitment of one year old fish into the fishery.
Assuming that the combined commercial and recreational catch is indicative of the Spotted Mackerel population, the population appears to be predominantly comprised of young fish (mainly within the one to four-year-old age groups).
Total mortality estimates calculated from fishery-dependent monitoring data show that total mortality is greater than twice the natural mortality rate in 2010–2011 (based on natural mortality M of 0.42). Caution needs to be shown in interpreting fishing mortality estimates alone when recruitment may be increasing (Figure 55).
Catch (t) Catch rate (kg/day)
0
10
20
30
40
50
60
70
0
20
40
60
80
100
120
1991
-92
1992
-13
1993
-94
1994
-95
1995
-96
1996
-97
1997
-98
1998
-99
1999
-00
2000
-01
2001
-02
2002
-03
2003
-04
2004
-05
2005
-06
2006
-07
2007
-08
2008
-09
2009
-10
2010
-11
Cat
ch ra
te (k
g/da
y)
Cat
ch (t
)
050
100150200250300350400450
1991
-92
1992
-13
1993
-94
1994
-95
1995
-96
1996
-97
1997
-98
1998
-99
1999
-00
2000
-01
2001
-02
2002
-03
2003
-04
2004
-05
2005
-06
2006
-07
2007
-08
2008
-09
2009
-10
2010
-11
Cat
ch (t
)
Net Line
Stock status of Queensland’s fisheries resources 2012 63
Figure 54: East coast Spotted Mackerel age frequencies from 2008–09 to 2010–11.
0
10
20
30
40
50 2008 — 09Recreational
2008 — 09Commercial
0
10
20
30
40
50 2009 — 10 2009 — 10
0
10
20
30
40
50 2010 — 11
0 1 2 3 4 5 6 7 8 0 1 2 3 4 5 6 7 8
2010 — 11
Age Group (years)
Per
cent
age
of c
atch
Figure 55: East coast Spotted Mackerel estimates of total mortality for 2007–08 to 2010–11.
0.0
0.2
0.4
0.6
0.8
1.0
1.2
2007-2008 2008-2009 2009-2010 2010-2011
Performance Measure Threshold (2M)CommercialRecreational
Year
Tota
l Mor
talit
y R
ate
(Z)
Performance measures relating to catch and the TACC Future assessment needs were not triggered in 2011. Fisheries Queensland will
Long term biological monitoring of the stock proposed continue to monitor total catch and catch rates through
to continue in 2012. performance measures as they have been variable in the
last five to ten years.
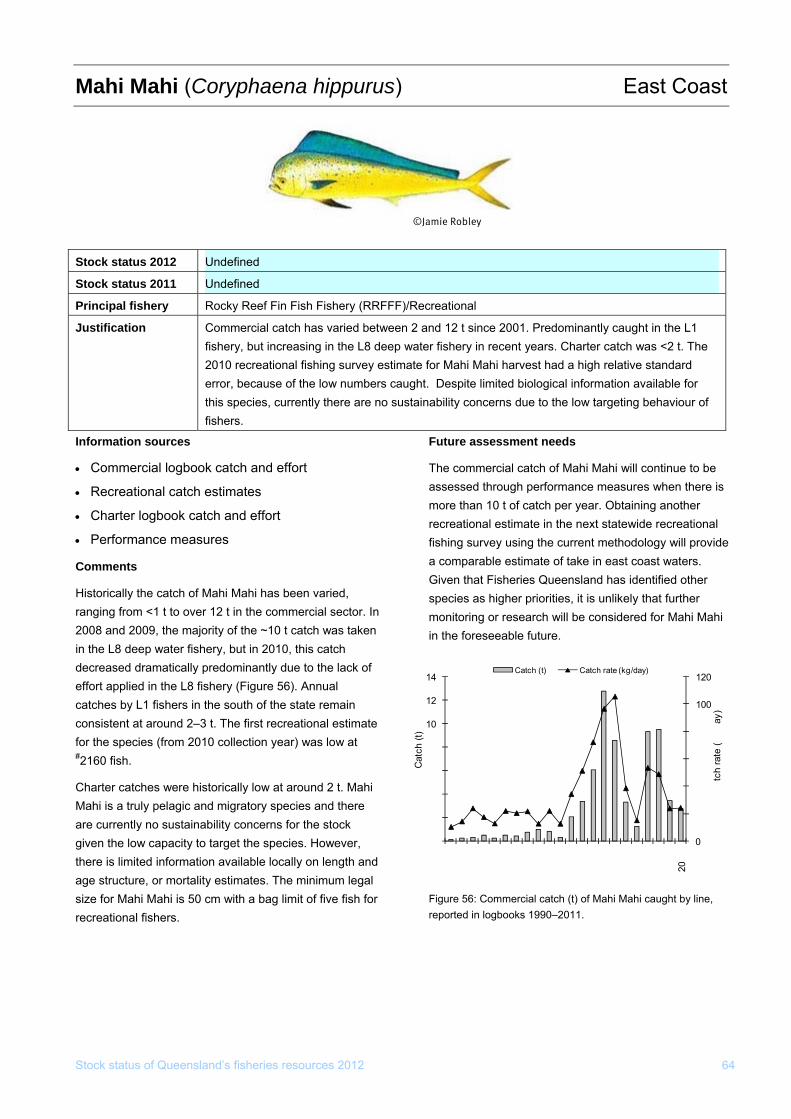
Mahi Mahi (Coryphaena hippurus) East Coast
Stock status of Queensland’s fisheries resources 2012 64
Stock status 2012 ndefined U
tock status 2011 S ndefined U
rincipal fisheryP ockyR Reef Fin Fish Fishery (RRFFF)/Recreational
Justification Commercial catch has varied between 2 and 12 t since 2001. Predominantly caught in the L1 fishery, but increasing in the L8 deep water fishery in recent years. Charter catch was <2 t. The 2010 recreational fishing survey estimate for Mahi Mahi harvest had a high relative standard error, because of the low numbers caught. Despite limited biological information available for this species, currently there are no sustainability concerns due to the low targeting behaviour of fishers.
Information sources
• Commercial logbook catch and effort
• Recreational catch estimates
• Charter logbook catch and effort
• Performance measures
Comments
Historically the catch of Mahi Mahi has been varied, ranging from <1 t to over 12 t in the commercial sector. In 2008 and 2009, the majority of the ~10 t catch was taken in the L8 deep water fishery, but in 2010, this catch decreased dramatically predominantly due to the lack of effort applied in the L8 fishery (Figure 56). Annual catches by L1 fishers in the south of the state remain consistent at around 2–3 t. The first recreational estimate for the species (from 2010 collection year) was low at #2160 fish.
Charter catches were historically low at around 2 t. Mahi Mahi is a truly pelagic and migratory species and there are currently no sustainability concerns for the stock given the low capacity to target the species. However, there is limited information available locally on length and age structure, or mortality estimates. The minimum legal size for Mahi Mahi is 50 cm with a bag limit of five fish for recreational fishers.
Future assessment needs
The commercial catch of Mahi Mahi will continue to be assessed through performance measures when there is more than 10 t of catch per year. Obtaining another recreational estimate in the next statewide recreational fishing survey using the current methodology will provide a comparable estimate of take in east coast waters. Given that Fisheries Queensland has identified other species as higher priorities, it is unlikely that further monitoring or research will be considered for Mahi Mahi in the foreseeable future.
reported in logbooks 1990–2011. Figure 56: Commercial catch (t) of Mahi Mahi caught by line,
20
40
60
80
0
2
4
6
8
1990
1991
1992
1993
1994
1995
1996
1997
1998
1999
2000
2001
2002
2003
2004
2005
2006
2007
2008
2009
2010 11
Ca
kg/d
©Jamie Robley
0
100
120
10
12
1420
tch
rate
(ay
)
Cat
ch (t
)
Catch (t) Catch rate (kg/day)

Octopus (Octopodidae) East Coast
Stock status 2012 Undefined
Stock status 2011 Undefined
Principal fishery East Coast Otter Trawl Fishery (ECOTF) / Fin Fish (Stout Whiting) Trawl Fishery (FFTF)
Justification There are several Octopus species which are permitted to be taken incidentally as byproduct in the ECOTF. In-possession limits apply to Octopus based on the number of days fished. The annual reported catch peaked in 1998, has been generally declining since, and was near to lowest historical levels in 2011. Numbers of boats reporting Octopus catch were stable at relatively low levels from 1990-1999, but legal recognition of Octopus as a permitted trawl byproduct species in 1999 greatly increased reporting incidence. Boat numbers reporting Octopus catches declined from 2001-08, but have stabilised since. There is evidence to suggest that octopuses may survive discarding. The recent ecological risk assessment found that at current fishing levels, there is a low to intermediate risk of Octopus stocks becoming overfished. The status of this species complex is undefined due to a lack of information on species composition of the catch and stock structure.
Species complex Octopus australis, Callistoctopus dierythraeus, Callistoctopus graptus, Amphioctopus marginatus, Amphioctopus cf kagoshimensis
Information sources increased in 2008 (to more than 66 litres in possession)
for fishing trips that extend beyond 7 consecutive days. • Commercial logbook catch and effort Average annual Octopus catch from 2009-11 in the
• Performance measures ECOTF is slightly higher than the 2008 catch, but still
• Published local and non-local biological information quite low. There is no evidence indicating that the 2008 • ECOTF ecological risk assessment change to management has resulted in significantly
Comments increased retention of Octopus.
Several species of Octopus are commercially harvested The number of ECOTF boats reporting Octopus catch
in small quantities as by-product in the ECOTF and the was relatively low from 1990-99, but permitting take of
FFTF which in 2011 landed 87% and 13% of the total Octopus as a byproduct of trawling for prawns and
Queensland Octopus harvest respectively. There is no scallops under the Trawl Plan in 1999 encouraged
notable recreational harvest of Octopus in Queensland. greater reporting of Octopus by more fishers; there was
Most Queensland Octopus are tropical species, but almost a threefold increase in fisher numbers reporting
southern Octopus (Octopus australis) is a temperate Octopus in their catch in 2001 compared to 1999
species taken in southern Queensland and is the most (Figure 57). Boat numbers reporting Octopus catches
common Octopus species taken in NSW. The steadily declined from 2001-08, but have been stable
Queensland harvest level was <10% of the NSW since, further indicating an absence of targeted trawling
Octopus harvest in 2010–11. The Queensland Octopus for Octopus since the 2008 possession limit increased.
catch peaked in 1998, but has generally decreased since About 80% of the Octopus catch in the ECOTF is taken 2001 (Figure 57). south of the Great Barrier Reef Marine Park (GBRMP).
The catch in 2011 was near to the lowest annual harvest The recent ECOTF ecological risk assessment found the
recorded. Management specific to the Queensland risk of Octopus stocks being overfished at 2010 effort
Octopus harvest was a 66 litre in-possession limit levels in the ECOTF south of the GBRMP was no more
introduced in the ECOTF in 2002. This catch limit was than intermediate (i.e. neither high nor low). The risk to Stock status of Queensland’s fisheries resources 2012 65
©NSW DPI
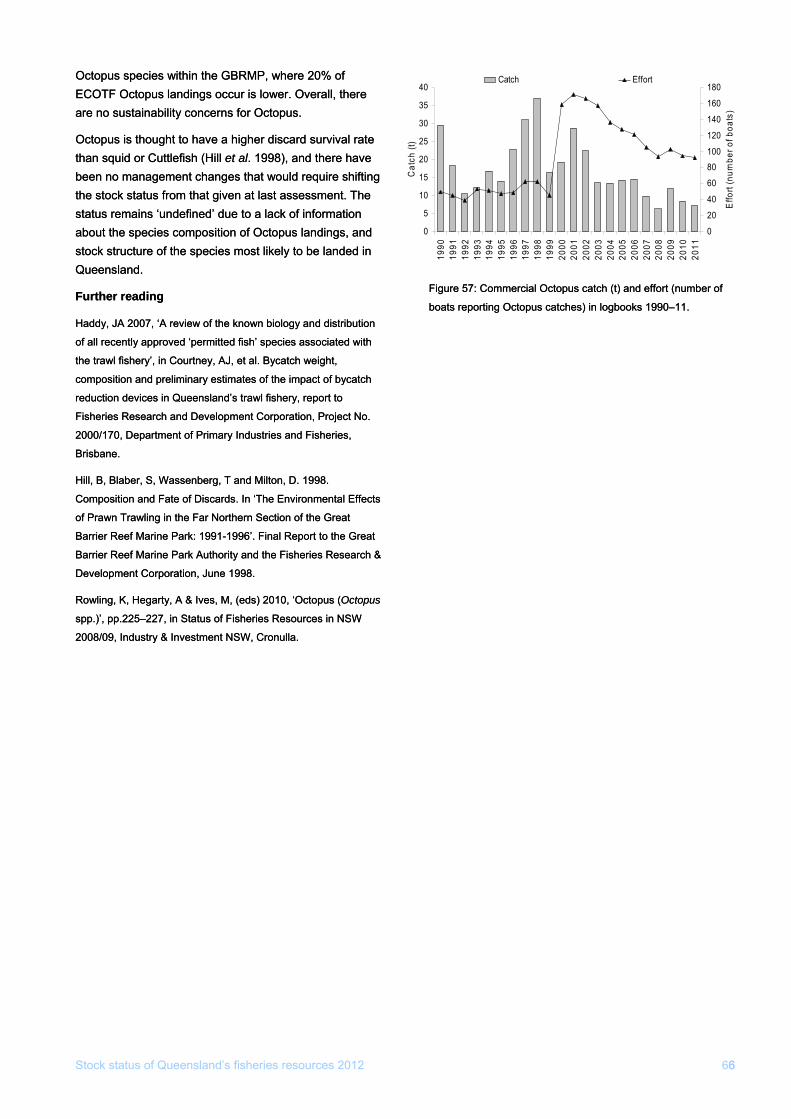
Octopus speciOctopus speciees s wwiitthhiinn the G the GBRMP, BRMP, wwhhere ere 20% of 20% of ECOTECOTFF Octopus lan Octopus landdinings ocgs occur cur is lois lowweer. Overall, therr. Overall, there e are no sustaare no sustaiinnabilabiliittyy c conceroncernnss for Octopus. for Octopus.
Octopus is thoOctopus is thought to havught to have a hige a higher discher discard ard survival ratsurvival ratee than squthan squiid or Cd or Cuuttlefish (Hittlefish (Hill ll etet al al. 1998), a. 1998), and nd there havthere have e beebeen no man no mananagemegemennt chant changgees that s that wwooululd requd require shiftinire shiftingg the stock status from that the stock status from that given at last assegiven at last assessment. ssment. TThe he status remains status remains ‘un‘undefindefineded’ du’ duee to a lack of informatio to a lack of informationn aboabout the speciut the speciees composs compositioitionn of Octopus lan of Octopus landdinings, and gs, and stock structure of the specistock structure of the speciees s most likelmost likely to by to bee lan landdeedd in in QueensQueenslaland. nd.
FurtheFurtherr re reaadding ing
HaddHaddyy,, JA 20 JA 2007, 07, ‘A review‘A review of the of the kno knowwn biologn biologyy a anndd distribution distribution
of all recentlof all recentlyy ap approved ‘permitteproved ‘permitted fish’ specied fish’ species associated ws associated wiith th
the trathe trawwl fisheryl fishery’’,, in Courtne in Courtneyy, AJ, , AJ, et al. Bet al. Byycatch catch wweeight, ight,
composition and preliminarcomposition and preliminaryy estim estimaates of the impact of btes of the impact of byycatch catch
reduction devices in Queensland’reduction devices in Queensland’s tras trawwl fisherl fisheryy,, r reeport to port to
Fisheries ResearFisheries Research and Developch and Developmment Corpent Corporatiooration, Project No. n, Project No.
2000/170, D2000/170, Deparepartment of Primartment of Primary y Industries and FiIndustries and Fisheries, sheries,
Brisbane. Brisbane.
Hill, B, Blaber, S, Wassenberg, T Hill, B, Blaber, S, Wassenberg, T and Milton, D. 19and Milton, D. 1998. 98.
Composition andComposition and Fate of Discards Fate of Discards.. In ‘The Environ In ‘The Environmmental Effects ental Effects
of Praof Prawwn n TraTrawwlinling in the Far g in the Far NortNorthern Section of thern Section of the Grhe Great eat
Barrier RBarrier Reef Marieef Marine Park: 1991ne Park: 1991-19-1996’. Final Report 96’. Final Report to the Great to the Great
Barrier RBarrier Reef Marieef Marine Park Authoritne Park Authority and the Fisheriey and the Fisheries Research & s Research &
Development CoDevelopment Corporation, June rporation, June 11998. 998.
RoRowwling, K, Hegling, K, Hegaartrtyy, A & Ives, M,, A & Ives, M, (eds) 2010, (eds) 2010, ‘Oct ‘Octopus (opus (OctopusOctopus
spp.)’, pp.225–2spp.)’, pp.225–227, in Status of F27, in Status of Fiisheries Resources in NSW sheries Resources in NSW
2008/09, Ind2008/09, Induustrstryy & Investment N & Investment NSSW, Cronulla. W, Cronulla.
Stock status of Queensland’s fisheries resources 2012 66
Figure 57: Commercial Octopus catch (t) and effort (number of
boats reporting Octopus catches) in logbooks 1990–11.
6
Figure 57: Commercial Octopus catch (t) and effort (number of
boats reporting Octopus catches) in logbooks 1990–11.
0
5
10
25
30
35
40
1990
1991
1992
1993
1994
1995
1996
1997
1998
1999
2000
2001
2002
2003
2004
2005
2006
2007
2008
2009
2010
2011
0
20
40
60
80
100
120
140
160
180
Effo
rt (n
umbe
r of b
oats
)
Catch Effort
15
20
Cat
ch (t
)
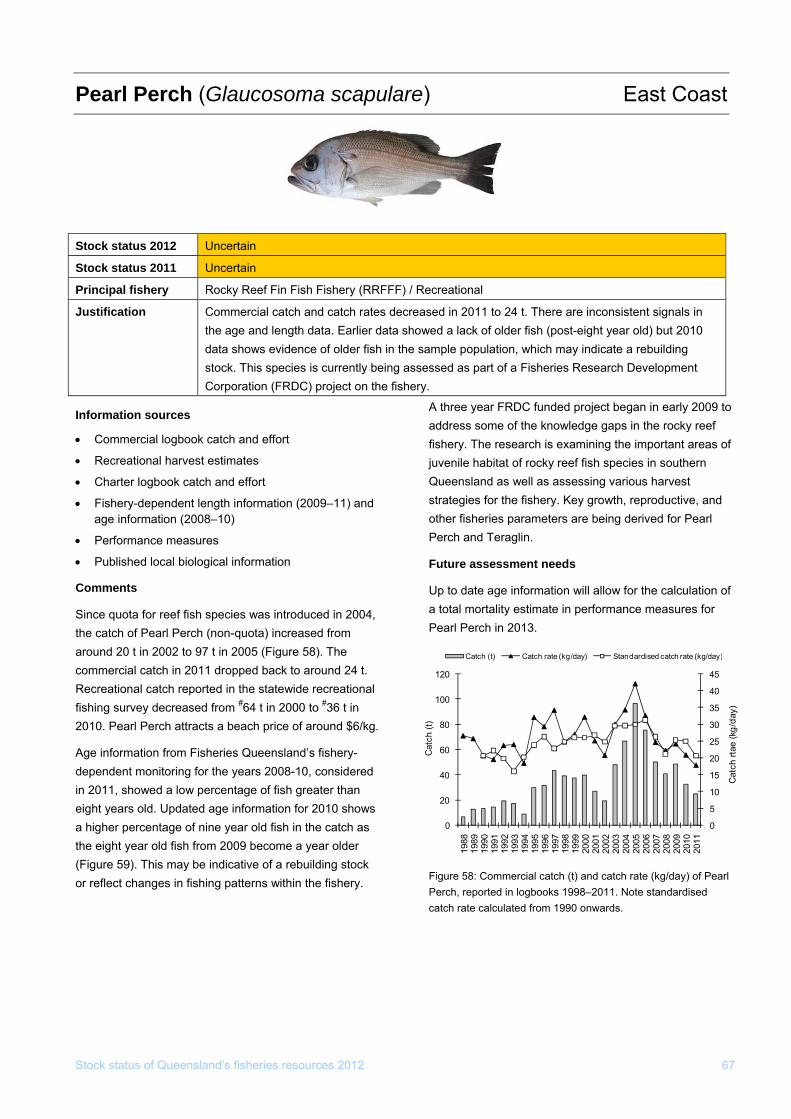
Stock status of Queensland’s fisheries resources 2012 67
) Pearl Perch (Glaucosoma scapulare East Coast
tock status 2012
S Uncertain
Stock status 2011 Uncertain
Principal fishery Rocky Reef Fin Fish Fishery (RRFFF) / Recreational
Justification Commercial catch and catch rates decreased in 2011 to 24 t. There are inconsistent signals in
the age and length data. Earlier data showed a lack of older fish (post-eight year old) but 2010data shows evidence of older fish in the sample population, which may indicate a rebuilding stock. This species is currently being assessed as part of a Fisheries Research DevelopmentCorporation (FRDC) project on the fishery.
Information sources
catch and effort
n (2009–11) and
local biological information
tional
dep nitoring for the years 2008-10, considered
as
to address some of the knowledge gaps in the rocky reef
ining the important areas of
nd
n of
Figure 58: Commercial catch (t) and catch rate (kg/day) of Pearl
• Commercial logbook
• Recreational harvest estimates
• Charter logbook catch and effort
• Fishery-dependent length informatioage information (2008–10)
• Performance measures
• Published
Comments
Since quota for reef fish species was introduced in 2004, the catch of Pearl Perch (non-quota) increased from around 20 t in 2002 to 97 t in 2005 (Figure 58). The commercial catch in 2011 dropped back to around 24 t. Recreational catch reported in the statewide recreafishing survey decreased from #64 t in 2000 to #36 t in 2010. Pearl Perch attracts a beach price of around $6/kg.
Age information from Fisheries Queensland’s fishery-endent mo
in 2011, showed a low percentage of fish greater than eight years old. Updated age information for 2010 shows a higher percentage of nine year old fish in the catch the eight year old fish from 2009 become a year older (Figure 59). This may be indicative of a rebuilding stock or reflect changes in fishing patterns within the fishery.
A three year FRDC funded project began in early 2009
fishery. The research is examjuvenile habitat of rocky reef fish species in southern Queensland as well as assessing various harvest strategies for the fishery. Key growth, reproductive, aother fisheries parameters are being derived for Pearl Perch and Teraglin.
Future assessment needs
Up to date age information will allow for the calculatioa total mortality estimate in performance measures for Pearl Perch in 2013.
Catch (t) Catch rate (kg/day) Standardised catch rate (kg/day)
0
5
10
15
20
25
30
35
40
45
0
20
40
60
80
100
120
1988
1989
1990
1991
1992
1993
1994
1995
1996
1997
1998
1999
2000
2001
2002
2003
2004
2005
2006
2007
2008
2009
2010
2011
Cat
ch rt
ae (k
g/da
y)
Cat
ch (t
)
Perch, reported in logbooks 1998–2011. Note standardised catch rate calculated from 1990 onwards.
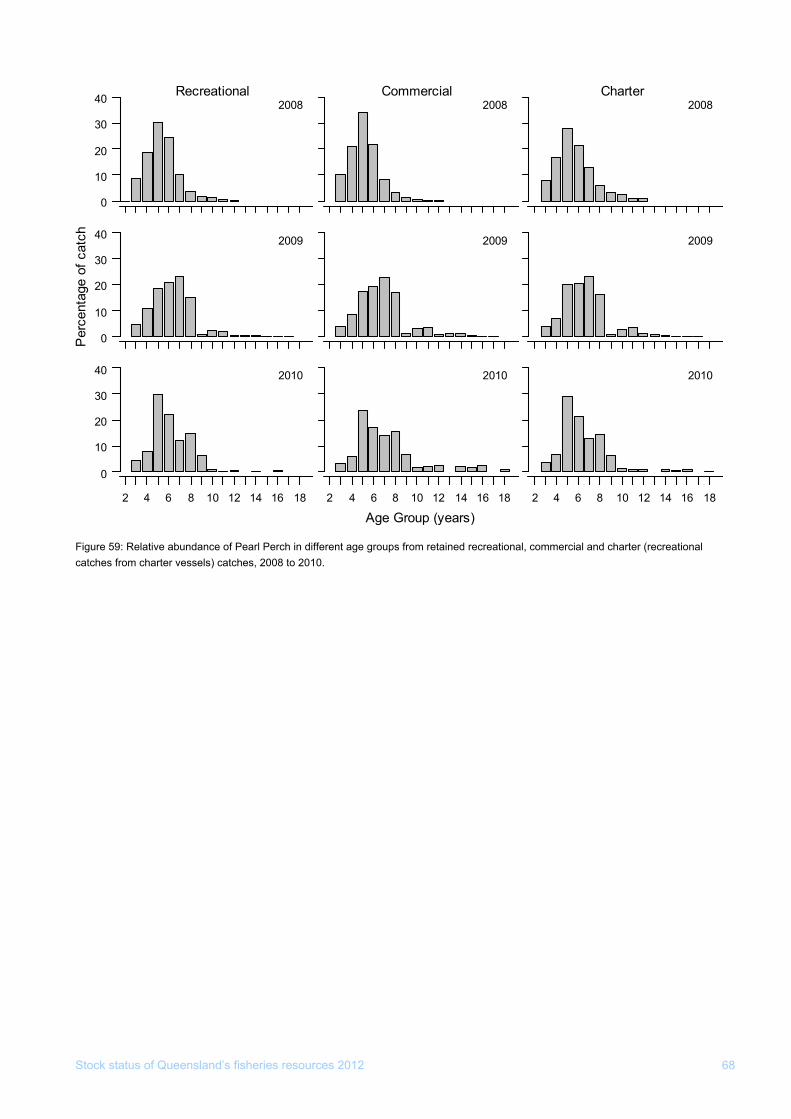
Stock status of Queensland’s fisheries resources 2012 68
unda reational esse
Figure 59: Relative abcatches from charter v
nce of Pearl Perch in different age groups from retained recreational, commercial and charter (recls) catches, 2008 to 2010.
0
10
20
30
200840 Recreational Commercial Charter2008 2008
30
40 2009 2009 2009
0
10
20
10 12 14 16 18
2010
2 4 6 8 10 12 14 16 18
2010
2 4 6 8 10 12 14 16 18
2
Age Group (years)
Per
cent
2 4 6 8
0
10
20
30
40 010
age
of
chca
t
Stock status of Queensland’s fisheries resources 2012 69
us merguiensis) East Coast Prawn–Banana (Fenneropenae
Stock status 2012 Sustainably fished
Stock status 2011 Sustainably fished
Principal fishery East Coast Otter Trawl Fishery (ECOTF) / River and Inshore Beam Trawl Fishery (RIBTF)
Justification icallyRecent catch and catch rates are at histor high levels but are considered to be sustainable TF ecological risk assessment determined that there was a at levels similar to 2004. The ECO
low risk of Banana Prawns being overfished at 2009 and 2010 effort levels. The 2011 catch was -term average catch and the highest on recordmore than double the long due to record rainfall
ensland coastal catchments. Determination of fishing power and stream flows in eastern Quechanges and standardisation of catch rate at a regional scale is needed for accurate interpretation of recent trends in commercial catch rate. Estimates of growth and mortality are also required to better model stock dynamics of east coast Banana Prawns.
recent ECOTF ecological risk assessment determined Information sources that there is a low risk of Banana Prawns being
• Commercial logbook catch and effort overfished at 2010 effort levels. While the 2011 harvest of • Recreational catch estimates 1367 t was the highest on record - more than doubling • Regional monthly age-structured model outputs (using the 1990–2010 catch average, and otter trawl effort
data to 2004) increasing steadily since 2007 - it is unlikely that the • Performance measures mature stock is at increased risk of overfishing. • Published local biological information Higher banana prawn catches often occur after • ECOTF ecological risk assessment exceptionally high rainfall and stream flow events. Those
Comments that occurred during the 2010–11 La Nina episode were among the highest on record and likely to have
Approximately 82% of commercial landings are taken by contributed to high emigration rates of Banana Prawns otter trawl, 16% are taken by beam trawling and 2% by from east coast estuaries to inshore waters where they stripe net. Otter trawl catch rates were relatively steady are targeted by otter trawlers. from 1990–2007 and then increased to their highest levels in 2008–11 (Figure 60). The beam trawl catch rate Future assessment needs
has been steadier over the time series but was somewhat Catch rate standardisation was carried out on 1988–2004 lower in 2011 because of fishing interference with flood trawl catch and effort data in the most recent stock debris. Stripe net catch rates were at record highs in assessment. It took into account likely differences 2010–11. The most recent catch weight estimate for between boats catching Banana Prawns and other prawn prawns taken by Queensland recreational fishers (i.e. species, but not the possibility that the fishing power of predominantly Banana Prawns taken in cast nets) was in individual boats could be increasing through time (as the range of 33–83 t in 2010 (Taylor et al. 2012). This is a demonstrated for other east coast trawl fishery sectors). 40% reduction from the 2001 recreational banana prawn This could affect banana prawn catchability and catch estimate (Lyle et al. 2003). potentially gear selectivity. Determination of changes in
An assessment of the stock indicated that in 2004 fishing power in the fleet and standardisation of catch rate
biomass was well above the level required for maximum at a regional scale is needed for years subsequent to
sustainable yield (Bmsy); and as such, the level of harvest 2004 for accurate interpretation of recent trends in
was considered sustainable. The commercial harvest commercial catch rate. It will also validate catch rate as a
remains less than the 2004 level in recent years. The consistently reliable indicator of relative abundance of
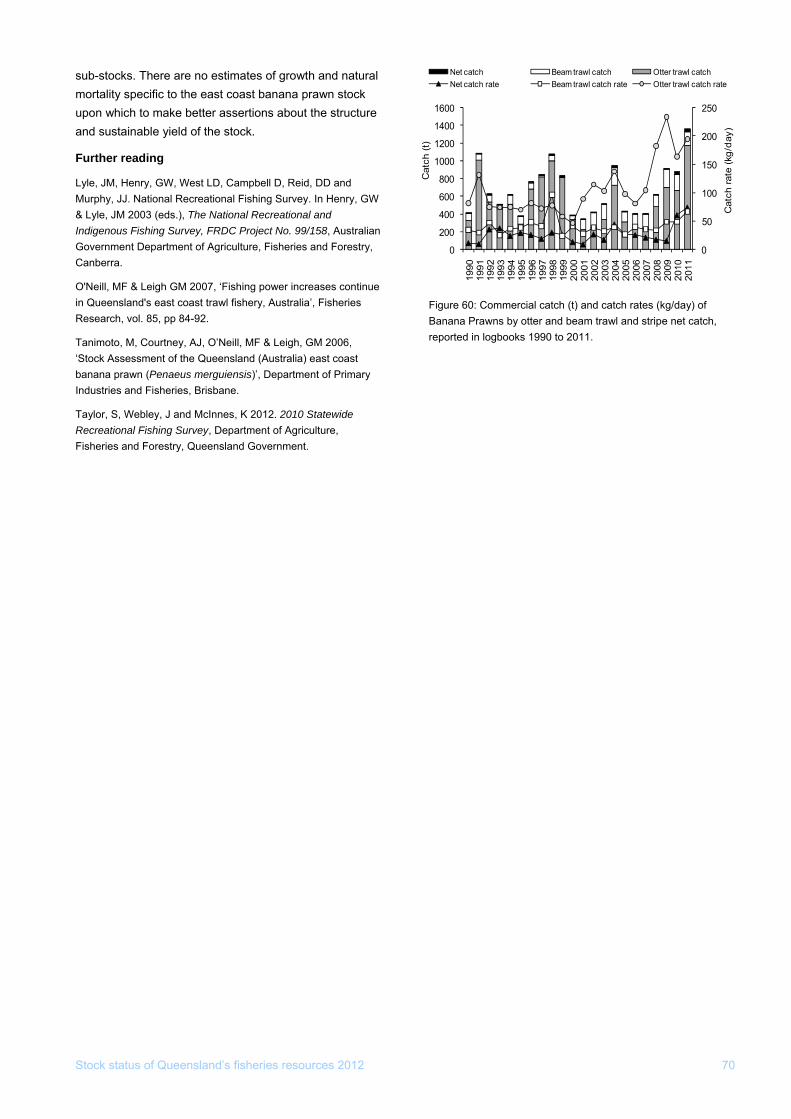
Stock status of Queensland’s fisheries resources 2012 70
sub-stocks. There are no estimates of growth and natural mortality specific to the east coast banana prawn stock upon which to make better assertions about the structure and sustainable yield of the stock.
Further reading
Lyle, JM, Henry, GW, West LD, Campbell D, Reid, DD and Murphy, JJ. National Recreational Fishing Survey. In Henry, GW & Lyle, JM 2003 (eds.), The National Recreational and Indigenous Fishing Survey, FRDC Project No. 99/158, Australian Government Department of Agriculture, Fisheries and Forestry, Canberra.
O'Neill, MF & Leigh GM 2007, ‘Fishing power increases continue in Queensland's east coast trawl fishery, Australia’, Fisheries Research, vol. 85, pp 84-92.
Tanimoto, M, Courtney, AJ, O’Neill, MF & Leigh, GM 2006, ‘Stock Assessment of the Queensland (Australia) east coast banana prawn (Penaeus merguiensis)’, Department of Primary Industries and Fisheries, Brisbane.
Taylor, S, Webley, J and McInnes, K 2012. 2010 Statewide Recreational Fishing Survey, Department of Agriculture, Fisheries and Forestry, Queensland Government.
h, Figure 60: Commercial catch (t) and catch rates (kg/day) of Banana Prawns by otter and beam trawl and stripe net catcreported in logbooks 1990 to 2011.
Net catch Beam trawl catch Otter trawl catchNet catch rate Beam trawl catch ra
0
50
100
150
200
0
200
400
600
800
1000
1200
1400
00
1990
1991
1992
1993
1994
1995
1996
1997
1998
1999
2000
2001
2002
2003
2004
2005
2006
2007
2008
2009
2010
2011
Cat
ch ra
te (k
g/da
y)
Cat
ch (t
)
25016
te Otter trawl catch rate
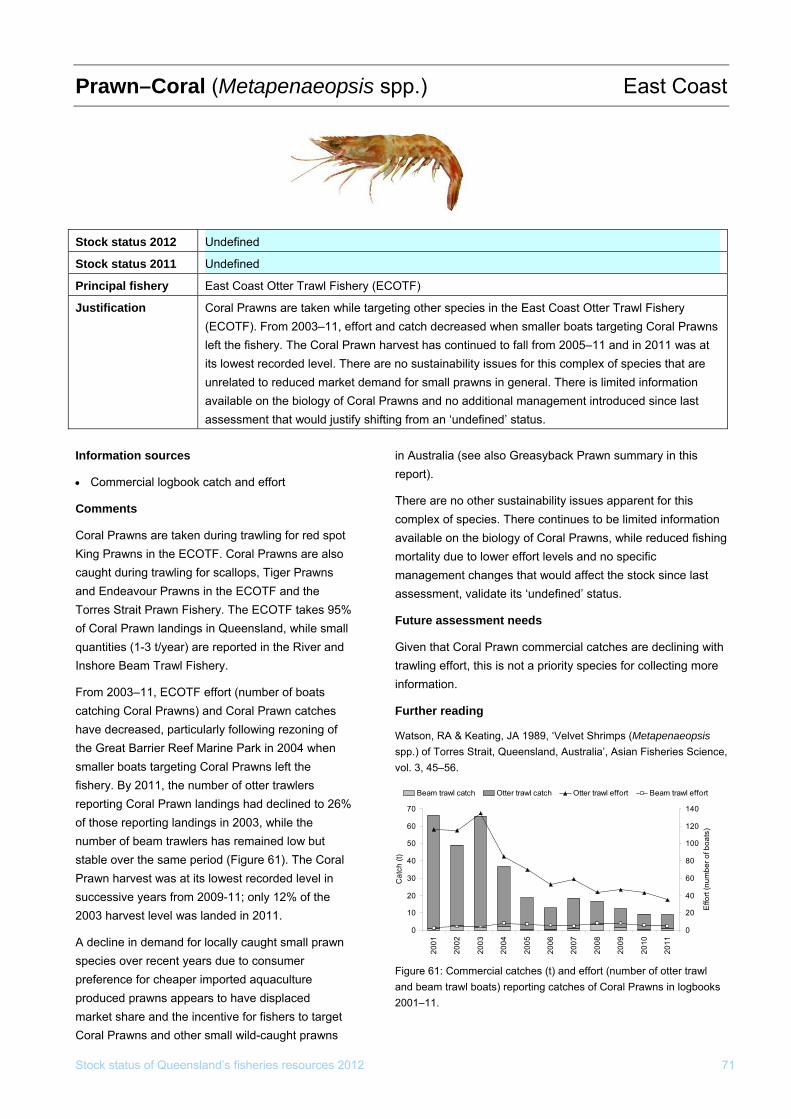
Prawn–Coral (Metapenaeopsis spp.)
Stock status of Queensland’s fisheries resources 2012 71
East Coast
Information sources
• Commercial logbook catch and effort
Comments
Coral Prawns are taken during trawling for red spot King Prawns in the ECOTF. Coral Prawns are also caught during trawling for scallops, Tiger Prawns and Endeavour Prawns in the ECOTF and the Torres Strait Prawn Fishery. The ECOTF takes 95% of Coral Prawn landings in Queensland, while small quantities (1-3 t/year) are reported in the River and Inshore Beam Trawl Fishery.
From 2003–11, ECOTF effort (number of boats catching Coral Prawns) and Coral Prawn catches have decreased, particularly following rezoning of the Great Barrier Reef Marine Park in 2004 when smaller boats targeting Coral Prawns left the fishery. By 2011, the number of otter trawlers reporting Coral Prawn landings had declined to 26% of those reporting landings in 2003, while the number of beam trawlers has remained low but stable over the same period (Figure 61). The Coral Prawn harvest was at its lowest recorded level in successive years from 2009-11; only 12% of the 2003 harvest level was landed in 2011.
A decline in demand for locally caught small prawn species over recent years due to consumer preference for cheaper imported aquaculture produced prawns appears to have displaced market share and the incentive for fishers to target Coral Prawns and other small wild-caught prawns
in Australia (see also Greasyback Prawn summary in this report).
There are no other sustainability issues apparent for this complex of species. There continues to be limited information
ing
management changes that would affect the stock since last assessment, validate its ‘undefined’ status.
Future assessment needs
Given that Coral Prawn commercial catches are declining with trawling effort, this is not a priority species for collecting more information.
Further reading
Watson, RA & Keating, JA 1989, ‘Velvet Shrimps (Metapenaeopsis spp.) of Torres Strait, Queensland, Australia’, Asian Fisheries Science, vol. 3, 45–56.
Figure 61: Commercial catches (t) and effort (number of otter trawl and beam trawl boats) reporting catches of Coral Prawns in logbooks 2001–11.
Stock status 2012 Undefined
Stock status 2011 Undefined
Principal fishery East Coast Otter Trawl Fishery (ECOTF)
Justification Coral Prawns are taken while targeting other species in the East Coast Otter Trawl Fishery (ECOTF). From 2003–11, effort and catch decreased when smaller boats targeting Coral Prawns left the fishery. The Coral Prawn harvest has continued to fall from 2005–11 and in 2011 was at its lowest recorded level. There are no sustainability issues for this complex of species that are unrelated to reduced market demand for small prawns in general. There is limited information available on the biology of Coral Prawns and no additional management introduced since last assessment that would justify shifting from an ‘undefined’ status.
available on the biology of Coral Prawns, while reduced fishmortality due to lower effort levels and no specific
Beam trawl catch Otter trawl catch Otter trawl effort Beam trawl effort
0
10
20
30
40
50
60
70
2001
2002
2003
2004
2005
2006
2007
2008
2009
2010
2011
Cat
ch (t
)
0
20
40
60
80
100
120
140
Effo
rt (n
umbe
r of b
oats
)
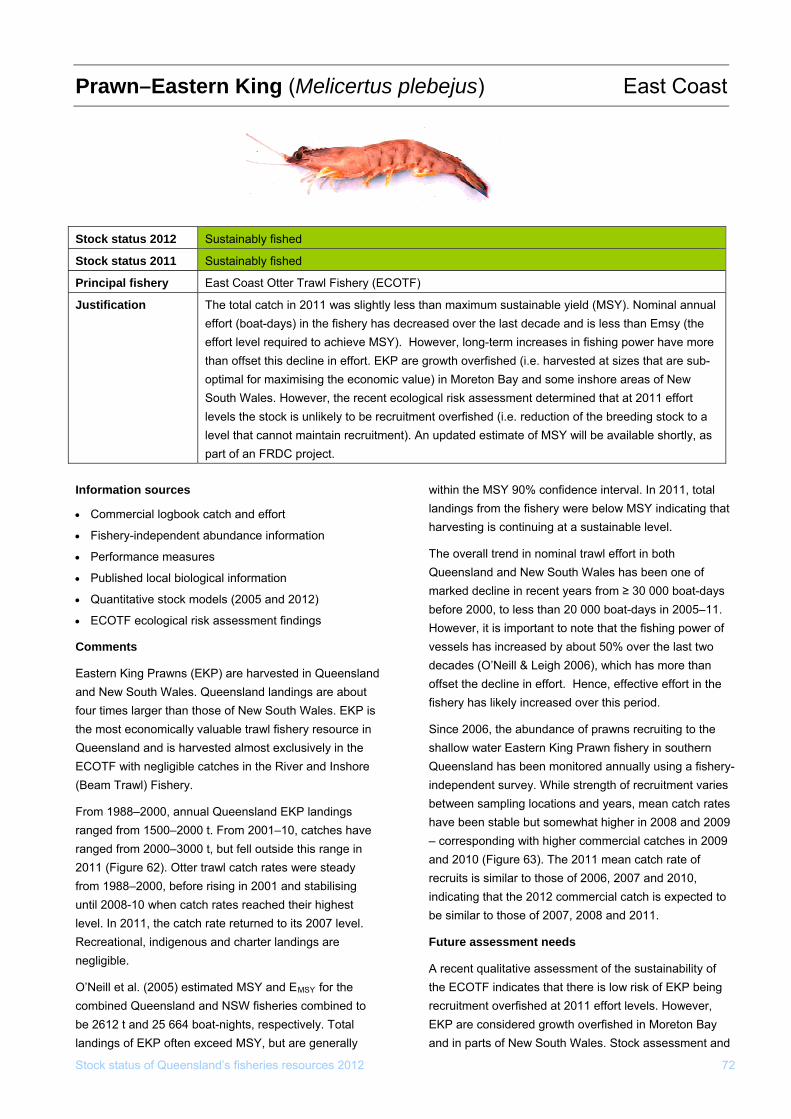
Stock status of Queensland’s fisheries resources 2012 72
Prawn–Eastern King (Melicertus plebejus) East Coast
Information sources within the MSY 90% confidence interval. In 2011, total
landings from the fishery were below MSY indicating that • Commercial logbook catch and effort harvesting is continuing at a sustainable level.
• Fishery-independent abundance information
• Performance measures The overall trend in nominal trawl effort in both Queensland and New South Wales has been one of • Published local biological information marked decline in recent years from ≥ 30 000 boat-days
• Quantitative stock models (2005 and 2012) before 2000, to less than 20 000 boat-days in 2005–11.
• ECOTF ecological risk assessment findings However, it is important to note that the fishing power of Comments vessels has increased by about 50% over the last two
decades (O’Neill & Leigh 2006), which has more than Eastern King Prawns (EKP) are harvested in Queensland
offset the decline in effort. Hence, effective effort in the and New South Wales. Queensland landings are about
fishery has likely increased over this period. four times larger than those of New South Wales. EKP is the most economically valuable trawl fishery resource in Since 2006, the abundance of prawns recruiting to the Queensland and is harvested almost exclusively in the shallow water Eastern King Prawn fishery in southern ECOTF with negligible catches in the River and Inshore Queensland has been monitored annually using a fishery-(Beam Trawl) Fishery. independent survey. While strength of recruitment varies
between sampling locations and years, mean catch rates From 1988–2000, annual Queensland EKP landings
have been stable but somewhat higher in 2008 and 2009 ranged from 1500–2000 t. From 2001–10, catches have
– corresponding with higher commercial catches in 2009 ranged from 2000–3000 t, but fell outside this range in
and 2010 (Figure 63). The 2011 mean catch rate of 2011 (Figure 62). Otter trawl catch rates were steady
recruits is similar to those of 2006, 2007 and 2010, from 1988–2000, before rising in 2001 and stabilising
indicating that the 2012 commercial catch is expected to until 2008-10 when catch rates reached their highest
be similar to those of 2007, 2008 and 2011. level. In 2011, the catch rate returned to its 2007 level. Recreational, indigenous and charter landings are Future assessment needs negligible. A recent qualitative assessment of the sustainability of O’Neill et al. (2005) estimated MSY and EMSY for the the ECOTF indicates that there is low risk of EKP being combined Queensland and NSW fisheries combined to recruitment overfished at 2011 effort levels. However, be 2612 t and 25 664 boat-nights, respectively. Total EKP are considered growth overfished in Moreton Bay landings of EKP often exceed MSY, but are generally and in parts of New South Wales. Stock assessment and
Stock status 2012 Sustainably fished
Stock status 2011 Sustainably fished
Principal fishery East Coast Otter Trawl Fishery (ECOTF)
Justification The total catch in 2011 was slightly less than maximum sustainable yield (MSY). Nominal annual effort (boat-days) in the fishery has decreased over the last decade and is less than Emsy (the effort level required to achieve MSY). However, long-term increases in fishing power have more than offset this decline in effort. EKP are growth overfished (i.e. harvested at sizes that are sub-optimal for maximising the economic value) in Moreton Bay and some inshore areas of New South Wales. However, the recent ecological risk assessment determined that at 2011 effort levels the stock is unlikely to be recruitment overfished (i.e. reduction of the breeding stock to a level that cannot maintain recruitment). An updated estimate of MSY will be available shortly, as part of an FRDC project.
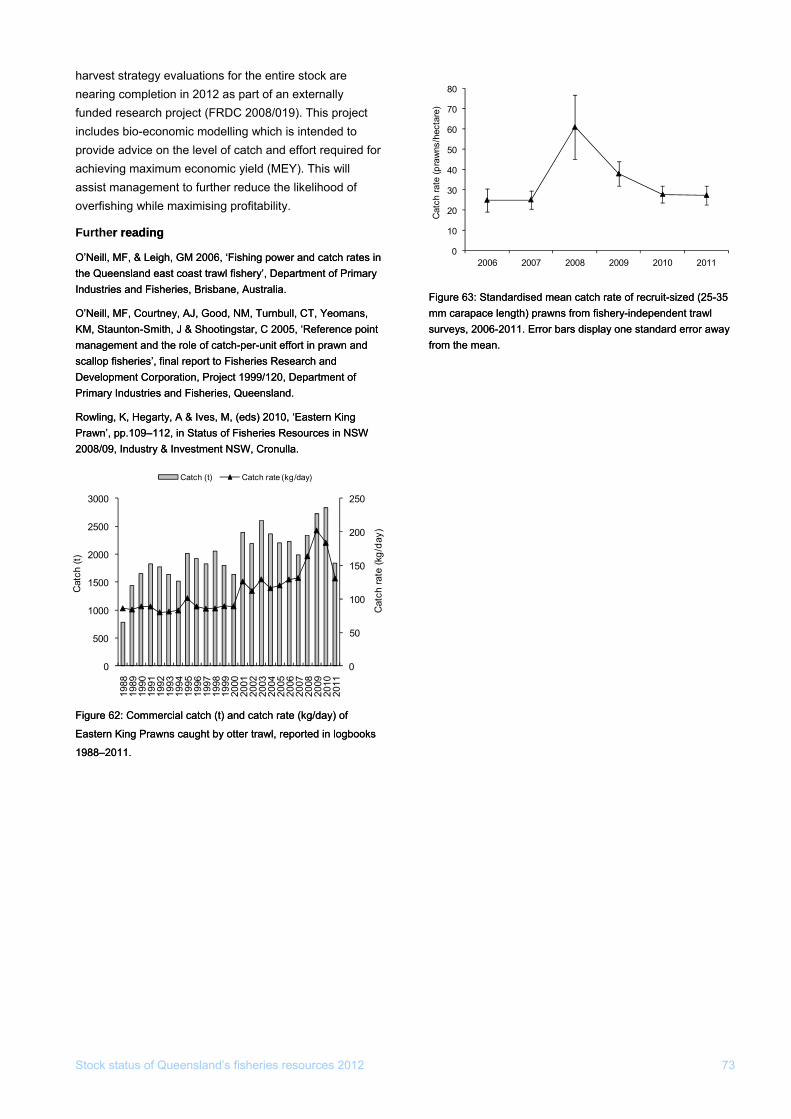
Stock status of Queensland’s fisheries resources 2012 73
ich is intended to the level of catch and effort required for
omic yield (MEY). This will
, & Leigh, GM 2006, ‘Fishing power and catch rates in the Queensland east coast trawl fishery’, Department of Primary
od, NM, Turnbull, CT, Yeomans, KM, Staunton-Smith, J & Shootingstar, C 2005, ‘Reference point
d
NSW
Figure 62: Commercial catch (t) and catch rate (kg/day) of
Eastern King Prawns caught by otter trawl, reported in logbooks
1988–2011.
y
, & Leigh, GM 2006, ‘Fishing power and catch rates in the Queensland east coast trawl fishery’, Department of Primary
od, NM, Turnbull, CT, Yeomans, KM, Staunton-Smith, J & Shootingstar, C 2005, ‘Reference point
d
eensland.
NSW
Figure 62: Commercial catch (t) and catch rate (kg/day) of
Eastern King Prawns caught by otter trawl, reported in logbooks
1988–2011.
y
harvest strategy evaluations for the entire stock are nearing completion in 2012 as part of an externally funded research project (FRDC 2008/019). This project includes bio-economic modelling wh
0
10
20
30
40
50
60
70
80
2006 2007 2008 2009 2010 2011
Cat
ch ra
te (p
raw
ns/h
ecta
re)
provide advice onachieving maximum econassist management to further reduce the likelihood ofoverfishing while maximising profitability.
Further reading
O’Neill, MF
r reading
O’Neill, MF
Industries and Fisheries, Brisbane, Australia.
O’Neill, MF, Courtney, AJ, Go
Industries and Fisheries, Brisbane, Australia.
O’Neill, MF, Courtney, AJ, Go
management and the role of catch-per-unit effort in prawn anscallop fisheries’, final report to Fisheries Research and Development Corporation, Project 1999/120, Department of Primary Industries and Fisheries, Qu
management and the role of catch-per-unit effort in prawn anscallop fisheries’, final report to Fisheries Research and Development Corporation, Project 1999/120, Department of Primary Industries and Fisheries, Queensland.
Rowling, K, Hegarty, A & Ives, M, (eds) 2010, ‘Eastern King Prawn’, pp.109–112, in Status of Fisheries Resources in 2008/09, Industry & Investment NSW, Cronulla.
Rowling, K, Hegarty, A & Ives, M, (eds) 2010, ‘Eastern King Prawn’, pp.109–112, in Status of Fisheries Resources in 2008/09, Industry & Investment NSW, Cronulla.
Figure 63: Standardised mean catch rate of recruit-sized (25-35 mm carapace length) prawns from fishery-independent trawl surveys, 2006-2011. Error bars display one standard error awafrom the mean.
Figure 63: Standardised mean catch rate of recruit-sized (25-35 mm carapace length) prawns from fishery-independent trawl surveys, 2006-2011. Error bars display one standard error awafrom the mean.
Catch (t) Catch rate (kg/day)
0
50
100
150
200
250
0
500
1000
1500
2000
2500
3000
1988
1989
1990
1991
1992
1993
1994
1995
1996
1997
1998
1999
2000
2001
2002
2003
2004
2005
2006
2007
2008
2009
2010
2011
Cat
ch ra
te (k
g/da
y)
Cat
ch (t
)
Stock status of Queensland’s fisheries resources 2012 74
ri and M. ensis) Prawn–Endeavour (Metapenaeus endeavou East Coast
Information sources reflect reduced targeted fishing for Endeavour Prawns
due to the lower returns fishers receive compared to • Commercial logbook catch and effort Tiger Prawns.
• Fishery-independent abundance information
• Performance measures The recent ECOTF ecological risk assessment also found that there is a low risk of Endeavour Prawns being • Published local biological information overfished at 2011 effort levels. The catch rate is
• Quantitative stock models (2004) considered to be between MEY and MSY. While
• ECOTF ecological risk assessment Endeavour Prawn stocks are biologically underutilised, it Comments may not be economically viable to increase effort further;
more effort in this fishery would put additional pressure The average annual harvest of Endeavour Prawns in
on Tiger Prawns which are often caught with Endeavour recent years (2007-11) was 548 t which is half of the long
Prawns. term catch average of 1107 t, indicating a reduced level of fishing mortality. Fishing effort associated with the On the basis of the evidence provided above, the stock is harvest of this catch (8638 days) is only 33 percent of the classified as sustainably fished. long term average of 26,119 days. This level of effort is Future assessment needs unlikely to cause the stock to become recruitment overfished. Uncertainty exists regarding Endeavour Prawn species
composition in the ECOTF as the species are not Since 1998, there has been a general upward trend in the separated in the logbook. Preliminary data from fishery-unstandardised CPUE (Figure 64). The average annual independent monitoring indicates that blue Endeavour CPUE for recent years, 63 kg/day, is about 44 percent Prawns are more abundant (~90%) in more northerly higher than the 1990–2006 long term average. Low waters (Torres Strait to Cape Flattery) while red harvest and effort and high catch rate are evidence of a Endeavour Prawns are more abundant (~60%) in more low fishing mortality and under these circumstances, southerly waters (Cairns to Cape Bowling Green). Further recruitment overfishing is unlikely. biological data collection would be of value to interpret While there was an increasing catch rate trend from with greater certainty the composition of Endeavour 2001–09, catch rates declined in 2010–11. This may Prawn species harvested at different locations and times.
Stock status 2012 Not fully utilised
Stock status 2011 Not fully utilised
Principal fishery East Coast Otter Trawl Fishery (ECOTF)
Justification Two species were considered in this assessment but landings are dominated (~80%) by Blue Endeavour Prawns (Metapenaeus endeavouri). Low harvest and effort and high catch rate levels over recent years indicate that fishing mortality is low and recruitment overfishing is unlikely. A recent ecological risk assessment found Endeavour Prawns are at low risk of being overfished at current effort levels. A stock status of sustainably fished was assigned on the basis that the stock is underutilised as it was in 2011, but because Endeavour Prawns are often caught with Tiger Prawns, an increase in effort targeting Endeavour Prawns would invariably lead to an increase in fishing pressure on the Tiger Pra k. This could potentially lead to a lower wn stoceconomic yield from the Tiger Prawn stock and a sub-optimal outcome.
Species complex Blue Endeavour Prawn (Metapenaeus endeavouri), Red Endeavour Prawn (Metapenaeus ensis)
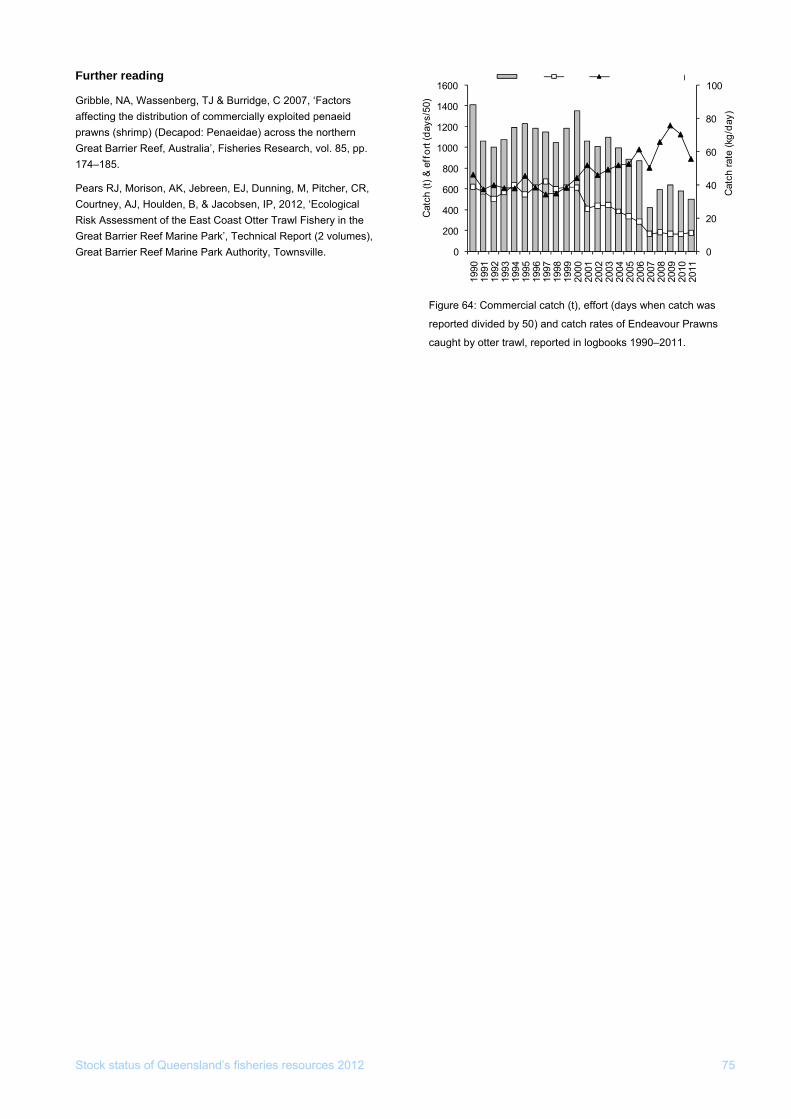
Stock status of Queensland’s fisheries resources 2012 75
Further reading
Gribble, NA, Wassenberg, TJ & Burridge, C 2007, ‘Factors affecting the distribution of commercially exploited penaeid prawns (shrimp) (Decapod: Penaeidae) across the northern Great Barrier Reef, Australia’, Fisheries Research, vol. 85, pp. 174–185.
Pears RJ, Morison, AK, Jebreen, EJ, Dunning, M, Pitcher, CR, Courtney, AJ, Houlden, B, & Jacobsen, IP, 2012, ‘Ecological Risk Assessment of the East Coast Otter Trawl Fishery in the Great Barrier Reef Marine Park’, Technical Report (2 volumes), Great Barrier Reef Marine Park Authority, Townsville.
Figure 64: Commercial catch (t), effort (days when catch was
reported divided by 50) and catch rates of Endeavour Prawns
caught by otter trawl, reported in logbooks 1990–2011.
0
20
40
60
80
0
200
400
600
800
1000
1200
1400
1990
1991
1992
1993
1994
1995
1996
1997
1998
1999
2000
2001
2002
2003
2004
2005
2006
2007
2008
2009
2010
2011
Cat
ch ra
te (k
g/da
y)
Cat
ch (t
) & e
ffor
t (da
ys/5
0
1001600
)
Catch Effort Catch Rate (kg/day)
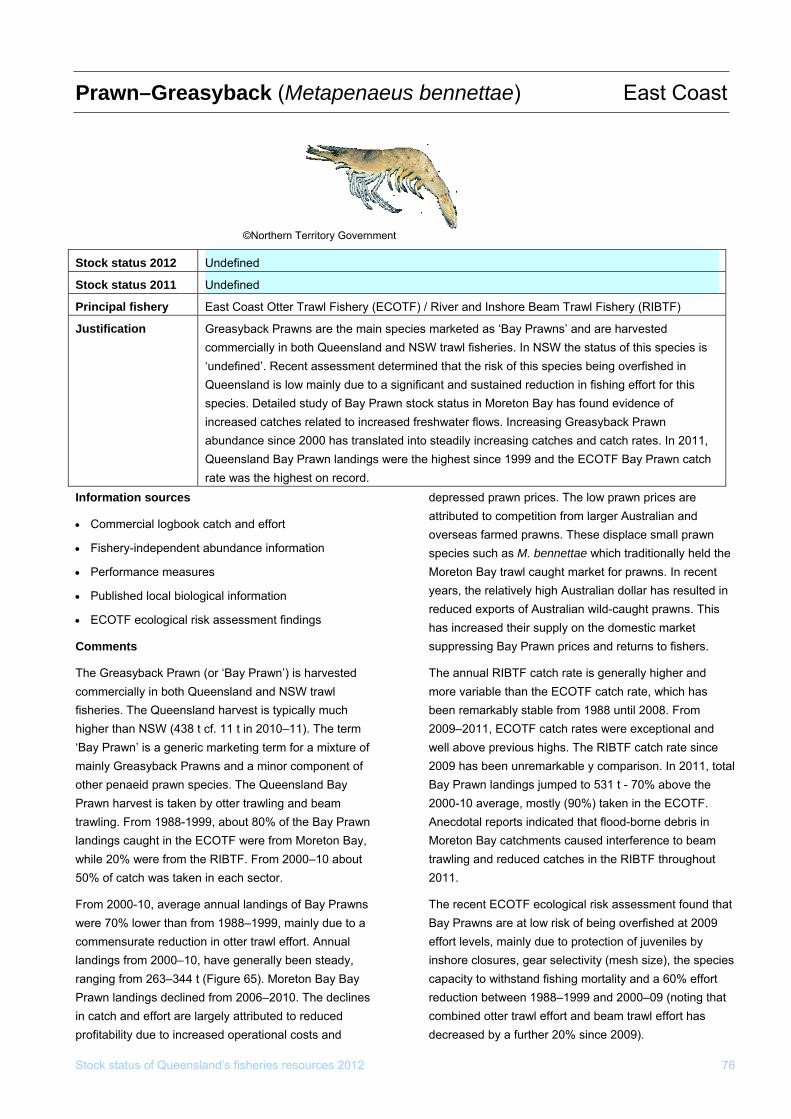
Stock status of Queensland’s fisheries resources 2012 76
naeus bennettae) East Coast Prawn–Greasyback (Metape
©Northern Territory Government
Stock status 2012 Undefined
Stock status 2011 Undefined
Principal fishery East Coast Otter Trawl Fishery (ECOTF) / River and Inshore Beam Trawl Fishery (RIBTF)
Justification Greasyback Prawns are the main species marketed as ‘Bay Prawns’ and are harvested commercially in both Queenslan W trawl fisheried and NS s. In NSW the status of this species is ‘undefined’. Recent assessment determined that the risk of this species being overfished in Queensland is low mainly due ant to a signific and sustained reduction in fishing effort for this species. Detailed study of Bay Prawn stock status in Moreton Bay has found evidence of increased catches related to i shncreased fre water flows. Increasing Greasyback Prawn
lated into steadily increasing catches and catch rates. In 2011, abundance since 2000 has transQueensland Bay Prawn landings were the highest since 1999 and the ECOTF Bay Prawn catch rate was the highest on record.
Information sources depressed prawn prices. The low prawn prices are attributed to competition from larger Australian and
• Commercial logbook catch and effort overseas farmed prawns. These displace small prawn
• Fishery-independent abundance information species such as M. bennettae which traditionally held the • Performance measures Moreton Bay trawl caught market for prawns. In recent
• years, the relatively high Australian dollar has resulted in Published local biological information reduced exports of Australian wild-caught prawns. This
• ECOTF ecological risk assessment findings has increased their supply on the domestic market Comments suppressing Bay Prawn prices and returns to fishers.
The Greasyback Prawn (or ‘Bay Prawn’) is harvested The annual RIBTF catch rate is generally higher and commercially in both Queensland and NSW trawl more variable than the ECOTF catch rate, which has fisheries. The Queensland harvest is typically much been remarkably stable from 1988 until 2008. From higher than NSW (438 t cf. 11 t in 2010–11). The term 2009–2011, ECOTF catch rates were exceptional and ‘Bay Prawn’ is a generic marketing term for a mixture of well above previous highs. The RIBTF catch rate since mainly Greasyback Prawns and a minor component of 2009 has been unremarkable y comparison. In 2011, total other penaeid prawn species. The Queensland Bay Bay Prawn landings jumped to 531 t - 70% above the Prawn harvest is taken by otter trawling and beam 2000-10 average, mostly (90%) taken in the ECOTF. trawling. From 1988-1999, about 80% of the Bay Prawn Anecdotal reports indicated that flood-borne debris in landings caught in the ECOTF were from Moreton Bay, Moreton Bay catchments caused interference to beam while 20% were from the RIBTF. From 2000–10 about trawling and reduced catches in the RIBTF throughout 50% of catch was taken in each sector. 2011.
From 2000-10, average annual landings of Bay Prawns The recent ECOTF ecological risk assessment found that were 70% lower than from 1988–1999, mainly due to a Bay Prawns are at low risk of being overfished at 2009 commensurate reduction in otter trawl effort. Annual effort levels, mainly due to protection of juveniles by landings from 2000–10, have generally been steady, inshore closures, gear selectivity (mesh size), the species ranging from 263–344 t (Figure 65). Moreton Bay Bay capacity to withstand fishing mortality and a 60% effort Prawn landings declined from 2006–2010. The declines reduction between 1988–1999 and 2000–09 (noting that in catch and effort are largely attributed to reduced combined otter trawl effort and beam trawl effort has profitability due to increased operational costs and decreased by a further 20% since 2009).
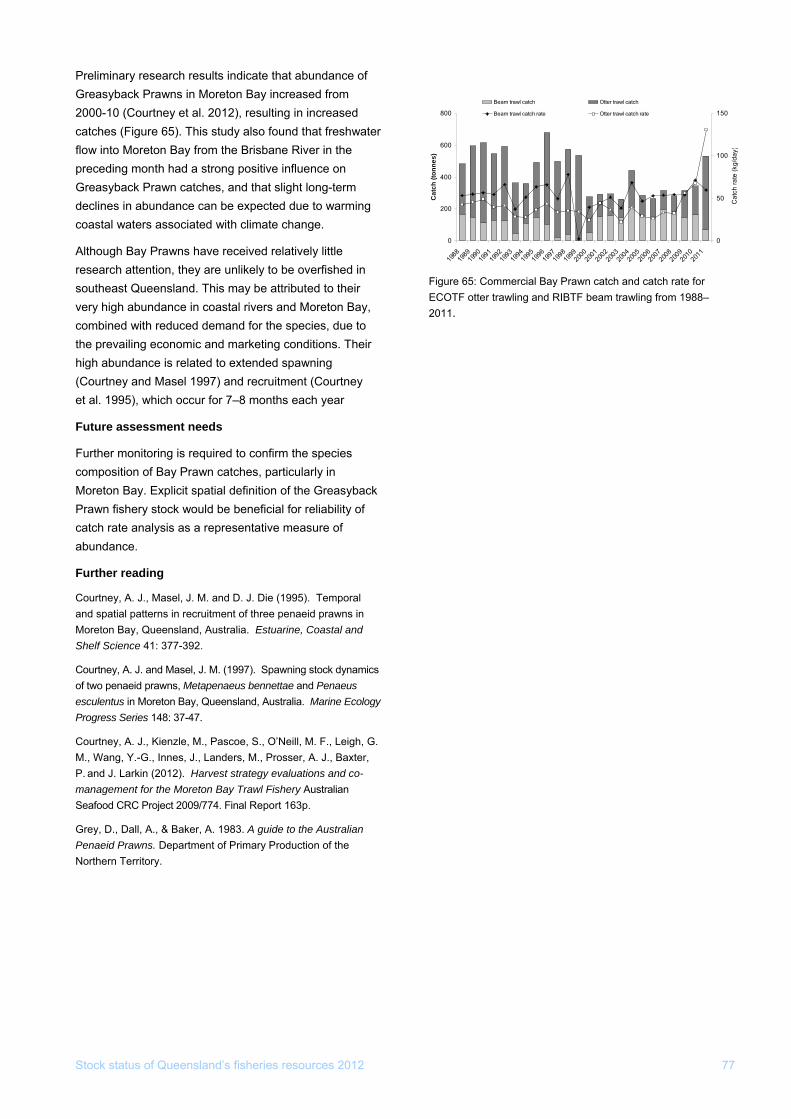
Stock status of Queensland’s fisheries resources 2012 77
Figure 65: Commercial Bay Prawn catch and catch rate for ECOTF otter trawling and RIBTF beam trawling from 1988–
Preliminary research results indicate that abundance of Greasyback Prawns in Moreton Bay increased from 2000-10 (Courtney et al. 2012), resulting in increased catches (Figure 65). This study also found that freshwater flow into Moreton Bay from the Brisbane River in the preceding month had a strong positive influence on Greasyback Prawn catches, and that slight long-term declines in abundance can be expected due to warming coastal waters associated with climate change.
Although Bay Prawns have received relatively little research attention, they are unlikely to be overfished in southeast Queensland. This may be attributed to their very high abundance in coastal rivers and Moreton Bay, combined with reduced demand for the species, due to the prevailing economic and marketing conditions. Their high abundance is related to extended spawning (Courtney and Masel 1997) and recruitment (Courtney et al. 1995), which occur for 7–8 months each year
Future assessment needs
Further monitoring is required to confirm the species composition of Bay Prawn catches, particularly in Moreton Bay. Explicit spatial definition of the Greasyback Prawn fishery stock would be beneficial for reliability of catch rate analysis as a representative measure of abundance.
Further reading
Courtney, A. J., Masel, J. M. and D. J. Die (1995). Temporal and spatial patterns in recruitment of three penaeid prawns in Moreton Bay, Queensland, Australia. Estuarine, Coastal and Shelf Science 41: 377-392.
Courtney, A. J. and Masel, J. M. (1997). Spawning stock dynamics of two penaeid prawns, Metapenaeus bennettae and Penaeus esculentus in Moreton Bay, Queensland, Australia. Marine Ecology Progress Series 148: 37-47.
Courtney, A. J., Kienzle, M., Pascoe, S., O’Neill, M. F., Leigh, G. M., Wang, Y.-G., Innes, J., Landers, M., Prosser, A. J., Baxter, P. and J. Larkin (2012). Harvest strategy evaluations and co-management for the Moreton Bay Trawl Fishery Australian Seafood CRC Project 2009/774. Final Report 163p.
Grey, D., Dall, A., & Baker, A. 1983. A guide to the Australian Penaeid Prawns. Department of Primary Production of the Northern Territory.
2011.
0
200
400
600
800
1988
1989
1990
1991
1992
1993
1994
1995
1996
1997
1998
1999
2000
2001
2002
2003
2004
2005
2006
2007
2008
2009
2010
2011
Cat
ch (t
onne
s)
0
50
100
150
Cat
ch ra
te (k
g/da
y
Beam trawl catch Otter trawl catch
Beam trawl catch rate Otter trawl catch rate
)
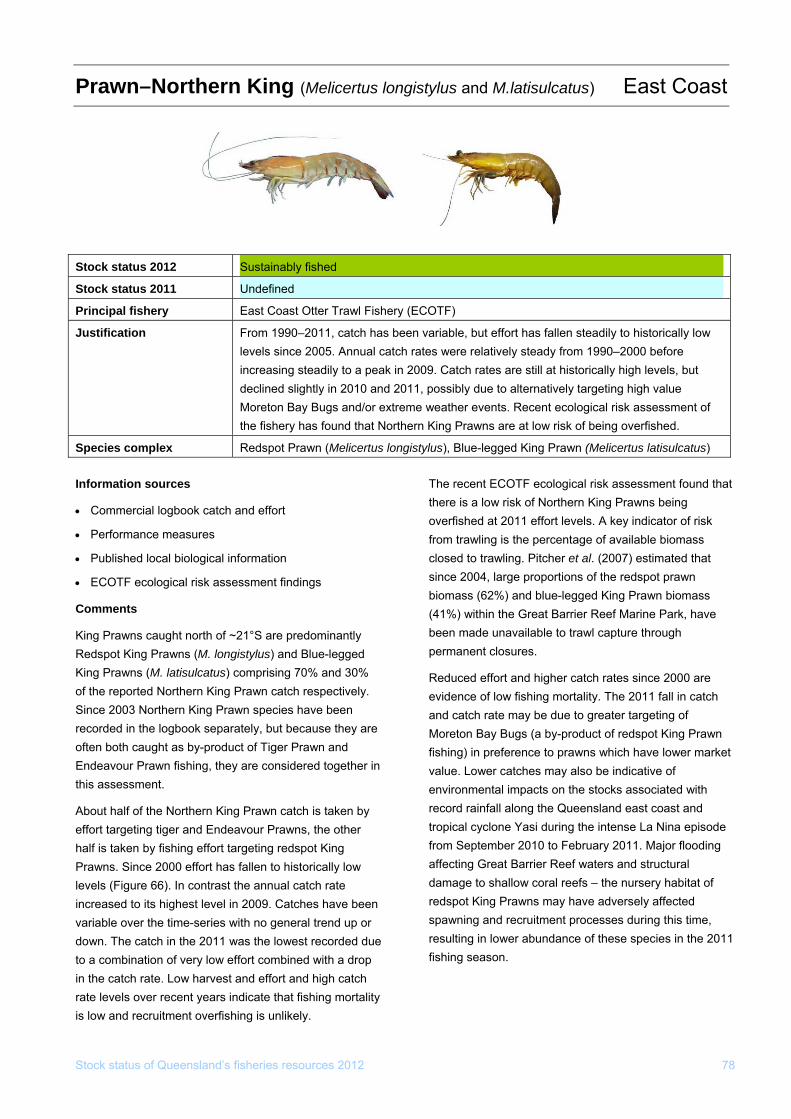
Stock status of Queensland’s fisheries resources 2012 78
(Melicertus longistylus and M.latisulcatus) East Coast Prawn–Northern King
Information sources The recent ECOTF ecological risk assessment found that
there is a low risk of Northern King Prawns being • Commercial logbook catch and effort
overfished at 2011 effort levels. A key indicator of risk • Performance measures from trawling is the percentage of available biomass • Published local biological information closed to trawling. Pitcher et al. (2007) estimated that
• since 2004, large proportions of the redspot prawn ECOTF ecological risk assessment findings biomass (62%) and blue-legged King Prawn biomass
Comments (41%) within the Great Barrier Reef Marine Park, have
King Prawns caught north of ~21°S are predominantly been made unavailable to trawl capture through
Redspot King Prawns (M. longistylus) and Blue-legged permanent closures.
King Prawns (M. latisulcatus) comprising 70% and 30% Reduced effort and higher catch rates since 2000 are of the reported Northern King Prawn catch respectively. evidence of low fishing mortality. The 2011 fall in catch Since 2003 Northern King Prawn species have been and catch rate may be due to greater targeting of recorded in the logbook separately, but because they are Moreton Bay Bugs (a by-product of redspot King Prawn often both caught as by-product of Tiger Prawn and fishing) in preference to prawns which have lower market Endeavour Prawn fishing, they are considered together in value. Lower catches may also be indicative of this assessment. environmental impacts on the stocks associated with
About half of the Northern King Prawn catch is taken by record rainfall along the Queensland east coast and
effort targeting tiger and Endeavour Prawns, the other tropical cyclone Yasi during the intense La Nina episode
half is taken by fishing effort targeting redspot King from September 2010 to February 2011. Major flooding
Prawns. Since 2000 effort has fallen to historically low affecting Great Barrier Reef waters and structural
levels (Figure 66). In contrast the annual catch rate damage to shallow coral reefs – the nursery habitat of
increased to its highest level in 2009. Catches have been redspot King Prawns may have adversely affected
variable over the time-series with no general trend up or spawning and recruitment processes during this time,
down. The catch in the 2011 was the lowest recorded due resulting in lower abundance of these species in the 2011
to a combination of very low effort combined with a drop fishing season.
in the catch rate. Low harvest and effort and high catch rate levels over recent years indicate that fishing mortality is low and recruitment overfishing is unlikely.
Stock status 2012 Sustainably fished
Stock status 2011 Undefined
Principal fishery East Coast Otter Trawl Fishery (ECOTF)
Justification ariable, but effort has fallen steadily to historically lowFrom 1990–2011, catch has been v es were relatively steady from 1990–2000 before levels since 2005. Annual catch rat
increasing steadily to a peak in 2009. Catch rates are still at historically high levels, but declined slightly in 2010 and 2011, possibly due to alternatively targeting high value Moreton Bay Bugs and/or extreme weather events. Recent ecological risk assessment of the fishery has found that Northern King Prawns are at low risk of being overfished.
Species complex Redspot Prawn (Melicertus longistylus), Blue-legged King Prawn (Melicertus latisulcatus)

Stock status of Queensland’s fisheries resources 2012 79
(days
tes
Future assessment needs
Monitoring Northern King Prawn catch rates at several specific locations where they are known to be targeted may provide a useful index for interpreting whether large changes in catch rate are due to a change in abundance or to targeting other species (e.g. Moreton Bay Bugs). Recently there has been some research interest in environmental variables influencing the Northern King Prawn catch.
Further reading
Gribble, NA, Wassenberg, TJ and Burridge, C 2007, ‘Factors affecting the distribution of commercially exploited penaeid prawns (shrimp) (Decapod: Penaeidae) across the northern Great Barrier Reef’, Australia, Fisheries Research, vol. 85, pp 174–185.
Pears RJ, Morison, AK, Jebreen, EJ, Dunning, M, Pitcher, CR, Courtney, AJ, Houlden, B, & Jacobsen, IP, 2012, ‘Ecological Risk Assessment of the East Coast Otter Trawl Fishery in the Great Barrier Reef Marine Park’, Technical Report (2 volumes), Great Barrier Reef Marine Park Authority, Townsville.
Figure 66: Combined commercial catch (tonnes), effort
when catch was reported divided by 50) and catch ra
(kilograms per day) of Redspot and Blue-legged King Prawns
caught by otter trawl, reported in logbooks 1990–2011.
1604000
Catch Ef Catch rate (kg/day)fort (days/50)
0
20
40
60
80
100
120
140
0
500
1000
1500
2000
2500
3000
3500
1990
1991
1992
1993
1994
1995
1996
1997
1998
1999
2000
2001
2002
2003
2004
2005
2006
2007
2008
2009
2010
2011
Cat
ch ra
te (k
g/da
y)
Cat
ch (t
) & e
ffor
t (da
ys/5
0)
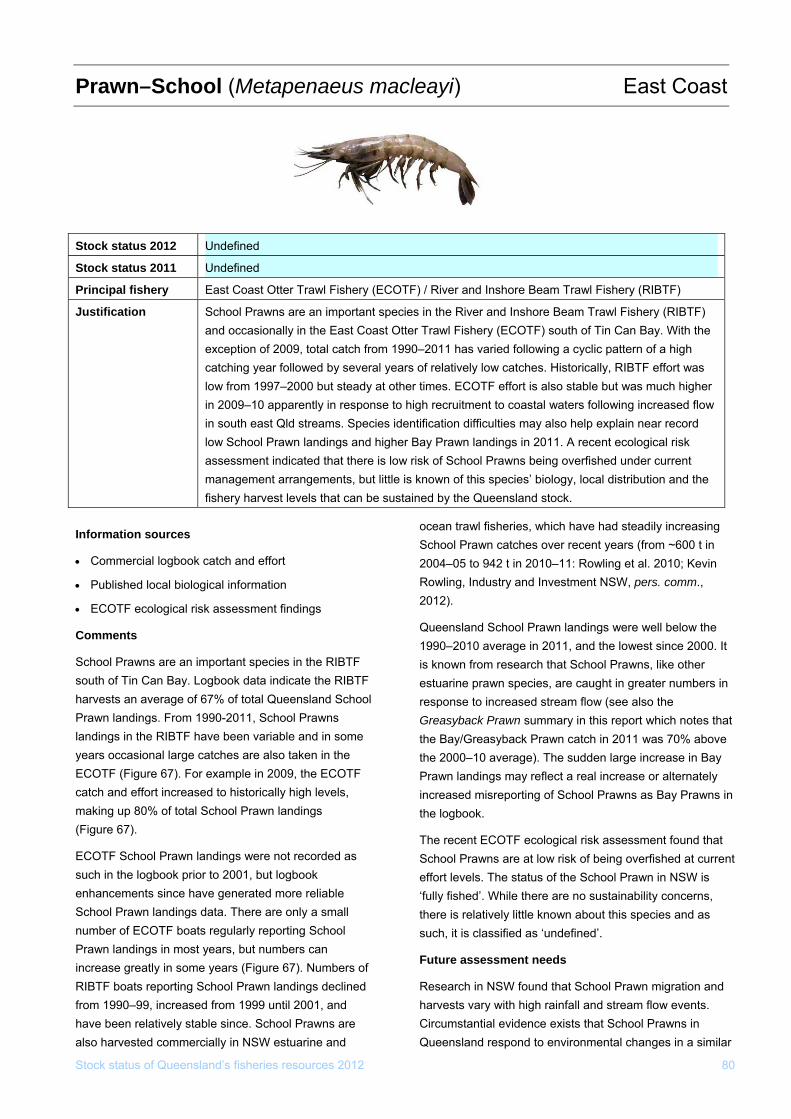
Stock status of Queensland’s fisheries resources 2012 80
acleayi) East Coast Prawn–School (Metapenaeus m
Stock status 2012 Undefined
Stock status 2011 Undefined
Principal fishery East Coast Otter Trawl Fishery (ECOTF) / River and Inshore Beam Trawl Fishery (RIBTF)
Justification School Prawns are an important species i iver and Inshore Beam Trawl Fishery (RIBTF)n the R and occasionally in the East Coast Otter Trawl Fishery (ECOTF) south of Tin Can Bay. With the exception of 2009, total catch from 1990–2011 has varied following a cyclic pattern of a high catching year followed by several years of relatively low catches. Historically, RIBTF effort was low from 1997–2000 but steady at other times. ECOTF effort is also stable but was much higher in 2009–10 apparently in response to high recruitment to coastal waters following increased flow in south east Qld streams. Species identification difficulties may also help explain near record low School Prawn landings and higher Bay Prawn landings in 2011. A recent ecological risk assessment indicated that there is low risk of School Prawns being overfished under current management arrangements, but little is known of this species’ biology, local distribution and the fishery harvest levels that can be sustained by the Queensland stock.
Information sources School Prawn catches over recent years (from ~600 t in
• Commercial logbook catch and effort 2004–05 to 942 t in 2010–11: Rowling et al. 2010; Kevin
• Published local biological information Rowling, Industry and Investment NSW, pers. comm., 2012).
• ECOTF ecological risk assessment findings Queensland School Prawn landings were well below the Comments 1990–2010 average in 2011, and the lowest since 2000. It
School Prawns are an important species in the RIBTF is known from research that School Prawns, like other south of Tin Can Bay. Logbook data indicate the RIBTF estuarine prawn species, are caught in greater numbers in harvests an average of 67% of total Queensland School response to increased stream flow (see also the Prawn landings. From 1990-2011, School Prawns Greasyback Prawn summary in this report which notes that landings in the RIBTF have been variable and in some the Bay/Greasyback Prawn catch in 2011 was 70% above years occasional large catches are also taken in the the 2000–10 average). The sudden large increase in Bay ECOTF (Figure 67). For example in 2009, the ECOTF Prawn landings may reflect a real increase or alternately catch and effort increased to historically high levels, increased misreporting of School Prawns as Bay Prawns in making up 80% of total School Prawn landings the logbook. (Figure 67).
The recent ECOTF ecological risk assessment found that ECOTF School Prawn landings were not recorded as School Prawns are at low risk of being overfished at current such in the logbook prior to 2001, but logbook effort levels. The status of the School Prawn in NSW is enhancements since have generated more reliable ‘fully fished’. While there are no sustainability concerns, School Prawn landings data. There are only a small there is relatively little known about this species and as number of ECOTF boats regularly reporting School such, it is classified as ‘undefined’. Prawn landings in most years, but numbers can
Future assessment needs increase greatly in some years (Figure 67). Numbers of RIBTF boats reporting School Prawn landings declined Research in NSW found that School Prawn migration and from 1990–99, increased from 1999 until 2001, and harvests vary with high rainfall and stream flow events. have been relatively stable since. School Prawns are Circumstantial evidence exists that School Prawns in also harvested commercially in NSW estuarine and Queensland respond to environmental changes in a similar
ocean trawl fisheries, which have had steadily increasing
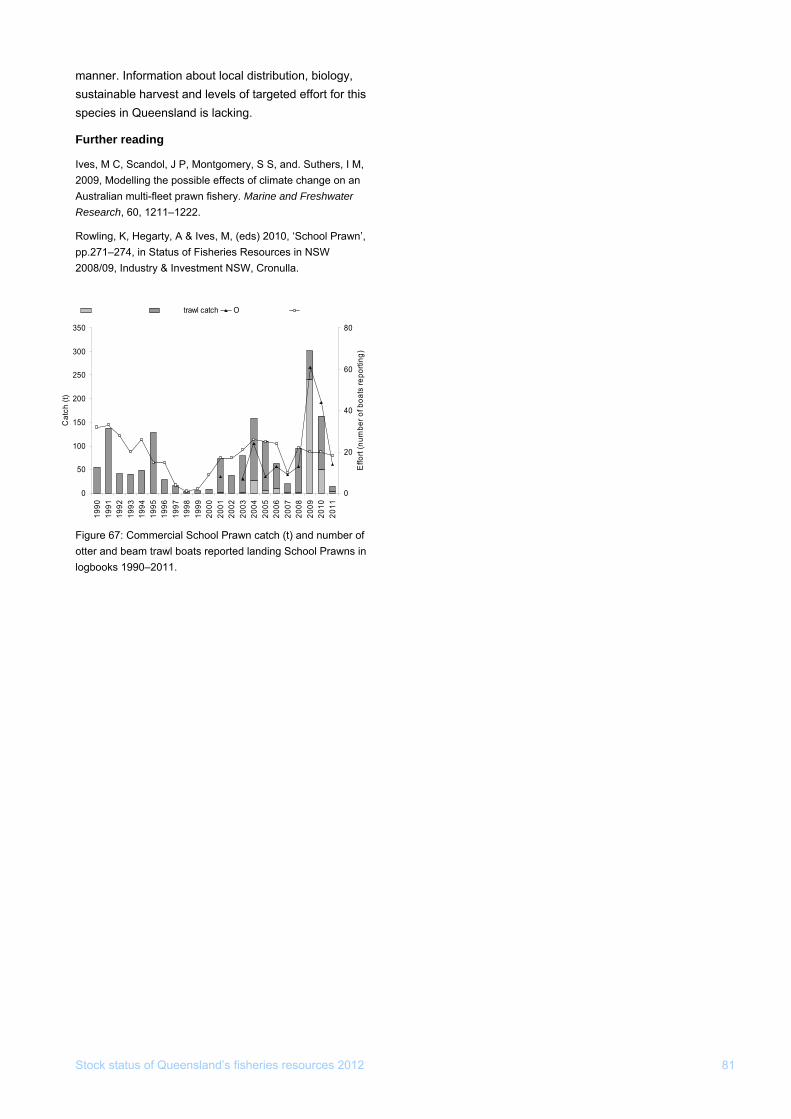
manner. Information about local distribution, biology, sustainable harvest and levels of targeted effort for this species in Queensland is lacking.
Further reading
Ives, M C, Scandol, J P, Montgomery, S S, and. Suthers, I M, 2009, Modelling the possible effects of climate change on an Australian multi-fleet prawn fishery. Marine and Freshwater Research, 60, 1211–1222.
Rowling, K, Hegarty, A & Ives, M, (eds) 2010, ‘School Prawn’, pp.271–274, in Status of Fisheries Resources in NSW 2008/09, Industry & Investment NSW, Cronulla.
Stock status of Queensland’s fisheries resources 2012 81
Prawn catch (t) and number of hool Prawns in
Figure 67: Commercial School otter and beam trawl boats reported landing Sclogbooks 1990–2011.
1990
1991
1992
1993
1994
1995
1996
1997
1998
1999
2000
2001
2002
2003
2004
2005
2006
2007
0
50
150
200
250
300
2008
2009
2010
2011
Cat
ch (t
)
0
Ef
100
350
20
fort
(nu
40
60
80
mbe
r of b
oats
repo
rting
)
Otter trawl catch Beam tter trawl effort Beam trawl effort trawl catch O
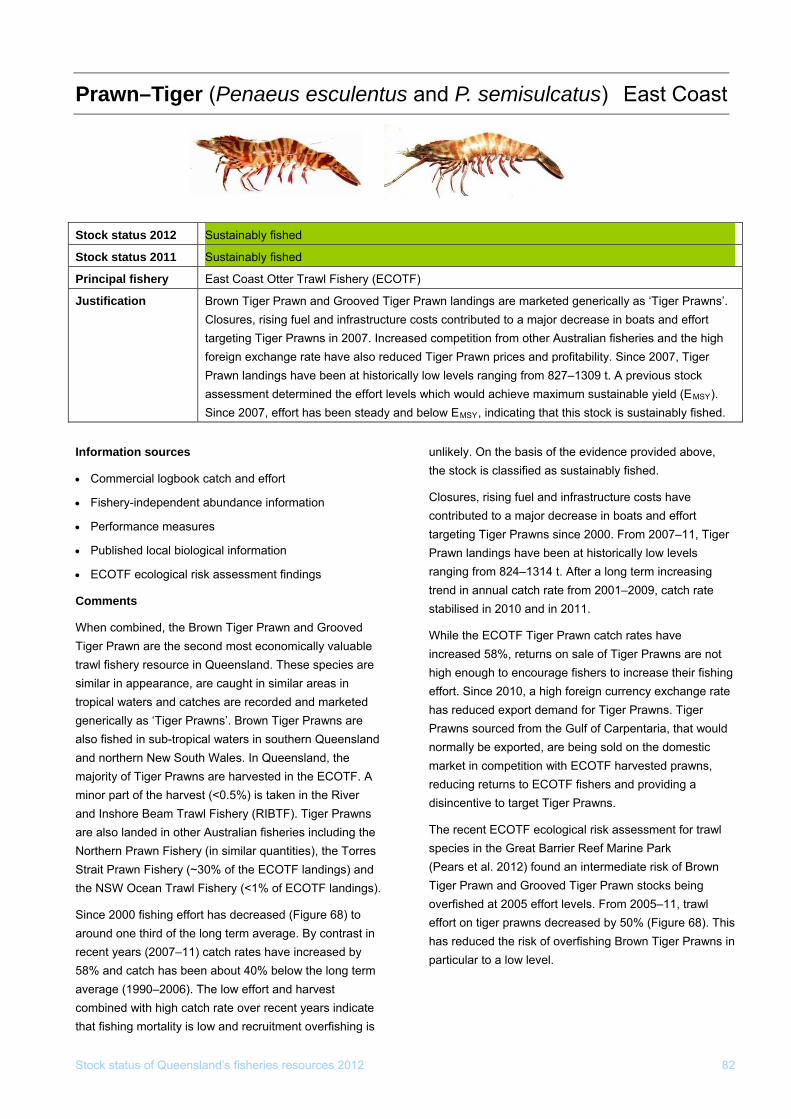
Stock status of Queensland’s fisheries resources 2012 82
tus and P. semisulcatus) East Coast Prawn–Tiger (Penaeus esculen
Stock status 2012 Sustainably fished
Stock status 2011 Sustainably fished
Principal fishery East Coast Otter Trawl Fishery (ECOTF)
Justification Brown Tiger Prawn and Grooved Tiger Prawn landings are marketed generically as ‘Tiger Prawns’. Closures, rising fuel and infrastructure costs contributed to a major decrease in boats and effort targeting Tiger Prawns in 2007. Increased competition from other Australian fisheries and the high foreign exchange rate have also reduced Tiger Prawn prices and profitability. Since 2007, Tiger
torically lPrawn landings have been at his k ow levels ranging from 827–1309 t. A previous stocassessment determined the effort levels w ich would achieve maximum sustainable yield (EMSY). h
y and beSince 2007, effort has been stead low EMSY, indicating that this stock is sustainably fished.
Information sources unlikely. On the basis of the evidence provided above,
the stock is classified as sustainably fished. • Commercial logbook catch and effort
• Closures, rising fuel and infrastructure costs have Fishery-independent abundance information contributed to a major decrease in boats and effort
• Performance measures targeting Tiger Prawns since 2000. From 2007–11, Tiger • Published local biological information Prawn landings have been at historically low levels
• ECOTF ecological risk assessment findings ranging from 824–1314 t. After a long term increasing trend in annual catch rate from 2001–2009, catch rate
Comments stabilised in 2010 and in 2011. When combined, the Brown Tiger Prawn and Grooved While the ECOTF Tiger Prawn catch rates have Tiger Prawn are the second most economically valuable increased 58%, returns on sale of Tiger Prawns are not trawl fishery resource in Queensland. These species are high enough to encourage fishers to increase their fishing similar in appearance, are caught in similar areas in effort. Since 2010, a high foreign currency exchange rate tropical waters and catches are recorded and marketed has reduced export demand for Tiger Prawns. Tiger generically as ‘Tiger Prawns’. Brown Tiger Prawns are Prawns sourced from the Gulf of Carpentaria, that would also fished in sub-tropical waters in southern Queensland normally be exported, are being sold on the domestic and northern New South Wales. In Queensland, the market in competition with ECOTF harvested prawns, majority of Tiger Prawns are harvested in the ECOTF. A reducing returns to ECOTF fishers and providing a minor part of the harvest (<0.5%) is taken in the River disincentive to target Tiger Prawns. and Inshore Beam Trawl Fishery (RIBTF). Tiger Prawns are also landed in other Australian fisheries including the The recent ECOTF ecological risk assessment for trawl
Northern Prawn Fishery (in similar quantities), the Torres species in the Great Barrier Reef Marine Park
Strait Prawn Fishery (~30% of the ECOTF landings) and (Pears et al. 2012) found an intermediate risk of Brown
the NSW Ocean Trawl Fishery (<1% of ECOTF landings). Tiger Prawn and Grooved Tiger Prawn stocks being overfished at 2005 effort levels. From 2005–11, trawl
Since 2000 fishing effort has decreased (Figure 68) to effort on tiger prawns decreased by 50% (Figure 68). This around one third of the long term average. By contrast in has reduced the risk of overfishing Brown Tiger Prawns in recent years (2007–11) catch rates have increased by particular to a low level. 58% and catch has been about 40% below the long term average (1990–2006). The low effort and harvest combined with high catch rate over recent years indicate that fishing mortality is low and recruitment overfishing is
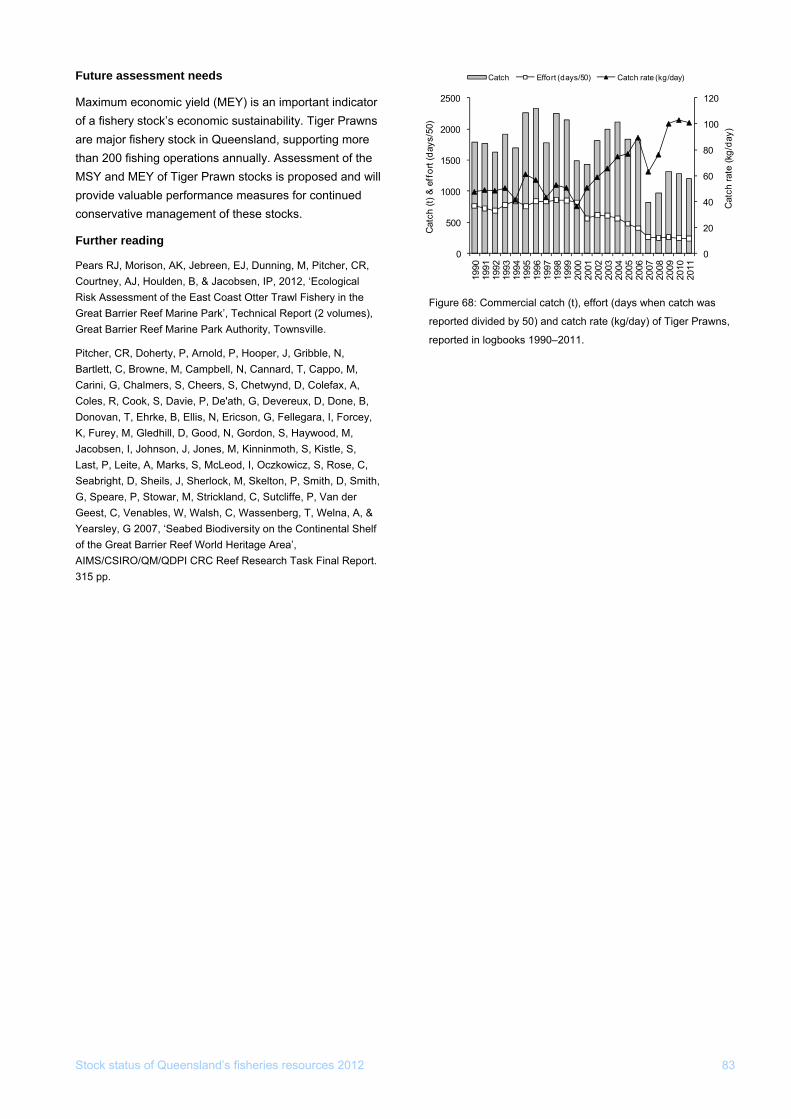
Stock status of Queensland’s fisheries resources 2012 83
s
ns,
Future assessment needs
Maximum economic yield (MEY) is an important indicator of a fishery stock’s economic sustainability. Tiger Prawns are major fishery stock in Queensland, supporting more than 200 fishing operations annually. Assessment of the MSY and MEY of Tiger Prawn stocks is proposed and will provide valuable performance measures for continued conservative management of these stocks.
Further reading
Pears RJ, Morison, AK, Jebreen, EJ, Dunning, M, Pitcher, CR, Courtney, AJ, Houlden, B, & Jacobsen, IP, 2012, ‘Ecological Risk Assessment of the East Coast Otter Trawl Fishery in the Great Barrier Reef Marine Park’, Technical Report (2 volumes), Great Barrier Reef Marine Park Authority, Townsville.
Pitcher, CR, Doherty, P, Arnold, P, Hooper, J, Gribble, N, Bartlett, C, Browne, M, Campbell, N, Cannard, T, Cappo, M, Carini, G, Chalmers, S, Cheers, S, Chetwynd, D, Colefax, A, Coles, R, Cook, S, Davie, P, De'ath, G, Devereux, D, Done, B, Donovan, T, Ehrke, B, Ellis, N, Ericson, G, Fellegara, I, Forcey, K, Furey, M, Gledhill, D, Good, N, Gordon, S, Haywood, M, Jacobsen, I, Johnson, J, Jones, M, Kinninmoth, S, Kistle, S, Last, P, Leite, A, Marks, S, McLeod, I, Oczkowicz, S, Rose, C, Seabright, D, Sheils, J, Sherlock, M, Skelton, P, Smith, D, Smith, G, Speare, P, Stowar, M, Strickland, C, Sutcliffe, P, Van der Geest, C, Venables, W, Walsh, C, Wassenberg, T, Welna, A, & Yearsley, G 2007, ‘Seabed Biodiversity on the Continental Shelf of the Great Barrier Reef World Heritage Area’, AIMS/CSIRO/QM/QDPI CRC Reef Research Task Final Report. 315 pp.
Figure 68: Commercial catch (t), effort (days when catch wa
reported divided by 50) and catch rate (kg/day) of Tiger Praw
reported in logbooks 1990–2011.
Catch Effort (days/50) C
0
20
40
60
80
100
0
500
1000
1500
2000
1990
1991
1992
1993
1994
1995
1996
1997
1998
1999
2000
2001
2002
2003
2004
2005
2006
2007
2008
2009
2010
2011
Cat
ch ra
te (k
g/da
y)
Cat
ch (t
) & e
ffor
t (da
ys/5
0)
1202500
atch rate (kg/day)
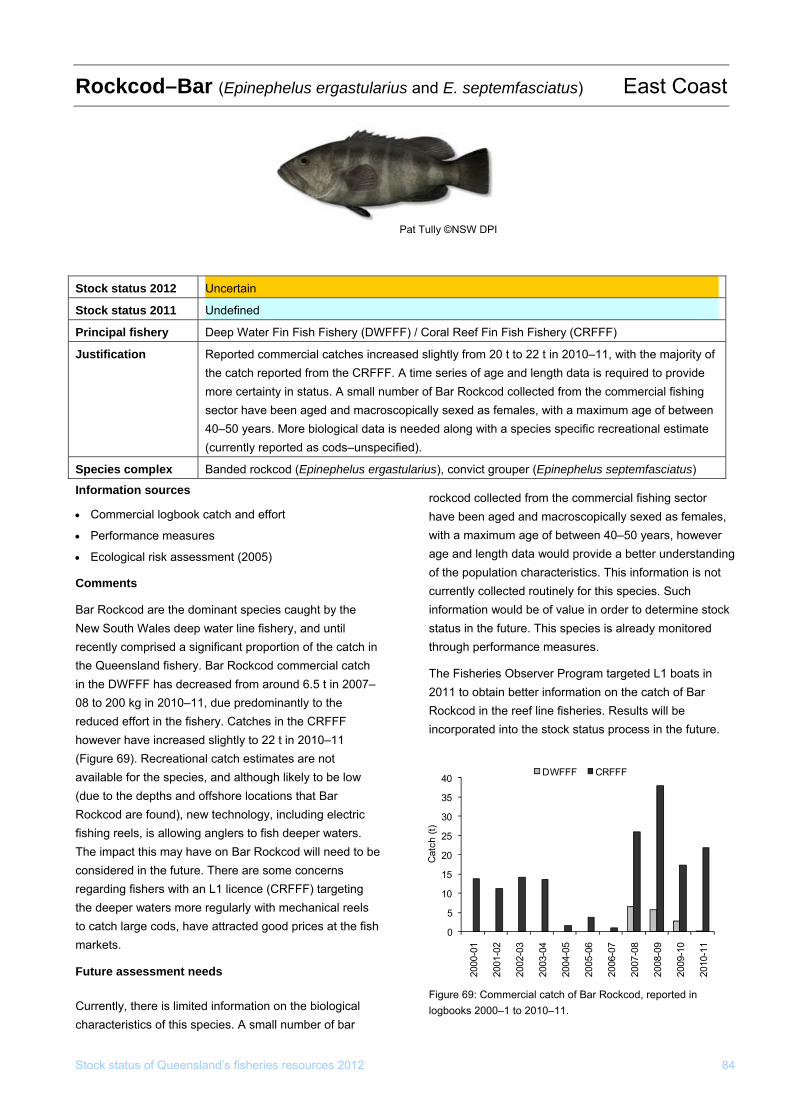
Stock status of Queensland’s fisheries resources 2012 84
arius and E. septemfasciatus) East Coast Rockcod–Bar (Epinephelus ergastul
Pat Tully ©NSW DPI
Information sources
• Commercial logbook catch and effort
• Performance measures
• Ecological risk assessment (2005)
Comments
Bar Rockcod are the dominant species caught by the New South Wales deep water line fishery, and until recently comprised a significant proportion of the catch in the Queensland fishery. Bar Rockcod commercial catch in the DWFFF has decreased from around 6.5 t in 2007–08 to 200 kg in 2010–11, due predominantly to the reduced effort in the fishery. Catches in the CRFFF however have increased slightly to 22 t in 2010–11 (Figure 69). Recreational catch estimates are not available for the species, and although likely to be low (due to the depths and offshore locations that Bar Rockcod are found), new technology, including electric fishing reels, is allowing anglers to fish deeper waters. The impact this may have on Bar Rockcod will need to be considered in the future. There are some concerns regarding fishers with an L1 licence (CRFFF) targeting the deeper waters more regularly with mechanical reels to catch large cods, have attracted good prices at the fish markets.
Future assessment needs
Currently, there is limited information on the biological characteristics of this species. A small number of bar
rockcod collected from the commercial fishing sector have been aged and macroscopically sexed as females, with a maximum age of between 40–50 years, however age and length data would provide a better understanding of the population characteristics. This information is not currently collected routinely for this species. Such information would be of value in order to determine stock status in the future. This species is already monitored through performance measures.
The Fisheries Observer Program targeted L1 boats in 2011 to obtain better information on the catch of Bar Rockcod in the reef line fisheries. Results will be incorporated into the stock status process in the future.
logbooks 2000–1 to 2010–11.
Stock status 2012 Uncertain
Stock status 2011 Undefined
Principal fishery Deep Water Fin Fish Fishery (DWFFF) / Coral Reef Fin Fish Fishery (CRFFF)
Justification mercial catches increased slightly fromReported com 20 t to 22 t in 2010–11, with the majority of ported from the CRFFF.the catch re A time series of age and length data is required to provide
more certainty in status. A small number of Bar Rockcod collected from the commercial fishing sector have been aged and macroscopically sexed as females, with a maximum age of between 40–50 years. More biological data is needed along with a species specific recreational estimate (currently reported as cods–unspecified).
Species complex Banded rockcod (Epinephelus ergastularius), convict grouper (Epinephelus septemfasciatus)
0
5
10
15
20
25
30
35
40
2000
-01
2001
-02
2002
-03
2003
-04
2004
-05
2005
-06
2006
-07
2007
-08
2008
-09
2009
-10
2010
-11
Cat
ch (t
)
DWFFF CRFFF
Figure 69: Commercial catch of Bar Rockcod, reported in
Scallop–Mud (Amusium pleuronectes) East Coast
Stock status 2012 Undefined
Stock status 2011 Undefined
Principal fishery East Coast Otter Trawl Fishery (ECOTF)
Justification The Mud Scallop is taken mainly as by-product in the tiger/Endeavour Prawn sector of the ECOTF. Since 2001, effort and catch have been decreasing. Little is known of this species’ biology and sustainable harvest levels. However, the recent ECOTF ecological risk assessment found that there is not more than an intermediate risk of Mud Scallops being overfished at the 2009 effort level, noting that effort in tiger/Endeavour Prawn sector has not increased since 2009. The status has not shifted from last assessment and remains ‘undefined’.
©R. Swainston
Information sources
• Commercial logbook catch and effort
• ECOTF ecological risk assessment findings
Comments
The Mud Scallop is a tropical Indo-West Pacific species of shellfish taken mainly as by-product in the Tiger/Endeavour Prawn sector of the ECOTF. Catches generally increased from 1990-1999 but declined from 1999–2011; catches in 2011 were only 5% of those taken in 1999 (Figure 70). Effort (number of boats reporting Mud Scallop catch) generally increased from 1990–97, but has since declined by 80%. This trend is possibly linked to a general decrease in effort targeting tiger and Endeavour Prawns over the same period, (see the Tiger Prawn and Endeavour Prawn summaries in this report).
Little is known of this species’ biology and sustainable harvesting levels and as such it was ‘undefined’ at last assessment. However, the recent ECOTF ecological risk assessment found that there is not more than an intermediate risk of Mud Scallops being overfished at current effort levels; noting that Tiger Prawn effort (number of boat days where Mud Scallop landings were recorded) has decreased a further 8% from 2009–11 and Endeavour Prawn effort has increased only slightly by 6% over the same period. There are no additional information or management changes that would shift this
cies status from ‘undefined’ since its last speassessment.
Future assessment needs
Assessment of the validity of effort associated with Mud Scallop landings is considered a priority. Representative trends in Mud Scallop harvest and trawl effort in areas that have high densities of Mud Scallop will enhance the reliability of catch rate as a valid measure of Mud Scallop relative abundance. The proposition that long term decline in catch and effort is linked to a general decline in effort targeting Tiger and Endeavour Prawns also warrants continued investigation.
Further reading
Brand, AR, 2006, Scallop Ecology: Distributions and Behaviour. In Scallops: Biology, Ecology and Aquaculture. S.E. Shumway and G.J. Parsons (Eds). Developments in Aquaculture and Fisheries Science, 35, 651–744.
Stock status of Queensland’s fisheries resources 2012 85
Fig llop catches (t) and effort (number of boats reporting Mud Scallop catches), reported in logbooks 2001–11.
ure 70: Commercial Mud Sca
0
50
100
150
1990
1991
1992
1993
1994
1995
1996
1997
1998
1999
2000
2001
2002
2003
2004
2005
2006
2007
2008
2009
2010
2011
0
20
40
60
80
Effo
rt (N
umbe
r of
s)
Catch Effort200
Cat
ch (t
)
100
boa
t
Stock status of Queensland’s fisheries resources 2012 86
ti) East Coast Scallop–Saucer (Amusium ballo
Information sources 513–763 tonnes. With the exception of 2007, annual
harvesting levels have been within this range since 2001. • Commercial logbook catch and effort The 2011 Saucer Scallop harvest was 271 t, the lowest
• Performance measures catch in 20 years and well below the lower estimate for
• Published local biological information MSY. Rotational closures of high density harvesting • Quantitative stock assessment areas (scallop replenishment areas), an annual seasonal • Preliminary ecological risk assessment findings closure and a 90 mm minimum legal size are specific
management settings introduced to protect the stock from Comments overfishing. The recent ECOTF ecological risk
Harvested by the ECOTF mainly in central and southern assessment found that there is not more than an Queensland waters less than 30 m deep, the Saucer intermediate risk of Saucer Scallops being overfished at Scallop was the fifth most economically valuable trawl 2009 effort levels. fishery resource in Queensland in 2011. Record high
However, some concerns exist regarding catch rate Saucer Scallop catch rates in Queensland during the trends. Monthly catch rates (standardised for variability in 1980s where overfishing was likely to have occurred, vessel gear type, fishing times and fishing location) were followed by lower catch rates in the 1990s. gradually declined from 1990–97 and have been highly Exceptionally high catches were made during 1990, 1993 variable within years since (Figure 73). Despite very high and 1995 at levels that haven’t been reached since catch rates at the start of the fishing season in some (Figure 71). Stock biomass appears to have increased years, monthly catch rates at the end of the season are since 1997 when rotational closures were put in place consistently low (including 2011). While the fishery and catch rates began to recover. While there has also typically exhibits a strong pulse of fishing effort and high been a long term decline in effort since 1997, larger more catch rates at the start of each new season, the powerful vessels from other ECOTF sectors have entered relevance to stock sustainability of very low monthly catch the fishery contributing to a significant increase in fishing rates outside the peak fishing months (November-power and increasing catch rates. Catch and catch rates February) is unclear. A possible cause of depressed have been curtailed since 2009 possibly due to changing catch rates toward the end of the season may be a environmental variables associated with the recent La market driven incentive to continue fishing. For example, Nina episode. high prices were offered to fishers in 2011, and may have
Median results from recent quantitative modelling of the been a factor in continued fishing even as catch rates fell stock estimated a maximum sustainable yield (MSY) of to levels that may been unprofitable in the past.
Stock status 2012 Sustainably fished
Stock status 2011 Sustainably fished
Principal fishery East Coast Otter Trawl Fishery (ECOTF)
Justification Harvested in the ECOTF, the Saucer Scallop was the fifth most economically valuable of esources in 20Queensland’s trawl fishery r eclined over the long11. Landings and effort have d
term while catch rates have been variable and are currently slightly above the long term average. callop harvestIn 2011, the ECOTF Saucer S was 271 t. Stock modelling indicates that current
ainable limits. The recent ECOTF ecological risk assessment harvesting levels are within sustfound that there is not more than an intermediate risk of Saucer Scallops being overfished at
e main fishing season (November- February) are 2011 effort levels. Catch rates outside thg. depressed and require monitorin
Stock status of Queensland’s fisheries resources 2012 87
Figure 71: Commercial Saucer Scallop catch (t), effort (days by 50) and catch rate
Figure 71: Commercial Saucer Scallop catch (t), effort (days by 50) and catch rate
Future assessment needs
While noominminaal l catch rate perfcatch rate perfoormancrmance mease measures shoures showw that averagthat average me monthlonthly catch raty catch ratees have bs have beeeenn w wiitthhin thin the e expecteexpected rand ranggee since 2 since 2000088, additi, additionaonal referel reference ponce points ints that that wwooululd facild faciliitate assessmetate assessmennt of end of set of end of season catch ason catch rates are nerates are neededed. Reded. Reduuctioction of the minimun of the minimum legam legal size l size from 95 mm to 90 mm in 20from 95 mm to 90 mm in 201010 has not lifted c has not lifted caatches antches and d catch rates in 2catch rates in 2011 as e011 as exxpectepected. End of seasd. End of season catch on catch rates are norates are noww lloowweer thar thann in 1 in 1996 996 wwhheenn the stock the stock wwaas s ddeemeemed to haved to have beee been overfisn overfished, but catch hed, but catch rates at the rates at the sstart of each seasotart of each seasonn are h are hiighgher. er. In this situation, it In this situation, it wwoould uld be prube pruddeennt to closelt to closely my moonitor fnitor fuurtherther falls ir falls inn e end of nd of seasoseasonn catche catches and s and catcatch ratch ratees s wwhhicich have h have beebeen n declideclinining sincng sincee 200 2007 (F7 (Fiiggure 7ure 722). ).
AnecdAnecdootal atal addvivice from sce from scallocallopp fishers sugg fishers suggesest that high t that high rainfarainfall anll and coad coasstal catchtal catchment ment runoff similrunoff similaar to that r to that experexperiencienced ied inn 201 2010–0–11,11, contr contriibute to hibute to highgher scalloer scallop p catches. Resecatches. Research is proarch is proposposed into thed into the effects of e effects of envirenvironmeonmenntal tal variavariabblesles o onn th the Saucer Scae Saucer Scallllop stock. op stock.
FurtheFurtherr re reaadding ing
Campbell, AB, OCampbell, AB, O’’Neill, MF,Neill, MF, Leigh, G Leigh, GMM, Wang , Wang YY--GG & Jebreen, & Jebreen, EJ, 2012, ‘ReferEJ, 2012, ‘Reference points for ence points for ththe Queee Queensland scallop fisherynsland scallop fishery’’, , ffinal report to inal report to Fisheries ResearFisheries Research ch and Developand Developmenment Corpot Corporration, ation, PProject No. 2009roject No. 2009/089, DEEDI, B/089, DEEDI, Bririssbane. bane.
CCampbell, MJ, Campbell, AB, Oampbell, MJ, Campbell, AB, Officerfficer,, RA, O RA, O’’Neill, MFNeill, MF, May, Mayeerr,, DG, DG, ThThwwaites, Aaites, A,, Jebreen, EJ, Co Jebreen, EJ, Courtneurtneyy, AJ, Gribb, AJ, Gribblle, N, e, N, LaLawwrrence, ML, ence, ML, PPrrosser, AJ & Draosser, AJ & Drabbsch, SL 2010,sch, SL 2010, ‘Har‘Harvest vest strstraategytegy evaluati evaluation to optimise the sustainabilityon to optimise the sustainability and value of and value of the the Queensland scallop fisherQueensland scallop fisheryy’’, , final rfinal report to eport to Fisheries ReseaFisheries Research rch and Developmenand Development Corpot Corporration, Pration, Project No. 2006/0oject No. 2006/024, DEEDI, 24, DEEDI, Brisbane.Brisbane.
when scallop catch was reported divided when scallop catch was reported divided (kg/day), reported in logbooks 1990 to 2011. (kg/day), reported in logbooks 1990 to 2011.
Figure 72: Standardised Saucer Scallop monthly catch rate (baskets/vessel/day), 1990–2011. Figure 72: Standardised Saucer Scallop monthly catch rate (baskets/vessel/day), 1990–2011.
Catch Effort (days/50) Catch rate (kg/day)
0
20
40
60
80
100
120
140
0
1000
1500
2000
2500
1990
1991
1992
1993
1994
1995
1996
1997
1998
1999
2000
2001
2002
2003
2004
2005
2006
2007
2008
2009
2010
2011
Cat
ch ra
te (k
g/ni
ght)
ch (t
) & e
ffor
t (da
ys/5
0)
500Cat
0
5
10
1990
1991
1992
1993
1994
1995
1996
1997
1998
1999
2000
2001
2002
2003
2004
2005
2006
2007
2008
2009
2010
2011
Cat
h ra
15
(bas
ke25
30
35
40
ts/ v
esse
l/ da
ys)
20
cte

Stock status of Queensland’s fisheries resources 2012 88
Sea Cucumber–White Teatfish (Holothuria fuscogilva) East Coast
Information sources
• Commercial logbook catch and effort
• Performance measures
Comments
White Teatfish (Holothuria fuscogilva) is the most valuable commercial sea cucumber species. The species has been quota managed since 1999 and continues to be harvested close to the allowable level of take. Since 2004, the fishing industry has operated under a memorandum of understanding, which includes a voluntary rotational zoning scheme (RZS) where 154 nominated fishing zones may be fished for up to 15 days in one of every three years. Fisheries Queensland reviewed the effectiveness of the RZS in 2011 to ensure fishing operations were not resulting in localised unsustainable harvesting pressure on commercial sea cucumber species. It was noted that the RZS was particularly effective in spreading fishing effort and minimising risk of localised depletion in White Teatfish.
In 2010–11, the total annual commercial harvest was 62 t, equating to approximately 97% of the available quota (64 t) (Figure 73). Zone 1 and zone 2 had quotas of 51 t and 13 t respectively. The weights recorded by QMS were 43 t for zone 1 and 9 t for zone 2.
Sea cucumber species are density dependent spawners and due to ease of harvest, populations are susceptible to localised depletion. Industry has been conducting targeted abundance surveys for other species; this data is used to set sustainability-based TACs. As an industry
Teatfish from 2001–02 to 2010–11.
tock status 2012
driven initiative, quota for this species will be reduced for the 2012–13 quota year to 53 t in total.
Future assessment needs
To maintain stock status certainty a resource assessment for White Teatfish is recommended. There are currently discussions with CSIRO regarding modelling processes and sampling design for resource assessments for the east coast stocks.
S Sustainably Fished
Stock status 2011 Undefined
P st Bêche-de-mer Fishery (ECBDMF) rincipal fishery East Coa
J de-mer are conducted by industry, with the data
being sustainably fished.
ustification Targeted abundance surveys for Bêche-obtained used to set sustainability set TACs. White Teatfish continues to be commercially harvested near the quota level. A rotational harvesting strategy in place for sea cucumber (other than for Burrowing Blackfish zones) is ensuring catch and effort for White Teatfish is effectively distributed throughout the fishery area. Catch rates and individual mean size are relatively steady. All of the above combined with the weight of evidence suggesting that biomass is not being overfished lead to the stock status of White Teatfish
0
5
25
30
35
40
0
2001
-02
2002
-03
2003
-04
2004
-05
2005
-06
2006
-07
2007
-08
2008
-09
2009
-10
2010
-11
Cat
ch ra
g/ho
ur)
10
15
20
20
40
60
80te
(k
Cat
ch (t
100
)
120
140Catch (t) Catch rate (kg/hr)
Figure 73: Total catch (kg) and CPUE (kg/hour) for White
Stock status of Queensland’s fisheries resources 2012 89
Sea Cucumber–Burrowing Blackfish (Actinopyga spinea) East Coast
Information sources Future assessment needs
• Commercial logbook catch and effort Stock status certainty will be improved by an appropriat
• resource assessment for Burrowing Blackfish being Performance measures completed for all Burrowing Blackfish zones.
Comments
The take of Burrowing Blackfish is primarily managed through spatially discrete TACs (Burrowing Blackfish zones). The results of the industry-led resource surveys are independently reviewed and used to set sustainable yield estimates. The TACs for these zones are very conservative, however to ensure that the harvest remains sustainable and that there is no regional depletion resource assessments are repeated periodically.
In 2009–10, industry re-surveyed Gould Reef following a trigger to the performance measure in the 2008–09 season. The stock in the Gould Reef area is considered to be healthy with the exception of some depletion in the south-west corner of the lagoon. As a precautionary measure, Industry has self-imposed a closure of this area pending further investigation.
Total catch in 2010–11 was the highest in the last five years, at approximately 231 t. There are no other biological data available for the species. The stock status of Burrowing Blackfish is undefined until re-surveys of other key Burrowing Blackfish zones have been completed and the results assessed by Fisheries Queensland.
e
Stock status 2012 Undefined
Stock status 2011 Undefined
Principal fishery East Coast Bêche de mer Fishery (ECBDMF)
Justification The take of Burrowing Blackfish is primarily managed through spatially discrete TACs (BurBlackfish zones). Periodically the zones are re-surveyed to ensure that the harvest levels (TACsremain sustainable. The stock status of Burrowing Blackfish is undefined until all surveys have been reviewed and the TACs set under the industry MoU have been assessed. A re-survey ofthe Lizard-Wanning zone is required before end of 2013.
rowing )
Sea Mullet (Mugil cephalus) East Coast
Stock status 2012 Sustainably fished
Stock status 2011 Sustainably fished
Principal fishery East Coast Inshore Fin Fish Fishery (ECIFFF) / Recreational
Justification The stock is shared with New South Wales (NSW). Queensland’s catches are below the long term average; however, they are within historical levels. Both length and age data and annual total mortality estimates have been consistent over recent years. Sea Mullet was assessed by NSW as ‘fully fished’ due to a long history of stable landings and catch rates for estuary and
ns. ocean fisheries in both jurisdictio
Information sources
• Commercial logbook catch and effort
• Recreational harvest estimates
• Performance measures
• Fishery-dependent length and age information
• Published local biological information
Comments
Sea Mullet comprise the largest catch (1533 t) by weight of species harvested by commercial net fisheries in Queensland (Figure 74). The Sea Mullet stock is shared with NSW. Catches and catch rates have been stable for many years, although overall these close to the lower limits in the historical record dating back to the 1940’s. Performance measures for Sea Mullet did not trigger in 2011. The above evidence suggests that the biomass of the stock is unlikely to become recruitment overfished.
Fishery-dependent monitoring of length and age information from both stocks indicates that there are no sustainability concerns (Figure 75). Estimates of total mortality, while above the threshold, have been reasonably consistent since 1999 (Figure 76). This level of fishing mortality is unlikely to cause the stock to become recruitment overfished.
Sea Mullet was assessed by NSW as ‘fully fished’ due to a long history of stable landings and catch rates for estuary and ocean fisheries in both jurisdictions.
The 2010 SWRFS reported minimal harvesting of Sea Mullet, supporting that the species is not generally considered recreationally important.
Future assessment needs
Stock status certainty will be improved by a stock assessment (joint with NSW) of Sea Mullet.
Further reading
Bell, PA, O’Neill, MF, Leigh, GM, Courtney, AJ & Peel, SL 2004, ‘Stock Assessment of the Queensland–New South Wales Sea Mullet Fishery (Mugil cephalus)’, Queensland Department of Primary Industries and Fisheries, Deception Bay, Australia.
Rowling, K, Hegarty, A & Ives, M, (eds) 2010, ‘Sea Mullet’, pp.275–278, in Status of Fisheries Resources in NSW 2008/09, Industry & Investment NSW, Cronulla.
Figure 74: Commercial net catch (t) and catch rate of Sea Mullet
reported in logbooks from 1993–2011.
Line (t) Net (t) Net catch rate (kg/day)
0
50
100
150
200
250
0
500
1000
1500
2000
2500
3000
1993
1994
1995
1996
1997
1998
1999
2000
2001
2002
2003
2004
2005
2006
2007
2008
2009
2010
2011
Cat
ch ra
te (k
g/10
0m n
et/d
ay)
Cat
ch (t
)
Stock status of Queensland’s fisheries resources 2012 90
Stock status of Queensland’s fisheries resources 2012 91
tality (Z) for non ocean beach and ocean beach-caught Sea Mullet (1999–2011).
Figure 76: Estimates of the instantaneous rate of total mor
0.0
0.2
0.4
0.6
0.8
1.0
1.2
1999 2001 2003 2005 200
Performance Measure Threshold (2M)CombinedNon-Ocean BeachOcean Beach
Year
Tota
l Mor
talit
y R
ate
(Z)
7 2009 2011
Figure 75: Age frequencies of ocean beach and non ocean beach-caught Sea Mullet from 2009 to 2011.
0
10
20
30
Ocean Beach
40
50 2009 2009Estuarine
0
50 2010 2010
10
20
30
40
1 2 3 4 5 6 7 8 9 10 11 12 13 14 15 16
0
10
20
30
40
50 2011 2
1 2 3 4 5 6 7 8 9 10 11 12 13 14 15 16
011
Age Grou
Pe
ch
p (years)
rcen
tage
of c
at
Stock status of Queensland’s fisheries resources 2012 92
Shark (Elasmobranchii) East Coast and Gulf of Carpentaria
Stock status 2012 Undefined
Information sources documents the specific data needed for future stock assessments and describes Fisheries Queensland • Commercial logbook catch and effort programs in place that address these needs. The list of
• Recreational catch estimates major species in order of priority for stock assessment is:
• Performance measures • Blacktip Shark complex–Carcharhinus tilstoni and
• Fishery-dependent length and age information C. limbatus
• Published local biological information • Spot-tail Shark–C. sorrah Comments • Scalloped Hammerhead Shark–Sphyrna lewini
New arrangements for Shark harvest on the east coast • Milk Shark–Rhizoprionodon acutus
have been in place since mid-2009, including a • Australian Sharpnose Shark–R. taylori precautionary 600 t quota, an observer program, • Spinner Shark–C. brevipinna incidental take and species limits, and a species-specific
Assessments will benefit from substantial recent Shark logbook. In 2010–11, 439 t of the quota was taken
biological research undertaken on these species by in the ECIFFF (net caught 423 t, line caught 17 t).
students from Queensland universities. It is expected that Preliminary findings of the observer program indicate that
comprehensive stock assessments will commence for the a large portion the harvest occurs when targeting more
major Shark species in 2013 and models to be used will valuable species, such as Grey Mackerel and
be based upon those used in the 2011 assessments of Barramundi.
Northern Territory blacktip and spot-tail Shark stocks. Detailed catch reporting of Sharks has been in place in
Future assessment needs the GOCIFFF since 2006 in the inshore N3 fishery and 2007 in the offshore N9 fishery. Fisheries Queensland The Shark assessment plan sets out the strategies to be monitors annual catch and catch rate trends of 18 Shark implemented by 2014 to assess the population status of species and groups to ensure that risks to the the major Shark species being taken in Queensland east sustainability of these species are identified. Monitoring is coast fisheries. Assessment models being developed will through the GOCIFFF Performance Measurement guide future assessment of Gulf of Carpentaria Shark System and reported annually. No concerns for harvest of resources in collaboration with NT fisheries scientists Shark species were identified in these reviews. where appropriate.
Fisheries Queensland is three years into a five-year Further reading information collection and assessment phase for the Welch, D, Ovenden, J, Simpfendorfer, C, Tobin, A, Morgan, J, major Shark species. This information collection is Street, R, White, J, Harry, A, Schroeder, R & Macbeth, W 2011,
‘Stock structure of exploited Shark species in north eastern coordinated through the Shark Assessment Working Australia’, FRDC Project 2007/035, Fishing & Fisheries Group. A Plan for Assessment of Queensland East Coast Research Centre Technical Report No. 12, James Cook Shark Resources 2009–14 has been developed. The plan University, Townsville, Australia.
Stock status 2011 Undefined Principal fishery East Coast Inshore Fin Fish Fishery (ECIFFF) / Gulf of Carpentaria Inshore Fin Fish
Fishery (GOCIFFF) Justification
s
Fisheries Queensland is undertaking a five year program of collecting and assessing critical information for determining the status of Sharks harvested in Queensland. The major Shark species are considered undefined until comprehensive stock assessmentcan be completed.
Stock status of Queensland’s fisheries resources 2012 93
Snapper (Pagrus auratus) East Coast
since July 2006, with the largest fish sampled measuring Information sources over a metre in length. Fishery-dependent monitoring
• Stock assessment (2009, using data to 2007) programs have shown that Snapper can live to more than
• Commercial logbook catch and effort 20 years of age in Queensland waters (Figure 78) and may even live as long as 30 years. Snapper recruit to the
• Recreational catch estimates fishery at about four years of age under current
• Charter logbook catch and effort management regulations (minimum size 35 cm) but the • Fishery-dependent age, length and mortality estimate harvest by all sectors of the fishery is dominated by fish
information (2009–2011) less than 10-years-old (Figure 78).
• Performance measures Total mortality estimates calculated from fishery-
• Published local biological information dependent monitoring data show that performance measures would have triggered for all sectors in 2011
Comments (based on natural mortality (M) of 0.15). Caution needs to
This is a shared stock with NSW; with catches of Snapper be shown in interpreting fishing mortality estimates alone being recorded as far north as Proserpine on the when recruitment may be increasing. Commercial catch Queensland coast. Commercial catch in 2011 continued has decreased and there is no clear catch rate increase to decline to a historical low of 65 t since logbooks were which, together with the mortality estimate, provides no initially adopted in the fishery in 1988 (Figure 77). Charter evidence in 2011 of stock recovery. catches also decreased from around 45 t in 2010 to 32 t The current NSW stock status for east coast Snapper is in 2011. ‘growth overfished’. The 2010 Statewide Recreational Fishing Survey Future assessment needs estimated approximately 84 000 Snapper were harvested, which was down from the 2000 NRIFS Monitoring programs to collect length and age information
estimate of approximately 232 000 fish. on Snapper being harvested by all sectors (commercial, recreational and charter) are ongoing and supplemented
The 2009 stock assessment indicated that the Snapper by fishery-independent surveys for juvenile fish. These exploitable biomass levels are approximately 35% of the data are crucial for future stock assessments, and are virgin biomass and the stock required rebuilding (see used annually to monitor recruitment and estimate total Campbell et al. 2009). mortality rate in the population. A revised quantitative Fisheries Queensland has routinely monitored the size stock assessment has been scheduled to commence in and age of Snapper caught by all sectors of the fishery 2015.
Stock status 2012 Overfished
Stock status 2011 Overfished
Principal fishery Rocky Reef Fin Fish Fishery (RRFFF) / Recreational
Justification The Snapper stock is shared with New South Wales (NSW) and is considered 'overfished'. Stock assessment results indicated a high level of fishing pressure. Updated mortality estimates for 2011 show some improvement for each sector, but decreasing commercial catch and no increase in catch rate suggest that oved. Fisheries stock status has not impr
emented new managemeQueensland impl nt arrangements in September 2011 with the f allowing for the rebuilding of tobjective o e he Snapper stock to sustainable levels over th
longer term.
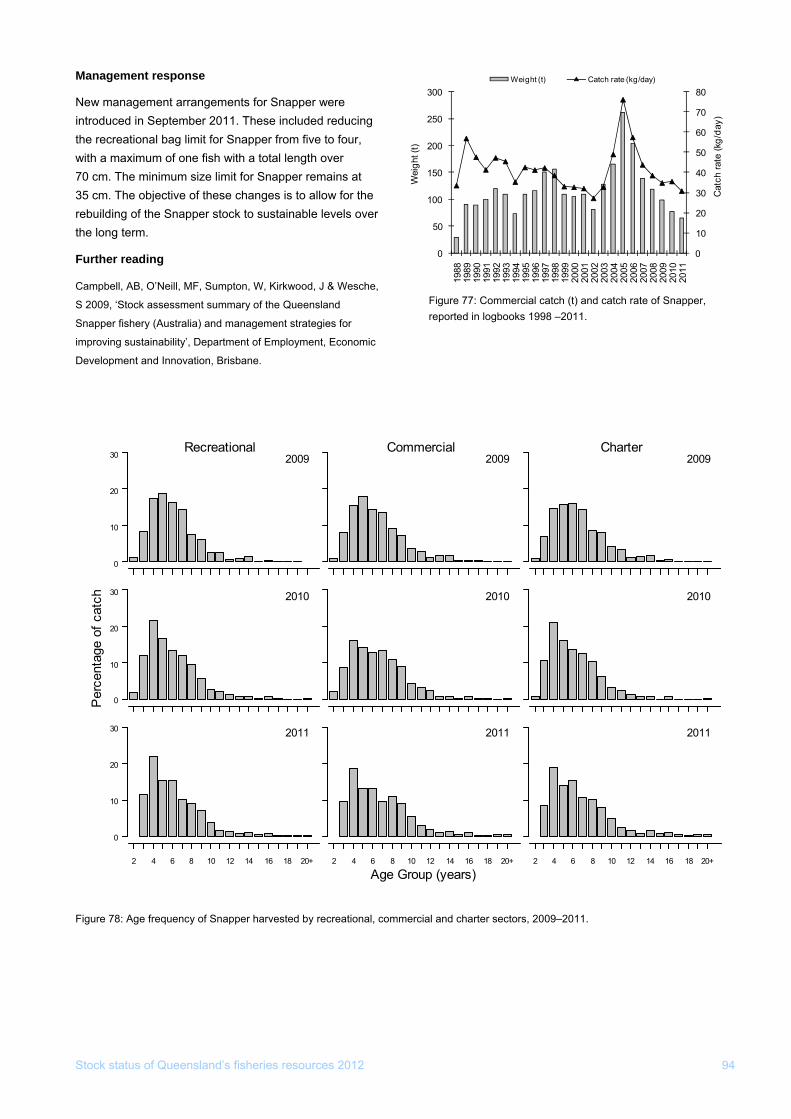
Stock status of Queensland’s fisheries resources 2012 94
Management response
New management arrangements for Snapper were introduced in September 2011. These included reducing the recreational bag limit for Snapper from five to four, with a maximum of one fish with a total length over 70 cm. The minimum size limit for Snapper remains at 35 cm. The objective of these changes is to allow for the rebuilding of the Snapper stock to sustainable levels over the long term.
Further reading
Campbell, AB, O’Neill, MF, Sumpton, W, Kirkwood, J & Wesche,
S 2009, ‘Stock assessment summary of the Queensland
Snapper fishery (Australia) and management strategies for
improving sustainability’, Department of Employment, Economic
Development and Innovation, Brisbane.
Figure 77: Commercial catch (t) and catch rate of Snapper, reported in logbooks 1998 –2011.
0
20
30 2009Recreational
10
2009Commercial
2009Charter
0
10
20
30 2010 2010 2010
0
20
30 2011
2 4 6 8 12 14 16 18 20+
2011
10
2 4 6 8 10 12 14 16 18 20+ 10
2 4 6 8 10 12 14 16 18 20+
2011
Age Group (years)
Per
cent
age
of c
atch
Figure 78: Age frequency of Snapper harvested by recreational, commercial and charter sectors, 2009–2011.
Weight (t) Catch rate (kg/day)
0
10
20
30
40
50
60
70
80
0
50
100
150
200
250
300
1988
1989
1990
1991
1992
1993
1994
1995
1996
1997
1998
1999
2000
2001
2002
2003
2004
2005
2006
2007
2008
2009
2010
2011
Cat
ch ra
te (k
g/da
y)
Wei
ght (
t)
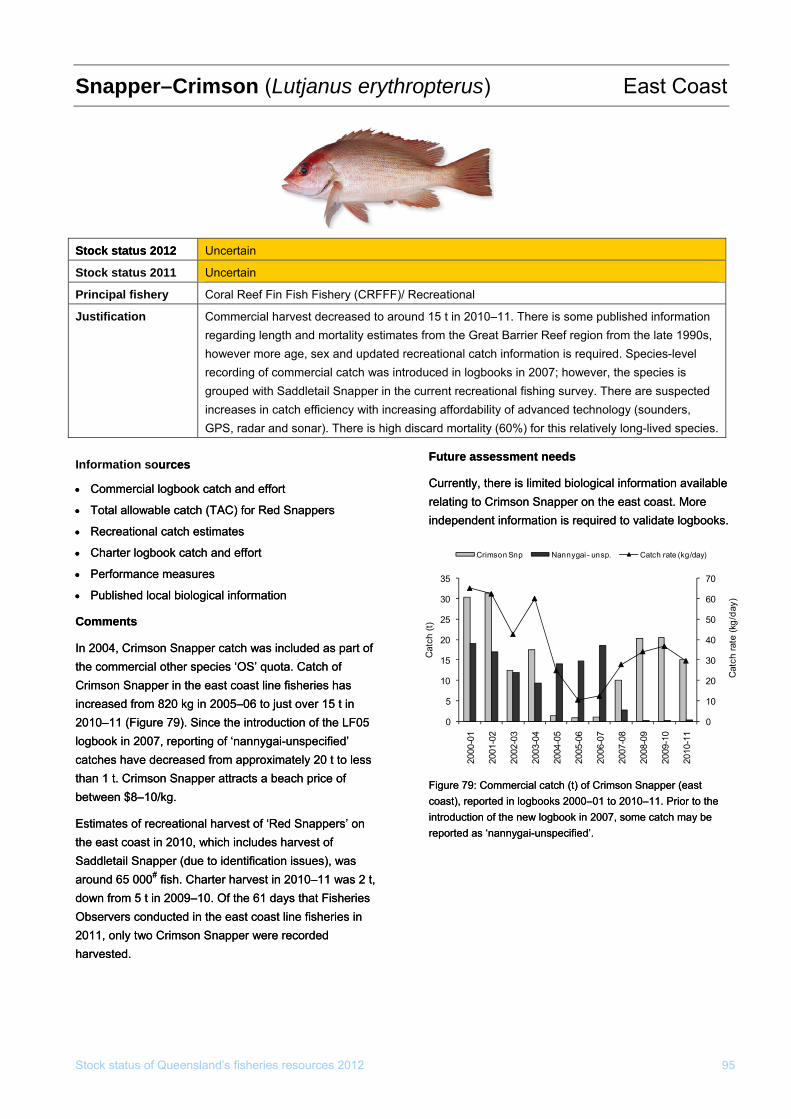
Snapper–Crimson (Lutjanus erythropterus) East Coast
rmation is required to validate logbooks.
f Crimson Snapper (east
rmation is required to validate logbooks.
f Crimson Snapper (east
Stock status of Queensland’s fisheries resources 2012 95
Information souurrces ces
•• CommerciCommerciaal lol logbogbook catcok catch anh and effort d effort
•• TTootal allotal allowwaablblee catch (T catch (TAC) for Red SnaAC) for Red Snappppeerrss
•• RecreRecreaationtional cal caatch estimates tch estimates
•• Charter lCharter logogbbooook catch and effk catch and effoort rt
•• PerformancPerformance measure measures es
•• PublPublisheished locd locaall biol biologicogicaal infl infoorrmmation ation
Comments Comments
In 2004, CrimsIn 2004, Crimson Snaon Snappppeer catch r catch wwaas incs incllududeedd as part of as part of the commercithe commerciaall other speci other speciees ‘s ‘OOS’ quota. CatS’ quota. Catcch of h of Crimson SCrimson Snapnapper in the eper in the eaast coast linst coast line fishee fisherries has ies has increincreaased fromsed from 820 kg in 820 kg in 2002005–05–06 to just ov6 to just over 15 t in er 15 t in 2012010–0–11 (F11 (Figurigure 79). Since the 79). Since the introde introductiouctionn of of the LFthe LF05 05 loglogbook ibook inn 20 200077, reportin, reportingg of ‘ of ‘nannannnyyggaai-ui-unnspspecifieecified’ d’ catches havcatches have de deecreascreased from appred from approoxximateimatellyy 20 t to less 20 t to less than 1 t. Crimson Snathan 1 t. Crimson Snappppeer attracts a beach r attracts a beach price of price of betbetwweeen $en $8–18–10/kg. 0/kg.
Estimates of recreatioEstimates of recreational hnal haarvrvest of ‘Red Snest of ‘Red Snappappers’ on ers’ on the east coast ithe east coast inn 201 2010, 0, wwhhicich ih innclucludes hdes haarvesrvest t of of SaddSaddletailetaill Sna Snapper (dpper (due to idue to identificatientification isson issues), ues), wwaas s arouaround 6nd 655 000 000## fish. Charter h fish. Charter haarvest in 20rvest in 201010–11 –11 wwaas 2 t, s 2 t, dodowwnn from 5 t i from 5 t inn 200 2009–9–10. Of 10. Of the 61 dthe 61 daayys that Fs that Fiisheries sheries Observers conObservers conducted iducted inn the e the eaast coast line fist coast line fishersheriiees in s in 2012011, onl1, only ty twwo o Crimson SCrimson Snapnapper per wweerree recor recorded ded harvested. harvested.
Future assessment needs
Currently, there is limited biological information available
Future assessment needs
Currently, there is limited biological information available relating to Crimson Snapper on the east coast. More independent inforelating to Crimson Snapper on the east coast. More independent info
Figure 79: Commercial catch (t) oFigure 79: Commercial catch (t) ocoast), reported in logbooks 2000–01 to 2010–11. Prior to the introduction of the new logbook in 2007, some catch may be reported as ‘nannygai-unspecified’.
coast), reported in logbooks 2000–01 to 2010–11. Prior to the introduction of the new logbook in 2007, some catch may be reported as ‘nannygai-unspecified’.
Stock status 2012 Stock status 2012 Uncertain
Stock status 2011 Uncertain
Principal fishery Coral Reef Fin Fish Fishery (CRFFF)/ Recreational
Justification creased to around 15 t in 2010–11. There is some published information ,
il Snapper in the current recreational fishing survey. There are suspected increases in catch efficiency with increasinGPS, radar and sonar). There is high disc s.
Commercial harvest deregarding length and mortality estimates from the Great Barrier Reef region from the late 1990showever more age, sex and updated recreational catch information is required. Species-level recording of commercial catch was introduced in logbooks in 2007; however, the species is grouped with Saddleta
g affordability of advanced technology (sounders, ard mortality (60%) for this relatively long-lived specie
0
10
20
30
0
5
10
15
20
2000
-01
2001
-02
2002
-03
2003
-04
2004
-05
2005
-06
2006
-07
2007
-08
2008
-09
2009
-10
2010
-11
C
25
(t)
30
35
Crimson Snp Nannygai - unsp. Catch rate (kg/day)
40
50
60
70
atch
rate
(kg/
day)
Cat
ch
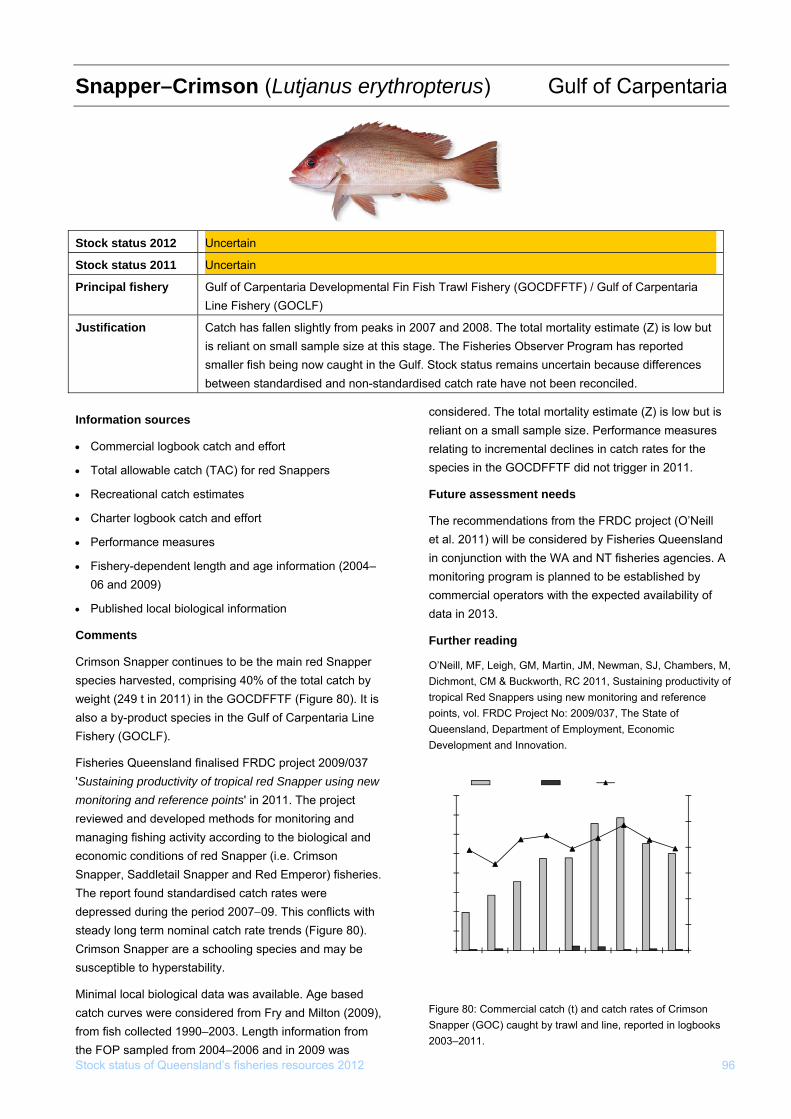
Stock status of Queensland’s fisheries resources 2012 96
s erythropterus) Gulf of CSnapper–Crimson (Lutjanu arpentaria
tock status 2012 S Uncertain
Stock status 2011 Uncertain
Principal fishery Gulf of Carpentaria Developmental Fin Fish Trawl Fishery (GOCDFFTF) / Gulf of Carpentaria Line Fishery (GOCLF)
Justification Catch has fallen slightly from peaks in 2007 and 2008. The total mortality estimate (Z) is low but is reliant on small sample size at this stage. The Fisheries Observer Program has reported smaller fish being now caught in the Gulf. Stock status remains uncertain because differences between standardised and non-standardised catch rate have not been reconciled.
Information sources reliant on a small sample size. Performance measures
• Commercial logbook catch and effort relating to incremental declines in catch rates for the
• Total allowable catch (TAC) for red Snappers species in the GOCDFFTF did not trigger in 2011.
• Recreational catch estimates Future assessment needs
• Charter logbook catch and effort The recommendations from the FRDC project (O’Neill
• Performance measures et al. 2011) will be considered by Fisheries Queensland in conjunction with the WA and NT fisheries agencies. A
• Fishery-dependent length and age information (2004–monitoring program is planned to be established by
06 and 2009) commercial operators with the expected availability of
• Published local biological information data in 2013.
Comments Further reading
Crimson Snapper continues to be the main red Snapper O’Neill, MF, Leigh, GM, Martin, JM, Newman, SJ, Chambers, M, species harvested, comprising 40% of the total catch by Dichmont, CM & Buckworth, RC 2011, Sustaining productivity of
weight (249 t in 2011) in the GOCDFFTF (Figure 80). It is tropical Red Snappers using new monitoring and reference
also a by-product species in the Gulf of Carpentaria Line points, vol. FRDC Project No: 2009/037, The State of Queensland, Department of Employment, Economic Fishery (GOCLF). Development and Innovation.
Fisheries Queensland finalised FRDC project 2009/037 'Sustaining productivity of tropical red Snapper using new GOCDFFTF GOCLF GOCDFFTF CPUE
monitoring and reference points' in 2011. The project 400 1200
reviewed and developed methods for monitoring and 3501000
y)
managing fishing activity according to the biological and a) 300
(t 800 /d
economic conditions of red Snapper (i.e. Crimson ghc 250 k (
Cat teSnapper, Saddletail Snapper and Red Emperor) fisheries. 200 600 a rh
The report found standardised catch rates were 150 tc
400 aC
depressed during the period 2007−09. This conflicts with 100
steady long term nominal catch rate trends (Figure 80). 20050
Crimson Snapper are a schooling species and may be 0 0
susceptible to hyperstability.
2003
2004
2005
2006
2007
2008
2009
2010
2011
Minimal local biological data was available. Age based catch curves were considered from Fry and Milton (2009), Figure 80: Commercial catch (t) and catch rates of Crimson
Snapper (GOC) caught by trawl and line, reported in logbooks from fish collected 1990–2003. Length information from 2003–2011.
the FOP sampled from 2004–2006 and in 2009 was
w but is considered. The total mortality estimate (Z) is lo

Snapper–Goldband (
Stock status of Queensland’s fisheries resources 2012 97
Pristipomoides multidens) East Coast
Stock status 2012 Undefined
Stock status 2011 Uncertain
Principal fishery Coral Reef Fin Fish Fishery (CRFFF) / Deep Water Fin Fish Fishery (DWFFF)
Justification Commercial harvest is historically between 30–60 t per year. No recreational estimate is available for this species. It is unknown if there is a single stock or separate stocks on the east coast. Some otoliths have been collected but have not been aged. This species is also currently monitored as a key ‘other species’ (OS) through the Performance Measurement System (PMS).
Information sources
• Commercial logbook catch and effort
• Other species ‘OS’ quota usage
• Charter logbook catch
• Performance measures
Comments
Goldband Snapper is predominantly a deep water species that may be targeted more readily in the future, with the potential for L1–L3 line fishers utilising mechanical reel technology to target deeper waters. Catches have remained relatively steady from 2004–05 (when OS quota was introduced) to 2010–11 although the species also may be misreported as ‘jobfish – other’ (Figure 81). The species is potentially slow growing but information on its biology was considered limited at the time of assessment. It is also unknown if Goldband Snapper on the east coast is made up of a single stock or separate stocks.
Recreational catch is unquantifiable as catch was reported as ‘jobfish’ in the last survey (2010). There have been some concerns about species identification over the minimal charter catch reported (<1 t in 2010–11) as the species is thought to be popular in the charter fishery. ‘Jobfish-unspecified’ catch reported in the charter fishery in 2010–11 was approximately 4 t.
Fisheries Queensland will continue to monitor this species through its PMS.
Future assessment needs
This species is unlikely to be a priority for specific monitoring at this stage, resulting in a likely ‘uncertain’ status for some time.
Figure 81: Commercial catch (t) of Goldband Snapper, reported in logbooks 2000–01 to 2010–11. Some catch of Goldband Snapper may be still reported as ‘jobfish-unspecified’ in the logbook.
0102030405060708090
100
2000
-01
2001
-02
2002
-03
2003
-04
2004
-05
2005
-06
2006
-07
2007
-08
2008
-09
2009
-10
2010
-11
Cat
ch (t
)
Goldband snapper Jobf ish - unspecif ied
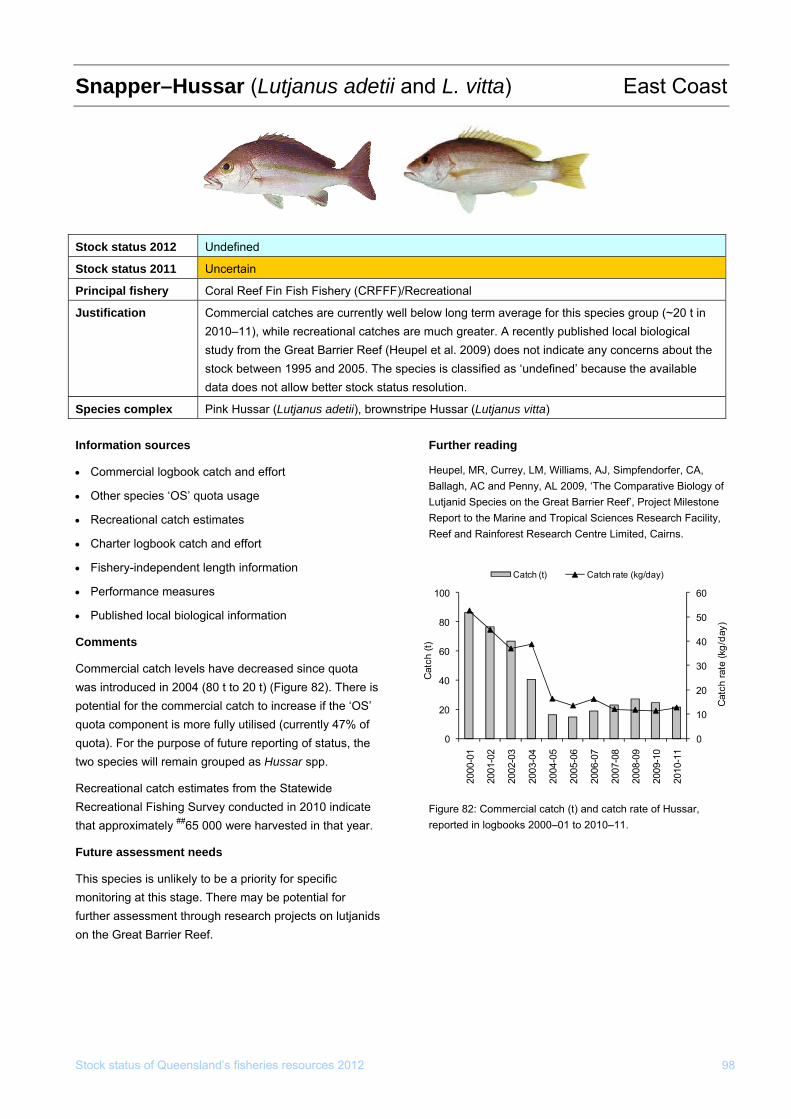
Stock status of Queensland’s fisheries resources 2012 98
) Snapper–Hussar (Lutjanus adetii and L. vitta East Coast
formation sources
catch and effort
th information
ocal biological information
ta e is S’
he
y conducted in 2010 indicate
Further reading
Heupel, MR, Currey, LM, Williams, AJ, Simpfendorfer, CA, Ballagh, AC and Penny, AL 2009, ‘The Comparative Biology of Lutjanid Species on the Great Barrier Reef’, Project Milestone Report to the Marine and Tropical Sciences Research Facility, Reef and Rainforest Research Centre Limited, Cairns.
In
• Commercial logbook
• Other species ‘OS’ quota usage
• Recreational catch estimates
• Charter logbook catch and effort
• Fishery-independent leng
• Performance measures
• Published l
Comments
Commercial catch levels have decreased since quowas introduced in 2004 (80 t to 20 t) (Figure 82). Therpotential for the commercial catch to increase if the ‘Oquota component is more fully utilised (currently 47% of quota). For the purpose of future reporting of status, ttwo species will remain grouped as Hussar spp.
Recreational catch estimates from the Statewide Recreational Fishing Survethat approximately ##65 000 were harvested in that year.
Future assessment needs
This species is unlikely to be a priority for specific monitoring at this stage. There may be potential for further assessment through research projects on lutjanids on the Great Barrier Reef.
Figure 82: Commercial catch (t) and catch rate of Hussar, reported in logbooks 2000–01 to 2010–11.
Stock status 2012 Undefined
Stock status 2011 Uncertain
Principal fishery Coral Reef Fin Fish Fishery (CRFFF)/Recreational
Justification Commercial catches are currently well below long term average for this species group (~20 t in 2010–11), while recreational catches are much greater. A recently published local biological study from the Great Barrier Reef (Heupel et al. 2009) does not indicate any concerns about thstock between 1995 and 2005. The species is classified as ‘undefined’ because the availabledata does not allow better stock status resolution.
e
Species complex Pink Hussar (Lutjanus adetii), brownstripe Hussar (Lutjanus vitta)
Catch (t) Catch rate (kg/day)
0
10
20
30
40
50
60
0
20
40
60
80
100
2000
-01
2001
-02
2002
-03
2003
-04
2004
-05
2005
-06
2006
-07
2007
-08
2008
-09
2009
-10
2010
-11
Cat
ch ra
te (k
g/da
y)
Cat
ch (t
)
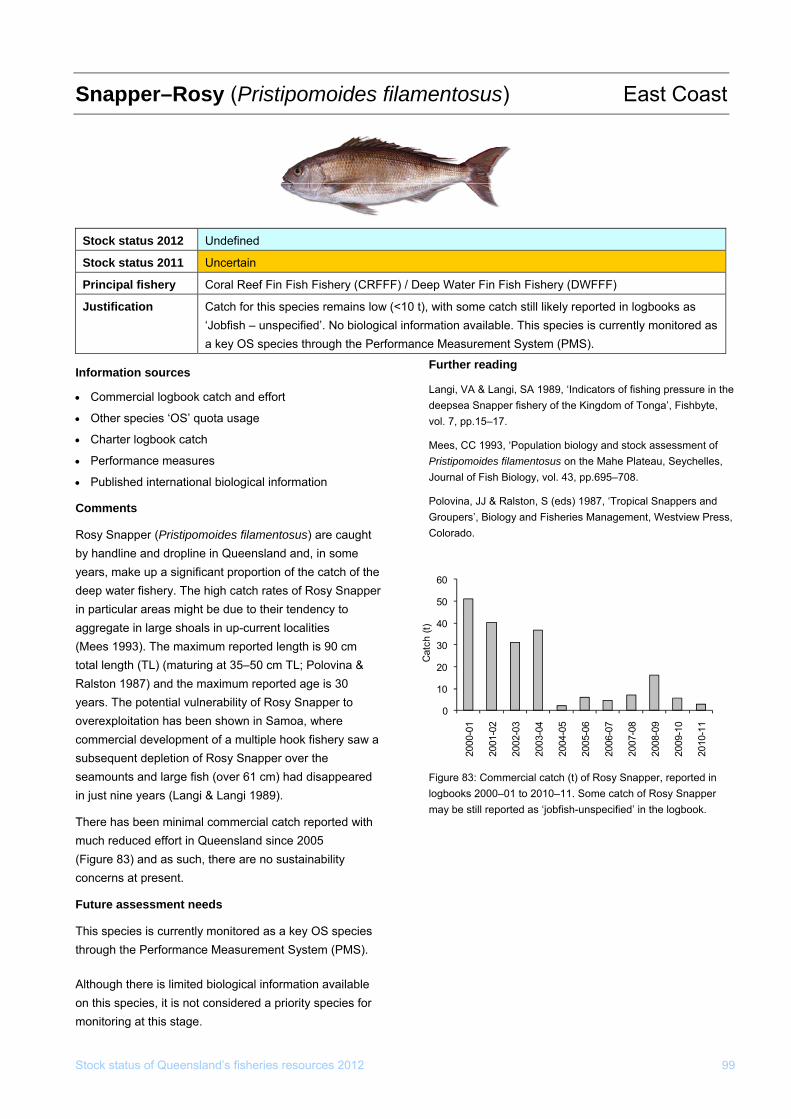
Snapper–Rosy (Pristipomoides filamentosus) East Coast
Stock status of Queensland’s fisheries resources 2012 99
Stock status 2012 Undefined
Stock status 2011 Uncertain
Principal fishery Coral Reef Fin Fish Fishery (CRFFF) / Deep Water Fin Fish Fishery (DWFFF)
Justification mains low (<10 t), with some catch still likely reported in logbooks as
Catch for this species re‘Jobfish – unspecified’. No biological information available. This species is currently monitored asa key OS species through the Performance Measurement System (PMS).
Information sources
• Commercial logbook catch and effort
• Other species ‘OS’ quota usage
• Charter logbook catch
• Performance measures
• Published international biological information
Comments
Rosy Snapper (Pristipomoides filamentosus) are caught by handline and dropline in Queensland and, in some years, make up a significant proportion of the catch of the deep water fishery. The high catch rates of Rosy Snapper in particular areas might be due to their tendency to aggregate in large shoals in up-current localities (Mees 1993). The maximum reported length is 90 cm total length (TL) (maturing at 35–50 cm TL; Polovina & Ralston 1987) and the maximum reported age is 30 years. The potential vulnerability of Rosy Snapper to overexploitation has been shown in Samoa, where commercial development of a multiple hook fishery saw a subsequent depletion of Rosy Snapper over the seamounts and large fish (over 61 cm) had disappeared in just nine years (Langi & Langi 1989).
There has been minimal commercial catch reported with much reduced effort in Queensland since 2005 (Figure 83) and as such, there are no sustainability concerns at present.
Future assessment needs
This species is currently monitored as a key OS species through the Performance Measurement System (PMS).
Although there is limited biological information available on this species, it is not considered a priority species for monitoring at this stage.
ercial catch (t) of Rosy Snapper, reported in 2010–11. Some catch of Rosy Snapper
h-unspecified’ in the logbook.
Further reading
Langi, VA & Langi, SA 1989, ‘Indicators of fishing pressure in the deepsea Snapper fishery of the Kingdom of Tonga’, Fishbyte, vol. 7, pp.15–17.
Mees, CC 1993, ‘Population biology and stock assessment of Pristipomoides filamentosus on the Mahe Plateau, Seychelles, Journal of Fish Biology, vol. 43, pp.695–708.
Polovina, JJ & Ralston, S (eds) 1987, ‘Tropical Snappers and Groupers’, Biology and Fisheries Management, Westview Press, Colorado.
Figure 83: Commlogbooks 2000–01 tomay be still reported as ‘jobfis
0
10
20
2000
-01
2001
-02
2002
-03
2003
-04
2004
-05
2005
-06
2006
-07
2007
-08
2008
-09
2009
-10
2010
-11
30
40
50
60
Cat
ch (t
)
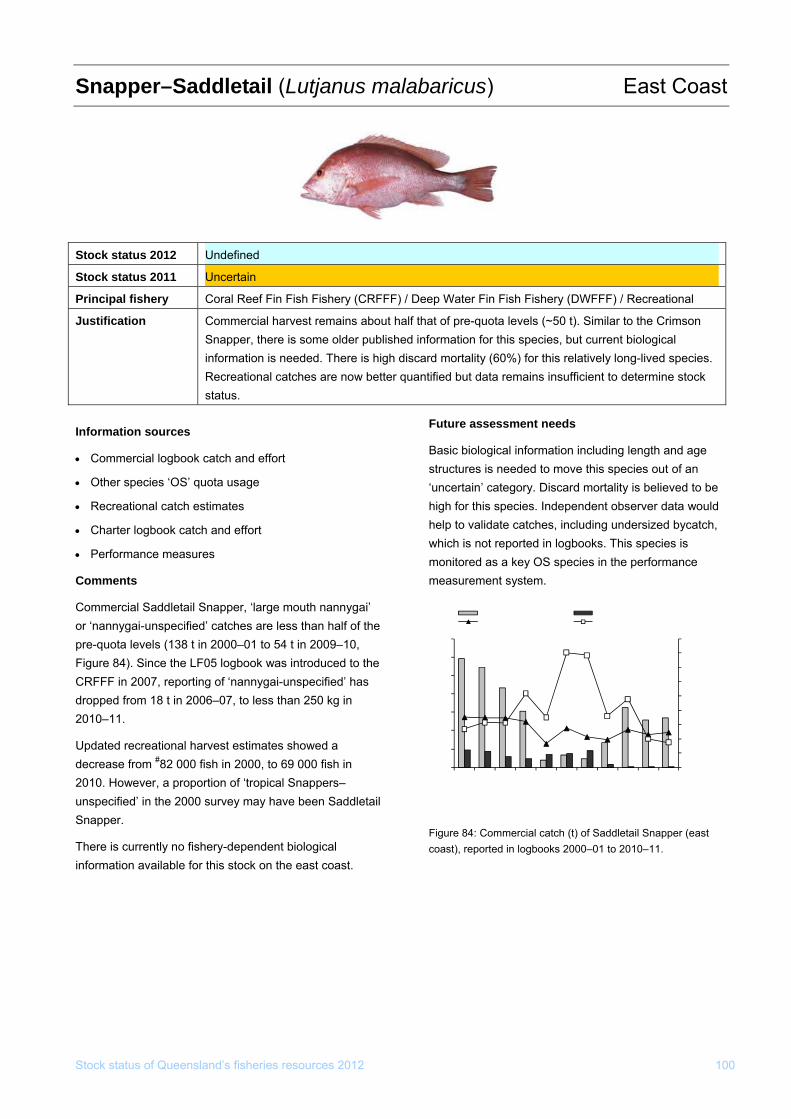
Stock status of Queensland’s fisheries resources 2012 100
alabaricus) East Coast Snapper–Saddletail (Lutjanus m
Stock status 2012 Undefined
Stock status 2011 Uncertain
Principal fishery Coral Reef Fin ter Fin Fish Fishery (DWFFF) / Recreational Fish Fishery (CRFFF) / Deep Wa
Justification vest remains about half that of pre-quota leCommercial har vels (~50 t). Similar to the Crimson Snapper, there is some older published information for this species, but current biological information is needed. There is high discard mortality (60%) for this relatively long-lived species. Recreational catches are now better quantified but data remains insufficient to determine stock status.
Information sources Basic biological information including length and age
• Commercial logbook catch and effort structures is needed to move this species out of an
• Other species ‘OS’ quota usage ‘uncertain’ category. Discard mortality is believed to be • Recreational catch estimates high for this species. Independent observer data would
• help to validate catches, including undersized bycatch, Charter logbook catch and effort which is not reported in logbooks. This species is
• Performance measures monitored as a key OS species in the performance Comments measurement system.
Commercial Saddletail Snapper, ‘large mouth nannygai’ Saddletail Snp Nannygai-Unsp.
or ‘nannygai-unspecified’ catches are less than half of the Catch rate (kg/day) Dory catch rate (kg/day)
pre-quota levels (138 t in 2000–01 to 54 t in 2009–10, 140 180160
Figure 84). Since the LF05 logbook was introduced to the 120 )
140 ya
CRFFF in 2007, reporting of ‘nannygai-unspecified’ has ) 100 /dt ( 120 gk
80dropped from 18 t in 2006–07, to less than 250 kg in
h
100 (ct te
Ca a
60 802010–11.
rh60 tc
40 a
40 C
Updated recreational harvest estimates showed a 20 20decrease from #82 000 fish in 2000, to 69 000 fish in 0 02010. However, a proportion of ‘tropical Snappers–unspecified’ in the 2000 survey may have been Saddletail 20
00-0
1
2001
-02
2002
-03
2003
-04
2004
-05
2005
-06
2006
-07
2007
-08
2008
-09
2009
-10
2010
-11
Snapper. Figure 84: Commercial catch (t) of Saddletail Snapper (east
There is currently no fishery-dependent biological coast), reported in logbooks 2000–01 to 2010–11. information available for this stock on the east coast.
Future assessment needs
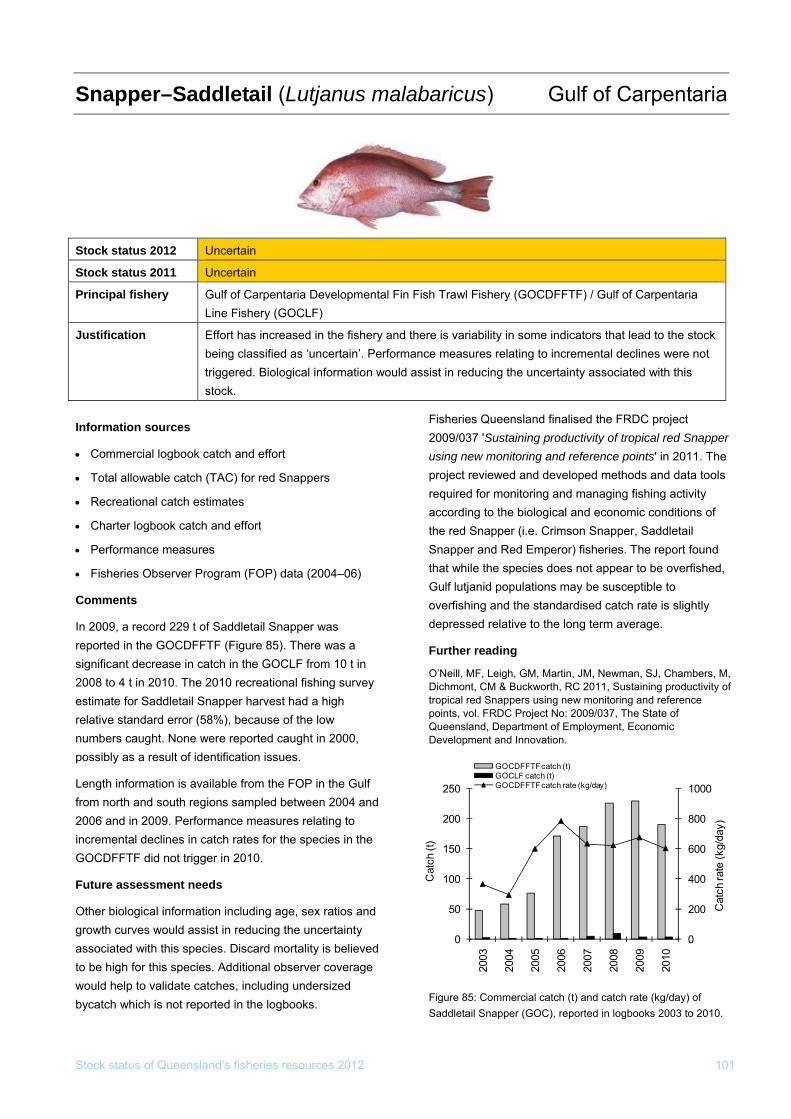
Stock status of Queensland’s fisheries resources 2012 101
Gulf of CSnapper–Saddletail (Lutjanus malabaricus) arpentaria
tock status 2012 S Uncertain
Stock status 2011 Uncertain
Principal fishery Gulf of Carpentaria Developmental Fin Fish Trawl Fishery (GOCDFFTF) / Gulf of Carpentaria Line Fishery (GOCLF)
Justification Effort has increased in the fishery and there is variability in some indicators that lead to thbeing classified as ‘uncertain’. Performance measures relating to incremental declines were nottriggered. Biological information would assist in reducing the uncertainty associated with this stock.
e stock
Information sources
• Commercial logbook catch and effort
• Total allowable catch (TAC) for red Snappers
ort
e measures
,
ilable from the FOP in the Gulf 04 and
d the FRDC project apper
e
M, of
Figure 85: Commercial catch (t) and catch rate (kg/day) of Saddletail Snapper (GOC), reported in logbooks 2003 to 2010.
• Recreational catch estimates
• Charter logbook catch and eff
• Performanc
• Fisheries Observer Program (FOP) data (2004–06)
Comments
In 2009, a record 229 t of Saddletail Snapper was reported in the GOCDFFTF (Figure 85). There was a significant decrease in catch in the GOCLF from 10 t in 2008 to 4 t in 2010. The 2010 recreational fishing survey estimate for Saddletail Snapper harvest had a high relative standard error (58%), because of the low numbers caught. None were reported caught in 2000possibly as a result of identification issues.
Length information is avafrom north and south regions sampled between 202006 and in 2009. Performance measures relating to incremental declines in catch rates for the species in the GOCDFFTF did not trigger in 2010.
Future assessment needs
Other biological information including age, sex ratios and growth curves would assist in reducing the uncertainty associated with this species. Discard mortality is believed to be high for this species. Additional observer coverage would help to validate catches, including undersized bycatch which is not reported in the logbooks.
Fisheries Queensland finalise2009/037 'Sustaining productivity of tropical red Snusing new monitoring and reference points' in 2011. Thproject reviewed and developed methods and data toolsrequired for monitoring and managing fishing activity according to the biological and economic conditions of the red Snapper (i.e. Crimson Snapper, Saddletail Snapper and Red Emperor) fisheries. The report found that while the species does not appear to be overfished,Gulf lutjanid populations may be susceptible to overfishing and the standardised catch rate is slightly depressed relative to the long term average.
Further reading
O’Neill, MF, Leigh, GM, Martin, JM, Newman, SJ, Chambers, Dichmont, CM & Buckworth, RC 2011, Sustaining productivity tropical red Snappers using new monitoring and reference points, vol. FRDC Project No: 2009/037, The State of Queensland, Department of Employment, Economic Development and Innovation.
1000250
GOCDFFTF catch (t)GOCLF catch (t)GOCDFFTF catch rate (kg/day)
0
200
400
600
800
0
50
100
150
200
2003
2004
2005
2006
2007
2008
2009
2010
Cat
ch ra
te (k
g/da
y)
Cat
ch (t
)
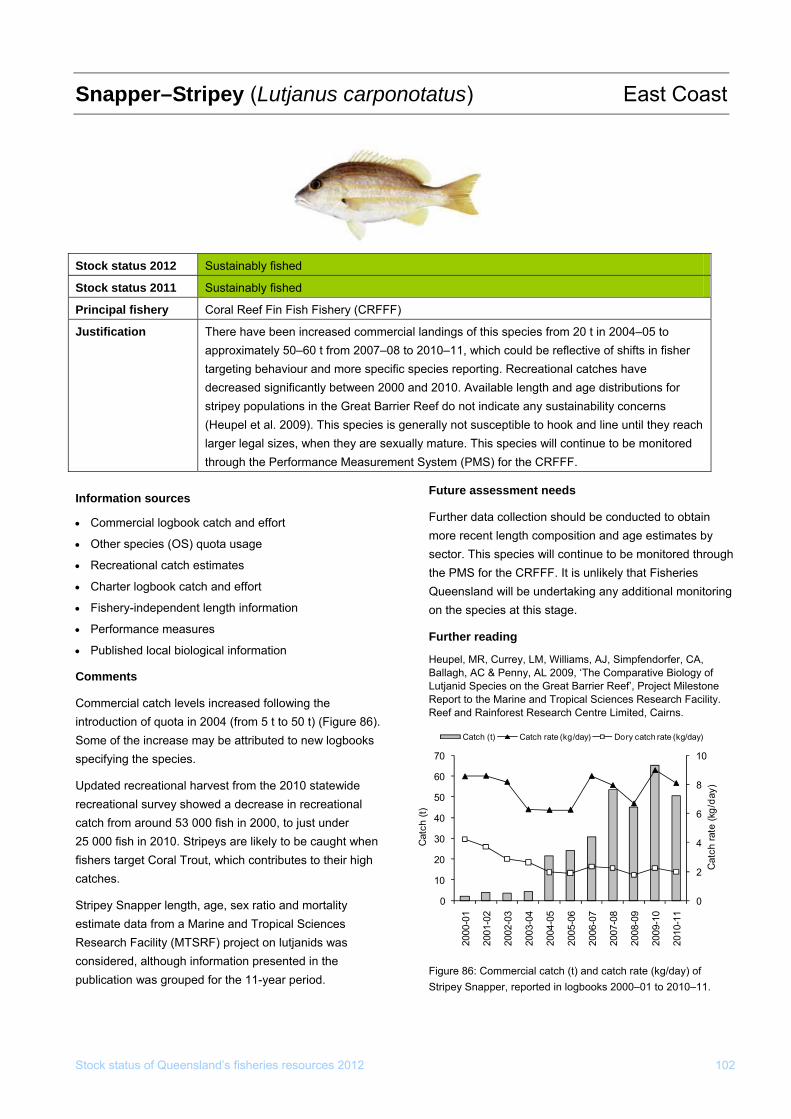
Snapper–Stripey (Lutjanus carponotatus) East Coast
.
en h
by sector. This species will continue to be monitored through the PMS for the CRFFF. It is unlikely that Fisheries Queensland will be undertaking any additional monitoring on the species at this stage.
Further reading
Heupel, MR, Currey, LM, Williams, AJ, Simpfendorfer, CA, Ballagh, AC & Penny, AL 2009, ‘The Comparative Biology of Lutjanid Species on the Great Barrier Reef’, Project Milestone Report to the Marine and Tropical Sciences Research Facility. Reef and Rainforest Research Centre Limited, Cairns.
Figure 86: Commercial catch (t) and catch rate (kg/day) of Stripey Snapper, reported in logbooks 2000–01 to 2010–11.
Stock status of Queensland’s fisheries resources 2012 102
Information sources
• Commercial logbook catch and effort
• Other species (OS) quota usage
• Recreational catch estimates
• Charter logbook catch and effort
• Fishery-independent length information
• Performance measures
• Published local biological information
Comments
Commercial catch levels increased following the introduction of quota in 2004 (from 5 t to 50 t) (Figure 8Some of the increase may be attributed to new logboospecifying the species.
Updated recreational harvest from the 2010 statewide recreational survey showed a decrease in recreational catch from around 53 000 fish in 2000, to just under 25 000 fish in 2010. Stripeys are likely to be caught whfishers target Coral Trout, which contributes to their higcatches.
Stripey Snapper length, age, sex ratio and mortality estimate data from a Marine and Tropical Sciences Research Facility (MTSRF) project on lutjanids was considered, although information presented in the publication was grouped for the 11-year period.
6)ks
Future assessment needs
Further data collection should be conducted to obtain more recent length composition and age estimates
Stock status 2012 Sustainably fished
Stock status 2011 Sustainably fished
Principal fishery Coral Reef Fin Fish Fishery (CRFFF)
Justification
vailable length and age distributions for stainability concerns
(Heupel et al. 2009). This species is generally not susceptible to hook and line until they reach larger legal sizes, when they are sexually es will continue to be monitored through the Performance Measurement Sy
There have been increased commercial landings of this species from 20 t in 2004–05 to approximately 50–60 t from 2007–08 to 2010–11, which could be reflective of shifts in fisher targeting behaviour and more specific species reporting. Recreational catches have decreased significantly between 2000 and 2010. Astripey populations in the Great Barrier Reef do not indicate any su
mature. This specistem (PMS) for the CRFFF.
Catch (t) Catch rate (kg/day) Dory catch rate (kg/day)
0
2
4
8
10
0
10
20
30
50
60
70
2000
-01
2001
-02
2002
-03
2003
-04
2004
-05
2005
-06
2006
-07
2007
-08
2008
-09
2009
-10
2010
-11
Cat
ch ra
te (
day)
Cat
ch (t
) 640 kg/
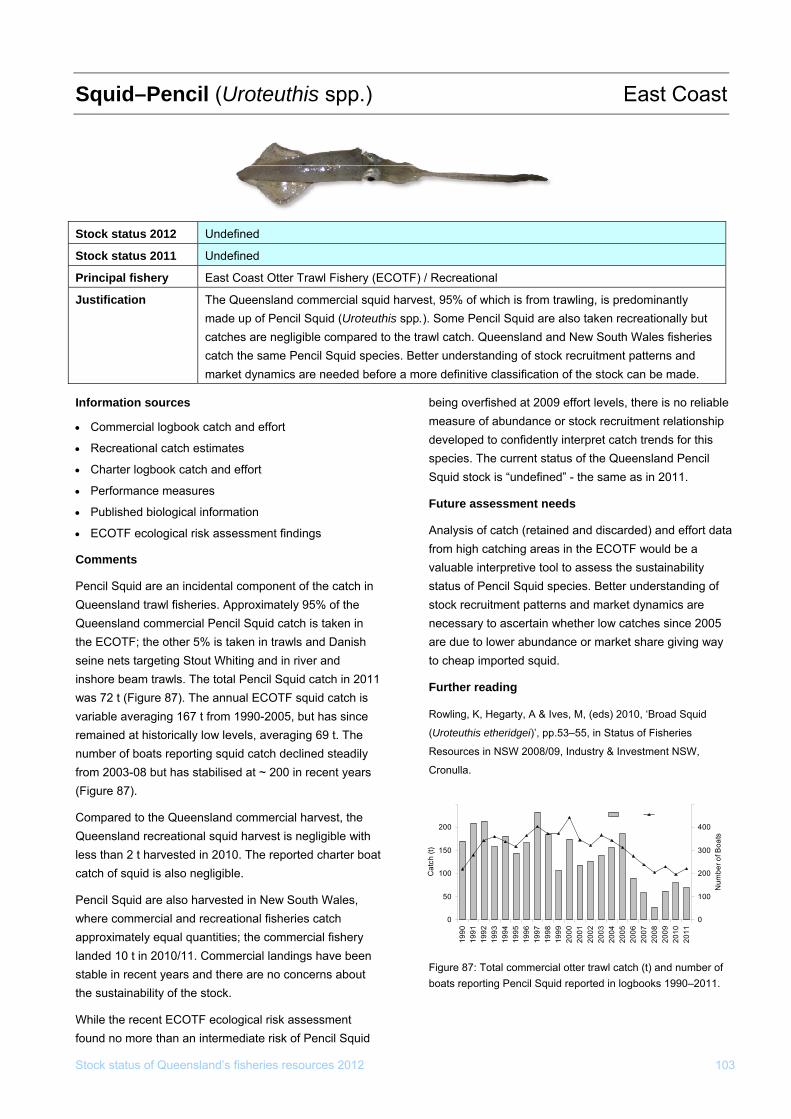
Squid–Pencil (Uroteuthis spp.) East Coast
Stock status 2012 Undefined
Stock status 2011 Undefined
Principal fishery East Coast Otter Trawl Fishery (ECOTF) / Recreational
J
and market dynamics are needed before a mor tock can be made.
ustification The Queensland commercial squid harvest, 95% of which is from trawling, is predominantly made up of Pencil Squid (Uroteuthis spp.). Some Pencil Squid are also taken recreationally but catches are negligible compared to the trawl catch. Queensland and New South Wales fisheries catch the same Pencil Squid species. Better understanding of stock recruitment patterns
e definitive classification of the s
Information sources
• Commercial logbook catch and effort
• Recreational catch estimates
• Charter logbook catch and effort
biological information
en in
011 is
nce
eadily
le with r boat
egligible.
d in New South Wales, where commercial and recreational fisheries catch
dance or stock recruitment relationship
in 2011.
a
Figure 87: Total commercial otter trawl catch (t) and number of boats reporting Pencil Squid reported in logbooks 1990–2011.
• Performance measures
• Published
• ECOTF ecological risk assessment findings
Comments
Pencil Squid are an incidental component of the catch in Queensland trawl fisheries. Approximately 95% of theQueensland commercial Pencil Squid catch is takthe ECOTF; the other 5% is taken in trawls and Danishseine nets targeting Stout Whiting and in river and inshore beam trawls. The total Pencil Squid catch in 2was 72 t (Figure 87). The annual ECOTF squid catch variable averaging 167 t from 1990-2005, but has siremained at historically low levels, averaging 69 t. The number of boats reporting squid catch declined stfrom 2003-08 but has stabilised at ~ 200 in recent years (Figure 87).
Stock status of Queensland’s fisheries resources 2012 103
Compared to the Queensland commercial harvest, the Queensland recreational squid harvest is negligibless than 2 t harvested in 2010. The reported chartecatch of squid is also n
Pencil Squid are also harveste
approximately equal quantities; the commercial fishery landed 10 t in 2010/11. Commercial landings have been stable in recent years and there are no concerns about the sustainability of the stock.
While the recent ECOTF ecological risk assessment found no more than an intermediate risk of Pencil Squid
being overfished at 2009 effort levels, there is no reliable measure of abundeveloped to confidently interpret catch trends for this species. The current status of the Queensland Pencil Squid stock is “undefined” - the same as
Future assessment needs
Analysis of catch (retained and discarded) and effort datfrom high catching areas in the ECOTF would be a valuable interpretive tool to assess the sustainability status of Pencil Squid species. Better understanding of stock recruitment patterns and market dynamics are necessary to ascertain whether low catches since 2005 are due to lower abundance or market share giving wayto cheap imported squid.
Further reading
Rowling, K, Hegarty, A & Ives, M, (eds) 2010, ‘Broad Squid
(Uroteuthis etheridgei)’, pp.53–55, in Status of Fisheries
Resources in NSW 2008/09, Industry & Investment NSW,
Cronulla.
250 500Catch Boats
0
50
100
150
200
1990
1991
1992
1993
1994
1995
1996
1997
1998
1999
2000
2001
2002
2003
2004
2005
2006
2007
2008
2009
2010
2011
Cat
ch (t
)
0
100
200
300
400
Num
ber o
f Boa
ts
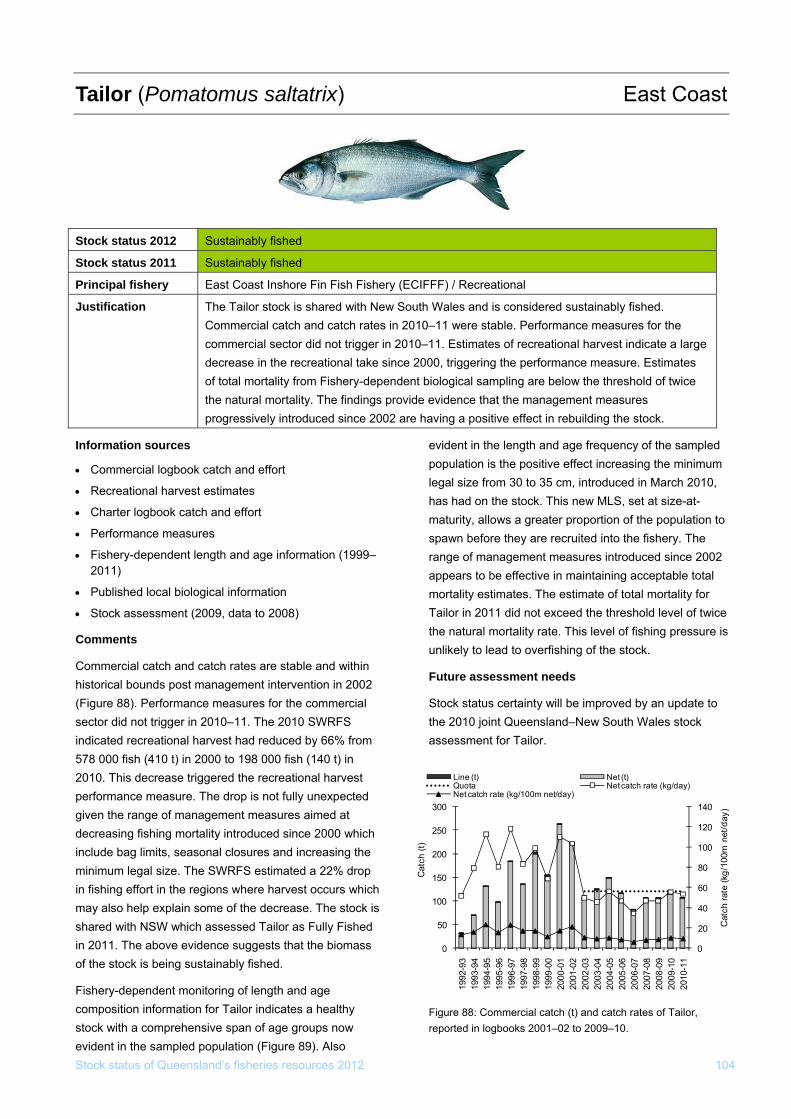
Tailor (Pomatomus saltatrix) East Coast
Stock status of Queensland’s fisheries resources 2012 104
Stock status 2012 Sustainably fished
Stock status 2011 Sustainably fished
Principal fishery East Coast Inshore Fin Fish Fishery (ECIFFF) / Recreational
Justification The Tailor stock is shared with New South Wales and is considered sustainably fished. Commercial catch and catch rates in 2010–11 were stable. Performance measures for the commercial sector did not trigger in 2010–11. Estimates of recreational harvest indicate a largdecrease in the recreational take since 2000, triggering the performance measure. Estimates of total mortality from Fishery-dependent biological sampling are below the threshold of twice the natur
e
al mortality. The findings provide evidence that the management measures progressively introduced since 2002 are h lding the stock. aving a positive effect in rebui
Information sources
• Commercial logbook catch and effort
• Recreational harvest estimates
• Charter logbook catch and effort
• Performance measures
• Fishery-dependent length and age information (1999–2011)
• Published local biological information
• Stock assessment (2009, data to 2008)
Comments
Commercial catch and catch rates are stable and within historical bounds post management intervention in 2002 (Figure 88). Performance measures for the commercial sector did not trigger in 2010–11. The 2010 SWRFS indicated recreational harvest had reduced by 66% from 578 000 fish (410 t) in 2000 to 198 000 fish (140 t) in 2010. This decrease triggered the recreational harvest performance measure. The drop is not fully unexpected given the range of management measures aimed at decreasing fishing mortality introduced since 2000 which include bag limits, seasonal closures and increasing the minimum legal size. The SWRFS estimated a 22% drop in fishing effort in the regions where harvest occurs which may also help explain some of the decrease. The stock is shared with NSW which assessed Tailor as Fully Fished in 2011. The above evidence suggests that the biomass of the stock is being sustainably fished.
Fishery-dependent monitoring of length and age composition information for Tailor indicates a healthy stock with a comprehensive span of age groups now evident in the sampled population (Figure 89). Also
Figure 88: Commercial catch (t) and catch rates of Tailor, reported in logbooks 2001–02 to 2009–10.
evident in the length and age frequency of the sampled population is the positive effect increasing the minimum legal size from 30 to 35 cm, introduced in March 2010, has had on the stock. This new MLS, set at size-at-maturity, allows a greater proportion of the population to spawn before they are recruited into the fishery. The range of management measures introduced since 2002 appears to be effective in maintaining acceptable total mortality estimates. The estimate of total mortality for Tailor in 2011 did not exceed the threshold level of twice the natural mortality rate. This level of fishing pressure is unlikely to lead to overfishing of the stock.
Future assessment needs
Stock status certainty will be improved by an update to the 2010 joint Queensland–New South Wales stock assessment for Tailor.
Line (t) Net (t)Quota Net catch rate (kg/day)Net catch rate (kg/100m net/day)
0
20
40
60
80
100
140
0
50
100
0
300
1992
-93
1993
-94
1994
-95
1995
-96
1996
-97
1997
-98
1998
-99
1999
-00
2000
-01
2001
-02
2002
-03
2003
-04
2004
-05
2005
-06
2006
-07
2007
-08
2008
-09
2009
-10
2010
-11
Cat
ch ra
te (k
g/10
0m n
et/d
ay)
Cat
ch (t
)
120
200
250
15
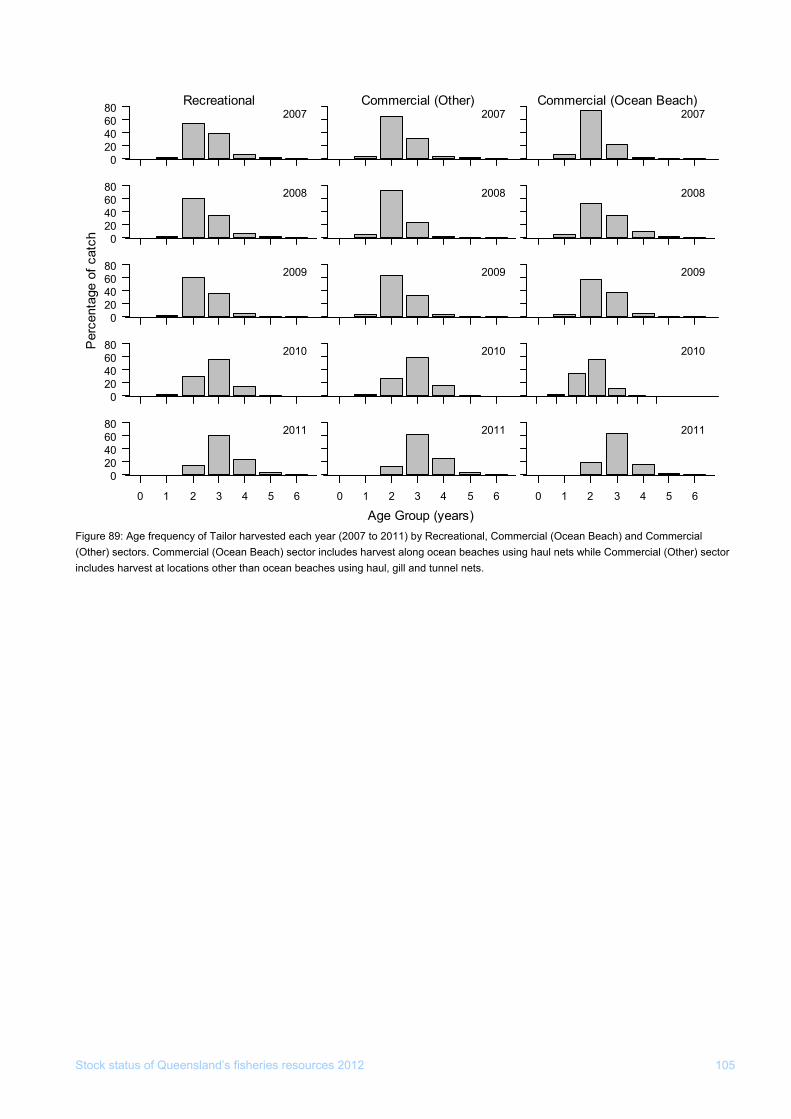
Stock status of Queensland’s fisheries resources 2012 105
year (2007 to 2011) by Recreational, Commercial (Ocean Beach) and Commercial ch) sector includes harvest along ) sector
her than ocean beaches using haul, gill and tunnel nets.
Figure 89: Age frequency of Tailor harvested each (Other) sectors. Commercial (Ocean Bea ocean beaches using haul nets while Commercial (Other
includes harvest at locations ot
0204060 200780 Recreational Commercial (Other)
2007Commercial (Ocean Beach)
2007
020406080 2008 2008 2008
020406080
6080 2010 2010 2010
2009 2009 2009
02040
0 1 2 3 4 5 6
020406080 2011
4 5 6
2011
0 1 2 3 4 5
2011
0 1 2 3 6
Age Group (years)
erc
aP
enta
ge o
f ctc
h

Stock status of Queensland’s fisheries resources 2012 106
s) East Coast Teraglin (Atractoscion aequiden
Stock status 2012 Undefined
Stock status 2011 Undefined
Principal fishery Rocky Reef Fin Fish Fishery (RRFFF) / Recreational
Justification Commercial catches have been relatively stable the last few years and the catch performance measure was not triggered. There is some concern over lack of larger fish in the population based on fishery-dependent sampling data however insufficient biological data is available to clarify stock status. Teraglin is currently being assessed as part of a FRDC project on the fishery.
Information sources
• Commercial logbook catch and effort
• Recreational catch estimates
• Charter logbook catch and effort
• Fishery-dependent length information (2009–11)
• Performance measures
Comments
The catch of Teraglin increased from <5 t to 29 t in 2005, which may be an artefact of logbook changes. The commercial catch has now stabilized to approximately 10–20 t over the past few years (Figure 90). The performance measure relating to Teraglin catch was not triggered in 2011.
Teraglin is consistently targeted in the charter fishery. The 2010 recreational fishing survey estimate for Teraglin harvest is considered unreliable given the low numbers reported.
Length information from Fisheries Queensland’s fishery-dependent monitoring in the last three years was analysed, but numbers of fish sampled were low and not considered representative of the population. Teraglin has a restricted range in southern Queensland, extending from the NSW border north to Rainbow Beach. NSW has reported the species as ‘fully fished’, saying that the stock is susceptible to fishing from commercial fishers and there is a likely significant reduction in the stock, however, more information is required.
Future assessment needs
Otoliths have been collected opportunistically as part of the fishery-dependent sampling. Age and total mortality estimates will be available in 2013.
A three-year FRDC funded project to address some of the knowledge gaps in the rocky reef fishery began in early 2009. The research is examining the important areas of juvenile habitat of rocky reef fish species in southern Queensland as well as assessing various harvest strategies for the fishery. Key growth, reproductive, and other fisheries parameters are being derived for Pearl Perch and Teraglin.
Figure 90: Commercial catch (t) and catch rate (kg/day) of
Teraglin, reported in logbooks 1992 to 2011.
0
10
20
30
40
50
60
0
5
10
15
20
25
30
35
1992
1993
1994
1995
1996
1997
1998
1999
2000
2001
2002
2003
2004
2005
2006
2007
2008
2009
2010
2011
Cat
ch ra
te (k
g/da
y)
Cat
ch (t
)
Catch (t) Catch rate (kg/day)
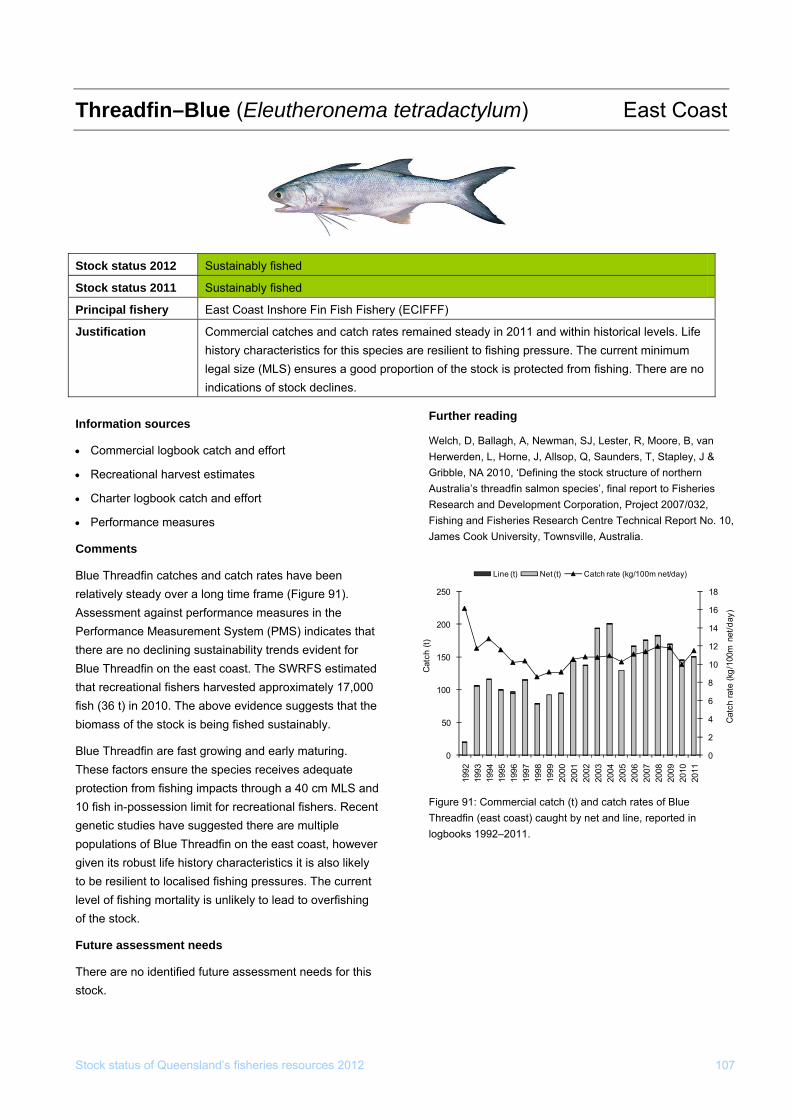
Threadfin–Blue (Eleutheronema tetradactylum) East Coast
Stock status of Queensland’s fisheries resources 2012 107
Information sources
• Commercial logbook catch and effort
• Recreational harvest estimates
• Charter logbook catch and effort
• Performance measures
Comments
Blue Threadfin catches and catch rates have been relatively steady over a long time frame (Figure 91). Assessment against performance measures in the Performance Measurement System (PMS) indicates that there are no declining sustainability trends evident for Blue Threadfin on the east coast. The SWRFS estimated that recreational fishers harvested approximately 17,000 fish (36 t) in 2010. The above evidence suggests that the biomass of the stock is being fished sustainably.
Blue Threadfin are fast growing and early maturing. These factors ensure the species receives adequate protection from fishing impacts through a 40 cm MLS and 10 fish in-possession limit for recreational fishers. Recent genetic studies have suggested there are multiple populations of Blue Threadfin on the east coast, however given its robust life history characteristics it is also likely to be resilient to localised fishing pressures. The current level of fishing mortality is unlikely to lead to overfishing of the stock.
Future assessment needs
There are no identified future assessment needs for this stock.
Figure 91: Commercial catch (t) and catch rates of Blue Threadfin (east coast) caught by net and line, reported in logbooks 1992–2011.
Further reading
Welch, D, Ballagh, A, Newman, SJ, Lester, R, Moore, B, van Herwerden, L, Horne, J, Allsop, Q, Saunders, T, Stapley, J & Gribble, NA 2010, ‘Defining the stock structure of northern Australia’s threadfin salmon species’, final report to Fisheries Research and Development Corporation, Project 2007/032, Fishing and Fisheries Research Centre Technical Report No. 10, James Cook University, Townsville, Australia.
Stock status 2012 Sustainably fished
Stock status 2011 Sustainably fished
Principal fishery East Coast Inshore Fin Fish Fishery (ECIFFF)
Justification Commercial catches and catch rates remained steady in 2011 and within historical levelshistory characteristics for this species are resilient to fishing pressure. The current minimum legal size (MLS) ensures a good proportion of the stock is protected from fishing. Theindications of stock declines.
. Life
re are no
0
2
4
12
14
16
0
50
200
1992
1993
1994
1995
1996
1997
1998
1999
2000
2001
2002
2003
2004
2005
2006
2007
2008
2009
2010
2011
Cat
cte
(kg/
100m
net
/day
)
Cat
ch (t
)
6
8
10
100
150
h ra
18250
Line (t) Net (t) Catch rate (kg/100m net/day)
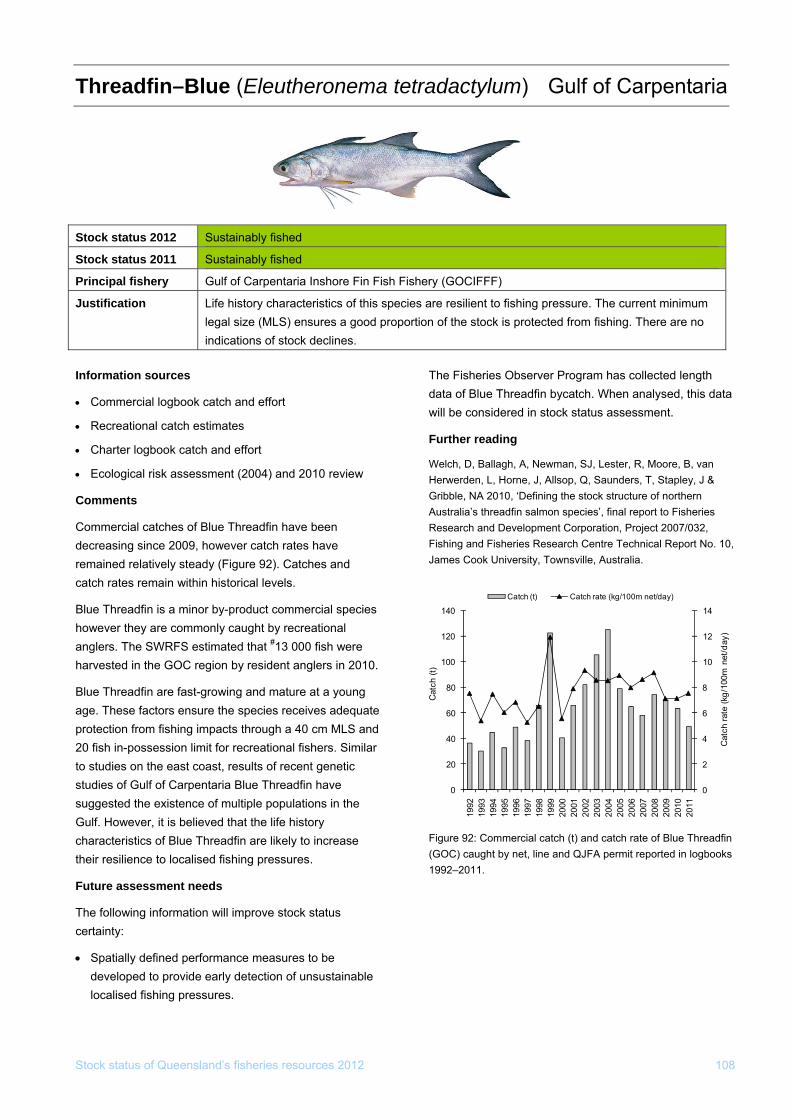
Stock status of Queensland’s fisheries resources 2012 108
tetradactylum) Gulf of CThreadfin–Blue (Eleutheronema arpentaria
Information sources
• Commercial logbook catch and effort
• Recreational catch estimates
• Charter logbook catch and effort
• Ecological risk assessment (2004) and 2010 review
Comments
Commercial catches of Blue Threadfin have been decreasing since 2009, however catch rates have remained relatively steady (Figure 92). Catches and catch rates remain within historical levels.
Blue Threadfin is a minor by-product commercial species however they are commonly caught by recreational anglers. The SWRFS estimated that #13 000 fish were harvested in the GOC region by resident anglers in 2010.
Blue Threadfin are fast-growing and mature at a young age. These factors ensure the species receives adequate protection from fishing impacts through a 40 cm MLS and 20 fish in-possession limit for recreational fishers. Similar to studies on the east coast, results of recent genetic studies of Gulf of Carpentaria Blue Threadfin have suggested the existence of multiple populations in the Gulf. However, it is believed that the life history characteristics of Blue Threadfin are likely to increase their resilience to localised fishing pressures.
Future assessment needs
The following information will improve stock status certainty:
• Spatially defined performance measures to be developed to provide early detection of unsustainable localised fishing pressures.
Figure 92: Commercial catch (t) and catch rate of Blue Threadfin (GOC) caught by net, line and QJFA permit reported in logbooks 1992–2011.
The Fisheries Observer Program has collected length data of Blue Threadfin bycatch. When analysed, this data will be considered in stock status assessment.
Further reading
Welch, D, Ballagh, A, Newman, SJ, Lester, R, Moore, B, van Herwerden, L, Horne, J, Allsop, Q, Saunders, T, Stapley, J & Gribble, NA 2010, ‘Defining the stock structure of northern Australia’s threadfin salmon species’, final report to Fisheries Research and Development Corporation, Project 2007/032, Fishing and Fisheries Research Centre Technical Report No. 10, James Cook University, Townsville, Australia.
Stock status 2012 Sustainably fished
Stock status 2011 Sustainably fished
Principal fishery Gulf of Carpentaria Inshore Fin Fish Fishery (GOCIFFF)
Justification Life history characteristics of this species are resilient to fishing pressure. The current minimulegal size (MLS) ensures a good proportion of the stock is protected from fishing. There are no indications of stock declines.
m
0
2
4
8
10
0
20
1992
1993
1994
1995
1996
1997
1998
1999
2000
2001
2002
2003
2004
2005
2006
2007
2008
2009
2010
2011
Cat
ch ra
te (k
g/10
0m n
et
(t
6
40
60
12
14
100
120
140
/day
)
)
80
Cat
ch
Catch (t) Catch rate (kg/100m net/day)
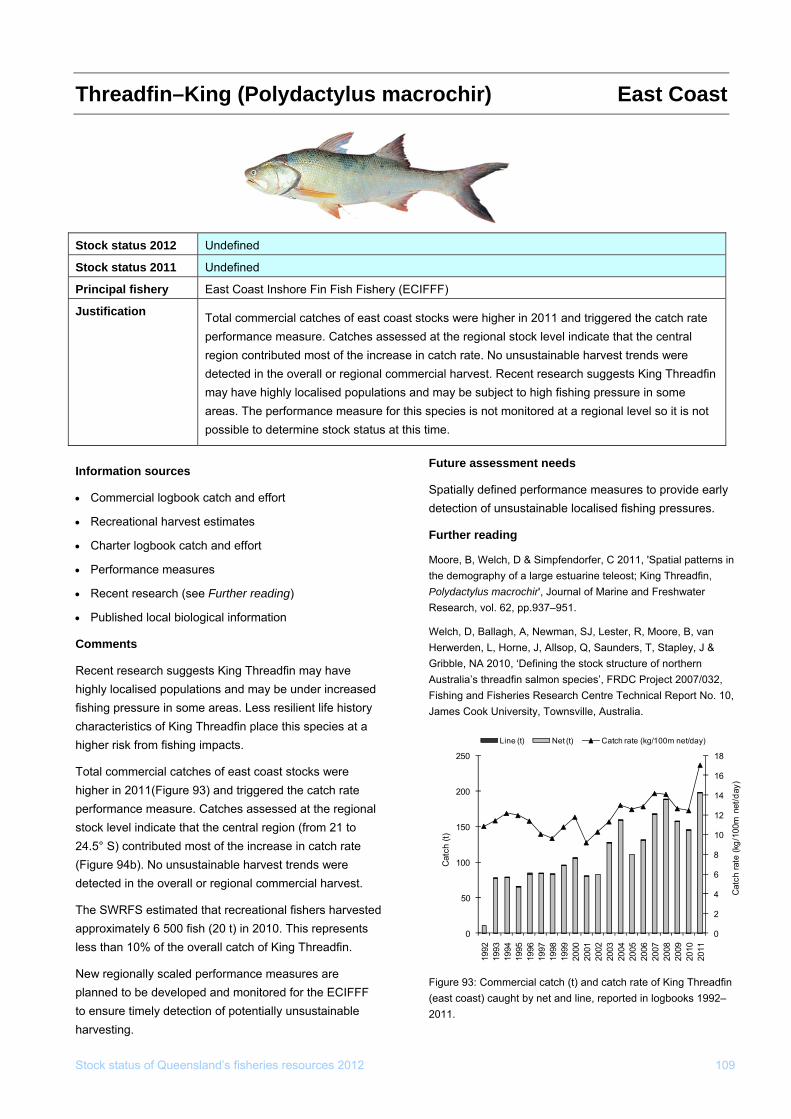
Stock status of Queensland’s fisheries resources 2012 109
s macrochir) EThreadfin–King (Polydactylu ast Coast
Information sources
• Commercial logbook catch and effort
ance measures
a
sures are IFFF
s.
n
Stapley, J & Gribble, NA 2010, ‘Defining the stock structure of northern
ies’, FRDC Project 2007/032,
Figure 93: Commercial catch (t) and catch rate of King Threadfin (east coast) caught by net and line, reported in logbooks 1992–
• Recreational harvest estimates
• Charter logbook catch and effort
• Perform
• Recent research (see Further reading)
• Published local biological information
Comments
Recent research suggests King Threadfin may have highly localised populations and may be under increased fishing pressure in some areas. Less resilient life history characteristics of King Threadfin place this species athigher risk from fishing impacts.
Total commercial catches of east coast stocks were higher in 2011(Figure 93) and triggered the catch rate performance measure. Catches assessed at the regional stock level indicate that the central region (from 21 to 24.5° S) contributed most of the increase in catch rate (Figure 94b). No unsustainable harvest trends were detected in the overall or regional commercial harvest.
The SWRFS estimated that recreational fishers harvested approximately 6 500 fish (20 t) in 2010. This represents less than 10% of the overall catch of King Threadfin.
New regionally scaled performance meaplanned to be developed and monitored for the ECto ensure timely detection of potentially unsustainable harvesting.
Future assessment needs
Spatially defined performance measures to provide earlydetection of unsustainable localised fishing pressure
Further reading
Moore, B, Welch, D & Simpfendorfer, C 2011, 'Spatial patterns ithe demography of a large estuarine teleost; King Threadfin, Polydactylus macrochir', Journal of Marine and Freshwater Research, vol. 62, pp.937–951.
Welch, D, Ballagh, A, Newman, SJ, Lester, R, Moore, B, van Herwerden, L, Horne, J, Allsop, Q, Saunders, T,
Australia’s threadfin salmon specFishing and Fisheries Research Centre Technical Report No. 10, James Cook University, Townsville, Australia.
2011.
Stock status 2012 Undefined
Stock status 2011 Undefined
Principal fishery East Coast Inshore Fin Fish Fishery (ECIFFF)
Justification Total commercial catches of east coast stocks were higher in 2011 and triggered the catch rate performance measure. Catches assessed at the regional stock level indicate that the central region contributed most of the increase in catch rate. No unsustainable harvest trends were detected in the overall or regional commercial harvest. Recent research suggests King Threadmay have highly localised populations and may be subject to high fishing pressure in some areas. The performance measure for this species is not monitored at a regional level so ipossible to determine stock status at this time.
fin
t is not
Line (t) Net (t) Catch rate (kg/100m net/day)
0
2
4
6
8
10
12
14
16
18
0
50
100
150
200
250
1992
1993
1994
1995
1996
1997
1998
1999
2000
2001
2002
2003
2004
2005
2006
2007
2008
2009
2010
2011
Cat
ch ra
te (k
g/10
0m n
et/d
ay)
Cat
ch (t
)
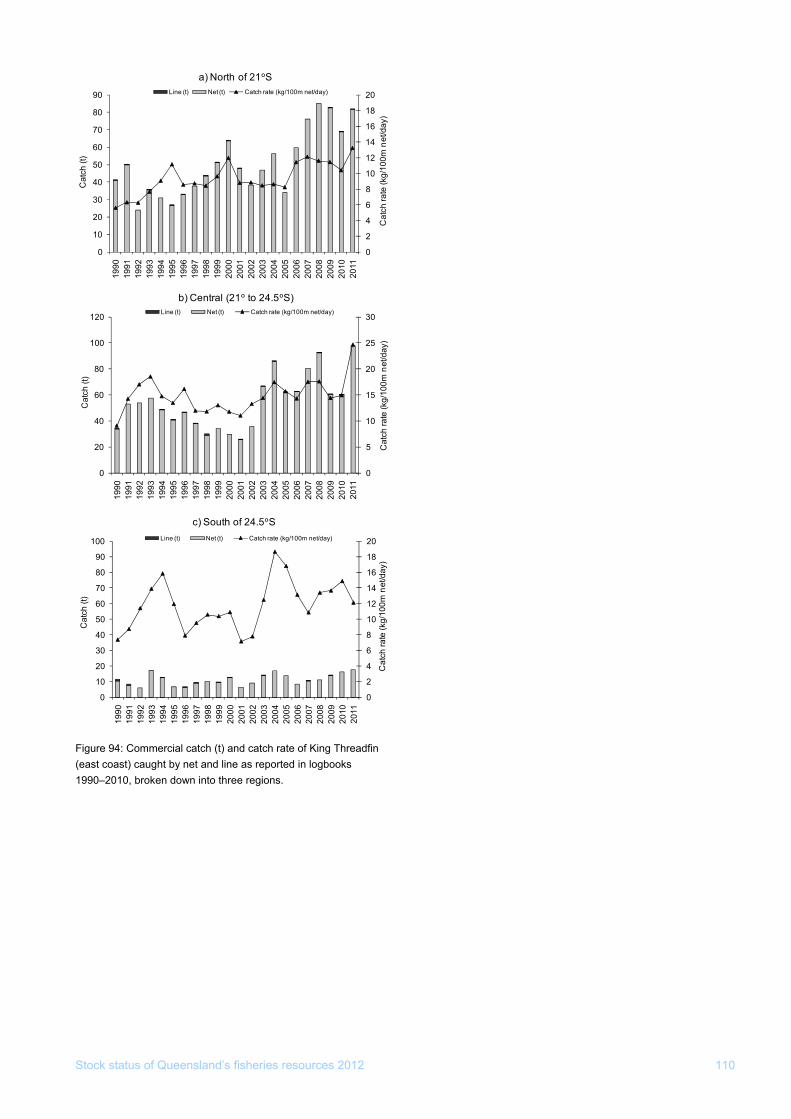
Figure 94: Commercial catch (t) and catch rate of King Threadfin (east coast) caught by net and line as reported in logbooks 1990–2010, broken down into three regions.
0
2
4
6
8
10
12
14
0
10
20
30
40
50
60
70
1990
1991
1992
1993
1994
1995
1996
1997
1998
1999
2000
2001
2002
2003
2004
2005
2006
2007
2008
2009
2010
2011
Cat
ch ra
te (k
g/10
0m n
et/
Cat
ch
c) South of 24.5°S
16
18
20
80
90
100
day)
(t)
Line (t) Net (t) Catch rate (kg/100m net/day)
0
5
10
15
20
25
30
0
20
40
60
80
100
120
1990
1991
1992
1993
1994
1995
1996
1997
1998
1999
2000
2001
2002
2003
2004
2005
2006
2007
2008
2009
2010
2011
Cat
ch ra
te (k
g/10
0m n
et/d
ay)
Cat
ch (t
)
b) Central (21° to 24.5°S)
0
2
4
6
8
10
12
14
16
18
20
0
10
20
30
40
50
60
70
80
90
1990
1991
1992
1993
1994
1995
1996
1997
1998
1999
2000
2001
2002
2003
2004
2005
2006
2007
2008
2009
2010
2011
Cat
ch ra
te (k
g/10
0m n
et/d
ay)
Cat
ch (t
)a) North of 21°S
Line (t) Net (t) Catch rate (kg/100m net/day)
Line (t) Net (t) Catch rate (kg/100m net/day)
Stock status of Queensland’s fisheries resources 2012 110
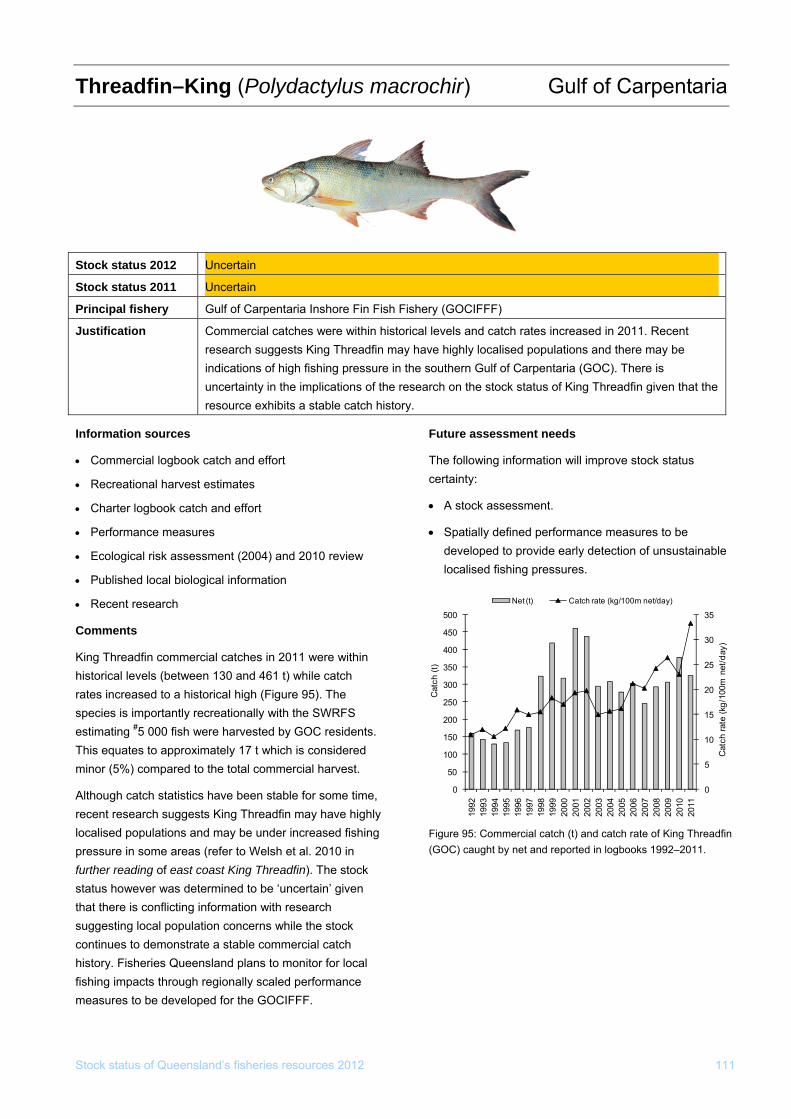
Stock status of Queensland’s fisheries resources 2012 111
ochir) Gulf of CThreadfin–King (Polydactylus macr arpentaria
Stock status 2012 Uncertain
Stock status 2011 Uncertain
Principal fishery Gulf of Carpentaria Inshore Fin Fish Fishery (GOCIFFF)
Justification Commercial catches were within historical levels and catch rates increased in 2011. Recent research suggests King Threadfin may have highly localised populations and there may be indications of high fishing pressure in the southern Gulf of Carpentaria (GOC). There is uncertainty in the implications of the resea g Threadfin given that the rch on the stock status of Kinresource exhibits a stable catch history.
Information sources
• Commercial logbook catch and effort
• Recreational harvest estimates
• Charter logbook catch and effort
• Performance measures
• Ecological risk assessment (2004) and 2010 review
• Published local biological information
• Recent research
Comments
King Threadfin commercial catches in 2011 were within historical levels (between 130 and 461 t) while catch rates increased to a historical high (Figure 95). The species is importantly recreationally with the SWRFS estimating #5 000 fish were harvested by GOC residentsThis equates to approximately 17 t which is considered minor (5%) compared to the total commercial harvest.
Although catch statistics have been stable for some timerecent research suggests King Threadfin may have highllocalised populations and may be under increased fishinpressure in some areas (refer to Welsh et al. 2010 in further reading of east coast King Threadfin). The stock status however was determined to be ‘uncertain’ given that there is conflicting information with research suggesting local population concerns while the stock continues to demonstrate a stable commercial catch history. Fisheries Queensland plans to monitor for local fishing impacts through regionally scaled performance measures to be developed for the GOCIFFF.
.
g
Figure 95: Commercial catch (t) and catch rate of King Threadfin ks 1992–2011.
, y
Future assessment needs
The following information will improve stock status certainty:
• A stock assessment.
• Spatially defined performance measures to be developed to provide early detection of unsustainable localised fishing pressures.
(GOC) caught by net and reported in logboo
Net (t) Catch rate (kg/100m net/day)
0
5
10
15
20
25
30
35
0
50
100
150
200
250
300
350
400
450
500
1992
1993
1994
1995
1996
1997
1998
1999
2000
2001
2002
2003
2004
2005
2006
2007
2008
2009
2010
2011
Cat
ch ra
te (k
g/10
0m n
et/d
ay)
Cat
ch (t
)
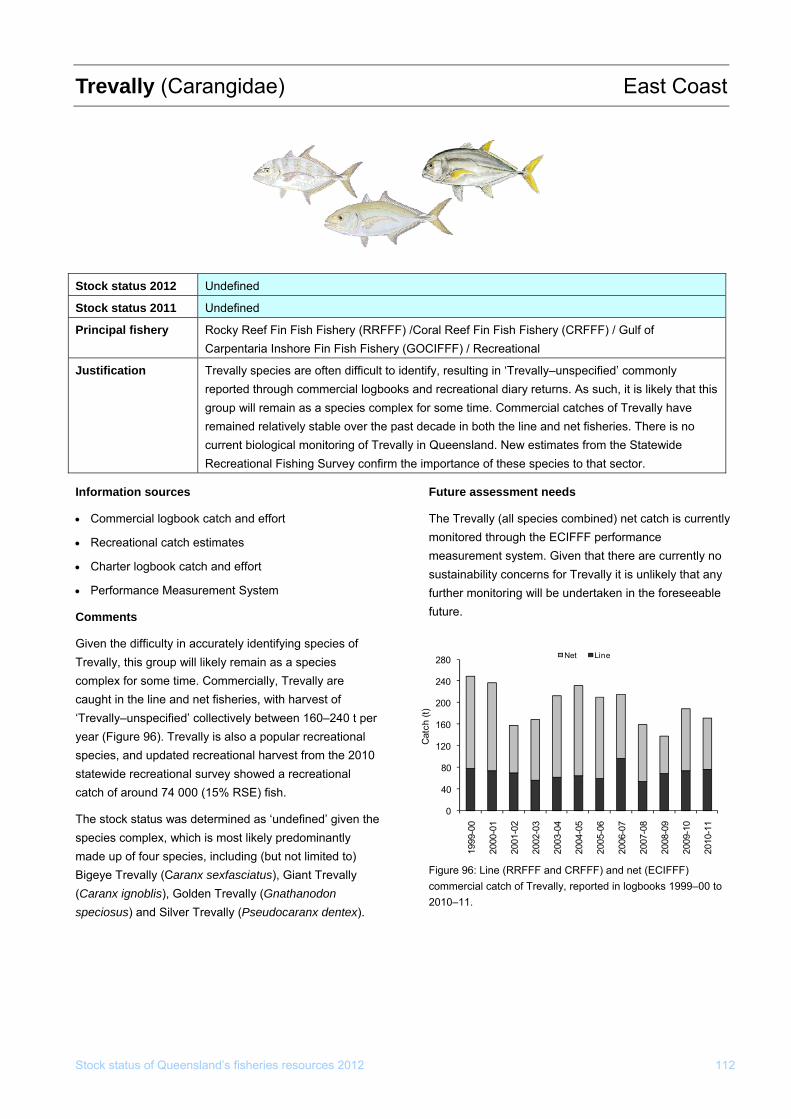
Trevally (Carangidae)
Stock status of Queensland’s fisheries resources 2012 112
East Coast
Stock status 2012 Undefined
Stock status 2011 Undefined
Principal fishery Rocky Reef Fin Fish Fishery (RRFFF) /Coral Reef Fin Fish Fishery (CRFFF) / Gulf of Carpentaria Inshore Fin Fish Fishery (GOCIFFF) / Recreational
Justification returns. As such, it is likely that this
group will remain as a species complex fo ercial catches of Trevally have remained relatively stable over the past deca ne and net fisheries. There is no
l monitoring of Trevally inRecreational Fishing Survey confirm the im
Trevally species are often difficult to identify, resulting in ‘Trevally–unspecified’ commonly reported through commercial logbooks and recreational diary
r some time. Commde in both the li
Queensland. New estimates from the Statewide portance of these species to that sector.
current biologica
Information sources
• Commercial logbook catch and effort
al catch estimates
year (Figure 96). Trevally is also a popular recreational 010
en the
d Silver Trevally (Pseudocaranx dentex).
(RRFFF and CRFFF) and net (ECIFFF) commercial catch of Trevally, reported in logbooks 1999–00 to 2010–11.
• Recreation
• Charter logbook catch and effort
• Performance Measurement System
Comments
Given the difficulty in accurately identifying species of Trevally, this group will likely remain as a species complex for some time. Commercially, Trevally are caught in the line and net fisheries, with harvest of ‘Trevally–unspecified’ collectively between 160–240 t per
species, and updated recreational harvest from the 2statewide recreational survey showed a recreational catch of around 74 000 (15% RSE) fish.
The stock status was determined as ‘undefined’ givspecies complex, which is most likely predominantly made up of four species, including (but not limited to) Bigeye Trevally (Caranx sexfasciatus), Giant Trevally (Caranx ignoblis), Golden Trevally (Gnathanodon speciosus) an
Future assessment needs
The Trevally (all species combined) net catch is currently monitored through the ECIFFF performance measurement system. Given that there are currently no sustainability concerns for Trevally it is unlikely that any further monitoring will be undertaken in the foreseeable future.
Figure 96: Line
0
999-
00
000-
01
001-
02
02-0
3
40
80
120
160
200
240
280
1 2 2 20 2003
-04
2004
-05
2005
-06
2006
-07
2007
-08
2008
-09
2009
-10
2010
-11
Cat
ch (t
)
Net Line
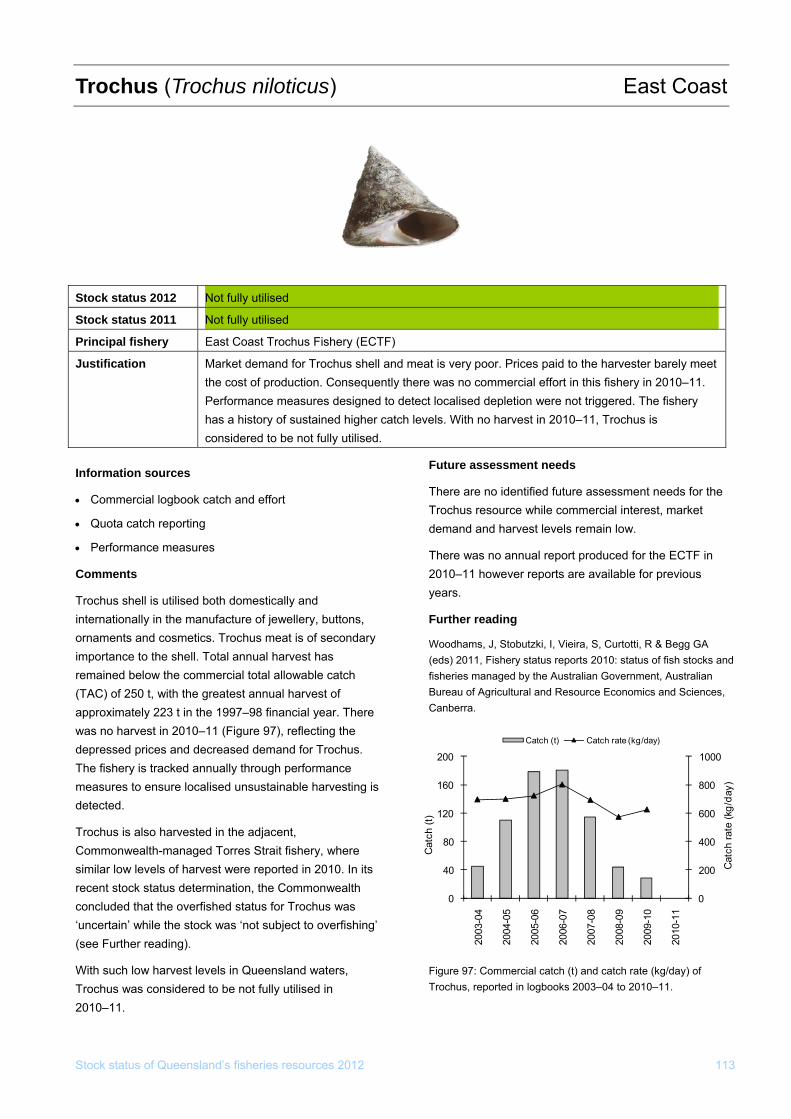
Trochus (Trochus niloticus) East Coast
Stock status 2012 Not fully utilised
Stock status 2011 Not fully utilised
Principal fishery East Coast Trochus Fishery (ECTF)
Justification Market demand for Trochus shell and meat is very poor. Prices paid to the harvester barely meet the cost of production. Consequently there was no commercial effort in this fishery in 2010–11.
asures designed to detecPerformance me t localised depletion were not triggered. The fishery tory of sustained higher catch levhas a his els. With no harvest in 2010–11, Trochus is
considered to be not fully utilised.
Information sources
• Commercial logbook catch and effort
y
ting is
0. In its tion, the Commonwealth
g’
he
Figure 97: Commercial catch (t) and catch rate (kg/day) of Trochus, reported in logbooks 2003–04 to 2010–11.
• Quota catch reporting
• Performance measures
Comments
Trochus shell is utilised both domestically and internationally in the manufacture of jewellery, buttons, ornaments and cosmetics. Trochus meat is of secondarimportance to the shell. Total annual harvest has remained below the commercial total allowable catch (TAC) of 250 t, with the greatest annual harvest of approximately 223 t in the 1997–98 financial year. There was no harvest in 2010–11 (Figure 97), reflecting the depressed prices and decreased demand for Trochus. The fishery is tracked annually through performance measures to ensure localised unsustainable harvesdetected.
Trochus is also harvested in the adjacent, Commonwealth-managed Torres Strait fishery, where similar low levels of harvest were reported in 201
Stock status of Queensland’s fisheries resources 2012 113
recent stock status determinaconcluded that the overfished status for Trochus was ‘uncertain’ while the stock was ‘not subject to overfishin(see Further reading).
With such low harvest levels in Queensland waters, Trochus was considered to be not fully utilised in 2010–11.
Future assessment needs
There are no identified future assessment needs for tTrochus resource while commercial interest, market demand and harvest levels remain low.
There was no annual report produced for the ECTF in 2010–11 however reports are available for previous years.
Further reading
Woodhams, J, Stobutzki, I, Vieira, S, Curtotti, R & Begg GA (eds) 2011, Fishery status reports 2010: status of fish stocks and fisheries managed by the Australian Government, Australian Bureau of Agricultural and Resource Economics and Sciences, Canberra.
0
200
600
800
1000
0
120
160
200
2003
-04
2004
-05
2005
-06
2006
-07
2007
-08
2008
-09
2009
-10
2010
-11
Cte
(kg/
day)
Cat
ch (t
)
Catch (t) Catch rate (kg/day)
400
40
80
atch
ra
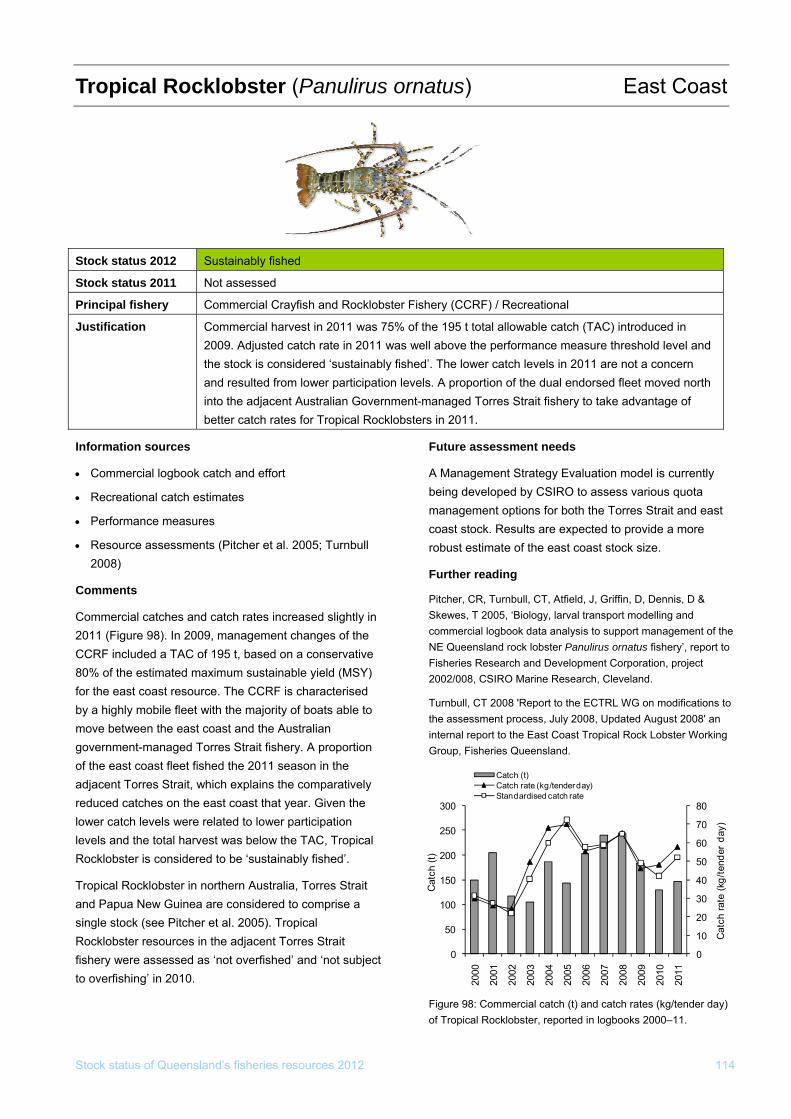
Tropical Rocklobster (Panulirus ornatus) East Coast
Stock status of Queensland’s fisheries resources 2012 114
formation sources
catch and effort
ed a TAC of 195 t, based on a conservative Y)
ait fishery. A proportion
y
l
fishery were assessed as ‘not overfished’ and ‘not subject
Future assessment needs
A Management Strategy Evaluation model is currently being developed by CSIRO to assess various quota management options for both the Torres Strait and east coast stock. Results are expected to provide a more robust estimate of the east coast stock size.
Further reading
Pitcher, CR, Turnbull, CT, Atfield, J, Griffin, D, Dennis, D & Skewes, T 2005, ‘Biology, larval transport modelling and commercial logbook data analysis to support management of the NE Queensland rock lobster Panulirus ornatus fishery’, report to Fisheries Research and Development Corporation, project 2002/008, CSIRO Marine Research, Cleveland.
Turnbull, CT 2008 'Report to the ECTRL WG on modifications to the assessment process, July 2008, Updated August 2008' an internal report to the East Coast Tropical Rock Lobster Working Group, Fisheries Queensland.
In
• Commercial logbook
• Recreational catch estimates
• Performance measures
• Resource assessments (Pitcher et al. 2005; Turnbull 2008)
Comments
Commercial catches and catch rates increased slightly in 2011 (Figure 98). In 2009, management changes of the CCRF includ80% of the estimated maximum sustainable yield (MSfor the east coast resource. The CCRF is characterised by a highly mobile fleet with the majority of boats able to move between the east coast and the Australian government-managed Torres Strof the east coast fleet fished the 2011 season in the adjacent Torres Strait, which explains the comparativelreduced catches on the east coast that year. Given the lower catch levels were related to lower participation levels and the total harvest was below the TAC, TropicaRocklobster is considered to be ‘sustainably fished’.
Tropical Rocklobster in northern Australia, Torres Strait and Papua New Guinea are considered to comprise a single stock (see Pitcher et al. 2005). Tropical Rocklobster resources in the adjacent Torres Strait
to overfishing’ in 2010.
Figure 98: Commercial catch (t) and catch rates (kg/tender day) of Tropical Rocklobster, reported in logbooks 2000–11.
Stock status 2012 Sustainably fished
Stock status 2011 Not assessed
Principal fishery Commercial Crayfish and Rocklobster Fishery (CCRF) / Recreational
Justification nd
Commercial harvest in 2011 was 75% of the 195 t total allowable catch (TAC) introduced in 2009. Adjusted catch rate in 2011 was well above the performance measure threshold level athe stock is considered ‘sustainably fished’. The lower catch levels in 2011 are not a concern and resulted from lower participation levels. A proportion of the dual endorsed fleet moved north into the adjacent Australian Government-managed Torres Strait fishery to take advantage of better catch rates for Tropical Rocklobsters in 2011.
0
10
20
30
40
50
60
70
80
0
50
100
150
200
250
300
00 01 02 03 04 05 06 07 08 09
2010
2011
Cat
ch ra
te (k
g/te
nder
day
)
Cat
ch (t
)
Catch (t)Catch rate (kg/tender day)Standardised catch rate
20 20 20 20 20 20 20 20 20 20
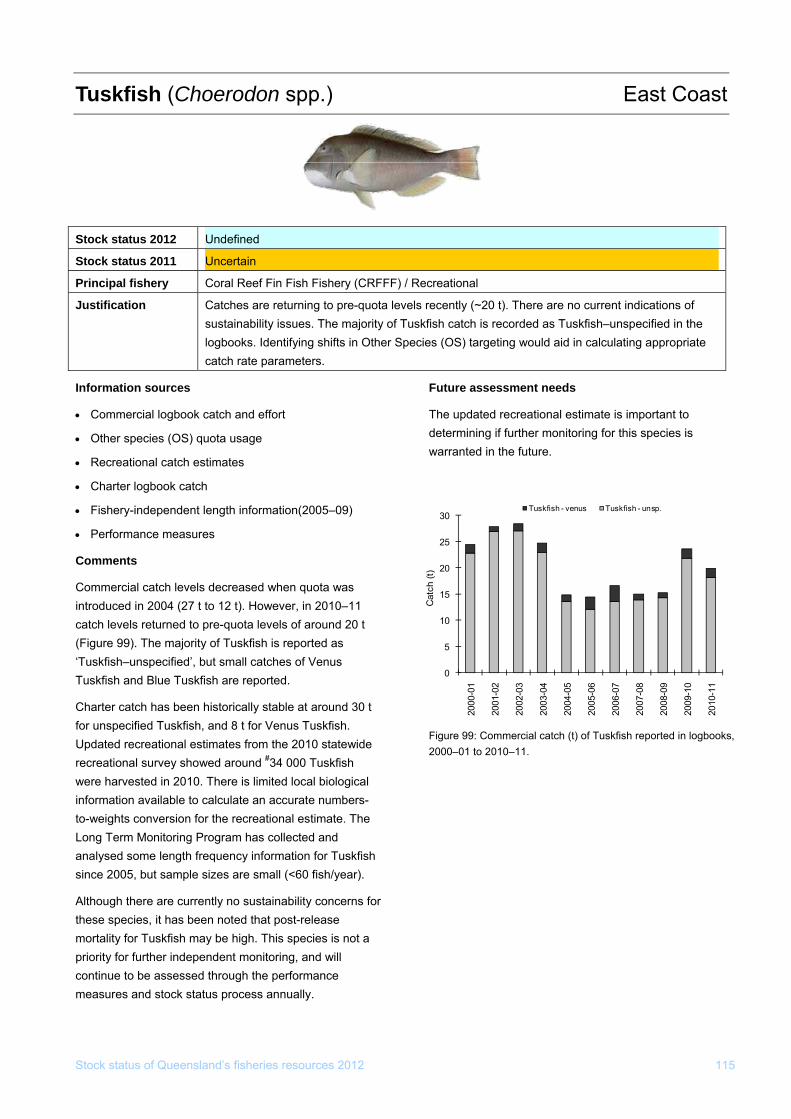
Tuskfish (Choerodon spp.) East Coast
Stock status 2012 Undefined
Stock status 2011 Uncertain
Principal fishery Coral Reef Fin Fish Fishery (CRFFF) / Recreational
Justification Catches are returning to pre-quota levels recently (~20 t). There are no current indications of sustainability issues. The majority of Tuskfish catch is recorded as Tuskfish–unspecified in the logbooks. Identifying shifts in Other Species (OS) targeting would aid in calculating appropriate catch rate parameters.
Stock status of Queensland’s fisheries resources 2012 115
Information sources
• Commercial logbook catch and effort
• Other species (OS) quota usage
• Recreational catch estimates
• Charter logbook catch
• Fishery-independent length information(2005–09)
• Performance measures
Comments
Commercial catch levels decreased when quota was introduced in 2004 (27 t to 12 t). However, in 2010–11 catch levels returned to pre-quota levels of around 20 t (Figure 99). The majority of Tuskfish is reported as ‘Tuskfish–unspecified’, but small catches of Venus Tuskfish and Blue Tuskfish are reported.
Charter catch has been historically stable at around 30 t for unspecified Tuskfish, and 8 t for Venus Tuskfish. Updated recreational estimates from the 2010 statewide recreational survey showed around #34 000 Tuskfish were harvested in 2010. There is limited local biological information available to calculate an accurate numbers-to-weights conversion for the recreational estimate. The Long Term Monitoring Program has collected and analysed some length frequency information for Tuskfish since 2005, but sample sizes are small (<60 fish/year).
Although there are currently no sustainability concerns for these species, it has been noted that post-release mortality for Tuskfish may be high. This species is not a priority for further independent monitoring, and will continue to be assessed through the performance measures and stock status process annually.
Future assessment needs
The updated recreational estimate is important to determining if further monitoring for this species is warranted in the future.
Figure 99: Commercial catch (t) of Tuskfish reported in logbooks, 2000–01 to 2010–11.
0
5
10
15
20
25
30
2000
-01
2001
-02
2002
-03
2003
-04
2004
-05
2005
-06
2006
-07
2007
-08
2008
-09
2009
-10
2010
-11
Cat
ch (t
)
Tuskfish - venus Tuskfish - unsp.
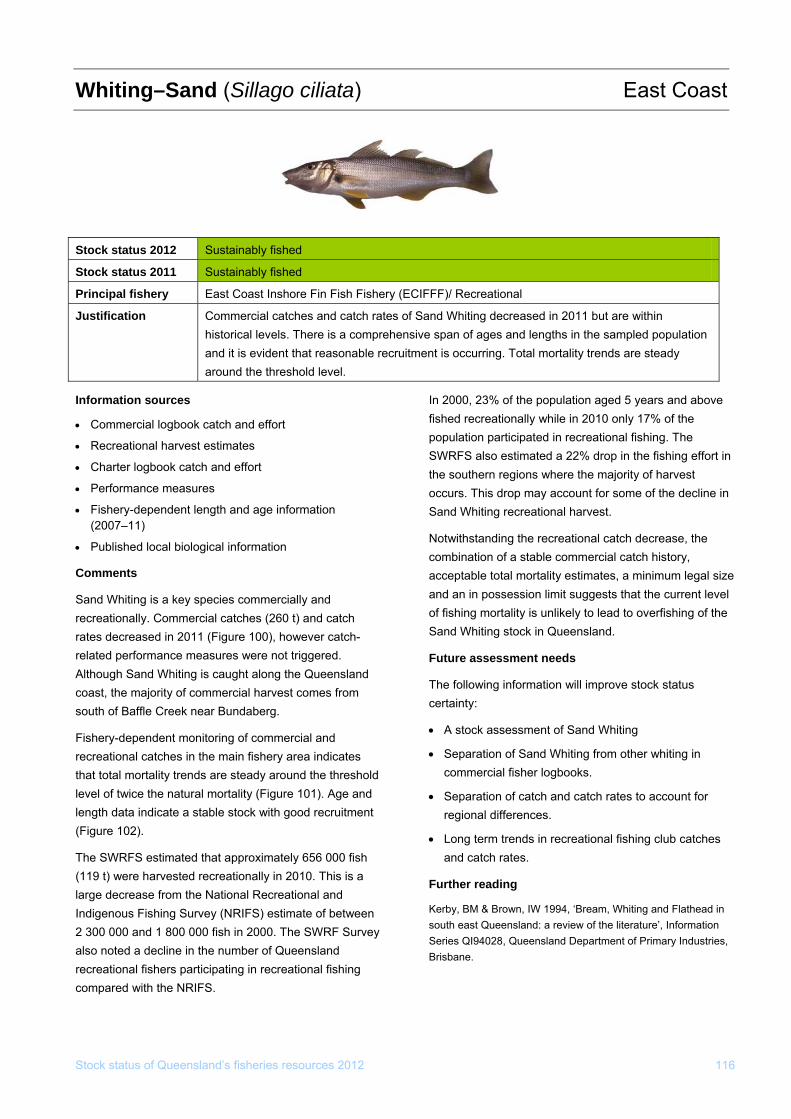
Stock status of Queensland’s fisheries resources 2012 116
Whiting–Sand (Sillago ciliata) East Coast
tock status 2012
S Sustainably fished
Stock status 2011 Sustainably fished
Principal fishery East Coast Inshore Fin Fish Fishery (ECIFFF)/ Recreational
Justification Commercial catches and catch rates of Sand Whiting decreased in 2011 but are within n historical levels. There is a comprehensive span of ages and lengths in the sampled populatio
and it is evident that reasonable recruitment is occurring. Total mortality trends are steady around the threshold level.
Information sources
• Commercial logbook catch and effort
• Recreational harvest estimates
• Charter logbook catch and effort
• Performance measures
• Fishery-dependent length and age information (2007–11)
• Published local biological information
Comments
Sand Whiting is a key species commercially and recreationally. Commercial catches (260 t) and catch rates decreased in 2011 (Figure 100), however catch-related performance measures were not triggered. Although Sand Whiting is caught along the Queensland coast, the majority of commercial harvest comes from south of Baffle Creek near Bundaberg.
Fishery-dependent monitoring of commercial and recreational catches in the main fishery area indicates that total mortality trends are steady around the threshold level of twice the natural mortality (Figure 101). Age and length data indicate a stable stock with good recruitment (Figure 102).
The SWRFS estimated that approximately 656 000 fish (119 t) were harvested recreationally in 2010. This is a large decrease from the National Recreational and Indigenous Fishing Survey (NRIFS) estimate of between 2 300 000 and 1 800 000 fish in 2000. The SWRF Survey also noted a decline in the number of Queensland recreational fishers participating in recreational fishing compared with the NRIFS.
In 2000, 23% of the population aged 5 years and above fished recreationally while in 2010 only 17% of the population participated in recreational fishing. The SWRFS also estimated a 22% drop in the fishing effort in the southern regions where the majority of harvest occurs. This drop may account for some of the decline in Sand Whiting recreational harvest.
Notwithstanding the recreational catch decrease, the combination of a stable commercial catch history, acceptable total mortality estimates, a minimum legal size and an in possession limit suggests that the current level of fishing mortality is unlikely to lead to overfishing of the Sand Whiting stock in Queensland.
Future assessment needs
The following information will improve stock status certainty:
• A stock assessment of Sand Whiting
• Separation of Sand Whiting from other whiting in commercial fisher logbooks.
• Separation of catch and catch rates to account for regional differences.
• Long term trends in recreational fishing club catches and catch rates.
Further reading
Kerby, BM & Brown, IW 1994, ‘Bream, Whiting and Flathead in south east Queensland: a review of the literature’, Information Series QI94028, Queensland Department of Primary Industries, Brisbane.
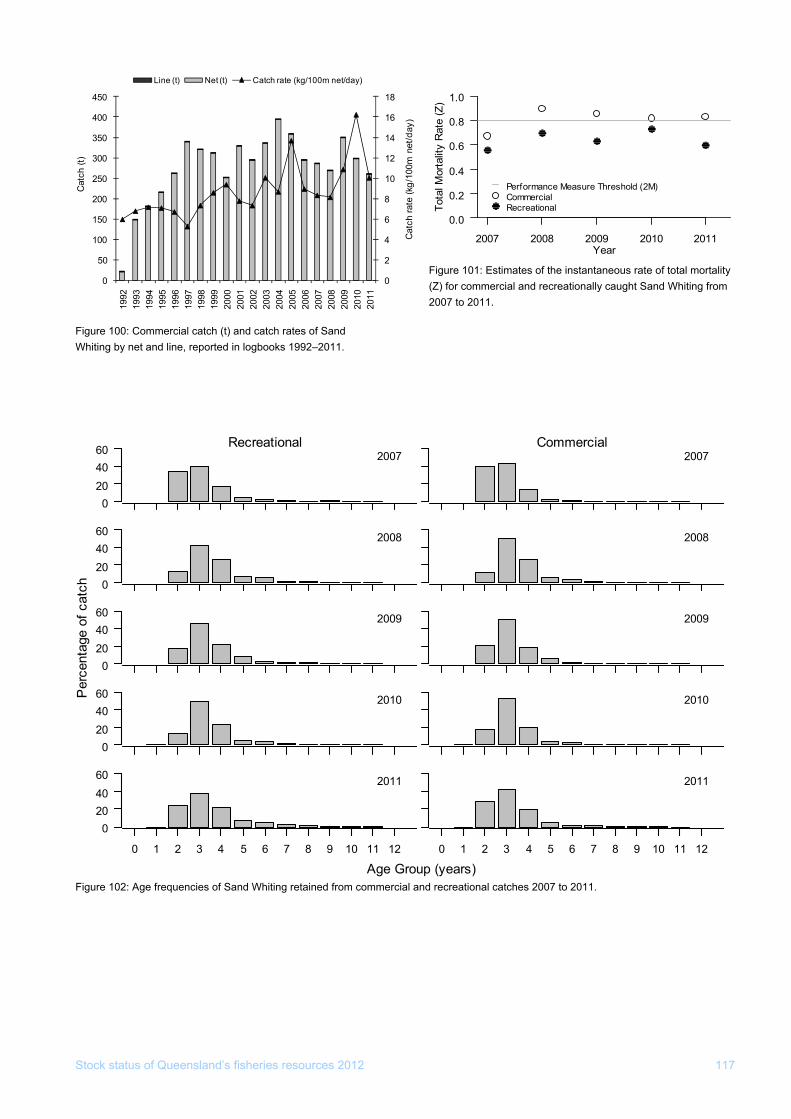
Stock status of Queensland’s fisheries resources 2012 117
Figure 101: Estimates of the instantaneous rate of total mortality (Z) for commercial and recreationally caught Sand Whiting from 2007 to 2011.
rcial anFigure 102: Age frequencies of Sand Whiting retained from comme
d recreational catches 2007 to 2011. (years)
020
2007Recreational
2007Commercial
4060
0204060 2008 2008
020
60
0204060
402009 2009
2010 2010
0 1 2 3 4 5 6 7 8 9 10 11 12
0204060 2011
0 1 2 3 4 5 6 7 8 9 10 11 12
2011
Age Group
age
ofc
Per
cent
at
ch
Figure 100: Commercial catch (t) and catch rates of Sand orted in logbooks 1992–2011.
Whiting by net and line, rep
0
2
4
6
8
10
12
14
16
18
50
100
150
200
250
300
350
400
1997
1998
2004
2005
2006
2007
2008
2009
2010
2011
Cat
ch ra
te (k
g/10
0m n
et/d
ay)
Cat
ch (t
)
0
2 3 4 5 6
199
199
199
199
199
199
200
200
200
20
9 0 1 2 03
450
Line (t) Net (t) Catch rate (kg/100m net/day)
0.0
0.2
0.4
0.6
0.8
1.0
2007 2008 2009 2010 2011
Performance Measure Threshold (2M)CommercialRecreational
Year
Tota
l Mor
talit
y R
ate
(Z)
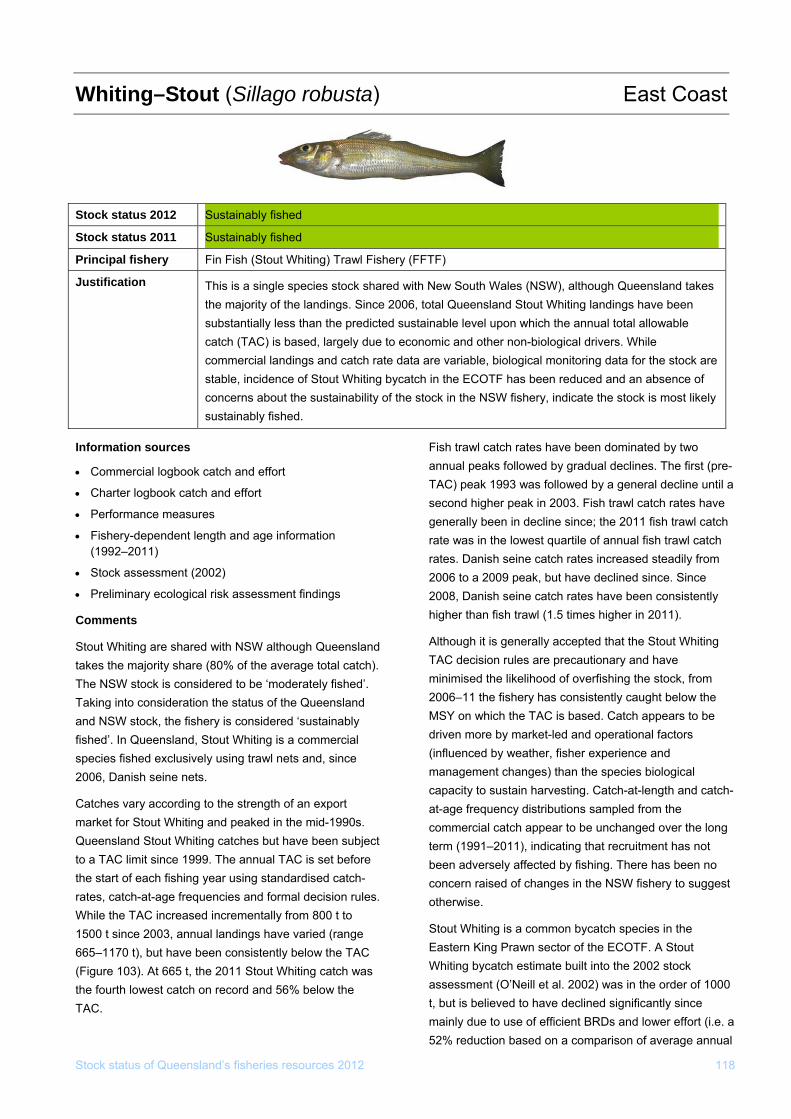
Stock status of Queensland’s fisheries resources 2012 118
Whiting–Stout (Sillago robusta) East Coast
Stock status 2012 Sustainably fished
Stock status 2011 Sustainably fished
Principal fishery Fin Fish (Stout Whiting) Trawl Fishery (FFTF)
Justification This is a single species stock shared with New South Wales (NSW), although Queensland takes the majority of the landings. Since 2006, total Queensland Stout Whiting landings have been substantially less than the predicted sustainable level upon which the annual total allowable
conomic and other non-biological drivers. While catch (TAC) is based, largely due to ecommercial landings and catch rate data are variable, biological monitoring data for the stock are stable, incidence of Stout Whiting bycatch in the ECOTF has been reduced and an absence of
lyconcerns about the sustainability of the stock in the NSW fishery, indicate the stock is most like sustainably fished.
formation sources
catch and effort
• Fishery-dependent length and age information
essment (2002)
ch). ’.
d
ry according to the strength of an export market for Stout Whiting and peaked in the mid-1990s.
ect
s.
een consistently below the TAC as
e
Fish trawl catch rates have been dominated by two dual declines. The first (pre-
atch rawl catch
anish seine catch rates have been consistently wl (1.5 times higher in 2011).
MSY on which the TAC is based. Catch appears to be driven more by market-led and operational factors (influenced by weather, fisher experience and management changes) than the species biological capacity to sustain harvesting. Catch-at-length and catch-at-age frequency distributions sampled from the commercial catch appear to be unchanged over the long term (1991–2011), indicating that recruitment has not been adversely affected by fishing. There has been no concern raised of changes in the NSW fishery to suggest otherwise.
Stout Whiting is a common bycatch species in the Eastern King Prawn sector of the ECOTF. A Stout
catch estimate built into the 2002 stock assessment (O’Neill et al. 2002) was in the order of 1000
2% reduction based on a comparison of average annual
In
• Commercial logbook
• Charter logbook catch and effort
• Performance measures
(1992–2011)
• Stock ass
• Preliminary ecological risk assessment findings
Comments
Stout Whiting are shared with NSW although Queensland takes the majority share (80% of the average total catThe NSW stock is considered to be ‘moderately fishedTaking into consideration the status of the Queenslanand NSW stock, the fishery is considered ‘sustainably fished’. In Queensland, Stout Whiting is a commercial species fished exclusively using trawl nets and, since 2006, Danish seine nets.
Catches va
Queensland Stout Whiting catches but have been subjto a TAC limit since 1999. The annual TAC is set beforethe start of each fishing year using standardised catch-rates, catch-at-age frequencies and formal decision ruleWhile the TAC increased incrementally from 800 t to 1500 t since 2003, annual landings have varied (range 665–1170 t), but have b(Figure 103). At 665 t, the 2011 Stout Whiting catch wthe fourth lowest catch on record and 56% below thTAC.
annual peaks followed by graTAC) peak 1993 was followed by a general decline until a second higher peak in 2003. Fish trawl catch rates have generally been in decline since; the 2011 fish trawl crate was in the lowest quartile of annual fish trates. Danish seine catch rates increased steadily from2006 to a 2009 peak, but have declined since. Since2008, Dhigher than fish tra
Although it is generally accepted that the Stout WhitingTAC decision rules are precautionary and have minimised the likelihood of overfishing the stock, from 2006–11 the fishery has consistently caught below the
Whiting by
t, but is believed to have declined significantly since mainly due to use of efficient BRDs and lower effort (i.e. a 5
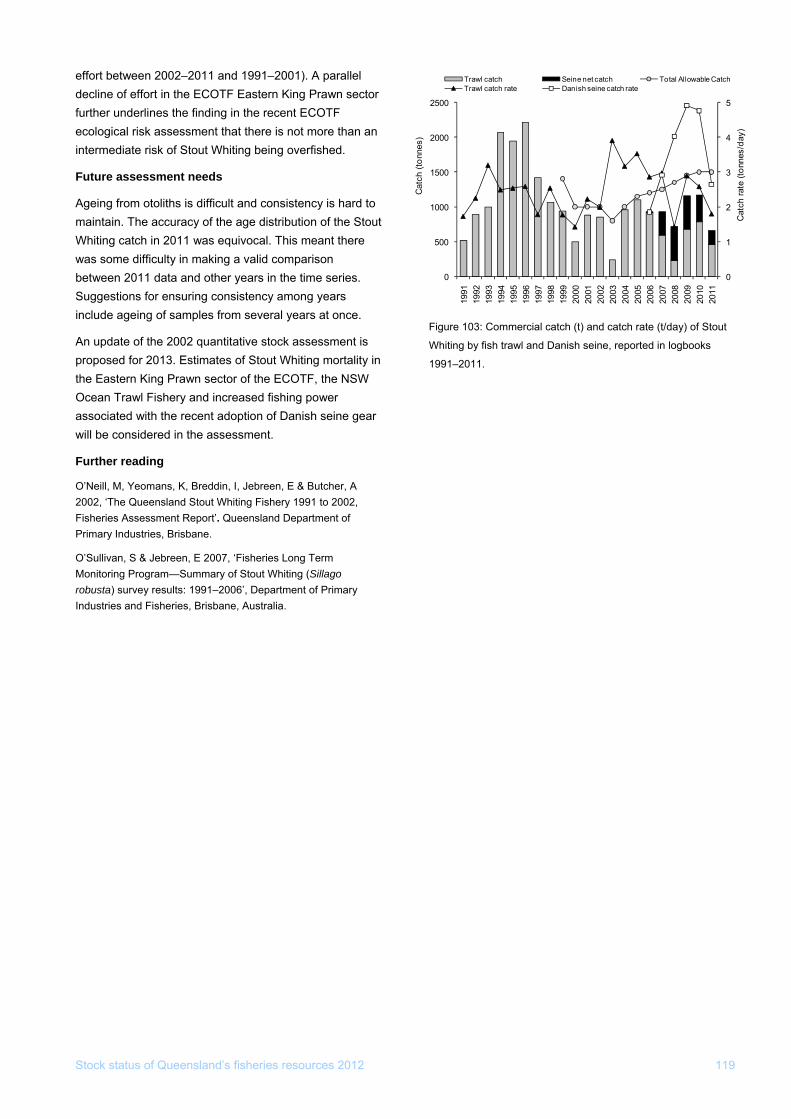
Stock status of Queensland’s fisheries resources 2012 119
t) and catch rate (t/day) of Stout
effort between 2002–2011 and 1991–2001). A parallel decline of effort in the ECOTF Eastern King Prawn sector further underlines the finding in the recent ECOTF ecological risk assessment that there is not more than an intermediate risk of Stout Whiting being overfished.
Future assessment needs
Ageing from otoliths is difficult and consistency is hard to maintain. The accuracy of the age distribution of the Stout Whiting catch in 2011 was equivocal. This meant there was some difficulty in making a valid comparison between 2011 data and other years in the time series. Suggestions for ensuring consistency among years include ageing of samples from several years at once.
An update of the 2002 quantitative stock assessment is proposed for 2013. Estimates of Stout Whiting mortality in the Eastern King Prawn sector of the ECOTF, the NSW Ocean Trawl Fishery and increased fishing power associated with the recent adoption of Danish seine gear will be considered in the assessment.
Further reading
O’Neill, M, Yeomans, K, Breddin, I, Jebreen, E & Butcher, A 2002, ‘The Queensland Stout Whiting Fishery 1991 to 2002, Fisheries Assessment Report’. Queensland Department of Primary Industries, Brisbane.
O’Sullivan, S & Jebreen, E 2007, ‘Fisheries Long Term Monitoring Program—Summary of Stout Whiting (Sillago robusta) survey results: 1991–2006’, Department of Primary Industries and Fisheries, Brisbane, Australia.
Figure 103: Commercial catch (
Whiting by fish trawl and Danish seine, reported in logbooks
1991–2011.
Trawl catch Seine net catch Total Allowable CatchTrawl catch rate Danish seine catch rate
52500
0
1
2
3
4
0
500
1000
1500
2000
1991
1992
1993
1994
1995
1996
1997
1998
1999
2000
2001
2002
2003
2004
2005
2006
2007
2008
2009
2010
2011
Cat
ch ra
te (t
onne
s/da
y)
Cat
ch (t
onne
s)

Department of Agriculture, Fisheries and Forestry13 25 23
www.fisheries.qld.gov.au


