9
Daily Newsle 08/04/2011 etter-Equity www.capita alheight.com
| Date post: | 29-Mar-2016 |
| Category: |
Documents |
| Upload: | money-capitalheight-research-pvt-ltd |
| View: | 216 times |
| Download: | 1 times |

Daily Newsletter08/04/2011
Daily Newsletter-Equity
www.capitalheight.com
ww.capitalheight.com

www.capitalheight.com
capitalheight.wordpress.com
Phone- (0731)4295950
MARKET WRAP
Indian equity markets ended flat, Nifty down 7 pts and Sensex down 21 pts.
EUR German industrial production m/m came up at 1.6 vs. 0.6% against 2%.
European markets were in red with DAX worst, Dow future was up 10 pts.
Indian equity market ended flat for third straight session as Nifty lost 6 pts to end at
5886 while Sensex was down by 21 pts to settle at 19591. Euro markets were negative
despite positive economic data; FTSE down 15 pts at 6026, CAC down 3 pts at 4046
and DAX down 19 pts at 7196. Dow future was up 10 pts ahead of jobless claims data.
MARKET PERFORMANCE
NIFTY GAINERS
COMPANY NAME CURRENT PREV. CLOSE(RS) CANG.(RS) CHAG.(%)
HDFC 715.70 698.90 16.80 2.40
BPCL 613.80 603.00 10.80 1.79
Hindalco 216.05 212.40 3.65 1.72
Wipro 472.45 465.95 6.50 1.39
Tata Power 1319.85 1303.05 16.80 1.29
NIFTY LOSERS
COMPANY NAME CURRENT PREV. CLOSE(RS) CANG.(RS) CHAG.(%)
Sesa Goa 315.80 325.75 -9.95 -3.05
NTPC 186.15 191.80 -5.65 -2.95
ONGC 291.60 298.10 -6.50 -2.18
Cairn India 343.95 350.55 -6.60 -1.88
TCS 1199.20 1221.85 -22.65 -1.85

www.capitalheight.com
capitalheight.wordpress.com
Phone- (0731)4295950
SECTORIAL INDICES
INDEX P.CLOSE OPEN HIGH LOW LAST %
CHANGE
S&P CNX NIFTY 5891.75 5888.55 5906.10 5866.25 5885.70 -0.10
CNX NIFTY Jr. 11638.05 11644.45 11738.20 11642.95 11714.50 0.66
CNX IT 7270.85 7249.75 7249.75 7190.30 7215.40 -0.76
BANK NIFTY 11730.05 11724.75 11825.00 11656.70 11754.40 0.21
INDIA VIX 20.36 20.36 20.79 19.97 20.32 -0.19
CNX 100 5787.55 5784.90 5806.85 5768.35 5788.45 0.02
S&P CNX DEFTY 4616.55 4618.35 4638.90 4593.20 4616.05 -0.01
S&P CNX 500 4718.60 4716.80 4741.35 4709.30 4727.35 0.19
CNX MIDCAP 8342.00 8341.25 8443.85 8341.25 8419.05 0.92
NIFTY MIDCAP 50 2624.85 2630.45 2654.30 2625.35 2642.85 0.69
CNX INFRA 3138.00 3140.45 3157.00 3131.45 3153.95 0.51
CNX REALTY 335.65 336.10 344.05 335.40 340.55 1.46
INDEX MOVERS (PULLING IT UP)
COMPANY NAME CONTRIBUTION
HDFC 3.90
Wipro 2.53
Airtel 2.22
SBI 1.56
OTHERS 9.20
INDEX MOVERS (PULLING IT DOWN)
COMPANY NAME CONTRIBUTION
ONGC -8.80
NTPC -7.38
TCS -7.02
Infosys -2.66
OTHERS -15.40

www.capitalheight.com
capitalheight.wordpress.com
Phone- (0731)4295950
5 DAYS UP (NIFTY)
COMPANY NAME DAY'S CLOSING
PRICE (RS.) PREV CLOSE (RS.) 5 DAYS AGO (RS.)
5 DAYS
RETURN(%)
Hero Honda 1,694.65 1,681.75 1,602.65 5.74
BHEL 2,196.90 2,196.75 2,113.85 3.93
Tata Motors 1,291.60 1,295.05 1,242.90 3.92
SBI 2,808.35 2,796.80 2,719.50 3.27
M&M 732.40 725.95 710.10 3.14
5 DAYS DOWN (NIFTY)
COMPANY NAME DAY'S CLOSING
PRICE (RS.) PREV CLOSE (RS.) 5 DAYS AGO (RS.)
5 DAYS
RETURN(%)
Cairn India 343.95 350.55 354.35 -2.93
HUL 276.00 277.20 283.95 -2.80
NTPC 186.15 191.80 188.85 -1.43
Bajaj Auto 1,440.25 1,451.60 1,458.95 -1.28
Kotak Bank . 445.55 450.50 451.00 -1.21
VOLUME SHOCKERS
Company Name Last Price % Chg Last Volume Prev Volume % Chg
Unichem Labs 203.20 4.53 692,537.00 8,535.00 8,014.00
Swaraj Engines 474.55 2.93 59,488.00 1,009.00 5,796.00
Zandu Realty 2,481.15 20.00 108,604.00 1,903.00 5,607.00
HT Media 158.55 7.38 458,796.00 12,879.00 3,462.00
Infinite Comp 186.65 10.25 596,723.00 17,501.00 3,310.00

www.capitalheight.com
capitalheight.wordpress.com
Phone- (0731)4295950
FII TRADING ACTIVITY (NSE & BSE) In Crores
CATEGORY DATE BUY VALUE SELL VALUE NET VALUE
FII 7-Apr-2011 2675.95 2455.36 220.59
DII TRADING ACTIVITY (NSE & BSE) In Crores
CATEGORY DATE BUY VALUE SELL VALUE NET VALUE
DII 7-Apr-2011 881.68 1093.84 -212.16
F&O TRADE STATISTICS
PRODUCT NO OF CONTRACTS TURNOVER IN RS. CR. PUT CALL RATIO
Index Futures 342505.00 9478.89 -
Stock Futures 505341.00 13815.92 -
Index Options 1631265.00 48130.03 1.13
Stock Options 97122.00 2765.15 0.27
F&O Total 2576233.00 74189.99 1.00
ASIAN MARKETS
Name Open High Low Current Value Change % Chg
Nikkei 225 9,652.65 9,687.18 9,578.47 9,590.93 6.56 0.07
Hang Seng 24,317.82 24,368.76 24,195.61 24,281.80 -3.25 -0.01
Taiwan 8,884.84 8,901.72 8,828.92 8,901.72 49.74 0.56
KOSPI 2,133.31 2,135.73 2,111.54 2,122.14 -4.57 -0.22
Jakarta 3,729.71 3,741.83 3,704.43 3,730.58 2.78 0.07
TECHNICAL
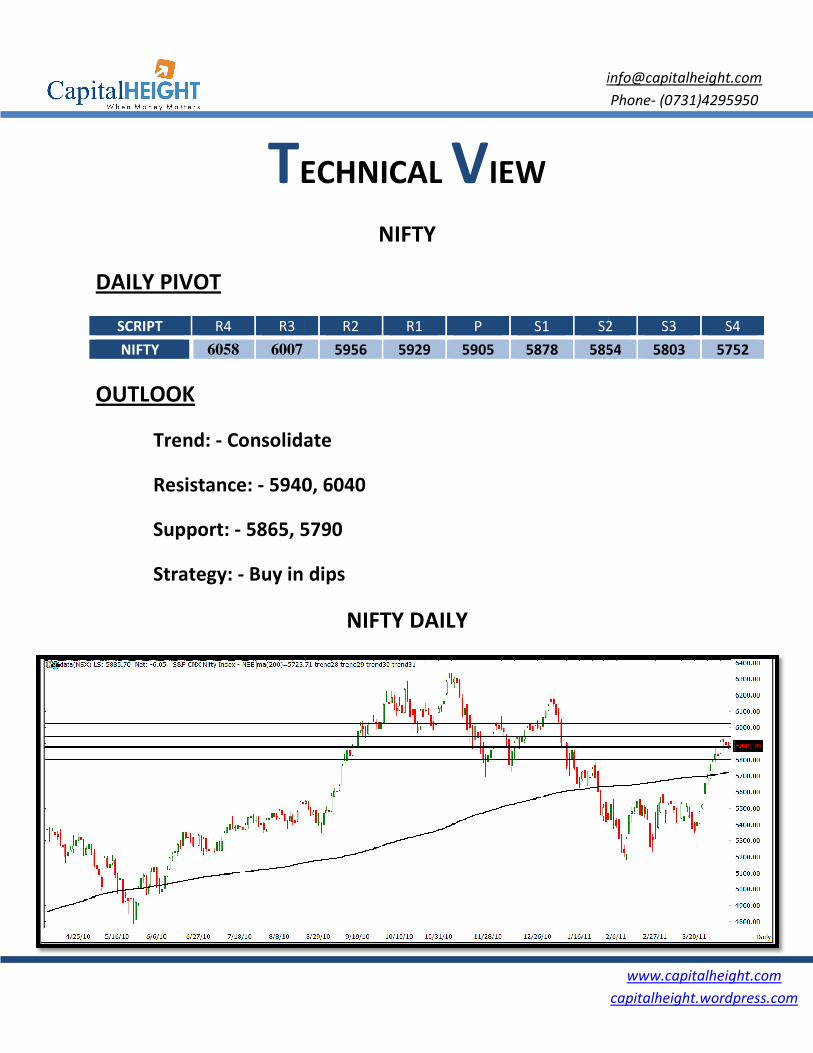
DAILY PIVOT
SCRIPT R4 R3
NIFTY 6058 6007
OUTLOOK
Trend: - Consolidate
Resistance: - 5940, 6040
Support: - 5865, 5790
Strategy: - Buy in dips
ECHNICAL VIEW
NIFTY
R2 R1 P S1 S2
5956 5929 5905 5878 5854
Consolidate
5940, 6040
5865, 5790
Buy in dips
NIFTY DAILY
www.capitalheight.com
capitalheight.wordpress.com
Phone- (0731)4295950
S2 S3 S4
5854 5803 5752

DAILY PIVOT
SCRIPT R4 R3
BANK NIFTY 12335 12154
OUTLOOK
Trend: - Consolidate
Resistance: - 11950, 12200
Support: - 11670, 11440
Strategy: - Buy on dips
BANK NIFTY
R2 R1 P S1 S2
12154 11973 11888 11792 11707 11611
Consolidate
11950, 12200
11670, 11440
Buy on dips
BANK NIFTY DAILY
www.capitalheight.com
capitalheight.wordpress.com
Phone- (0731)4295950
S2 S3 S4
11611 11430 11249

Stock
CapitalHeight’s stock recommendation for
TTK Prestige is in overall uptrend making
today broke its consolidation range and ended up today more than 11% at 2508.75 after
making a fresh all time high of 2609.
of 50 Day and 100 Day EMA; we expect TTK Prestige to continue its bullish trend.
Our recommendation on TTK Prestige is
Disclaimer
The information and views in this report, our website & all the service we provide are believed to be reliable, but we do not
accept any responsibility (or liability) for errors of fact or opinion. Users have the right to choose the
them the most.
Sincere efforts have been made to present the right investment perspective. The information contained herein is based on
analysis and up on sources that we consider reliable.
This material is for personal information an
tock Recommendation
stock recommendation for 08/04/2011 is
TTK Prestige is in overall uptrend making higher tops and higher bottoms
today broke its consolidation range and ended up today more than 11% at 2508.75 after
l time high of 2609. Given the higher volumes; and positive crossover
of 50 Day and 100 Day EMA; we expect TTK Prestige to continue its bullish trend.
TTK Prestige is BUY above 2536 for the TG of 2556
The information and views in this report, our website & all the service we provide are believed to be reliable, but we do not
accept any responsibility (or liability) for errors of fact or opinion. Users have the right to choose the
Sincere efforts have been made to present the right investment perspective. The information contained herein is based on
analysis and up on sources that we consider reliable.
This material is for personal information and based upon it & takes no responsibility
www.capitalheight.com
capitalheight.wordpress.com
Phone- (0731)4295950
ecommendation
is TTK Prestige.
higher tops and higher bottoms and stock
today broke its consolidation range and ended up today more than 11% at 2508.75 after
Given the higher volumes; and positive crossover
of 50 Day and 100 Day EMA; we expect TTK Prestige to continue its bullish trend.
above 2536 for the TG of 2556 – 2585.
The information and views in this report, our website & all the service we provide are believed to be reliable, but we do not
accept any responsibility (or liability) for errors of fact or opinion. Users have the right to choose the product/s that suits
Sincere efforts have been made to present the right investment perspective. The information contained herein is based on

www.capitalheight.com
capitalheight.wordpress.com
Phone- (0731)4295950
The information given herein should be treated as only factor, while making investment decision. The report does not
provide individually tailor-made investment advice. Capitalheight recommends that investors independently evaluate
particular investments and strategies, and encourages investors to seek the advice of a financial adviser. Capitalheight shall
not be responsible for any transaction conducted based on the information given in this report, which is in violation of rules
and regulations of NSE and BSE.
The share price projections shown are not necessarily indicative of future price performance. The information herein,
together with all estimates and forecasts, can change without notice. Analyst or any person related to Capitalheight might be
holding positions in the stocks recommended. It is understood that anyone who is browsing through the site has done so at
his free will and does not read any views expressed as a recommendation for which either the site or its owners or
anyone can be held responsible for . Any surfing and reading of the information is the acceptance of this disclaimer.
All Rights Reserved.
Investment in Commodity and equity market has its own risks.
We, however, do not vouch for the accuracy or the completeness thereof. we are not responsible for any loss incurred
whatsoever for any financial profits or loss which may arise from the recommendations above. Capital height does not
purport to be an invitation or an offer to buy or sell any financial instrument. Our Clients (Paid Or Unpaid), Any third party or
anyone else have no rights to forward or share our calls or SMS or Report or Any Information Provided by us to/with anyone
which is received directly or indirectly by them. If found so then Serious Legal Actions can be taken.


