Stocks, Bonds, U.S. Dollar Index, Precious Metals and Special Opportunities Updated Every Monday, Wednesday and Friday (except U.S. Holidays) The Financial Forecast Short Term Update SM is service marked and copyrighted by Elliott Wave International and is intended for those persons authorized by Elliott Wave International. Photocopying and further distribution of this information are strictly prohibited. Violators will be traced and prosecuted. The price of this service allows for as many as fifteen (15) business days during the year when an update may not be transmitted due to scheduling. The information contained in the service is expressed in good faith, but its accuracy is not guaranteed. 1 Update for Friday, January 21, 2011; 5:05 PM, Eastern. [Bottom Line]: The Dow ended the week higher while the S&P and NASDAQ ended the week down. The S&P's short-term pattern indicates further selling pressure and lower prices next week. The Dow's new high today was unconfirmed by nearly everything. If the wave labels on our charts are correct, the market's senior index should not remain at new recovery highs for long. e011618
Transcript
Stocks, Bonds, U.S. Dollar Index, Precious Metals and Special Opportunities
Updated Every Monday, Wednesday and Friday (except U.S. Holidays) The Financial Forecast Short Term UpdateSM is service marked and copyrighted by Elliott Wave International and is intended for those persons authorized by Elliott Wave International. Photocopying and further distribution of this information are strictly prohibited. Violators will be traced and prosecuted. The price of this service allows for as many as fifteen (15) business days during the year when an update may not be transmitted due to scheduling. The information contained in the service is expressed in good faith, but its accuracy is not guaranteed.
1
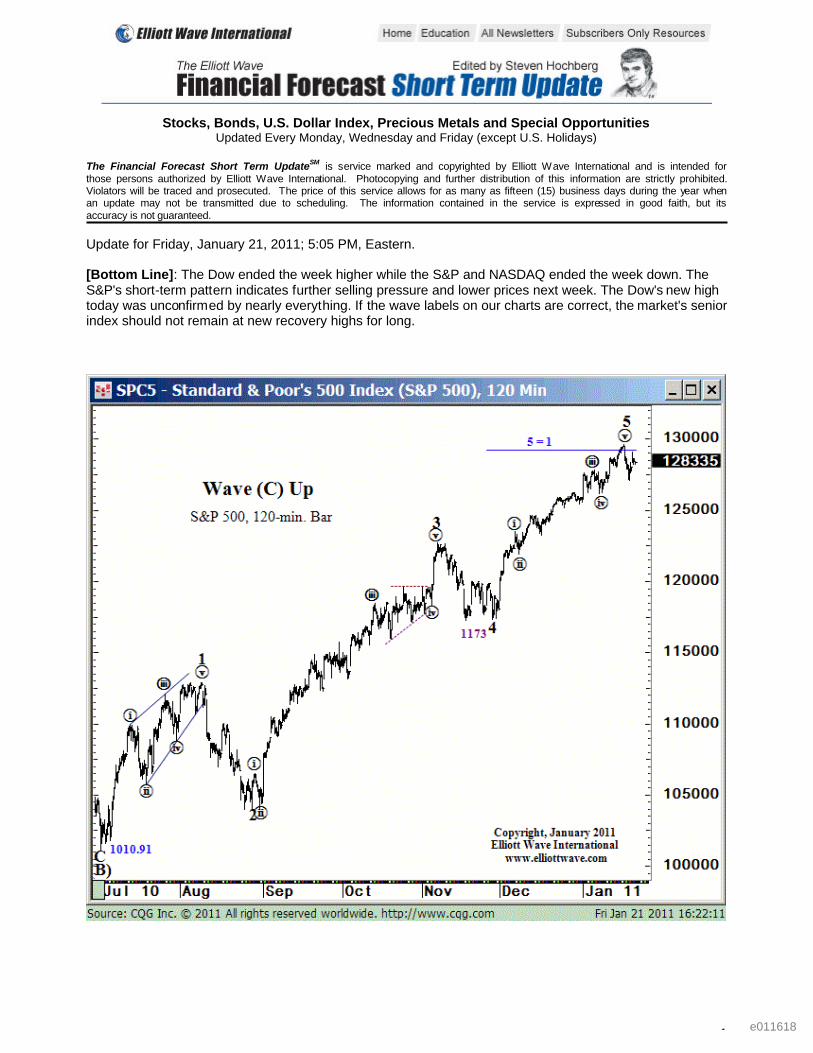
Update for Friday, January 21, 2011; 5:05 PM, Eastern. [Bottom Line]: The Dow ended the week higher while the S&P and NASDAQ ended the week down. The S&P's short-term pattern indicates further selling pressure and lower prices next week. The Dow's new high today was unconfirmed by nearly everything. If the wave labels on our charts are correct, the market's senior index should not remain at new recovery highs for long.
e011618
http://www.elliottwave.com Financial Forecast Short Term Update
(January 21, 2011) 2
So far, the S&P's decline has drawn prices to 1271.26, yesterday's intraday low. The initial target for the decline is the 1173-1200 range, the bottom of which is the previous wave 4 low, as indicated on the 120-minute chart. The clearest structure is seen on the hourly S&P futures chart, which includes the Globex trading session. I've placed wave labels to show the five-wave decline from the high to yesterday's low, followed by the three-wave rally. This morning the contract reached the upper end of its corrective-wave trend channel while simultaneously retracing a Fibonacci 2/3 (66.7%) of the preceding five down. Prices should soon begin another wave lower that draws the market significantly lower in a small-degree third wave. Any rise above Tuesday's 1296.06 high basis the cash index would eliminate the implications of the near-term picture shown on the hourly chart.
e011618
http://www.elliottwave.com Financial Forecast Short Term Update
(January 21, 2011) 3
The tension in the market is increasing to fever pitch, as the Dow Industrials rose to a new high today at 11,905.50, unconfirmed by every other major stock index. Wednesday night we were "less certain of a top in the Dow," due to the lack of impulsive selloff from its recent high. But we also observed that "even if the DJIA ekes out a new high, the diverging behavior in the Transports indicates that any further upward push should prove terminal." The above chart shows the burgeoning Dow Theory non-confirmation, as the Industrials continued higher today, while the Transports turned down from a closing high on January 13 and an intraday high on Tuesday. This is classic market behavior that oftentimes occurs at the end of a trend. The fact that it is occurring at the end of a fifth wave within a rally that has been in force over the prior 6½ months makes the bearish message even more intense. It would take a Dow Transport close above 5229.50 to eliminate this non-confirmation. As we've noted, at 12,035, wave 5 would equal wave 1 in the Dow Industrials, which is 130 points above today's high. But it remains difficult to reconcile another 100+ point Dow push with the rest of the market falling, as the near-term structure in the S&P suggests. Once the Industrials decline beneath 11,573.90, the wave iv (circle) of 5 low on January 10, we should be able to relegate any further new high to very low probability status. The Dow's initial downside target, the bottom of which is the wave 4 low from November 29, remains in the 10,929-11,113 area. If the highs now being made represent all of wave (C) of Primary wave 2 (circle), as we surmise, the entire stock market should be at the forefront of a multi-year decline.
e011618
http://www.elliottwave.com Financial Forecast Short Term Update
(January 21, 2011) 4
We've talked often about the extreme in optimism and lagging upward momentum that accompanied stocks as they pushed to their recent highs. We keep a number of different indicators to help judge each measure and we try to show the most interesting picture in these pages and in our newsletter. Since we noted the Dow Theory non-confirmation above, we thought tonight we would look at a momentum chart based on an indicator configured by the most famous living Dow Theorist. The inimitable Richard Russell has written Dow Theory Letters for an incredible 53 years. His proprietary indicator, which he calls the Primary Trend Index (PTI), is market based and is designed to gauge the market's trend; hence the name. Russell uses a Fibonacci 89-day moving average as the protocol to delineate a primary up trend relative to a primary down trend. If the PTI is above the 89-day average, the market is defined to be in an up trend and vice versa. The bottom line on the above chart plots the difference between the PTI and the 89-period moving average and is therefore a "momentum" oscillator. Observe the blue lines above the S&P 500 and the PTI Oscillator. The PTI Oscillator topped on the first trading day this year, January 3, and made a lower high relative to the S&P on January 12. So the first week and a half of market action this year occurred with the an increasing internal deterioration. On a larger basis, the rise over the past 6½ months has generated a lower peak rate of change than the rise into April of last year, suggesting that the advance is a terminal wave and not the start of a larger and longer rally.
e011618
http://www.elliottwave.com Financial Forecast Short Term Update
(January 21, 2011) 5
That NASDAQ Composite gapped lower at yesterday's open and then bounced the rest of the session. Today's open carried the index to 2722.70, back into the gap. This push proved to be the high of the day and the Composite fell persistently through today's close. Our view remains that over the coming months, the Composite will work its way to the 2460-2500 area, the bottom of which is the previous wave 4 low from November 16. Shorter term, the current leg down will find minor support in the area surrounding 2650, which is the next objective. Tuesday's 2766.10 high is key to the bearish case.
e011618
http://www.elliottwave.com Financial Forecast Short Term Update
(January 21, 2011) 6
The [iShares 20+year U.S. T-bond Fund: TLT] made a new low for the move yesterday, falling to 90.39 before bouncing slightly today. The bond moves over the prior several weeks have been choppy, both up and down. The rise from 90.47 (Dec. 15) to 94.70 (Dec. 31) traced out an A-B-C, as we've discussed, and now the decline from 94.70 appears to be a "three," or some variation of the pattern. This structure introduces the potential for either a running triangle (see EWP, p.49) from the December 15 low, or possibly an upward flat (see EWP, p.45), with yesterday's low marking wave "b" of the pattern. Both potentials allow for a bounce from near current levels. But there are other possibilities, including a continued selloff to the 87.30-88.60 range. We will need to let the pattern develop further before we can eliminate some of the short-term options.
e011618
http://www.elliottwave.com Financial Forecast Short Term Update
(January 21, 2011) 7
e011618
http://www.elliottwave.com Financial Forecast Short Term Update
(January 21, 2011) 8
This morning the [U.S. Dollar Index] declined beneath Wednesday's 78.30 low, which muddies the short-term wave structure. As it was, the pattern was ideal to count a complete downward flat correction, as discussed Wednesday night. Today's new low introduces near-term options to the pattern. Still, as the chart of Dollar/Swiss shows, not only did the dollar not make a new low relative to this particular currency, but it is possible to count a well-proportioned five-wave rise and three-wave pullback from the wave 2 low, as labeled on tonight's chart. This pattern still implies a significant dollar rally. Dollar/Yen also did not make a new low and may be counted similar to Dollar/Swiss. So for the time being, we are sticking with our forecast for a dollar rally, one that holds the potential to be significant. A rise above 79.60 in the dollar index, a previous fourth-wave high, would indicate that this advance has started. Next week appears important for the rally potential, so stay tuned to these pages as we keep you updated on the pattern.
e011618
http://www.elliottwave.com Financial Forecast Short Term Update
(January 21, 2011) 9
The [Euro] is the same as the dollar, but moving in the opposite direction. Today's rise to 1.3620 carried prices to a 50% retracement of the decline from the 1.4283 high on November 4. But in doing so, prices muddled what appeared to be an ideal upward flat, as described Wednesday. Today's push is problematic for the bearish case, but not fatal. A decline beneath the previous fourth-wave low at 1.3244 (Jan. 17) would "right the ship" and place the bearish case back on firm footing. We may have to endure a smaller down-up sequence next week before prices turn lower in earnest, but the bigger picture pattern still indicates that significantly lower euro prices are probably in the months ahead. As with the dollar, next week's market action may be important, so stay tuned.
e011618
http://www.elliottwave.com Financial Forecast Short Term Update
(January 21, 2011) 10
e011618
http://www.elliottwave.com Financial Forecast Short Term Update
(January 21, 2011) 11
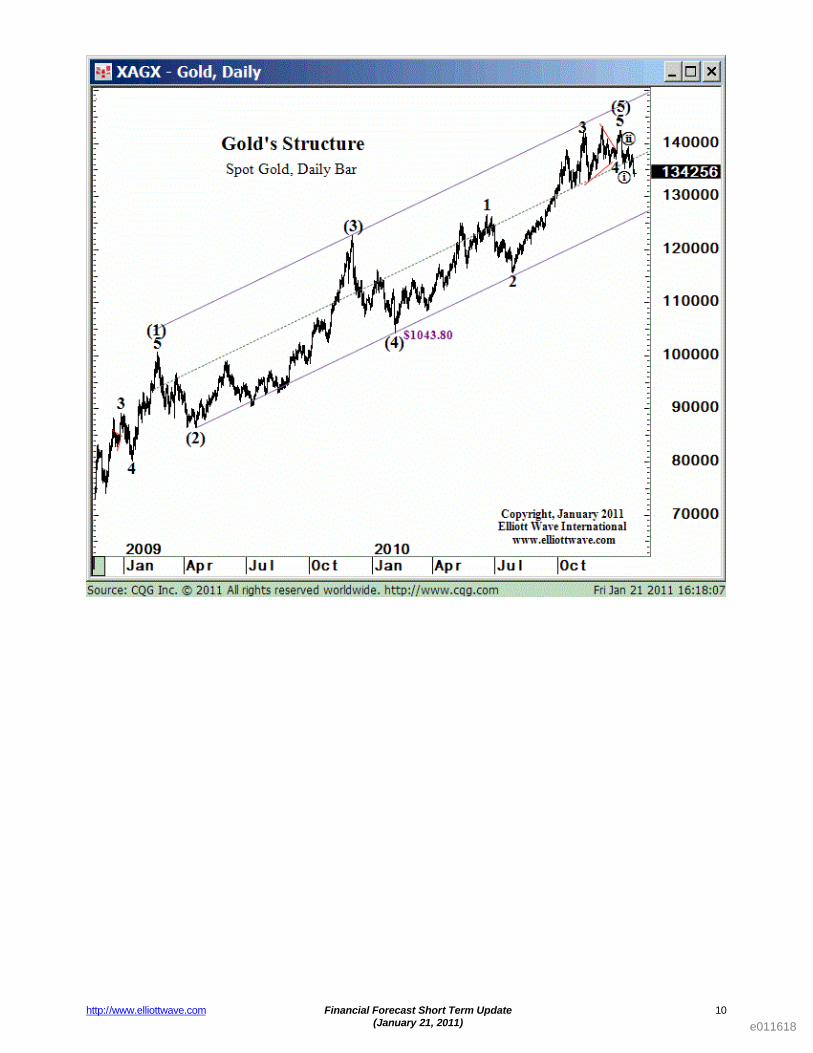
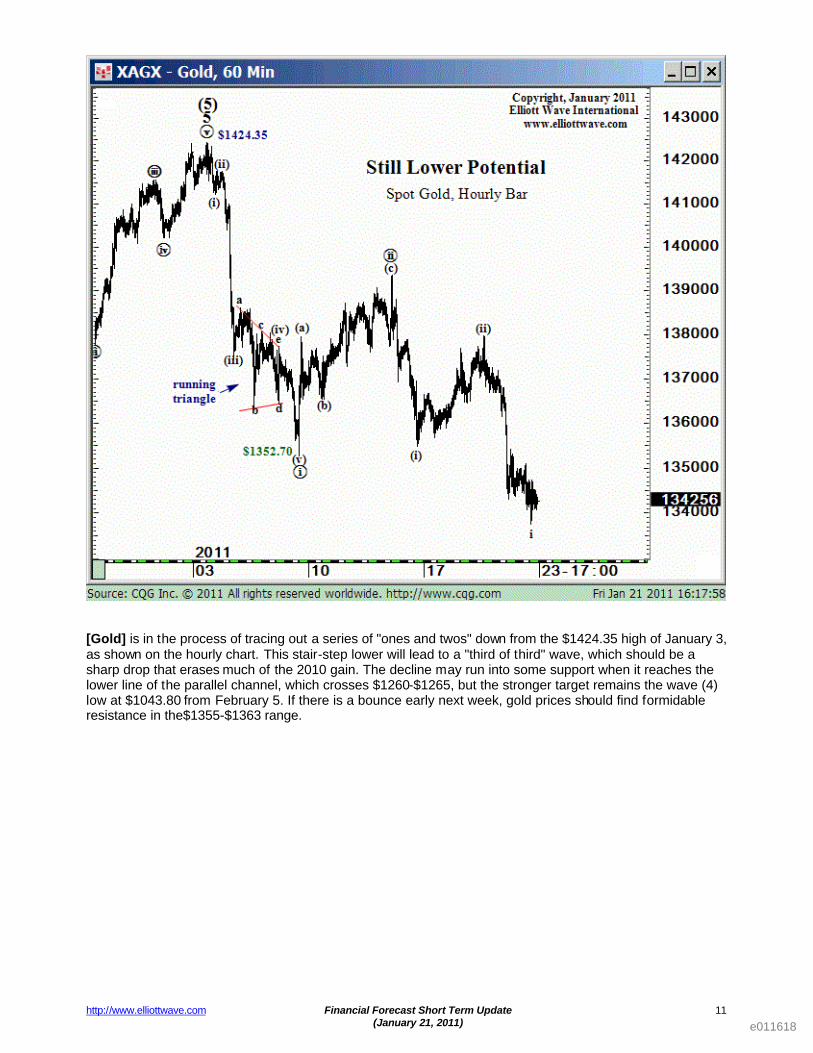
[Gold] is in the process of tracing out a series of "ones and twos" down from the $1424.35 high of January 3, as shown on the hourly chart. This stair-step lower will lead to a "third of third" wave, which should be a sharp drop that erases much of the 2010 gain. The decline may run into some support when it reaches the lower line of the parallel channel, which crosses $1260-$1265, but the stronger target remains the wave (4) low at $1043.80 from February 5. If there is a bounce early next week, gold prices should find formidable resistance in the$1355-$1363 range.
e011618
http://www.elliottwave.com Financial Forecast Short Term Update
(January 21, 2011) 12
e011618
http://www.elliottwave.com Financial Forecast Short Term Update
(January 21, 2011) 13
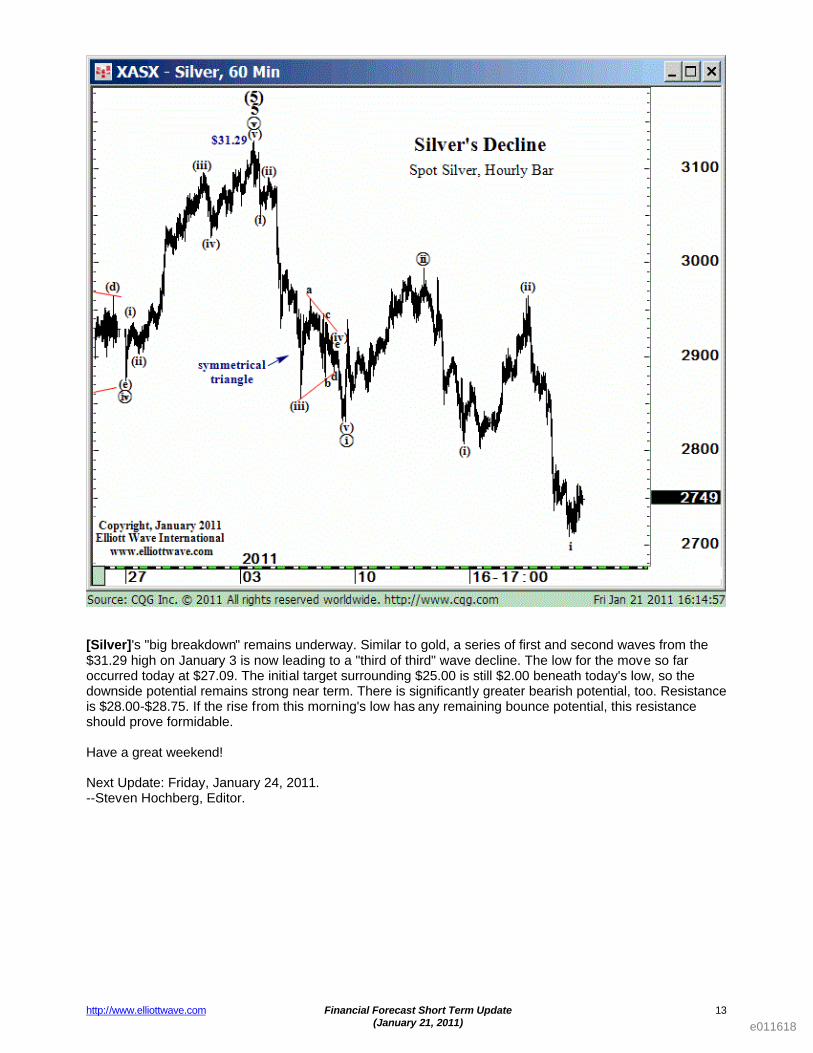
[Silver]'s "big breakdown" remains underway. Similar to gold, a series of first and second waves from the $31.29 high on January 3 is now leading to a "third of third" wave decline. The low for the move so far occurred today at $27.09. The initial target surrounding $25.00 is still $2.00 beneath today's low, so the downside potential remains strong near term. There is significantly greater bearish potential, too. Resistance is $28.00-$28.75. If the rise from this morning's low has any remaining bounce potential, this resistance should prove formidable. Have a great weekend! Next Update: Friday, January 24, 2011. --Steven Hochberg, Editor.
e011618
The Elliott Wave Principle is a detailed description of how financial markets behave. The description reveals that mass psychology swings from pessimism to optimism and back in a natural sequence, creating specific Elliott wave patterns in price movements. Each pattern has implications regarding the position of the market within its overall progression, past, present and future. The purpose of Elliott Wave International’s market-oriented publications is to outline the progress of markets in terms of the Wave Principle and to educate interested parties in the successful application of the Wave Principle. While a course of conduct regarding investments can be formulated from such application of the Wave Principle, at no time will Elliott Wave International make specific recommendations for any specific person, and at no time may a reader, caller or viewer be justified in inferring that any such advice is intended. Investing carries risk of losses, and trading futures or options is especially risky because these instruments are highly leveraged, and traders can lose more than their initial margin funds. Information provided by Elliott Wave International is expressed in good faith, but it is not guaranteed. The market service that never makes mistakes does not exist. Long-term success trading or investing in the markets demands recognition of the fact that error and uncertainty are part of any effort to assess future probabilities. Please ask your broker or your advisor to explain all risks to you before making any trading and investing decisions. http://www.elliottwave.com Financial Forecast Short Term Update