122
Stocktaking of the Housing Sector in Sub-Saharan Africa Challenges and Opportunities

Stocktaking of the Housing Sector in Sub-Saharan Africa
Challenges and Opportunities

© 2015 The International Bank for Reconstruction and Development / The World Bank
1818 H Street NW
Washington DC 20433
Telephone: 202‐473‐1000
Internet: www.worldbank.org
1 2 3 4 15 14 13 12
This work is a product of the staff of The World Bank with external contributions. The findings,
interpretations, and conclusions expressed in this work do not necessarily reflect the views of The World
Bank, its Board of Executive Directors, or the governments they represent.
The World Bank does not guarantee the accuracy of the data included in this work. The boundaries,
colors, denominations, and other information shown on any map in this work do not imply any
judgment on the part of The World Bank concerning the legal status of any territory or the endorsement
or acceptance of such boundaries.
Rights and Permissions
The material in this work is subject to copyright. Because The World Bank encourages dissemination of
its knowledge, this work may be reproduced, in whole or in part, for noncommercial purposes as long as
full attribution to this work is given.
Any queries on rights and licenses, including subsidiary rights, should be addressed to the Office of
the Publisher, The World Bank, 1818 H Street NW, Washington, DC 20433, USA; fax: 202‐522‐2422; e‐
mail: [email protected].

Stocktaking of the housing sector in Sub-Saharan Africa
Sub-Saharan Africa is experiencing rapid urbanization
as well as a growing slum population.
1.2 billion urban residents
by 2050
4.5 million new residents In informal settlements
each year
Many households cannot afford basic formal housing or access mortgage loans.
$1,699 GNI per capita
5% of adults took a mortgage loan from a formal bank in the past year
Obtaining formal housing is often costly, with cumbersome regulatory requirements and a backlog of basic infrastructure.
Registering property costs 8.3% of the value
162.2 days to obtain a construction permit, on
average
50 years to reach full infrastructure coverage
Yet a well-functioning housing market can be a vital economic sector and a potential source of job creation.
Housing investments represent 6% of GDP
5 jobs per house built
Countries can expand access to adequate housing and improve the quality of existing stock by promoting incremental upgrading,
extending basic infrastructure, addressing constraints for housing suppliers, and improving access to housing finance.


Stocktaking of the Housing Sector in Sub-Saharan Africa
v
Contents
Abbreviations ..........................................................................................................................ix
Acknowledgments ...................................................................................................................xi
1. Executive Summary ......................................................................................................... 1
A. Urbanization and Affordable Housing ........................................................................................ 1
B. The Policy Challenge: Strengthening Housing Value Chains ....................................................... 3
2. Overview: Urbanization and the Housing Sector ............................................................. 6
A. Background and Justification ...................................................................................................... 6
B. Toward the Twin Goals: The Importance of Housing for Inclusive Growth ................................ 7
C. Differentiating Formal and Informal Housing ........................................................................... 10
D. Analytical Framework and Data Collection ............................................................................... 14
3. Housing in SSA: Overall Features and Trends ................................................................ 18
A. The Affordability Gap ................................................................................................................ 23
A.1. Rental is an important affordable tenure option, particularly in the
context of self‐build housing. .................................................................................................. 28
A.2. Few governments have directly addressed housing informality ....................................... 31
B. Current Government Policies Have Had Limited Impact on the Provision of Affordable Housing ..................................................................................................................................... 32
B.1. Government subsidies do not effectively address the need for affordable
housing and fail to engage the private sector. ......................................................................... 33
4. Supply Issues and Affordability ..................................................................................... 40
A. Access to Land, Affordability of Land, and Security of Tenure Drive Overall Housing Affordability .............................................................................................................................. 40
A.1. The plurality of tenure systems, even within a single country,
complicates access to land ........................................................................................................ 41
A.2. Governments struggle to establish consolidated, efficient land
administration systems, despite promising reforms made in recent years. ............................ 42
A.2. Planning regulations can increase the cost of formal housing. ......................................... 44
A.3. Conclusion.......................................................................................................................... 47
B. Infrastructure Provision is Scarce and Lags behind Housing Development ............................. 48
B.1. Conclusion .......................................................................................................................... 52
C. The Cost of Formal Construction Is High Relative to Household Incomes ............................... 53
C.1. With the high cost of formal building materials, many homes are
constructed from “informal” materials. ................................................................................... 53
C.2. There is a shortage of formally qualified construction firms. ............................................ 55

Stocktaking of the Housing Sector in Sub-Saharan Africa
vi
5. Housing Demand and Access to Finance ........................................................................ 56
A. Most of the SSA Population Cannot Access Formal Housing Finance ........................................... 56
A.1. SSA’s mortgage sector is underdeveloped. ....................................................................... 58
A.2. Microfinance for housing would improve access to quality housing for
some low‐income groups .......................................................................................................... 64
A.3. Conclusion.......................................................................................................................... 69
B. Remittances Could Have a Substantial Impact on Housing, but Further Understanding and Action Are Constrained by Limited Data ................................................................................... 70
6. Key Conclusions and Policy Directions ........................................................................... 72
A. Cross Cutting Solutions for the Housing Sector ........................................................................ 77
A.1. Formalizing customary land administration systems ........................................................ 78
B. Engaging Informality: Toward Inclusive Housing Policy ............................................................ 80
C. Harnessing the Formal Housing Sector for Economic Growth ................................................. 86
References............................................................................................................................. 88
Appendix 1. Affordability in Sub‐Saharan Africa ............................................................................... 96
Appendix 2. Global Findex Financial Inclusion Tables ..................................................................... 100
Notes ................................................................................................................................... 102
List of Boxes
Box E1. Defining Formal Housing .................................................................................................................. 2
Box E2. Defining Informal Housing ............................................................................................................... 3
Box 1. Elements of a Strong Formal Housing System ................................................................................. 11
Box 2. Characteristics of Informal Housing ................................................................................................. 11
Box 3. Informal Home Construction Process in Sub Saharan Africa ........................................................... 13
Box 4. Difficulties in Estimating Housing Need: The Case of Ghana ........................................................... 18
Box 5. Examples of Subsidy Programs in SSA .............................................................................................. 34
Box 6. South Africa’s Housing Subsidy Experience ..................................................................................... 37
Box 7. Informal Settlement Upgrading and Housing Improvement in Mauritania .................................... 39
Box 8. Transparency in Public Land Management: The Case of Nigeria ..................................................... 42
Box 9. Steps in the Right Direction for Improving Land Administration ..................................................... 43
Box 10. Options for Improving Tenure Security for Informally Settled Populations .................................. 44
Box 11. Housing Finance and Informality ................................................................................................... 62
Box 12. The Growth of Housing Microfinance: The Case of LaFarge .......................................................... 69
Box 13. Rwanda’s National Housing Policy: Developing an Inclusive Housing Market .............................. 74
Box 14. Qualified Informal HMF Borrower ................................................................................................. 85
Box 15. Example: One‐Room Upgrade Loan ............................................................................................... 85
Box 16. Total Cost of Urban Living for an Interval of Time ......................................................................... 97
Stocktaking of the Housing Sector in Sub-Saharan Africa
vii
List of Figures
Figure 1. Urban Population as Percent of Total in Selected SSA Countries .................................................. 7
Figure 2. Average Annual Rate of Change of Percentage Urban by Regions ................................................ 8
Figure 3. Number of People Living in Slums—by Region .............................................................................. 9
Figure 4. Housing Investment and Per‐capita Income, SSA (2011) and the World (1960‐
2011) .............................................................................................................................................. 10
Figure 5. A Continuum of Informality in Housing ....................................................................................... 12
Figure 6. Formal Supply and Demand Side Value Chains for Housing Delivery .......................................... 14
Figure 7. Simulated Cost to Provide Formal Housing Units for Selected Countries, 2015‐
2030 ............................................................................................................................................... 20
Figure 8. Distribution of Urban Population by Shelter Deprivation (2005) ................................................ 22
Figure 9. Urbanization and GNI Per‐Capita (US$) in Select SSA Countries, 2014 ....................................... 23
Figure 10. Relationship of Income to House Prices in SSA.......................................................................... 24
Figure 11. Housing Affordability Pyramid for Ghana .................................................................................. 25
Figure 12. CAHF Yearbook Affordability Pyramids for Cameroon .............................................................. 26
Figure 13. CAHF Yearbook Affordability Pyramids for Nigeria.................................................................... 26
Figure 14. Housing Cost Comparisons: Formal vs. Informal in Zambia, Malawi, and
Liberia............................................................................................................................................. 27
Figure 15. Affordability of Condo Mortgages of IHDP in Addis Ababa, Ethiopia (2014) ............................. 35
Figure 16. House Price‐To‐Income Ratios for Government Social Housing Program in
Cameroon ...................................................................................................................................... 36
Figure 17. Average Time and Cost to Register Property in Sub‐Saharan African Countries
and International Benchmarks....................................................................................................... 45
Figure 18. Ease of Registering Property Rankings for Sub‐Saharan African Countries ............................... 45
Figure 19. Average Time and Cost to Obtain a Construction Permit in Sub‐Saharan Africa
and International Benchmarks....................................................................................................... 46
Figure 20. Infrastructure Service Coverage by Household Budget Quintile in SSA .................................... 50
Figure 21. Average Cost to Connect to Electricity for Businesses by Region .............................................. 51
Figure 22. Sources of Financing for Capital Investment in Infrastructure in Africa .................................... 52
Figure 23. Average Price of 50 kg Bag of Cement in SSA ............................................................................ 54
Figure 24. Sources of New Formal and Informal Loans in SSA ................................................................... 57
Figure 25. Outstanding Loan for Home Construction and Home Purchase (% age 15+) in
2011 ............................................................................................................................................... 59
Figure 26. Mortgage Loans as a Percent of GDP vs. GDP Per Capita for Selected SSA
Countries ........................................................................................................................................ 60
Figure 27. Lending Interest Rates in Sub‐Saharan Africa, 2013 (%) ............................................................ 61
Figure 28. Number of MFIs and Gross Loan Portfolio of Microfinance Markets in SSA ............................. 66
Figure 29. Savings Methods among Savers in Economies with the Highest Use of
Community‐Based Saving .............................................................................................................. 67
Figure 30. Financial Access Pyramid for Uganda ........................................................................................ 68
Figure 31. Key Activities for Improving Access to Quality Affordable Housing .......................................... 75

Stocktaking of the Housing Sector in Sub-Saharan Africa
viii
List of Tables
Table 1. Comparative Summary of Housing Delivery Conditions in SSA .................................................... 16
Table 2. Recent Housing Shortage Estimates of Selected SSA Countries, 2013 ......................................... 21
Table 3. Housing Tenure in Selected SSA Countries ................................................................................... 29
Table 4. Housing Affordability Tools (HATs) ............................................................................................... 33
Table 5. Minimum Plot Sizes for Residential Uses (m2) .............................................................................. 47
Table 6. Africa's Infrastructure Deficit ........................................................................................................ 49
Table 7. Regional Comparisons between Financial Access Indicators ........................................................ 56
Table 8. Comparison of Available Finance Options .................................................................................... 58
Table 9. Active Borrowers and Gross Loan Portfolio for Microfinance Institutions by
Region ............................................................................................................................................ 65
Table 10. Percentage of Remittances Going toward Housing Expenditures for Recipient
Households in Selected African Countries .................................................................................... 71
Table 11. Summary of Key Findings and Recommendations ...................................................................... 76
Table 12. Overview of Core Interventions across the Continuum of Formal and Informal
Households .................................................................................................................................... 81
Table 13. Total Cost of Urban Living ........................................................................................................... 97

Stocktaking of the Housing Sector in Sub-Saharan Africa
ix
Abbreviations
ACSI Amhara Credit and Savings Institution
AICD Africa Infrastructure Country Diagnostic
BHC Botswana Housing Corporation
CAHF Center for Affordable Housing Finance in Africa
CCODE Centre for Community Organisation and Development
FAR Floor to area
GDP Gross domestic product
GHC Ghanaian cedi
GNI Gross national income
HAT Housing affordability tools
HMF Housing microfinance
IHDP Integrated Housing Development Program
IMF International Monetary Fund
MFI Microfinance institutions
MINHDU Ministère de l'Habitat et du Développement urbain
MIPROMALO Local Materials Promotion Authority
NBFC Non‐banking financial companies
NGO Non‐governmental organizations
NHC National Housing Corporation
NMRC Nigeria Mortgage Refinance Company
OECD Organization of Economic Cooperation and Development
PMI Primary mortgage institutions
ROSCA Rotating Savings and Credit Associations
SACCO Savings and Credit Cooperative Organizations
SME Small and medium enterprises
SNEN National union of teachers, Niger
SSA Sub‐Saharan Africa
TCO Total cost of occupancy
TCUL Total cost of urban living
WB World Bank


Stocktaking of the Housing Sector in Sub-Saharan Africa
xi
Acknowledgments
This Report on Stocktaking of the Housing Sector in Sub Saharan Africa was carried out by a team from the World Bank in collaboration with international and local experts across the region.
The team was led by Jonas Ingemann Parby (TTL, Urban Specialist) and Nancy Lozano‐Gracia (Co‐TTL, Senior Economist), and included David Ryan Mason (Urban Specialist), Somik V. Lall (Lead Economist), Basab Dasgupta (Economist), and Cheryl Young (Economist). The report benefited from contributions on data analysis and executive summary from Annie Bidgood (Urban Specialist) and Narae Choi (Urban Specialist). Somik V. Lall, Nancy Lozano Gracia and Basab Dasgupta delivered the paper on Urbanization and Housing Investment and Cheryl Young and Nancy Lozano‐Gracia worked on Housing Consumption and Urbanization. The team from the Affordable Housing Institute, led by David Smith, provided important input and analysis in the development of the methodological approach, the data collection process, and in the drafting of the report. The team would like to thank Roland White (Global Lead, City Management, Governance and Financing) for extensive and detailed technical advice and guidance throughout the work on this report.
The team is grateful to the peer reviewers Angelica Nuñez (Senior Urban Specialist), Ellen Hamilton (Lead Urban Specialist), and Simon Walley (Lead Financial Sector Specialist) who provided invaluable feedback throughout the process of developing this report. Sameh Wahba (Practice Manager) provided valuable technical guidance to the team and overall guidance. Sonia Wheeler provided timely and comprehensive administrative support throughout.
We would like to extend our thanks to the Governments of Nigeria, Cameroun and Ethiopia for the excellent collaboration during the course of developing the country study case studies. The case studies were carried out by a team on international and local experts, including Michael Mutter, Tony Lloyd‐Jones, Simon Gusah, Michael Majale, Benoit Mougoué, Graham Tipple and Elias Yitbarek Alemayehu.
The team would also like to acknowledge the financial support provided by the Multi Donor Sustainable Development Trust Fund.


Stocktaking of the Housing Sector in Sub-Saharan Africa
1
1. Executive Summary
A. Urbanization and Affordable Housing
Sub-Saharan Africa will lead the world in urban growth. Africa is the globe’s least‐urbanized continent, accommodating 11.3 percent of the world’s urban population, and the Sub‐Saharan region is the continent’s least‐urbanized area. Nonetheless, the region’s cities are expanding rapidly. The United Nations predicts that Africa will overtake Asia as the world’s most rapidly urbanizing region by 2025 (UN 2014). In the coming 20 years, the total population of the continent will exceed the combined populations of Europe and the Americas. By 2050, Nigeria alone will contribute nearly 10 percent of the world’s total population growth. Although the nature and pace of urbanization varies among countries, with over a quarter of the world’s fastest growing cities, Africa is undergoing a massive urban transition.
Globally, cities are major drivers of economic growth, and the quality and location of housing has long term consequences for inclusive growth. People move to cities in order to improve their lives and those of their families because of the economic opportunities they provide relative to rural areas. Access to a diverse, quality housing stock that is affordable to households will set a foundation for inclusive growth in rapidly urbanizing cities. For most households, purchasing or building a house is the single largest expenditure they will ever make. A home is also typically the most important household asset and an investment which can appreciate in value over time, be used for collateral for borrowing and be an important component of intergenerational wealth transfer through inheritance. Where housing is located in proximity to schools, jobs and transit access, this directly impacts the quality of urban life and prospects for social mobility (World Bank 2013f). Finally housing stocks, along with investment and employment in related construction and finance industries, constitute a major component of national economic wealth.
However, in Sub-Saharan Africa, urbanization is not accompanied by the level of per-capita economic growth or housing investment that is observed elsewhere in global trends. Urbanization in many African countries has not necessarily been accompanied by industrial growth and the structural transformation that has occurred in other regions, nor the same level of incomes. For example, SSA reached 40 percent urban in 2013 with a GDP per capita of $1,018; East Asia and the Pacific reached the same level of urbanization in 1994 at $3,617 per capita, the Middle East and North Africa in 1968 at $1,806 per capita, and Latin America and the Caribbean in 1950 at $1,860 per capita. The comparatively low growth in per‐capita income in SSA limits the resources that households have to consume or invest in housing.
At the same time, the formal channels through which quality housing is produced and financed face major constraints that limit access to a large share of urban households. Although the housing sector in Africa is highly heterogeneous with substantial differences between countries, some consistent patterns emerge as a function of overall poorly functioning housing markets. Obtaining, transferring, and developing land for residential use is often costly and time consuming. Second, network infrastructure—roads, power, piped water, sewage/drainage and so forth to service residential land—is lacking and very expensive to build retroactively in settlements that do not have such connections. Most SSA countries also lack the institutions and capacities to capture land value in ways that can be used to finance these types of public infrastructure investments. Finally, the cost of building the dwelling is very high due to the cost of construction materials (such as cement) and the lack of a robust construction sector. The scarcity of these inputs drives up the cost of formal housing for all residents, and the majority of low‐income and

Stocktaking of the Housing Sector in Sub-Saharan Africa
2
middle income groups are therefore forced to seek other housing options that are often of lower quality and may be without secure tenure.
Box E1. Defining Formal Housing
Formal housing is the product of specialized supply and demand‐side value chains. Housing ‘formality’ typically means a home that:
Has valid legal title,
Is structurally sound and complies with local planning standards and building codes, and
Can be pledged as collateral for a long‐term mortgage loan.
Formal housing units with such qualifications are the product of coordination between public and private sector activities, involving land, infrastructure, design and construction on the supply side, and a corresponding set of demand side inputs related to housing finance.
Evidence of this trend is the lack of formal investment in housing across the region. Dasgupta et al. (2014) have found that in Africa, housing investment lags urbanization by nine years. The majority of housing investment in most African countries comes from government debt or domestic savings rather than from international capital markets as is the case in developed economies. As a result, the existing housing stock in Sub Saharan Africa remains overcrowded and of limited quality, and there is typically a backlog of housing.
As a result of low incomes and high costs of formal housing, the informal delivery of housing as a less expensive alternative has been the norm in SSA, while formality is the exception. Informal housing is not necessarily equal to slum housing. Rather, informality represents a continuum of housing conditions, ranging from units without access to any improved infrastructure, absent compliance with planning and building standards and lacking land and property tenure security to units with sequentially greater levels of permanence, tenure security and quality. While the precise degree and cost requirements of housing standards have long been debated (Payne 2001; Cohen 2007), the definition of informality allows for wide variation in the type and quality of housing. Indeed, global experience suggests that it is common for informal housing conditions to improve incrementally over time through infrastructure upgrading, self‐built construction, and tenure claim recognition (Majale and Payne 2004; Payne 2005; Choguill 1999).
These informal channels are known to contribute around three quarters of the total housing stock, although data on the informal housing sector in Africa is scarce. Identifying the quality or quantity of housing deficits (formal and informal) is extremely difficult, and requires careful conceptual clarity about existing stock, occupancy, and household sizes. The definitions and methodologies used by governments to estimate housing deficits vary widely. In general, housing shortfalls can be calculated based on three different qualities: (i) the numerical shortfall in dwellings (deficit); (ii) the qualitative shortfall in physical conditions (obsolescence or substandard construction with non‐durable building material); and (iii) the space shortfall within dwellings (overcrowding). Under this approach, total housing stock is an aggregate of different shelter types (new units and existing units) and tenure arrangements (rental vs. ownership for example). These approaches rely on estimates of new household formation and an ideal occupancy ratio per dwelling unit, which may not reflect typical conditions. They also overlook how much of the existing housing stock can be improved, rather than replaced. The UN also estimates more than 200 million people in the region will live in slums by 2020 (UN‐Habitat 2014). The slum population is growing

Stocktaking of the Housing Sector in Sub-Saharan Africa
3
at 4.5 percent annually, a rate which will result in doubling the slum population in 15 years (Marx et al. 2013). After this period, the majority of the world’s slum dwellers will live in African cities; currently all other regions are experiencing a rapid decline in the prevalence of slums.
Box E2. Defining Informal Housing
Informal housing is defined by deviations from the laws and regulatory frameworks that govern formal access and use of land and buildings (UN‐Habitat, 2003). Since informal economic and social systems operate with indifference to, and in non‐compliance with, the formal regulatory and administrative structures, informal housing delivery networks are not well‐studied and quantitative information about the scale and depth is scarce and non‐standardized. Nonetheless, informal housing in SSA share one or more of the following characteristics:
Located at the urban periphery or within the interstices of the formal city (e.g. non buildable or risk areas).
Self‐designed and self‐built with local materials.
Does not fully conform to building and land use standards.
Poorly serviced by infrastructure networks and public services.
Financed out of family/group savings and/or loans from informal lenders.
Incrementally improved by the occupant over a long period of time.
Lacks legal title and often subject to insecurity of tenure Housing informality represents a spectrum of different shelter locations, conditions and tenure statuses, from slum conditions, to partially upgraded structures, to semi‐formal conditions.
Across SSA the key will be to identify systemic gaps or blockages in value chains, and illuminate important functional processes that are often overlooked. Comparing formal and informal value chains will identify areas for policy attention to improve the function and overall affordability of the housing sector for urban residents. The informal housing sector has a separate, parallel value chain system but, in many areas, this value chain cannot adequately provide quality housing for the majority. The purpose of the value chain approach is to map out the main constraints for supply and demand, which limit the housing sector’s contributions to domestic economies and its power to provide affordable housing at scale.
The primary issue is not an absolute lack of housing supply but instead a very limited provision of quality housing within the continuum of informal conditions shown above. The challenge for policy makers is to improve housing delivery value chains in a way that allows residents to steadily transition toward more formal housing conditions. At the same time, improvements to formal sector value chains can reduce the cost of construction and broaden access to finance for consumers and developers.
B. The Policy Challenge: Strengthening Housing Value Chains
The report provides an overview of observed housing trends common throughout the region. While it does not provide specific recommendations or a sequence of actions, it does identify critical areas of concern for improving the function of the housing sector with the goal of improving the quality of informal housing conditions and reducing the cost and widening the accessibility of formal housing delivery.

Stocktaking of the Housing Sector in Sub-Saharan Africa
4
The report takes note of the following features of housing in Africa, through an analysis of existing evidence from across the continent:
1. Formal housing remains unaffordable to most households, who find alternative solutions in the informal sector
a. The cost of formal housing is much higher than the average household’s ability to pay.1 b. Self‐built informal dwellings constitute the main housing supply of SSA cities. c. Rental or rent‐free arrangements are an important affordable tenure option, particularly in
the context of self‐build housing.
2. Government subsidies for producers and consumers fail to effectively address the affordability constraints of formal housing
a. Most subsidy programmes suffer from limitations in their design, lack targeting and monitoring criteria, and often end up being captured by wealthier individuals that could otherwise afford market‐rate housing
b. Due to the cross constraining constraints increasing costs of all housing, government programmes subsidized units remain unaffordable for low‐income groups and are not financially sustainable to bring to scale to meet demand
c. Private developers rarely participate in housing delivery for lower‐income groups due to finance and capacity constraints.
Supply constraints raise housing prices 3. Land administration systems provide limited support for investment and market exchange
a. A plurality of tenure and governance systems impedes the growth of formal land markets and housing finance.
b. The relationship between common and customary land law is ambiguous in many countries. c. Governments struggle to establish consolidated, efficient land recording and regulatory
systems, though promising reforms have been made in recent years. d. These factors reduce the supply and circulation of land for development.
4. Infrastructure provision is scarce and lags behind housing development
a. Infrastructure coverage across SSA is limited and in some countries, declining in urban areas. b. Infrastructure expansion can often not follow the pace of urban growth ‐ the formal process
of plan‐service‐build‐occupy is reversed into occupy‐build‐service‐plan c. Priority investments in infrastructure tend to be directed toward middle‐ and upper‐income
groups rather than the urban poor.
5. The cost of formal construction is high relative to household incomes owing to building material costs, labor shortages, and building regulations.
a. The cost of formal building materials is high relative to household incomes and are often not locally produced.
b. There is shortage of formally qualified construction firms and tradespeople. c. Building regulations and density requirements can increase the cost of formal housing and
result in large welfare costs.
Stocktaking of the Housing Sector in Sub-Saharan Africa
5
Demand for formal housing is tempered by the low and irregular incomes of households and the lack of affordable financing options 6. The large majority of the population cannot access formal housing finance
a. Overall financial access in SSA is low due to high interest and low income levels, and most financial activity occurs outside of formal institutions.
b. SSA’s mortgage sector is underdeveloped and activity is concentrated in a small high‐income market segment.
c. Lower‐income households’ informal income is normally transacted in cash and hence invisible to formal‐banking underwriting.
7. Microfinance for housing could improve access to quality housing for some low‐income groups
because it is suited for informal housing consumption a. The microfinance sector in SSA is well‐established. b. Middle‐ and some low‐income groups are able to access credit through microfinance
institutions (MFIs) and savings groups c. The housing microfinance sector is small but growing, and MFIs show interest in housing
microfinance.
8. Remittances could have a substantial impact on housing by enhancing household budgets a. SSA receives some US$40 billion from both international (foreign‐to‐domestic) and intra‐
national (urban‐to‐rural) remittances. b. Additional research on the impact of remittances on housing is needed to provide a more
coherent policy direction. Based on the analysis of these characteristics of the housing sector and their underlying dynamics, the report highlights interventions that can support housing delivery by improving the quality of housing delivered through informal means, as well as broadening the reach of the formal housing sector. The analysis demonstrates how informal housing, including slums, can be incrementally improved through supply‐side interventions such as targeted infrastructure provision, enhanced land administration and urban planning systems, along with demand‐side interventions including access to non‐mortgage sources of housing finance for the urban poor. It also identifies pathways to enhancing the role of both commercial banks and non‐bank financial institutions in developing credit instruments for consumer and developer use, which can increase the supply and affordability of formal housing for ownership or rental.
The lack of housing sector data in many countries is a significant challenge to developing appropriate housing policies. Information on housing quality, prices, tenure types, land ownership and property transactions are critical for the development of housing policies or subsidies directed at populations in need of better housing. These data are also useful for the private sector, as banks and lenders can better assess terms for loans and mortgages and developers can more easily assess real estate market trends for housing investment. The value chain analysis in this report also provides a first step for governments to further examine key “links” in the supply and demand chains for housing. An important intervention for countries in the region would be an in‐depth value chain analysis of the housing sector, in order to identify key constraints and bottlenecks for quality housing provision along with the appropriate role of local and national governments in setting a reform agenda.

Stocktaking of the Housing Sector in Sub-Saharan Africa
6
2. Overview: Urbanization and the Housing Sector
A. Background and Justification
Taking stock of the housing sector is a clear and urgent priority in Sub-Saharan Africa. As Africa’s urban transformation continues and the size of the urban population in African countries increases, the availability of quality housing and the buildup of a functional housing sector become key priorities to create functional and livable cities, and to support national economic growth and job creation. The Sustainable Development Goal 11 on sustainable cities sets clear targets for the importance of housing (by 2030, Governments commit to ensure access for all to adequate, safe and affordable housing and basic services and upgrade slums). This report addresses these issues by enhancing evidence‐based knowledge of the housing sector and expanding understanding of the relative importance of determinants for supply and demand of affordable housing in Sub‐Saharan Africa. It seeks to address the knowledge gap on what influences housing supply and demand in Sub‐Saharan Africa, and to provide a foundation for policy decisions, at the country level and at a broader regional level. By capturing the key challenges of the region’s housing delivery system along the formal and informal supply and demand‐side value chains,2 this report enables national governments and the World Bank to make better policy decisions that impact the functioning of the entire housing sector from both the supply and demand sides, rather than aiming interventions at disparate parts of a whole.
This report reviews current secondary sources to provide an overview of the main trends related to housing affordability in SSA. Insights on the macro‐regional context were combined with per‐country findings. Observations were organized along the supply and demand value chain framework, then extrapolated into key trends covering government policy and supply and demand challenges for the sector from which the report develops general policy principles. A team of specialists with extensive experience with housing and development in Africa was involved in data collection, content generation and analysis, and commentary. This regional report draws on data from the three country case studies and extrapolates these findings where the country reports showed strong consensus and where that consensus also matched with similar trends observed in other relevant Sub‐Saharan African countries.
There are overarching trends that create impediments to a fully functional housing sector. Although the housing sector in Africa is highly heterogeneous with substantial differences in housing stocks, and supply and access to housing finance between countries, there are some consistent patterns that impede a fully functioning housing sector. These trends include: (1) limited availability of affordable formal housing options and largely ineffective public housing schemes; (2) limited access to housing finance; (3) complex land markets; (4) large informal markets; (5) a disconnect between spatial planning in urban areas and housing policy; and (6) tension among policies targeted at various income levels, especially middle‐ and lower‐income groups. The report provides an overview of the main trends that are recurrent in the three case studies as a well as documented in the literature on other countries in the region.
The general trend that emerges in cities across the region is a relationship between growing urbanization with comparatively low household incomes on the one hand, and a poorly functioning housing sector (composed of land markets, access to housing finance and the strength of construction and development industries) on the other. These two factors combine to limit access to formal housing both on the supply and demand sides and also encourage the development of slums out of informal settlements. Housing affordability will improve not only with general economic expansion and income growth, but also with

Stocktaking of the Housing Sector in Sub-Saharan Africa
7
housing policy that both supports the incremental improvement of informal housing conditions for the majority of people and improves the function of the housing sector to bring down costs and extend the reach of the formal housing sector to include lower income groups.
All of these findings, which are amply supported by the data and discussed in more detail in the discussion of supply and demand side issues, are themselves symptomatic of the deeper challenges: value chains that function poorly because they have not been the focus of either appropriate study or targeted government actions to address market gaps and correct market failures. Hence, the housing delivery and finance processes were carefully mapped across both the formal and informal domains. The report proceeds by reviewing the importance of housing as a vehicle for economic growth and urban inclusion and then outlines the data collection method and analytical framework employed. The findings of the report are divided into supply and demand side factors that drive the high overall cost of formal housing and which also encourage the informal provision of housing. A concluding section summarizes the main findings and provides suggestions for the way forward for SSA countries to improve the quality and affordability the housing sector as a whole, including both formal and informal channels.
B. Toward the Twin Goals: The Importance of Housing for
Inclusive Growth
Africa is rapidly urbanizing from a low base. According to the United Nations, nearly all urban population growth through 2050 will take place in developing countries (UN 2015). Africa is no exception and Africa’s total share of the world’s urban population will nearly double from 11.3 percent in 2010 to 20.2 percent in 2050. Currently, one fourth of the world’s 100 fastest growing cities are in Africa, where there are now 52 cities with greater than one million residents (UN Habitat 2014). Sub‐Saharan African cities gain about a million new urban dwellers every year and the region is on pace to match the level of 70 percent urbanization in Europe and North America (UN 2015).
Figure 1. Urban Population as Percent of Total in Selected SSA Countries
Source: World Bank 2013e.
0
10
20
30
40
50
60
70
80
90
100
Angola
Benin
Botswana
Burkina Faso
Burundi
Cabo Verde
Cam
eroon
Central African
Rep.
Chad
Comoros
Congo, D
em. R
ep.
Congo, R
ep.
Cote d'Ivoire
Equatorial Guinea
Eritrea
Ethiopia
Gabon
Gam
bia, The
Ghana
Guinea
Guinea‐Bissau
Ken
ya
Lesotho
Liberia
Madagascar
Malaw
i
Mali
Mauritania
Mauritius
Mozambique
Nam
ibia
Niger
Nigeria
Rwanda
Sao Tome & Principe
Senegal
Seychelles
Sierra Leo
ne
Somalia
South Africa
South Sudan
Sudan
Swaziland
Tanzania
Togo
Uganda
Zambia
ZimbabweUrban
population (% of total)

Stocktaking of the Housing Sector in Sub-Saharan Africa
8
Africa will be the last region to urbanize, though this transition will involve a massive demographic shift. By 2050, Africa is projected to reach 1.2 billion urban dwellers, an urbanization level of 58 percent and an average density of 79 persons per square kilometer.3 Within the next two decades, the continent’s total population is projected to overtake Europe, South America, and North America’s combined. With over a quarter of the world’s fastest growing cities, Africa is undergoing a massive urban transition rivaled only by that of Asia, although the nature and pace of urbanization varies widely among countries (Figure 2).4 Though Asia is currently ahead, Africa is expected to undergo the most rapid urbanization in the world from 2020 to 2050. Nigeria, in particular, is projected to contribute 8 percent of the world’s population growth by 2050 (212 million out of 2.5 billion). Democratic Republic of the Congo, Ethiopia, and Tanzania will each grow by 50 million people. While Cairo, Kinshasa, and Lagos are the only African megacities in 2014, Dar es Salaam, Johannesburg, and Luanda will follow suit by 2030.5
Figure 2. Average Annual Rate of Change of Percentage Urban by Regions
Source: UN 2014.
Most of the new urban growth in African cities will occur in slums. Slums are characterized by housing units with five main deficiencies: 1) no improved water source; 2) a lack of improved sanitation; 3) impermanent or unsound physical structure; 4) insufficient living space and incidence of overcrowding; and 5) no claim to secure tenure. The UN estimates more than 200 million people in the region will live in slums by 2020 (UN‐Habitat 2014). Slum populations are growing at 4.5 percent annually, a rate which will double the population in 15 years (Marx et al. 2013). After this period, the majority of the world’s slum dwellers will live in African cities; currently every other region is experiencing a rapid decline in the prevalence of slums (See Figure 3 below). The expansion of slums in Africa will be driven by migration and population growth, which will drive housing need, and the current lack of infrastructure for both the existing and anticipated future housing stock.
Global experience shows that urban areas are major drivers of economic growth. People migrate to cities in search of economic opportunity and cities attract firms and investment because of the concentration of a diverse labor pool. In SSA, cities have been the predominant hubs of informal and formal economic activity; two sectors—construction and natural resource extraction and related services ‐ accounted for 60 percent of regional economic growth during the 1990s (Kessides 2005). Urbanization

Stocktaking of the Housing Sector in Sub-Saharan Africa
9
and per capita income growth tend to happen concurrently, though in Sub‐Saharan Africa incomes have not kept pace (Clarke Annez and Buckley 2009; Fay and Opal 2000). This is because urbanization in many African countries has not been accompanied by industrial growth, but from “push” factors such as poor yields from agriculture (Barrios et al. 2006). Due to this, urban migrants tend to be poor and have few prospects for improving their incomes. The challenge for cities in the region is to unlock and extend the benefits of urbanization in spite of low per‐capita income growth.
Figure 3. Number of People Living in Slums—by Region
Source: UN 2014.
The housing sector constitutes an important component of national economic growth. Housing stocks, along with investment and employment in related construction and finance industries, constitute a major component of national economic wealth. Figure 4 shows housing investment and per‐capita GDP using national accounts data, with SSA countries shown as points. The figure shows that across the world, housing investment and GDP follow an S‐shaped curve (shown by the blue line) with a slope that rises between income levels of US$3,000 and US$36,000 (Dasgupta et al. 2014). Where income levels are outside of this range, investment levels even out as spending on housing competes with other needs. Most countries in Sub‐Saharan Africa are below the US$3,000 per‐capita GDP threshold and have yet to approach the inflection point where higher levels of investment in housing is likely to begin. Finally, the authors find that the main sources of housing investment in the region derive from household savings (which tends to be small) and government spending, not capital markets, which are a key sources of liquidity and longer term finance for lending institutions and in turn are an important component of housing sector performance.
The quality and location of housing has long term consequences for inclusive growth. For most households, purchasing or building a house is the single largest expenditure they will ever make. A home is also an investment vehicle which can appreciate in value over time, be used for collateral for borrowing and through inheritance can be an important component of intergenerational wealth transfer. Where housing is located in proximity to schools, jobs and transit access directly impact the quality of urban life and prospects for social mobility (World Bank 2013f).
0
50
100
150
200
250
300
1990 1995 2000 2005 2010 2015 2020 2025 2030
Millions
Sub‐Saharan Africa Middle East & North Africa
Latin America & Caribbean South Asia
East Asia & Pacific Europe & Central Asia

Stocktaking of the Housing Sector in Sub-Saharan Africa
10
Figure 4. Housing Investment and Per-capita Income, SSA (2011) and the World (1960-2011)
Source: Calculations from World Bank data. Note: Curve line drawn from all available data 1960‐2011.
Urban housing tends to be least expensive when it is located in undesirable areas and is of poor construction quality, often on the fringes where land is not expensive to purchase or occupation will go unnoticed by land owners. While housing options in these areas may be affordable to the urban poor, the additional burdens imposed by long commute times, public health problems from inadequate water and sanitation and the lack of education and health services represent substantial indirect costs.
C. Differentiating Formal and Informal Housing
Formal housing is the product of specialized supply and demand-side value chains. Housing ‘formality’ typically means a home that (i) has valid legal title, (ii) is structurally sound and comports with local building codes, and (iii) can be pledged as collateral for a long‐term mortgage loan. Informality consists of deviations from these standards. The definition of formality describes the housing sector in developed economies, but it refers to a very small if incomplete segment of the housing sector in developing countries, particularly in Sub‐Saharan Africa. Formal housing units are the product of coordination between public and private sector activities in land, construction, finance, and regulation. These two value chains form the backbone of a country’s housing delivery system, a complex construct of private finance and construction entities, ideas, capital flows, and government regulatory, investment and administrative institutions that are involved in housing within the country. The strong housing delivery systems that now exist in developed nations have taken more than a century to evolve and build. The key features for the supply and demand side value chains are shown in Box 1 below.

Stocktaking of the Housing Sector in Sub-Saharan Africa
11
Box 1. Elements of a Strong Formal Housing System
Supply Side 1. Land titling systems that are buttressed by title insurance or its financial equivalent. 2. Land recording and transfer systems that enable quick, inexpensive, title searches and updates. 3. Zoning and rezoning, especially with respect to use (e.g. agriculture to urban). 4. Efficient judicial systems to resolve land‐ownership and land‐use disputes. 5. Active land markets with adequate supply, rather than land sequestration that prevents development. 6. Trunk infrastructure grids that either reach developable land or can be extended to growing areas. 7. Builders and developers who can regularly deliver homes at fixed prices. Demand side 1. Macroeconomic or monetary policy that allows stable or slow‐evolving interest rates and means of
mitigating householders’ exogenous risks (e.g. hyperinflation, interest‐rate spikes). 2. Primary Mortgage Institutions (PMIs) that can originate standardized, performing portfolios of loans. 3. Mortgage originators to take applications and handle credit procedures consistent with PMI requirements. 4. Secondary‐mortgage‐market liquidity to enable primary mortgage institutions (PMIs) to remain active. 5. Mortgage law that is clear and well settled. 6. A large population of salaried workers where even below‐median workers have a formal job and pay slip. 7. Reliable foreclosure‐enforcement by local officials.
Source: World Bank data.
However, most housing in SSA is produced and consumed through informal channels. UN‐Habitat suggests the self‐build model is “perhaps the only housing approach common to all African countries that is affordable at the household level.”6 Informal channels are the dominant housing delivery system across the region, contributing perhaps 75 percent of the total housing stock. Similarly, the case studies find that the informal sector supplies well over the majority of demand in Nigeria (80 percent), Ghana (90 percent)7 urban Ethiopia (65 percent), urban Senegal (80 percent), Zambia (80 percent)8 and Cameroon (97 percent).9 10 Most of the housing stock in South Sudan, Togo, Swaziland, Namibia, Zambia, Senegal, Seychelles, Malawi, Lesotho, Gambia, and Burundi, among others, is self‐built. 11In other countries, all affordable housing is produced informally such as in Malawi12 and Liberia. Box 2 identifies common features of housing informality.
Box 2. Characteristics of Informal Housing
Housing is informal if it does not conform to the laws and regulatory frameworks that govern land and buildings (UN‐Habitat, 2003). Within this definition, there are a range of different tenure and building quality situations. In SSA, informal housing has one or more of the following characteristics:
Located at the urban periphery or within the interstices of the formal city.
Self‐designed and self‐built with local materials.
Does not fully conform to building and land use standards.
Poorly serviced by network infrastructure and public services.
Financed out of family/group savings or loans from informal lenders.
Incrementally improved by the occupant over a long period of time.
Informality covers a series of other variables that are best described across a graduated continuum. For example, some housing is physically as durable as anything formal though simply may not have required permits or inspections; at the other end of the spectrum, some housing is made of scavenged and impermanent materials.

Stocktaking of the Housing Sector in Sub-Saharan Africa
12
Informal housing represents a spectrum of different shelter locations, conditions and tenure statuses. Informal housing is not necessarily equal to slum housing conditions. Rather, informality represents a continuum of housing, ranging from units without access to any improved infrastructure, absent compliance with building standards and lacking land tenure to units with sequentially greater levels of permanence, security and quality. While the precise degree and cost requirements of housing standards have long been debated (Payne 2001; Cohen 2007), the definition of informality allows for wide variation in the type and quality of housing (see Figure 5 below). Indeed, global experience suggests that it is common for informal housing conditions to improve incrementally over time through infrastructure upgrading, self‐built construction, and tenure claim recognition (Majale and Payne 2004; Payne 2005; Choguill 1999).
Figure 5. A Continuum of Informality in Housing
Source: World Bank data.
The prevalence of housing informality is linked to conditions of poverty. Housing informality is the result of both economic factors that limit household and commercial investment in housing, as well as legal, institutional and market factors that limit the production of quality housing units at a scale to meet need. Unlike in developed economies, where formality is the norm both in supply (e.g. home construction) and demand (e.g. mortgage loans for home purchase), within Sub‐Saharan Africa, the formal housing sector represents a very small portion of housing production and consumption because of a mismatch in the cost of a quality housing unit and households’ abilities to pay for it. Rather, housing needs for the vast majority of people are met through informal channels, where the quality of units may vary widely. The key housing challenge is not an absolute lack of housing, but instead a very limited provision of quality housing within the continuum of informality.
The ubiquity of informal housing conditions are a result of both low per capita incomes and barriers that raise the cost of building and consuming housing. These barriers include weak land titling systems, unreliable and incomplete infrastructure grids, and limits to capital markets for providing sources of consumer and developer finance. In addition to low per capita income and low household spending on housing, these factors both constrain the expansion of the formal housing sector and sustain the informal delivery of housing as a less expensive alternative. This report demonstrates that in SSA (1) housing informality is normal, while formality is the exception, and (2) quantitative information with respect to informality is scarce and non‐standardized.13 These two factors make it difficult to estimate and compare the size and dynamics of housing markets and dimensions of affordability across the region.

Stocktaking of the Housing Sector in Sub-Saharan Africa
13
The delivery of informal housing occurs through an alternative value chain. This report will demonstrate how informal housing represents a least‐cost option for the urban poor. Box 3 below provides an example of informal housing provision that is typical across the region. However, while informal housing may be the lowest cost option, there may be important cumulative and long‐term negative impacts to both the quality of life of the urban poor and the contributions of housing to the domestic economy. For example, informal settlements located in areas prone to natural disasters, such as floods, landslides and erosion, increase present chronic dangers to residents and high costs to governments to effectively mitigate these risks. Informal settlements lacking access to infrastructure or opting for less efficient substitutes (e.g. shared power connections, unimproved wells, water trucks, and pit latrines) may pose greater public health risks due to infectious disease transmission as well as a greater vulnerability to fires. Insecurity of land tenure and the lack of long term sources of finance limit the ability of lending institutions to collateralize property for mortgage or developer finance. Instead, households rely on personal savings or informal lending for housing construction. This makes housing finance a very small sector of domestic economies compared to other countries with more expansive banking and credit systems. It requires support and participation of the public and private sectors in order to both expand access to housing and living conditions in informal settlements.
Box 3. Informal Home Construction Process in Sub Saharan Africa
Informal dwellings tend to be constructed along a similar general process across SSA countries. The process proceeds as follows: 1) A household begins to collect materials and look for a piece of land which may be available in fairly consistent‐sized plots; 2) a customary authority, private owner or government owner is approached for a lease on the land; 3) a sale is made and a written agreement is issued; 4) the prospective owner then finds a building contractor, usually a mason or bricklayer who forms the core of a loose group of artisans who work together.
The prospective homeowner and contractor discuss the size and type of building, compared against similar units. The cost usually includes only labor and quite often depends on what the contractor thinks the owner can afford rather than the strict cost of the work. The prospective owner is expected to provide all the materials or pay for the builder to access them and bring them to the site. Some contractors possess no capital and must ask the owner to pay for all materials and wages throughout the process. The dwelling is constructed to the roughly agreed design as the materials come available.
When the flow of materials stops due to a lack of financing, the contractor goes onto another job. As construction proceeds, the owner must also apply for infrastructure hook‐ups and provide the money to pay for them. Friends, relatives and employers may provide some capital, as bank loans or mortgages are largely absent.
Incremental construction occurs vertically, which involves the construction of the whole house from the ground up in several stages: foundations, walls, roof and finishing. Many months or years may pass between each stage as money and materials are collected. Occupation tends to occur at the end of a very long period, although caretakers may occupy the unfinished house. It may also happen “horizontally,” where construction occurs outward over many years upon the completion of an initial room or living space. Occupation tends to start very early on as soon as the first rooms are ready.
Sources: Tipple et al., 1999; UN‐Habitat 2011a, 2011b; 2012.

Stocktaking of the Housing Sector in Sub-Saharan Africa
14
Source: World Bank data.
D. Analytical Framework and Data Collection
This report analyzes the region’s formal and informal housing sectors along supply- and demand-side value chains. As a basis for comparison, Figure 6 shows the supply and demand side value chains for the delivery of formal housing. On the supply side, inputs such as land, infrastructure, design and construction proceed in parallel with a corresponding set of demand side inputs related to housing finance. The supply side assumes that land and property markets are active and widespread, that legal claims to property are clear and enforceable and price information is widely known. Further, it also requires that a reasonable set of construction, planning and infrastructure standards are supported by governments and to which
Figure 6. Formal Supply and Demand Side Value Chains for Housing Delivery

Stocktaking of the Housing Sector in Sub-Saharan Africa
15
private development activity conforms. Construction firms must also have access to large amounts of capital in order to complete housing projects and sell them to consumers via mortgage products. In order for banks to create mortgage tools, they have to obtain savings deposits and other sources of capital that can be used to create long‐term debt instruments. A formal housing delivery system is complex and requires an integrated sequence of inputs (e.g. land, materials, infrastructure) along with regulatory, institutional and financial capacities to support them.
Each value chain must be clearly mapped and understood in order to clarify the basis for policy intervention. In between the two end points shown in Figure 6 is a complicated, interconnected series of markets, capital and resource movements that enable an effective formal housing delivery system. For the housing delivery value chain to be successful and efficient, the flows of capital and resource investments must be well‐timed, appropriate for specific links in the chain and sequential to one another. Supply side and demand side do not advance in lockstep, so it is useful to identify which roles should be filled during which period of time in the delivery process. In the context of Sub‐Saharan Africa, many of these links are incomplete or are available to a very small market segment. By contrast, the informal housing delivery system is a response to the absence or incompleteness of these elements. However, the formal housing delivery system outlined above is not necessarily the only way to provide access to quality housing. Rather, there are a number of alternative financing methods, infrastructure improvement approaches and tenure arrangements (such as renting) that can provide quality housing options for low‐income groups.
Comparing formal and informal value chains will identify areas for policy attention to improve the function and overall affordability of the housing sector. The informal housing sector has a separate, but parallel value chain system. However, in many areas, this value chain cannot adequately provide quality housing for the urban poor. For example, a self‐built house represents a household’s adaptation to the cost and availability of materials, construction design and the cost of complying with or avoiding formal building standards. The purpose of the value chain approach is to map out the main constraints for supply and demand that impact the housing sector’s contributions to domestic economies and its power to provide affordable housing at scale This report compares formal and informal sectors to identify systemic gaps or blockages in value chains, develop cross‐country comparisons, and to illuminate important functional processes within the housing value chains that are often overlooked, especially within the informal system.
Table 1 compares a formal housing delivery system typically found in developed economies with common conditions found across SSA. The table previews the key findings and discussion in sections 3‐5 by showing how supply and demand side factors in the region contrast starkly with formal housing delivery factors. For illustrative purposes, the tables below present schematics of the formal and informal value chains for both the supply side and the demand side. The report finds that informal issues affecting land supply (such as alternative tenure systems and property rights that are poorly defined and protected) are common across the region. It should be noted that in many places, informality is not confined to the urban poor, and a range of income levels can be served by the informal housing market.

Stocktaking of the Housing Sector in Sub-Saharan Africa
16
Table 1. Comparative Summary of Housing Delivery Conditions in SSA
Housing Delivery Component Formal context example Informal - Common SSA condition
Supply
Land Tenure and Administration
Freehold or leasehold title; title or deed registry
Competing tenure systems and or absence of title: squatting, land invasions, illicit subdivision and sales
Planning Standards and Regulations
Compliance with FAR, site setbacks, building codes
Variation in site density, design and lot coverage
Construction sector Sector with professional, licensed workers
Self-built, or use of informal unlicensed laborers
Building Materials Mass produced materials with standardized quality
Variation in type and quality of materials: Scavenged items, traditional manufacturing techniques, some use of manufactured materials where they can be obtained
Infrastructure Trunk line utility connections No trunk lines: illegal wiring, pit latrines, household cisterns
Demand
Formal savings accounts Savings account deposits used for mortgage lending
Little formal savings: Reduces capital available for lending to consumers or developers
Underwriting and verification Assessment of income and creditworthiness to create mortgage terms
Lack of formal income and land collateral: Reduces eligibility for housing subsidy programs, raises risks profile for commercial mortgage lending
Mortgage loans Long term loan for obtaining complete, titled house
Few mortgages: Most households use personal savings, microcredit, savings groups and other non‐commercial sources
Source: World Bank data.
The value chains that support the production and consumption of formal housing in SSA are weak and oriented toward high-income groups. Formal housing provision assumes specific conditions in the formal sector chain and requires both sources of private capital and deep public sector attention to infrastructure‐appropriate regulations and standards. The formal system only operates effectively at scale if all of these elements are adequately populated and effective. Yet, in emerging countries generally, and Sub‐Saharan Africa in particular, the public and large‐scale elements (e.g. infrastructure and capital markets) are not keeping up with the private and small‐scale activity of millions of Africans swelling the region’s cities. As a result, housing provision for the majority of urban residents occurs through informal channels as described in Table 1.
The size and function of informal housing delivery is difficult to quantify. By its nature, the informality of housing delivery is non‐compliant with the formal regulatory and administrative structures, and in many aspects, informal economic and social systems operate with indifference to the formal system. There are several reasons for this, the most important of which is that formal structures impose additional costs (taxes, regulations, prohibitions) on housing in ways that appear greater than the immediate benefits they seem to confer (safety, ability to finance, political voice). Low‐income households may have neither the resources nor the awareness to satisfy these additional requirements. Governments may also lack the capacity to effectively or broadly enforce these standards. Thus, informal delivery networks are not well recorded; they are personal, cash‐based, transitory, and conducted in private.
Stocktaking of the Housing Sector in Sub-Saharan Africa
17
Data on the informal housing sector in Africa is scarce. This is both a constraint to the study and also illustrative of a key challenge that currently limits affordable housing policy interventions in the region. Existing literature documents settlement conditions that vary greatly within countries, across countries and over time.14 This precludes a broad and representative assessment of affordability conditions within the region for several reasons. First, studies with quantitative data useful for affordability analyses are small and difficult to aggregate in a meaningful way to reflect country or regional market conditions. Second, the data collection procedures for studies vary widely, which reduces the reliability of the data and its usefulness for generalizing conclusions.15 Finally, most base‐of‐the‐pyramid analyses that are used to develop affordability analyses tend to draw heavily on case study formats, which by nature are context‐specific and make limited use of quantitative data (Pralahad 2004; World Resources Institute 2007).
These fundamental data constraints limit the representativeness of a number of the findings from particular countries. However, the report identifies patterns of continuity across the region that permit general assessments and some initial policy directions based on differences in per capita income and urbanization across countries in the region. The report finds that the informal sector acts as the key means of both housing delivery and finance in Sub‐Saharan Africa. Given better availability of data, policy makers would have evidence of its importance in job creation, finance mobilization, and housing development, and therefore the informal sector would attract more resources and future investments in housing, and infrastructure upgrading would have greater impact in reducing poverty.
Governments and other decision-makers in Sub-Saharan Africa should be equipped with a comprehensive understanding of the housing sector in the region and in their individual countries. However, this regional report demonstrates that the informal sector is grossly under‐studied and that available published information is inadequate given the importance of having better evidentiary bases for recommendations. Necessary data is very limited for most countries and only includes the most basic indicators such as rooms occupied and services available and is undifferentiated between formal and informal sectors. The following section collates the data that is available in the general literature and, through primary research in Nigeria, Cameroon, and Ethiopia, to describe the fundamental challenges and trends of the housing systems in SSA.
Improving the scope of access to affordable housing requires identifying how informality can be changed over time. This means that policy initiatives must act with both a long term and short term view; long term toward a vision of the end state, and short term so that each incremental initiative is sound both for the long term vision (i.e. enabling further innovations and buildup) and in the local political economy (i.e. aligning with local interests, priorities and capacities). The best avenue to improving access to quality housing in Sub‐Saharan Africa is through addressing improvements in value‐chain systems by degrees and steps. Incremental improvements for the informal sector will reduce their distance from total formality according to different sections of value chains.16 If the housing challenge is to be effectively addressed by increasing the stock of decent, affordable housing, the role of the informal sector must be effectively recognized, in its multiple facets, in both the supply side value chain and demand side value chains.17

Stocktaking of the Housing Sector in Sub-Saharan Africa
18
3. Housing in SSA: Overall Features and Trends
While it is well known that most housing in urban Africa is generally informal and in some cases overcrowded and of poor quality, the actual estimations of the existing stock of housing, the future demand, and the overall quality of existing stock (both informal and formal) are complex and difficult to undertake. A recent World Bank study suggests that over the last decade, housing shortages have not improved significantly over time, and even worsened for some countries. Notably, Senegal experienced a 102.4 percent increase in its shelter shortage for a total of 66.9 percent of households in need by 2005 (Lozano‐Gracia and Young 2014).18 Overall, however, housing shortage estimates lack consistency and reliability. Estimates vary significantly from country to country and even within countries. No widely‐accepted methodology is currently in use in the region. Censuses often omit the sort of data required for housing need calculations, such as the number of persons per room.19 Other censuses, such as Lesotho’s for example, do not provide data on the number of urban dwellings at all.20 Without adequate data on households and dwellings, identifying the quality or quantity of housing deficits (formal and informal) is exceedingly difficult and well‐informed policies cannot be adequately developed to prioritize interventions to address these deficits.21
Box 4. Difficulties in Estimating Housing Need: The Case of Ghana
Ghana exemplifies the difficulty of developing reliable estimates of housing need. First, the country’s 1987 Housing Policy included a calculation of housing need to meet an occupancy standard of seven people per unit on the grounds that average household size was seven. However, the actual mean household size was actually 4.75 because houses varied from one room to 50 or more, and people occupied a few rooms within them.a
In fact, UN‐HABITAT’s “Ghana Housing Profile” identified eight separate estimates of housing deficit and annual need in Ghana by various actors, with deficit calculations ranging from 250,000 to 1.5 million and annual need calculations ranging from 70,000 to 133,000.b This range makes the development of any subsidies to increase the supply of housing very difficult to determine or justify because of the huge gap in estimates. This inconsistency arises partly from the issue of defining the terms “household” and “dwelling.” There is no word for “dwelling” or “household” in several of the major African languages,c and census definitions are sometimes poorly framed. The definition of a dwelling in Ghana specifies that it is the space occupied by one household, but a statistic in the same document reports that there are, in fact, 1.7 households per dwelling.
The highest housing deficit calculation in the report, 1.5 million, comes from the Bank of Ghana and is derived from the argument that 8.7 persons per household represents overcrowding and that housing need should be calculated towards the ideal of one household per dwelling.d On the other hand, a mean room occupancy of 3+ people is a long‐standing characteristic of urban housing in Ghana, and most households share services or use public ones.
The Ghana case demonstrates that without appropriate definitions of occupancy and dwelling, efforts to estimate housing need may be systematically biased and provide little guidance for policy makers.
Sources: a. UN Habitat, 2011a. b. UN Habitat, 2011a. c. Tipple et al. 1994. d. UN Habitat, 2011a.
The prevalence of informal housing makes it difficult to determine current and future housing need. In general, housing shortfalls can be calculated based on three different qualities: i) the numerical shortfall in dwellings (deficit); ii) the qualitative shortfall in physical conditions (obsolescence); and iii) the space

Stocktaking of the Housing Sector in Sub-Saharan Africa
19
shortfall within dwellings (overcrowding). Under this approach, total housing stock is an aggregate of different shelter types (new units and existing units) and tenure arrangements (rental vs. ownership for example). Gaps in housing need should be seen as an adjustment to the overall stock, whether in terms of upgrading existing units to some acceptable standard, filtering of older units down market or the addition of new units (Angel 2000). This multi‐faceted understanding of housing shortfall underlies the basic methodology used in many of the UN‐Habitat Housing Profiles:
The difficulty in assessing future need lies in determining standard, objective definitions and values for each of the input variables. Some complexities that must be clarified include:
What does the number of available dwellings encompass? Formal and informal, or just formal?
What should the standard threshold for overcrowding and renovation be?
Some countries count only formal units as legitimate housing stock. South Africa, for example, officially defines its backlog as 2.1 million units, reflecting 1.1 million units in informal settlements and 1 million with inadequate or overcrowded conditions.22 For Malawi, UN‐HABITAT calculates the housing shortage as including the qualitative shortfall under two scenarios: one where semi‐permanent housing must be renewed every 10 years and the other every 25 years.23
The lack of agreement on standards and the dearth of country level data makes the estimation of quantitative deficits difficult. Quantitative housing deficits are calculated based on estimating annual household formation rates and estimating the need for new units based on an overcrowding threshold. Figure 7 below provides a simple estimate of the current cost of providing the lowest cost market rate unit for select countries from 2015‐2030.24 The figure demonstrates that the cost of the direct provision of new housing units would be prohibitively costly to governments and far beyond the current scope of the formal housing sector. Furthermore, this approach ignores the contribution of the existing housing stock to shelter needs, particularly how incremental improvements and infrastructure upgrades could provide a more cost‐efficient and market‐responsive approach to accommodating urban population growth.
Estimates also may not consider common living arrangements or measures of affordability. In countries where the majority of the population lives in multifamily units (about 60 percent in Ghana,25 46 percent in Ethiopia26), rooms, rather than dwelling units, may be a better assessment of need because the latter is usually converted into policy as single household dwellings on plots. Rental housing is often a form of occupancy (not a type of shelter) dispersed across owner‐occupied homes (e.g. complexes, public housing schemes, private subdivisions, within slums and informal settlements, etc.). Rental housing is dispersed across the city and caters to residents of all incomes landlords and tenants may have similar incomes and live close to each other.27 Second, many housing statistics only refer to the number of dwellings or rooms without qualifying them based on their affordability. Housing need in SSA is, in fact, much greater when affordability is taken into account, as most formal housing lies beyond the reach of the target population.28

Stocktaking of the Housing Sector in Sub-Saharan Africa
20
Figure 7. Simulated Cost to Provide Formal Housing Units for Selected Countries, 2015-2030
Source: Calculations based on population data from UN 2014, GDP data from World Bank 2014c.
Table 2 shows the latest available housing shortage estimates for selected SSA countries, but the assumptions and data used for these estimates are incomplete. First, there is limited data quantifying the supply of housing already supplied informally, whether through self‐built housing, rental or rent free arrangements. Nor is it clear how much this housing stock contributes to overcrowding or what proportion lies outside reasonable safety standards. Indeed, it is likely larger in scale than the numbers below depict.
0% 100% 200% 300% 400% 500%
Zimbabwe
Zambia
Uganda
Tunisia
Togo
Tanzania
Swaziland
South Sudan
South Africa
Seychelles
Senegal
Nigeria
Niger
Namibia
Mozambique
Morocco
Mali
Libya
Lesotho
Kenya
Ghana
Egypt
Djibouti
Central African Rep.
Cameroon
Burundi
Burkina Faso
Botswana
Benin
Angola
Algeria
As a percent of GDP (2014)

Stocktaking of the Housing Sector in Sub-Saharan Africa
21
Table 2. Recent Housing Shortage Estimates of Selected SSA Countries, 2013
Source: CAHF 2013.
Assessing the current housing stock in terms of quality reveals broad differences in the nature of housing challenges faced by different countries in the region. A 2005 (UN‐Habitat 2008) survey of housing quality in Africa classified housing quality in terms of deprivations associated with slums (lack of durable housing, improved water and sanitation, tenure security and adequate living space). Figure 8 below shows the portion of total housing stock for select countries in the region divided according to deprivation type. It shows, for example that the housing stocks of Sierra Leone and Sudan have at least one or more conditions associated with slums, nearly half of the housing stock of Sierra Leone (47.2 percent) has just one deprivation, while by contrast in Sudan, about 67 percent of housing units have at least two or three deprivations. In Ghana for example, 96.7 percent of households have access to a durable shelter, but only 83 percent have access to improved water and 76 percent have improved sanitation (UN‐Habitat 2008). The findings suggest that the quality of the existing housing stock in a number of countries can be improved rapidly with targeted interventions to improve particular areas of deficiency.29
CountryTotal Housing
Shortage
Annual Additional
Housing ShortageProjection notes
Angola 2,000,000 ‐‐
Cote d’Ivoire 600,000 ‐‐
Ethiopia 1,000,000 ‐‐Additional 225,000
backlog/year
Ghana 1,600,000 ‐‐ 5.7 million short by 2020
Madagascar 2,000,000 ‐‐Additional 100,000
backlog/year
Namibia 100,000 ‐‐
Nigeria 17,000,000 ‐‐
Senegal 200,000 ‐‐ Annual increase 10%
South Africa 2,100,000 ‐‐
Tanzania 3,000,000 ‐‐
Uganda 560,000 – 1,600,000 ‐‐
Backlog – 8,000,000 by
2020 if no
countermeasures
Zambia 1,300,000 ‐‐ ‐‐
Zimbabwe 1,250,000 ‐‐ ‐‐
Burundi ‐‐ 20,000 ‐‐
Cameroon ‐‐ 100,000 ‐‐
Djibouti ‐‐ 2,500 – 3,500 ‐‐
Kenya ‐‐ 150,000 ‐‐
Niger ‐‐ 40,000 ‐‐
Rwanda ‐‐ 34,000 Backlog by 2022: 458,265

Stocktaking of the Housing Sector in Sub-Saharan Africa
22
Figure 8. Distribution of Urban Population by Shelter Deprivation (2005)
Source: UN‐Habitat 2008.
Sub-Saharan Africa faces a chronic housing challenge that goes beyond deficits in the formal housing supply. As evidenced earlier, the future of housing formation in Africa remains informal. The rapid population growth coupled with the urban transition will continue to increase the demand for housing in SSA. With urbanization taking place at a relative low level, this will occur mainly in the informal lower spectrum of the market. The existing available data does not provide policy makers with sufficiently detailed information about the distribution of existing stock and conditions, level of occupancy and overcrowding, and future housing demand along the continuum from formal to the various tiers of informal housing, including slums.
0 20 40 60 80 100
Sierra Leone
Sudan
Central African Rep.
Chad
Angola
Guinea‐Bissau
Niger
Ethiopia
Madagascar
Mozambique
Dem. Rep. Congo
Benin
Comoros
Uganda
Malawi
Tanzania
Equatorial Guinea
Mali
Nigeria
Burundi
Togo
Burkina Faso
Zambia
Côte d'Ivoire
Kenya
Congo
Cameroon
Guinea
Gambia
Ghana
Swaziland
Gabon
Senegal
Lesotho
Namibia
South Africa
Zimbabwe
Egypt
Morocco
One Two Three Four

Stocktaking of the Housing Sector in Sub-Saharan Africa
23
A. The Affordability Gap
Low per-capita incomes limit the ability of households to afford quality housing. At a fundamental level, most households cannot access formal housing for a simple reason: it is beyond the reach of the average household’s ability to pay. The weaknesses in delivery value chains on the supply and demand side exacerbate the problem of affordability. Neither governments nor the private sector have been able to close this affordability gap despite significant resources and policies dedicated to the issue. As a consequence, less than ten percent of the population in many African cities and towns live in formal housing.30 Figure 9 shows the urbanization and per‐capita income of 29 SSA countries. Not surprisingly, it reveals that countries with higher per‐capita incomes also tend to be more urban. It also demonstrates that the majority of countries have Lower‐Middle Income and Low‐Income status.
Figure 9. Urbanization and GNI Per-Capita (US$) in Select SSA Countries, 2014
Source: World Bank 2014c.
In many countries, the price of the least expensive formal housing is vastly beyond the average family’s ability to pay. Figure 10, below, illustrates two important findings about housing affordability that hold true throughout most of urban SSA. Housing produced through formal channels is far too expensive for most people. Even what governments define as “affordable housing”—typically, formal housing targeted at those households who cannot afford a market unit—is not actually affordable to most households in that category. Instead, truly affordable housing is often available through the informal sector. For example, in Malawi, the least expensive available formal house is almost 57 times more expensive than a typical informal shelter alternative.
0
2,000
4,000
6,000
8,000
10,000
12,000
14,000
16,000
18,000
20,000
Gabon
Botswana
South Africa
Nam
ibia
Angola
Nigeria
Congo
Rep
Ghana
Sudan
Lesotho
Cote d'Ivoire
Cam
eroon
Senegal
Zambia
Tanzania
Sierra Leo
ne
Zimbabwe
Mali
Uganda
Rwanda
Burkina Faso
Ethiopia
Guinea
Ken
ya
Mozambique
Niger
Liberia
Malaw
i
DRC
Per capita GNI ($USD
)
Upper Middle Income - $4,126-$12,735
Lower Middle Income - $1,046-$4,125
Low Income <$1,045
Upper Income > $12,736
: More than 50% urban : Between 20‐50% urban : Less than 20% urban

Stocktaking of the Housing Sector in Sub-Saharan Africa
24
Even across country income levels, formal housing remains unaffordable to the average household. Figure 10 shows 2011‐2013 data from the Center for Affordable Housing Finance in Africa (CAHF) on the price and size of the least expensive newly built house by a formal, private developer in select countries.31 The mean per‐capita income is US$1,764, while the average house price is US$31,085. The red band shown on Figure 10 identifies the price of an affordable house within a range of 3 to 5 times annual income, a standard affordability measure (shown through the vertical axis on the right side). It shows that the cost of most houses is far outside this range. The variation in cost across the region also likely reflects different weaknesses within housing delivery systems. For example, both the Gambia and Democratic Republic of Congo, two countries with low per‐capita incomes, have among the highest housing prices; they are more than twice those of Botswana and South Africa, which have higher per‐capita incomes. However, other low‐income countries, such as Mali and Niger, have among the lowest cost for formal housing. Out of the 25 countries in SSA that are listed in the CAHF data, only five countries (South Africa, Namibia, Swaziland, Lesotho, and Mali) have a Gross National Income (GNI) per capita higher than or on par with the least expensive formal dwelling. While GNI per capita is a rough macroeconomic proxy for affordability, this finding points clearly to a gap between what the formal sector can provide and what SSA populations need.32
Figure 10. Relationship of Income to House Prices in SSA
Source: CAHF 2013.
Conventional measures of housing affordability reveal a tremendous gap in the affordability of formal housing, especially at the base of the pyramid. The least expensive house in Malawi, a low‐income country, according to the CAHF’s research, costs US$60,000. Assuming a typical household expenditure cap of 30 percent of income on mortgage payments, a borrower must make at least US$320 a month. Only the top 1 percent of the population in Malawi is thus eligible for this house.33 The World Bank’s Kenya Urbanization Review (2015) found a lower limit unit cost of $43,956 in Nairobi (pg.66) In Botswana, a country with a much higher per‐capita income than Malawi or Ghana, the relationship is the same. For example, The Botswana Housing Corporation (BHC) sells their least expensive 54 m2 unit on a 400 m2 plot at US$55,564. BHC suggests a minimum monthly mortgage payment of US$450 for this property, which means that at a 30 percent affordability level, a household must earn at least US$1,402 a month to pay it
0
20,000
40,000
60,000
80,000
100,000
0
4,000
8,000
12,000
16,000
20,000
Seychelles
Mauritius
South Africa
Botswana
Nam
ibia
Angola
Swaziland
Nigeria
Zambia
Ghana
Lesotho
Cote d'Ivoire
Cam
eroon
Kenya
Senegal
South Sudan
Zimbabwe
Tanzania
Ben
in
Burkina Faso
Rwanda
Mali
Uganda
Mozambique
Gam
bia
Togo
Cen
tral…
Ethiopia
Niger
Malaw
i
Burundi
Average
Price of cheap
est newly built house
by a form
al developer in 2013 (US$)
GNI p
er capita, 2012 (US$)
GNI per capita, US$
Cheapest Newly Built House
Affordability Range

Stocktaking of the Housing Sector in Sub-Saharan Africa
25
off. Given that half of Botswana lives on less than the international poverty line of US$60/month, it is clear that even the country’s primary housing developer and sole government housing authority cannot reach more than half of the population with new, formally‐constructed units.34
Figure 11. Housing Affordability Pyramid for Ghana
Income Range
Income GHC/month
Percentage of all Households
Maximum affordability (in GHC) assuming 3 times annual income
Housing cost (GHC) aimed at the thresholds35
Monthly maximum rent levels (GHC) affordable at R:Y of 10%
Very High >4,000
5%
180,000 476,000 & 204,000
500 +
High 3,001‐4,000 10% 144,000 163,200 400
Mid‐high 2,001‐3,000 50% of households can afford housing costing between
GHC12,001 and GHC72,000
108,000 95,200 300
Middle 1,001‐2,000 72,000 Up to 54,000 200
Moderate 501‐1,000 36,000 100
Low income
101‐500 18,000 50
51‐100 35% of households can afford
housing costing GHC12,000 or less
12,000 10
No wage income
0‐50
Source: UN‐Habitat 2011.
The situation is similar in lower-middle income countries as well. Figure 11 depicts an affordability pyramid for Ghana, a lower middle‐income country, based on a locally calibrated maximum house‐to‐income ratio of 3, which means that 85 percent of households are unable to access housing that costs above GHC 72,000 (US$22,378). For reference, the least expensive newly built house from a formal developer in Ghana costs US$25,000.36,37 Figures 12 and 13 are drawn from CAHF affordability analyses of Cameroon and Nigeria, respectively. The pyramids show that in each country, significant portions of the population live at or below the international poverty line of US$2 per day or about US$60 per month. In each case, the cost of a mortgage far exceeds the ability of most to pay. In Cameroon, only 2 percent of the population has access to mortgage finance. For self‐built houses, a 200 m2 plot of land costs between $1,300‐$21,000, with construction costs ranging from $8,300‐$42,000, making the least expensive self‐built option about $9,600 (excluding infrastructure connections).38 In Nigeria, a minimum wage earner drawing a monthly income of US$116 (which is twice as much as more than 75 percent of the population earns) would only be able to finance US$4,685 a year. This would only cover one quarter of the value of the lowest cost house. Indeed, a private developer surveyed as part of the country case study suggested the lowest cost new unit in a development outside of Abuja is $27,000; still far more than what many can pay for housing in a less desirable location.

Stocktaking of the Housing Sector in Sub-Saharan Africa
26
Figure 12. CAHF Yearbook Affordability Pyramids for Cameroon
Source: CAHF 2013.
Figure 13. CAHF Yearbook Affordability Pyramids for Nigeria
Yellow Good access to housing; targeted by formal development
Green Opportunity for further market development; households may invest if affordable product is
available; often build their homes incrementally.
Purple Requires government subsidies; could be the target of Public‐Private Partnerships.
Source: CAHF 2013.
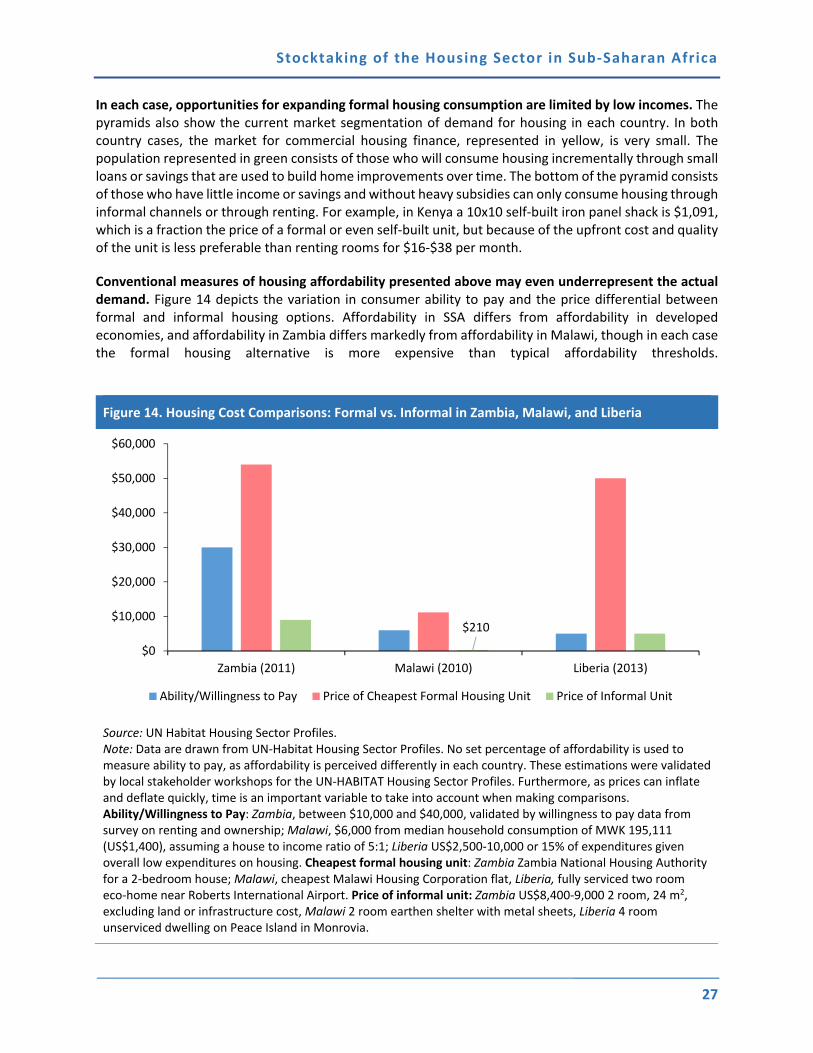
Stocktaking of the Housing Sector in Sub-Saharan Africa
27
In each case, opportunities for expanding formal housing consumption are limited by low incomes. The pyramids also show the current market segmentation of demand for housing in each country. In both country cases, the market for commercial housing finance, represented in yellow, is very small. The population represented in green consists of those who will consume housing incrementally through small loans or savings that are used to build home improvements over time. The bottom of the pyramid consists of those who have little income or savings and without heavy subsidies can only consume housing through informal channels or through renting. For example, in Kenya a 10x10 self‐built iron panel shack is $1,091, which is a fraction the price of a formal or even self‐built unit, but because of the upfront cost and quality of the unit is less preferable than renting rooms for $16‐$38 per month.
Conventional measures of housing affordability presented above may even underrepresent the actual demand. Figure 14 depicts the variation in consumer ability to pay and the price differential between formal and informal housing options. Affordability in SSA differs from affordability in developed economies, and affordability in Zambia differs markedly from affordability in Malawi, though in each case the formal housing alternative is more expensive than typical affordability thresholds.
Figure 14. Housing Cost Comparisons: Formal vs. Informal in Zambia, Malawi, and Liberia
Source: UN Habitat Housing Sector Profiles. Note: Data are drawn from UN‐Habitat Housing Sector Profiles. No set percentage of affordability is used to measure ability to pay, as affordability is perceived differently in each country. These estimations were validated by local stakeholder workshops for the UN‐HABITAT Housing Sector Profiles. Furthermore, as prices can inflate and deflate quickly, time is an important variable to take into account when making comparisons. Ability/Willingness to Pay: Zambia, between $10,000 and $40,000, validated by willingness to pay data from survey on renting and ownership; Malawi, $6,000 from median household consumption of MWK 195,111 (US$1,400), assuming a house to income ratio of 5:1; Liberia US$2,500‐10,000 or 15% of expenditures given overall low expenditures on housing. Cheapest formal housing unit: Zambia Zambia National Housing Authority for a 2‐bedroom house; Malawi, cheapest Malawi Housing Corporation flat, Liberia, fully serviced two room eco‐home near Roberts International Airport. Price of informal unit: Zambia US$8,400‐9,000 2 room, 24 m2, excluding land or infrastructure cost, Malawi 2 room earthen shelter with metal sheets, Liberia 4 room unserviced dwelling on Peace Island in Monrovia.
$210
$0
$10,000
$20,000
$30,000
$40,000
$50,000
$60,000
Zambia (2011) Malawi (2010) Liberia (2013)
Ability/Willingness to Pay Price of Cheapest Formal Housing Unit Price of Informal Unit

Stocktaking of the Housing Sector in Sub-Saharan Africa
28
Common measures of affordability that are used in developed economies, such as assuming a 30 percent threshold of household expenditures on housing or a price‐to‐income ratio of 3:1 or 5:1, does not provide the most accurate picture for many countries throughout SSA. Indeed, recent research finds that for households in low‐income countries, food alone accounts for 50‐60 percent of monthly expenditures, which in turn reduces the amount available for housing consumption (Lozano‐Gracia and Young 2014). (For a full discussion of affordability in SSA, please refer to Appendix 1. Affordability in Sub‐Saharan Africa.)
Overall, while the breadth of affordability gaps varies by country, most countries in SSA share a common affordability challenge, where the majority low- to middle-income populations cannot access quality housing. By typical affordability standards, formal housing costs for the poor across the region, and in low‐income countries in particular, are extremely high. These conventional measures may even understate the affordability gap; poor households may not even have 30 percent of their income to spend on housing after accounting for other necessary expenses. In these cases, people must consume smaller and lower quality housing options. More research needs to be done to refine the conception and determination of affordability. This would include research on what house‐to‐income ratios make sense and how households allocate their budgets towards other needs such as food and transportation.39 Then, the price of the least expensive formal housing—whether developed by a private or public actor—must be compared to the price of informal housing alternatives, with these prices being updated on a regular basis. As long as the lowest cost formal housing unit lies above a household’s ability to pay, informal housing options will be the preferred choice.
A.1. Rental is an important affordable tenure option, particularly in the context of self‐build housing.
Rental housing is a common source of affordable housing for middle- and low-income households in SSA. However, it is likely that many people rent land, houses or rooms through the informal market, making it difficult to assess prices and the quality of rental accommodations. Renting is appealing to new migrants or low income residents who cannot access long term finance, who are unable or uninterested in self‐built housing or homeownership or who desire mobility to pursue work opportunities in different places. Renting arrangements also range from informal to formal. Informal arrangements, which are common among the urban poor, offer tenants the most flexibility to negotiate payment options (often through a verbal agreement), but this option offers few legal protections for both the safety and property of landlord and tenant. This is appealing for those with low and irregular incomes. Formal rentals by contrast may require a deposit or large upfront payment. There is little data on urban rental tenure, especially among low‐income groups because it is often supplied and consumed outside of formal markets through cash transactions or petty landlordships without written, enforceable contracts. Table 3 below aggregates some of the available data on housing tenure for select SSA countries. The data demonstrates that rental housing is an essential tenure option in many of these countries, particularly Zambia, Uganda, Ghana, and Ethiopia. In Malawi, where rental housing is the least common, home‐ownership is universal due to the large numbers of self‐built households, rent‐free living arrangements and employer housing. Instead of renting being the less expensive option, it is more unaffordable, and owners in informal settlements are thus “failed renters.”40

Stocktaking of the Housing Sector in Sub-Saharan Africa
29
Table 3. Housing Tenure in Selected SSA Countries
Owner‐occupied Rental Other
Zambia (Urban, 2006)
46.4% 44.7% 9.1% (Rent‐free, employer housing, other)
Uganda (National, 2010)
30% 57% 13% (Unspecified)
Ghana (Urban, 2008)
26.1% 40.9% 31.7% (Rent‐free)
Malawi (Urban, 2005)
42% 10% 48% (Rent‐free, employer housing)
Nigeria (National; 2006) 70.83% 22.72% 6.45%
Cameroon (National; 2005) 65% 26.7% 8.3%(Rent to buy; employer housing; housed by parents/friends; other)
Ethiopia (Urban; 2007) 39.31% 53.76 6.94% (Rent‐free)
Source: UN Habitat Housing Profiles, case studies on Nigeria, Cameroon, and Ethiopia.
Rental typologies vary widely within and among countries as well, and can exist in the formal or informal market. For example, in South Africa, informal rentals are estimated to comprise 20 percent of the market, or about 400,000 households (UN‐Habitat 2011). By contrast, in Cameroon, a significant proportion (41.3 percent) of the rental market is in “multi‐dwelling units,” which can accommodate multiple households in adjoined structures, followed by concessions (24.3 percent), detached houses (22.7 percent), flats/apartment buildings (7.9 percent), modern villas (2.3 percent), and other forms (1.5 percent).41 Undocumented rental arrangements can place tenants at greater risk for eviction without due notice or through unforeseen rent increases. However, rent‐free arrangements, especially among family members, are also convenient and common, especially where other options may be limited.
Across the region, the market for formal rental units is weak and is directed toward professionals.42 Few developers are willing to embark on building rental real estate.43 Most African governments began halting investments in rental housing during the mid‐1980’s, as the approach was disfavored for its inefficiency. Much of the existing rental stock consists of institutional housing built by government ministries, local authorities, or major industries44 for their workers. At the top of the market in SSA, there is a thriving rental sector for high‐income expatriate professionals (diplomats, NGO country representatives, senior managers in industries, etc.) which tends to operate internationally and may extract rent in dollars. In general, public provision of rental housing is limited and increasingly dwindling. In some countries, however, housing for civil servants (including university staff, teachers, health workers, etc.) is routinely provided by their employers, which along with the promise of income stability and pensions are strong benefits despite the prevalence of low salaries.
Formal rental housing is also out of reach of most of the urban poor. The case study report of Nigeria finds that 60‐70 percent of low‐income households are not able to afford the least expensive rental accommodation on the open market (around US$1,200 per year in major cities), of which there is a negligible supply. A much larger proportion of low‐income households is unable to afford mortgage payments on the least expensive accommodations that are advertised for sale (around US$62,000 in major cities, which at repayments of 40 percent of household income would require an annual income of

Stocktaking of the Housing Sector in Sub-Saharan Africa
30
US$15,000; that is, only 15‐20 percent of the population). In any case, such accommodation would consist mainly of two‐bedroom flats, which could accommodate a five person household (the mean household size in Nigeria) though but leave little room for privacy, storage or future accommodation..
Rent controls negatively affect the supply and quality of formal rental units. Rent control has been quite common for formal and public rental units. An extreme example is Ghana, where rent control was instituted in 1943 and only removed in the 1990s. Its effects were just as would be expected from experience elsewhere: landlords removed buildings from residential use, maintenance was withdrawn, the new investment was slowed, and other means to increase the net present value of the rent were eventually instigated (in Ghana’s case, demanding up to three years’ rent in advance). Large upfront payments disqualify those without savings for a lump sum payment. Rent controls overall have exacerbated limited investment in formal rental housing.
The conversion of owner-occupied units demonstrates a strong demand for renting. Where housing is rarely sold, some rental stock emerges from owner‐occupied accommodations. Instead of selling the unit, which is infeasible or unfavorable in some SSA countries, the dwelling is rented out.45 For example, some of the divested institutional housing has been let out by its new owners who could not afford to maintain it. In the Ethiopian Integrated Housing Development Program (IHDP), many condominium apartments are allocated to households who cannot afford them—households pay the deposit and then put in a tenant whose rent covers both their mortgage payments and their rent in less expensive housing elsewhere. Similarly, plot‐owners in Southern Africa have been able to make quick profits on backyard shacks built of poles and corrugated metal sheets, or as panels of lapped softwood in kit form (in Zimbabwe), to rent out.46
Petty landlordships and subletting arrangements can provide affordable rental housing and generate income. Rental rooms are also provided by owner‐occupiers (or even renters) as extra rooms or buildings adjacent to their own dwelling. Many user‐initiated modifications to government‐built and other housing have been built to provide extra rooms for renting as a supplementary income source, as has occurred with kebele housing in Ethiopia, for example. Some households decide to occupy smaller spaces within their own home in order to maximize their rental income from the transformed house.47 In many societies where parents are expected to provide some accommodation for their grown‐up children, such rooms may be intended for eventual occupation by family members in the longer term but are let out for the short to medium term. Owners may often have similar economic standing to their tenants; Tipple et al.’s survey of housing supply in Ghana48 found that owners were not better off than renters in per capita expenditure terms.
Due to constraints on supply, the majority of rental housing in Africa is held by self-build or tenant landlords in slums, informal settlements, and private subdivisions. In Nairobi, 92 percent of households in slums, and 80 percent of total households, are tenants rather than homeowners.49 As incremental self‐build becomes increasingly challenging due to the high cost of urban land, rental and home‐sharing options are becoming more popular. Another complicating factor in rental statistics is the tendency to lump other non‐ownership tenures, such as room‐sharing, in with renting. It is very common, especially in West Africa, for a large population to be housed through their extended family networks. Rent‐free tenancy obtained via a relation to the owner of the house (or being part of the family which inherited the building in common) is common in West Africa. This is a very important social safety net, protecting some of the poorest and most vulnerable individuals and households from homelessness and providing housing for recently arrived migrants.50,51

Stocktaking of the Housing Sector in Sub-Saharan Africa
31
Renters are likely to experience conditions of overcrowding and lack legal protections. Renters are more likely to share water supply, toilets, kitchens and bathrooms than owners, and to have to endure worse physical conditions.52 While renting is congruent with a need for housing mobility, to benefit from job opportunities or to adjust housing for new household circumstances, renters tend to be more liable to having to move than owners due to limited legal protections for eviction of tenants, especially those renting informally. For example, Ghana allows an owner to evict a tenant if the owner needs the room(s) for a family member; something that landlords can use to their advantage to remove tenants and quickly rent the unit to someone who will pay more.53 Eviction is a constant threat over many renters and, while rent legislation and regulation tends to try to give tenants at least some security, too much security will discourage the supply of rental housing through the market.
The report finds that there is a substantial overlap between small-scale rental housing and self-built housing. Often the initial home becomes the anchor for a multi‐room home that accommodates multiple unrelated people or households, or the site becomes a mini‐compound where a main house is surrounded by ‘backyard shacks’ that are rented. It is further generally observed that rental arrangements are governed by verbal agreements rather than written leases, with payments in cash, so that even if the structure is formal the activity is informal. These factors make it very difficult for a government to impose regulation or formality onto the Sub‐Saharan African rental sector, as doing so would disrupt a vast body of informal people, housing, employment, and income. A strong housing market must include quality rental housing options across the income scale. However, large‐scale development of such housing is often hindered in SSA by a strong home ownership bias in policymaking, lack of accurate and comparable data, and poor regulation of rental agreements, particularly in the informal sector.54
A.2. Few governments have directly addressed housing informality
Despite the ubiquity of self-built informal housing in SSA, there is often limited policy support for it. There are four main ways that governments respond to housing informality in the region ranging from hostility to active support:
Informal housing is actively opposed. Informal housing developments may interfere with newly planned development. For example Ethiopia’s government‐owned but informally‐built kebele housing is being actively cleared, especially in the capital, and replaced by modern condominium apartments which are not affordable to the same residents. The displacement forces kebele residents to find alternative housing in other parts of the city, often the urban fringe, contributing to further urban expansion.
Informal housing is ignored or tolerated. Some countries have an ambivalent approach to informal housing whereby governments build limited infrastructure in these aeas, but often slowly, sporadically or with the purpose of garnering political support from residents. For example, in Zambia, peripheral squatter areas became important areas for cultivating votes for political office and consequently, few were cleared.55 Governments can also implicitly legitimize illegal settlements when they retrofit basic infrastructure such as roads, drainage, electricity, and water for these communities, as in the case of Nigeria. In Ethiopia, residents further seek to project an image of permanence and stability by building steel gates and corrugated iron fences around their property. Each of these measures raises the perceived costs and risks for governments intervening to remove or resettle people in these areas in the future.
Informal housing is recognized and addressed positively. A number of governments are beginning to recognize the potential in self‐built housing and to work with the reality of informality. For example, Angola has made self‐built housing the focal point of its “one million
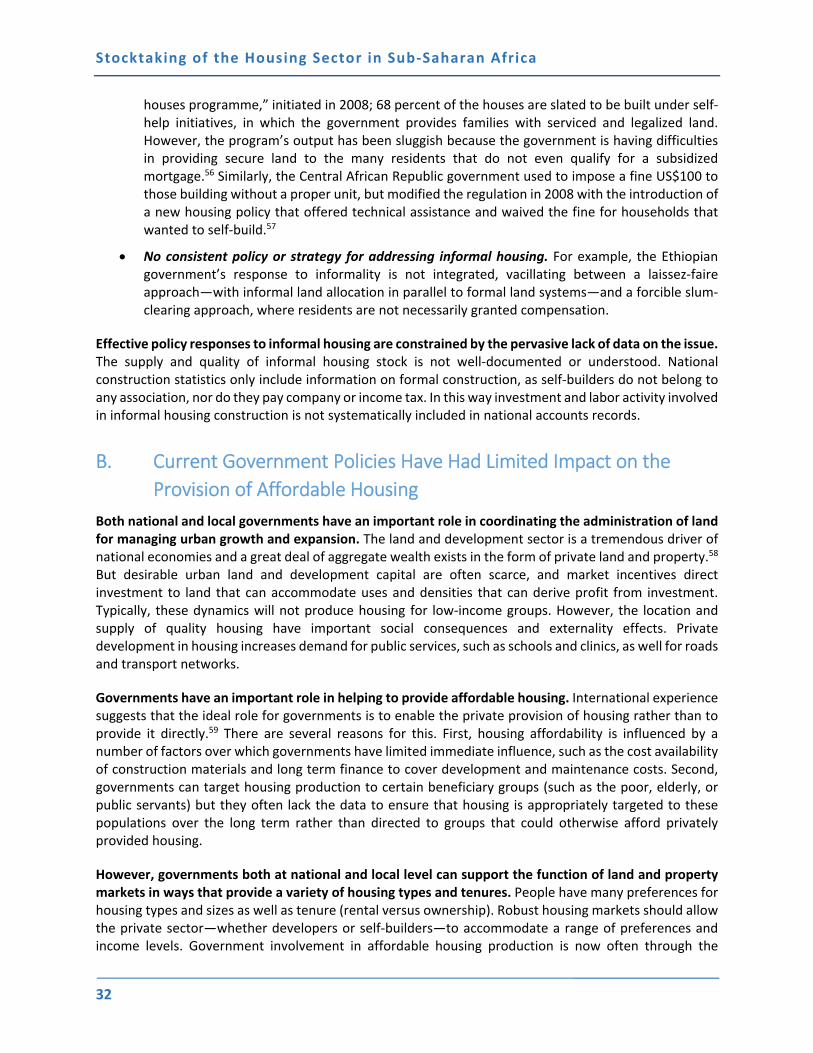
Stocktaking of the Housing Sector in Sub-Saharan Africa
32
houses programme,” initiated in 2008; 68 percent of the houses are slated to be built under self‐help initiatives, in which the government provides families with serviced and legalized land. However, the program’s output has been sluggish because the government is having difficulties in providing secure land to the many residents that do not even qualify for a subsidized mortgage.56 Similarly, the Central African Republic government used to impose a fine US$100 to those building without a proper unit, but modified the regulation in 2008 with the introduction of a new housing policy that offered technical assistance and waived the fine for households that wanted to self‐build.57
No consistent policy or strategy for addressing informal housing. For example, the Ethiopian government’s response to informality is not integrated, vacillating between a laissez‐faire approach—with informal land allocation in parallel to formal land systems—and a forcible slum‐clearing approach, where residents are not necessarily granted compensation.
Effective policy responses to informal housing are constrained by the pervasive lack of data on the issue. The supply and quality of informal housing stock is not well‐documented or understood. National construction statistics only include information on formal construction, as self‐builders do not belong to any association, nor do they pay company or income tax. In this way investment and labor activity involved in informal housing construction is not systematically included in national accounts records.
B. Current Government Policies Have Had Limited Impact on the
Provision of Affordable Housing
Both national and local governments have an important role in coordinating the administration of land for managing urban growth and expansion. The land and development sector is a tremendous driver of national economies and a great deal of aggregate wealth exists in the form of private land and property.58 But desirable urban land and development capital are often scarce, and market incentives direct investment to land that can accommodate uses and densities that can derive profit from investment. Typically, these dynamics will not produce housing for low‐income groups. However, the location and supply of quality housing have important social consequences and externality effects. Private development in housing increases demand for public services, such as schools and clinics, as well for roads and transport networks.
Governments have an important role in helping to provide affordable housing. International experience suggests that the ideal role for governments is to enable the private provision of housing rather than to provide it directly.59 There are several reasons for this. First, housing affordability is influenced by a number of factors over which governments have limited immediate influence, such as the cost availability of construction materials and long term finance to cover development and maintenance costs. Second, governments can target housing production to certain beneficiary groups (such as the poor, elderly, or public servants) but they often lack the data to ensure that housing is appropriately targeted to these populations over the long term rather than directed to groups that could otherwise afford privately provided housing.
However, governments both at national and local level can support the function of land and property markets in ways that provide a variety of housing types and tenures. People have many preferences for housing types and sizes as well as tenure (rental versus ownership). Robust housing markets should allow the private sector—whether developers or self‐builders—to accommodate a range of preferences and income levels. Government involvement in affordable housing production is now often through the

Stocktaking of the Housing Sector in Sub-Saharan Africa
33
provision of programmatic tools and incentives for the private sector in order to soften the cost of providing units that are below a market rate or which meet public benefit criteria. In principle, these partnerships recognize the relative importance of both public and private sectors in performing specific tasks and allocate responsibilities on the basis of each partner's comparative advantages.
Local governments, in particular, may often be well placed to improve conditions for housing solutions at different levels of the market. In many countries throughout Africa, local governments regulate or oversee land use and spatial planning and are responsible for infrastructure planning and investment. Local politicians, private sector, and civil society leaders are often well placed to identify and respond to particular housing needs, persistent obstacles and community preferences that national level officials would not necessarily be cognizant of. For example, local governments can lay out clear plans for land use and zoning, and plan street grids and municipal services, in addition to development controls. The private sector tends to have more investment in equipment and expertise for construction, along with the experience and capacity to deliver a housing product to a target market segment rapidly.
B.1. Government subsidies do not effectively address the need for affordable housing and fail to engage the private sector.
Governments have several options to improve the private provision of affordable housing. These “housing affordability tools” or HATs can be directed to three areas: 1) subsidies for reducing the cost to build or operate housing; 2) reducing the cost of purchasing or occupying a house; and 3) to individuals, developers, non‐governmental organizations (NGOs), and other stakeholders that are involved in housing delivery. HATs include grants and subsidized loans to target groups in order to reduce the cost of housing. They could also take the form of indirect subsidies, such as public investments in trunk infrastructure (which frees developers from those costs) and improving access to developer finance. Table 4 below outlines the main 16 HATs that can improve the private provision of affordable housing.
Source: World Bank data.
However, SSA governments have had limited success in using these tools to improve affordability. Though all of these tools are employed to varying degrees in SSA, governments in the region largely tend to encourage housing production with trunk infrastructure provision and offering hard debt with internal subsidy. The latter refers to the practice of lending money at a below market interest rate and subsequently “taking a loss” compared to the conventional alternative. This can be supply‐side (loan to developer to build or buy materials or land) or demand‐side (loan to home buyer). However, most governments in SSA tend to
offer the supply side subsidy. Box 5 details various subsidy programs in the region.60,61
Table 4. Housing Affordability Tools (HATs)
Non-Cash Cash
Land Grants
Zoning and density Hard debt with high gearing/leverage
Trunk infrastructure Hard debt with internal subsidy
Site infrastructure Soft debt
Inexpensive/free utilities Hard equity
Credit enhancement Soft equity
Tax relief (VAT, Sales) Operating subsidy
Ongoing real estate tax abatements Redirective subsidy
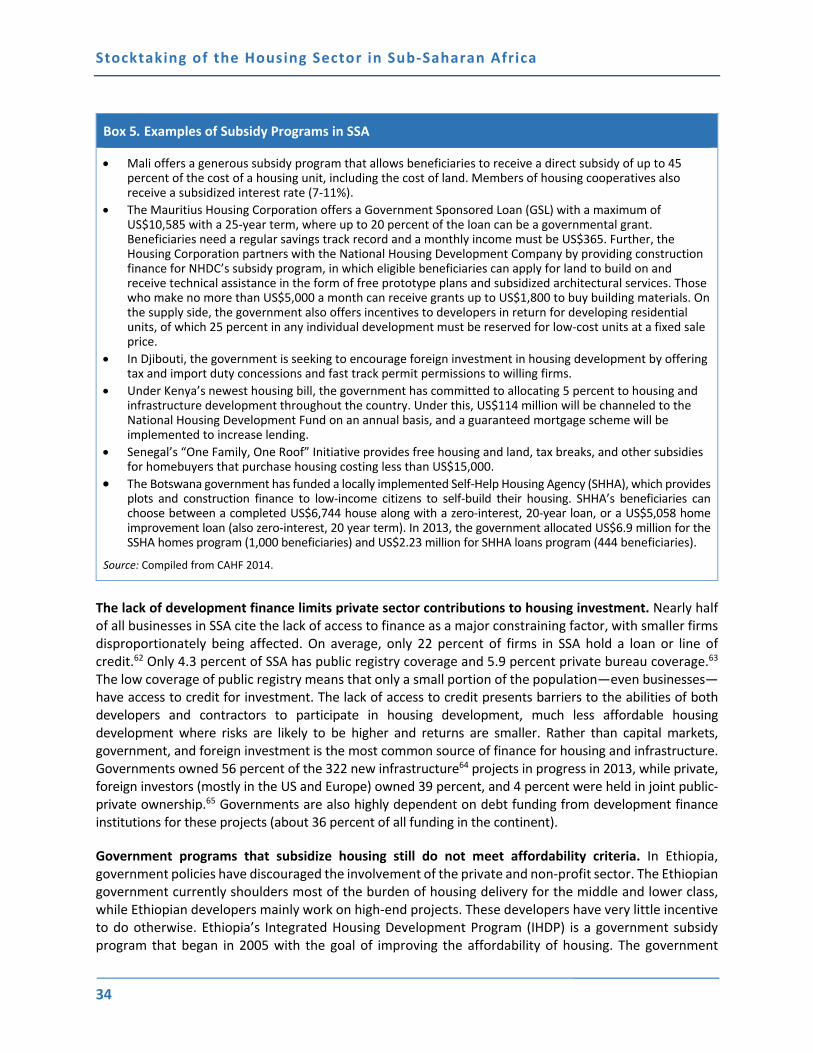
Stocktaking of the Housing Sector in Sub-Saharan Africa
34
Box 5. Examples of Subsidy Programs in SSA
Mali offers a generous subsidy program that allows beneficiaries to receive a direct subsidy of up to 45 percent of the cost of a housing unit, including the cost of land. Members of housing cooperatives also receive a subsidized interest rate (7‐11%).
The Mauritius Housing Corporation offers a Government Sponsored Loan (GSL) with a maximum of US$10,585 with a 25‐year term, where up to 20 percent of the loan can be a governmental grant. Beneficiaries need a regular savings track record and a monthly income must be US$365. Further, the Housing Corporation partners with the National Housing Development Company by providing construction finance for NHDC’s subsidy program, in which eligible beneficiaries can apply for land to build on and receive technical assistance in the form of free prototype plans and subsidized architectural services. Those who make no more than US$5,000 a month can receive grants up to US$1,800 to buy building materials. On the supply side, the government also offers incentives to developers in return for developing residential units, of which 25 percent in any individual development must be reserved for low‐cost units at a fixed sale price.
In Djibouti, the government is seeking to encourage foreign investment in housing development by offering tax and import duty concessions and fast track permit permissions to willing firms.
Under Kenya’s newest housing bill, the government has committed to allocating 5 percent to housing and infrastructure development throughout the country. Under this, US$114 million will be channeled to the National Housing Development Fund on an annual basis, and a guaranteed mortgage scheme will be implemented to increase lending.
Senegal’s “One Family, One Roof” Initiative provides free housing and land, tax breaks, and other subsidies for homebuyers that purchase housing costing less than US$15,000.
The Botswana government has funded a locally implemented Self‐Help Housing Agency (SHHA), which provides plots and construction finance to low‐income citizens to self‐build their housing. SHHA’s beneficiaries can choose between a completed US$6,744 house along with a zero‐interest, 20‐year loan, or a US$5,058 home improvement loan (also zero‐interest, 20 year term). In 2013, the government allocated US$6.9 million for the SSHA homes program (1,000 beneficiaries) and US$2.23 million for SHHA loans program (444 beneficiaries).
Source: Compiled from CAHF 2014.
The lack of development finance limits private sector contributions to housing investment. Nearly half of all businesses in SSA cite the lack of access to finance as a major constraining factor, with smaller firms disproportionately being affected. On average, only 22 percent of firms in SSA hold a loan or line of credit.62 Only 4.3 percent of SSA has public registry coverage and 5.9 percent private bureau coverage.63 The low coverage of public registry means that only a small portion of the population—even businesses—have access to credit for investment. The lack of access to credit presents barriers to the abilities of both developers and contractors to participate in housing development, much less affordable housing development where risks are likely to be higher and returns are smaller. Rather than capital markets, government, and foreign investment is the most common source of finance for housing and infrastructure. Governments owned 56 percent of the 322 new infrastructure64 projects in progress in 2013, while private, foreign investors (mostly in the US and Europe) owned 39 percent, and 4 percent were held in joint public‐private ownership.65 Governments are also highly dependent on debt funding from development finance institutions for these projects (about 36 percent of all funding in the continent).
Government programs that subsidize housing still do not meet affordability criteria. In Ethiopia, government policies have discouraged the involvement of the private and non‐profit sector. The Ethiopian government currently shoulders most of the burden of housing delivery for the middle and lower class, while Ethiopian developers mainly work on high‐end projects. These developers have very little incentive to do otherwise. Ethiopia’s Integrated Housing Development Program (IHDP) is a government subsidy program that began in 2005 with the goal of improving the affordability of housing. The government

Stocktaking of the Housing Sector in Sub-Saharan Africa
35
constructs condominiums for sale with a large upfront subsidy. Beneficiaries purchase units using a government mortgage, with down payments ranging from 10 percent to 40 percent, depending on unit size and household income. However even the least expensive formal unit remains out of reach for most of the target population. Figure 15 shows the monthly payment for each unit type and mortgage, compared to renting. The bottom third of income groups cannot afford the lowest cost apartment, unless they choose a small unit with a down payment of 40 percent. Three bedroom units are outside the affordability threshold for half of income earners.
Figure 15. Affordability of Condo Mortgages of IHDP in Addis Ababa, Ethiopia (2014)
Source: World Bank 2015a.
A common means of providing affordable housing used to be direct government provision. However, most governments have been moving away from this approach for reasons of targeting and cost efficiency. Direct government provision of housing, particularly for the public sector and middle class, was common during the independence period of the 1960s, though funding was soon depleted. The direct provision of housing was followed by a sites and services approach. This involved supplying households with a surveyed plot of land, certain basic services and, in some cases, a ‘core’ structure consisting of a toilet and kitchen.66 As squatter settlements grew to dominate cities, governments tried to improve the existing housing stock through direct investments, but the scale necessary to keep up with the urban growth was rarely achieved. International housing policy shifted in the 1990s toward an “enabling” approach, outlined in the UN‐Habitat’s Global Strategy for Shelter to the Year 2000. This approach calls for governments to facilitate the housing development efforts of households and private markets by providing a supportive legal, regulatory, and financial environment.67
Public housing remains unaffordable even when directly provided by governments. In 2009, the Government of Cameroon allocated US$50.1 million to fund the Government Program of Construction of 10,000 Social Housing Units and Development of 50,000 Buildable Plots. Despite the ambitious targets, only 1,175 units have been built as of 2015. However, 80 percent of Cameroon’s population cannot afford these social housing units. Figure 16 shows that in conventional affordability terms, these units are far
0
100
200
300
400
500
600
700
800
900
1,000
Kebele Private Rental Studio 1BR 2 BR 3 BR
Monthly Payment (ETB
)
RentMortgage: 40/60Mortgage: 20/80Mortgage: 10/90
20th 30th
50th
Max. affordabilitythreshold byHH percentile*
40th
10th
*Based on 30% pmt‐income ratio

Stocktaking of the Housing Sector in Sub-Saharan Africa
36
outside of the typical price‐to‐income range of between 3:1 and 5:1, with prices 44‐51 times typical income levels. Indeed, even for public employees, price‐to‐income ranges for homes in these developments range between 10.5‐13.5 mean incomes, or two to three times affordability thresholds.
Figure 16. House Price-To-Income Ratios for Government Social Housing Program in Cameroon
Source: World Bank, Cameroon Country Case Study.
Nigeria has also dedicated significant resources to public housing investment and has not been able to fully meet the stated production targets. The Federal Housing Authority was created in 1973 and charged with producing housing to meet a growing need according to several National Development Plans that have aimed to supply 261,000 units. However, by 2012 the authority has only constructed 41,000 units or about 15 percent of its goal. Since 1991, the government has adopted a housing policy that encourages private sector participation by offering discounted land and development finance. However, rather than encourage the production of housing, these subsidies served to encourage land speculation in major cities where high value land was acquired for little or no cost. Development agreements with local governments were either ignored or not enforced and, in the case of Abuja, any housing that was built was directed toward middle and upper income groups in order to maximize investment returns (Abdullahi and Aziz 2011).
Parastatal housing organizations also limit private sector activity in housing development. Tanzania’s National Housing Corporation (NHC) began in 1962 as a government agency with the mission of providing universal housing access. Over the next ten years, NHC built approximately 11,000 units and acquired 8,500 others through the seizure of vacant properties. This competition discouraged private investment in the housing sector for years, an effect that was magnified when NHC housing production fell off in 1973 following budget cuts (Komu 2011). NHC became a parastatal organization in 1990 and subsequently has become a housing developer that competes with the private sector.68 However, the NHC has an advantage because of the legal powers it has to “acquire parcels of land and service them” as “master developer” (NHC 2010) which it can accomplish through access to public funds. The NHC also has now focused on developing market rate housing, with a typical unit price of US$20,000. While these units are less
$680 $680 $680 $680
49.2
56.5
44.1
51.1
0
10
20
30
40
50
60
$0
$5,000
$10,000
$15,000
$20,000
$25,000
$30,000
$35,000
$40,000
Olembe 1 Olembe 2 Mbanga‐Bakoko 1 Mbanga‐Bakoko 2
(Average Income USD)
Price (USD)
Price to Income Ratio
DoualaYaounde
Price to Income Ratio of 3:1 and 5:1

Stocktaking of the Housing Sector in Sub-Saharan Africa
37
expensive than those built by private sector competitors, they remain too expensive for the poor and instead are targeted to middle and upper income groups.
Housing subsidies suffer from weak design and targeting. In general, government subsidies are not effective in expanding affordable housing in SSA for four reasons. First, they may be too small to significantly improve a beneficiary’s ability to purchase or rent based on market conditions. This is the case in Cameroon, where the government’s flagship social housing program is unaffordable by 80 percent of the population. Second, supply‐side programs may use subsidies inefficiently. Third, housing subsidy programs may privilege a single major city’s housing needs (as in Zambia, Ethiopia, Lesotho and Liberia) or a specific housing tenure type (such as homeownership vs. renting) as is the case in Ghana.69 Fourth, subsidies for private developers to build low‐income units may simply be used to supply additional housing to upper‐income groups, as is the case in Ghana.70 Finally, there is limited government coordination with private sector actors, which could otherwise improve the scalability of subsidies71 and reduce the crowding out of private sector housing investment.
There is no singular solution to improving the targeting of housing subsidies. Rather, a better understanding of particular country contexts and housing delivery value chains is needed to better assess the type and role for subsidy intervention. Public resources are limited and, where possible, need to be directed to where they may have the greatest impact in catalyzing affordability. The direct provision of subsidized housing by governments tends to neither be cost effective nor well targeted to those who need it. This is because government housing suppliers are constrained by the same barriers, such as materials and construction costs, which limit the overall housing delivery system. As an enabler of housing markets, government interventions should target the weakest link in either the supply or demand value chains. In doing so, the government should also initiate private sector involvement to spur competition and consumer choice.
Examples from South Africa, Mauritania and Tanzania, Cameroon and Mozambique below provide illustrations of innovation and promising interventions and initiatives in the domains of target subsidies, urban upgrading programmes and models for Public Private Partnerships.
Box 6. South Africa’s Housing Subsidy Experience
Compared with the rest of SSA, South Africa is the economic powerhouse, with a much better developed and more extensive infrastructure grid. These make the case of South Africa difficult to extrapolate to other countries in the region, though its regional economic and cultural dominance creates opportunities to apply South African lessons to nearby countries, especially Namibia and Botswana.
Support for Private Lending to Low‐Income Groups:
South Africa has been successful in targeting subsidies and engaging the private sector in low‐income housing delivery by establishing explicit lending criteria for beneficiary groups. The government has been adamant about this priority, and even moved to enact a statutory mandate version of the United States’ Community Reinvestment Acta for banks. This prompted the banks to voluntarily convene and collectively pledge to a Financial Sector Charter (FSC) in 2003, where they committed capital to certain priority sectors, including affordable housing. Banks promised to make R42 billion in home loans to borrowers in the US$250‐1,100 per month income category. As further incentive for participation, the government rates each bank based on the level of committed capital and uses the rating to determine eligibility for other subsidies or regulatory approvals.b

Stocktaking of the Housing Sector in Sub-Saharan Africa
38
Box 6. South Africa’s Housing Subsidy Experience
The implementation of the Financial Sector Charter has been very successful, as banks exceeded their mandated target and lent R45 billion. Of this, R28 billion was mortgage loans and the rest consisted of pension‐secured construction, wholesale finance, and housing microfinance credit. Additionally, analysis of mortgage loan performance in 2013 revealed that the performance of FSC and affordable target market loans were on par with those for higher‐income earners. Namibia followed suit and implemented their own financial sector charter in 2009.c
Capital Subsidies:
The government’s capital subsidy program has supported consumer housing finance for low‐income groups since the early 1990s and has contributed to 1.6 million housing starts. The scheme mainly consists of a one‐time capital sum given to eligible low‐income households. In 1996, the government established the National Housing Finance Corporation (NHFC) to provide wholesale finance for housing intermediaries (banks, non‐bank lenders, housing associations) that cater to the low‐income market, and NURCHA, a development finance company that provides bridge finance for affordable housing contractors and developers.d Lastly, the government’s most recent program, introduced in 2012, addresses the gap for those who do not qualify for subsidies but cannot afford the least expensive newly built house. The Finance Linked Individual Subsidy Program, or FLISP, gives buyers a one‐time capital contribution of US$8,500‐9,760 when they access a mortgage and buy a house under US$29,286. Implementation, however, has been slow, with only 114 applications approved in the first year.e
Settlement Upgrading:
The Enhanced People’s Housing Process (ePHP) is a government‐sponsored initiative to provide subsidy assistance to low‐income households for incremental self‐help upgrading of informal settlements. The program provides funding and support to community‐based organizations such as cooperatives, voluntary associations or trusts that are charged with organizing beneficiaries who contribute to housing construction with their own labor in lieu of a financing. The program also allows for a flexibility to accommodate both demand‐driven proposals (from community groups) and from municipalities that petition support for distribution for projects within the city, ranging from upgrading and improvement to new greenfield developments (SERI, 2011)..
However, there remains more to be done:
Despite the subsidies, affordable housing is still out of reach for many, suggesting the need for other complementary investments. Given such an exhaustive network of subsidy schemes, it is unsurprising that, in 2010, 75 percent of the delivery all new houses were subsidized in some way. About 86 percent of the population is eligible for some form of housing subsidy.g Despite this, South Africa’s housing shortage persists—its current backlog is defined at 2.1 million units, for 1 million households living in informal settlements and 1 million households living in inadequate or overcrowded conditions. As previously discussed, the lack of serviced land and infrastructure backlogs are persistent reasons for higher housing costs and demonstrate that subsidies for housing consumption alone are often not enough.h
Sources: b. JCHS 2005. c. CAHF 2013 d. JCHS n.d. e. CAHF, 2013 f. Bradlow, Bolnick, and Shearing 2011. g. CAHF 2013. h. CAHF 2013. Note: a. The US Community Reinvestment Act is a federal act that encourages banks and savings associations to lend to low and moderate income borrowers in their neighborhoods by taking a bank’s CRA compliance into consideration when approving bank expansions.

Stocktaking of the Housing Sector in Sub-Saharan Africa
39
Box 7. Informal Settlement Upgrading and Housing Improvement in Mauritania
The population of growth of Nouakchott, Mauritania reflects the same trends occurring in other Sub‐Saharan African cities. Since 2000, the population of the city grew by 25 percent, to more than 700,000, about half of which are estimated to live in informal settlements, or kebbe. In 2000, the Government, with assistance of the World Bank, began an upgrading program to improve living conditions and housing quality in slums of 11 regional capitals, including the largest kebbe in Nouakchott, El Mina (which had a total of 40,000 households).
El Mina was populated by the city’s poorest residents; estimated average incomes were about US$0.50 per day. Housing consisted of temporary dwellings built of wood and scavenged materials. The community lacked public streets, lighting or electricity and drainage. Water was expensive (US$ 7/m3) and supplied by trucks and ambulatory vendors. Schools and health facilities were also absent and the lack of planning prohibited the circulation of emergency and waste collection vehicles.
Under the program, kebbe residents were eligible to receive a serviced plot in an upgraded site less than 1km away, along with microcredit loans for home improvement and due compensation for their existing property, provided they agreed to resettle at a nearby location. All plots in the new location would be less than 150 meters from a paved public road and a water tap. The new site also featured community buildings with latrines and a drainage system. Residents received legally‐recognized plots of 120m2 and access to subsidized credit to build a 20m2 cinder block house. The loan terms were a US$160 down payment and a required payment of US$10 per month for three years. Many households used their compensation to purchase the credit, while others rebuilt their previous homes on their new plots. In this way, the program allowed residents options in housing provision, actively supporting incremental and self‐help approaches. A 2007 survey of residents found that a majority of respondents reported an improvement in housing conditions (71 percent), access to transport (62 percent) and community cohesion (80 percent).
The project demonstrates the role that governments can have in improving access to quality housing without being a direct provider. Rather, the government subsidies were directed to poor households in the form of secure land plots, community infrastructure and support for credit. The US$95.5 million investment project directly improved a number of areas in the housing sector across Mauritania. Infrastructure upgrading, and tenure security improvements—like in the El Mina case—benefited 181,000 people. Additionally, the investment enhanced or created a total of 225,000 jobs and provided technical assistance to community organizations and NGOs to scale up and continue work for services and construction.
Sources: World Bank 2013c, 2014.

Stocktaking of the Housing Sector in Sub-Saharan Africa
40
4. Supply Issues and Affordability
Housing affordability is constrained by challenges to realizing key supply inputs. These inputs begin with the cost and time necessary for obtaining, transferring and developing land for residential use. Second, network infrastructure—such as roads, power, piped water, sewage/drainage and so forth to service residential land—is lacking and often expensive to build retroactively in settlements that do not have such connections and where rights of way has not been upheld. Most SSA countries also lack the institutions and capacities to capture land value in ways that can be used for these types of investments. Finally, the cost of building the dwelling is very high due to the cost of construction materials (such as cement) and the lack of a robust construction sector.
This section outlines the key issues of housing delivery from the supply side value chain in the region. The costs that each of these factors impose reduces the supply of land, constrains access to infrastructure and (by extension) the availability of finished, quality housing units for purchase. The scarcity of these inputs drives up the cost of formal housing for all residents, and the majority of low‐income and middle income groups are therefore forced to seek other housing options that are often of lower quality and may be without secure tenure.
A. Access to Land, Affordability of Land, and Security of Tenure Drive
Overall Housing Affordability
Tenure systems often do not support the emergence of land markets. This is because in many areas land is subject to tenure regimes that limit the ability of markets to circulate land or to define and protect development rights. These issues, however, are particularly complicated owing to the array of different tenure systems across the region and within individual countries, as well as the general lack of a consolidated, efficient land administration system in many countries.72 73 For example, customary tenure may only allow land to be acquired or transferred with the consent of a local tribal council or leader.74 In other countries, such as Ethiopia, the government has sole control of all land and ultimate control over land administration issues. Where land is expensive to acquire or where tenure rights are difficult to obtain and protect, housing costs will be high.
As with housing, the region has formal and informal land markets. UN‐HABITAT (2010) defines the “informal” land market as including a “variety of urban land transactions, exchanges and transfers that are not recognized by the state as legal, but which are nevertheless socially accepted as legitimate by a variety of urban actors”(UN‐HABITAT 2010: 21). Moreover, the informal land market in SSA has a significant number of market transactions that “are mediated more by social relationships than by a financial logic” (UN‐HABITAT 2010: 22). The boundary between these two markets is not always clear, because what counts as “formal” varies among and within countries.
Land rights derive from a plurality of authorities and may often be in conflict with one another. Rights to land in Africa can stem from multiple sources: first settlement rights, conquest, government allocation, “land to the tiller” policies, and market transactions. Moreover, these rights may be validated by a number of local and state authorities: community councils, local government, tribal leaderships, land agencies, and more.

Stocktaking of the Housing Sector in Sub-Saharan Africa
41
The two main tenure regimes are derived from common law and customary law systems. Many countries in Africa recognize both common law tenure (freehold or leasehold) and customary law tenure, though in a number of countries the latter is treated as secondary to the former. Customary law tenure, which is derived from traditional systems of tribal land‐holding, tends to treat land as collectively owned, making it difficult to sell and or collateralize on the open market.75 In a number of SSA countries, such as Mozambique, Angola, Ethiopia, and Zambia, much of the land is state‐owned, meaning that residents can sell property and other improvements on the land, but not the land itself.76 Urban land markets in Africa, both formal and informal, tend to be small by international standards.77 There is evidence, however, that the informal market for peri‐urban land is growing and land prices are rising.78 As cities grow, the demand to convert customary agricultural land for urban uses—either through formal or informal means—will be a source of political and social conflict.
Customary land holding norms are often so important to social cohesion that they are protected in the constitution of many countries. Even where they have officially been superseded by state control (e.g., in Nigeria, Ethiopia, Lesotho, urban areas in Zambia and Malawi), customary land‐holders have great influence on who resides in their area of jurisdiction even though they exercise no legal rights. In Lesotho, all land was nationalized in 1979, but chiefs still issue backdated leases. In Nigeria, land officially belongs to the state, but land‐holding communities are more likely to sell their land informally than to await government compensation. In Ghana, land‐holding chiefs have maintained their rights and have become major players in urban land allocation and control. There, customary land holding is seen as both progressive and egalitarian, with built‐in checks and balances in contrast to overly bureaucratic and corrupt ‘modern’ systems.79 Informal land holding may also be more gender‐sensitive, privileging widows’ or orphans’ rights over extended family claims, as is the case in Malawi.80
The limited market circulation of land directly influences the housing finance market. In a market economy, land is less liquid than other assets because it has a fixed location and plots are imperfect substitutes. Customary tenure reduces the liquidity of land even further. In Ghana, for example, even where a household has secure leasehold rights of use on their land, it is not likely to be used as collateral because households are reluctant to risk losing it.81 Across the continent in Kenya, only 23.7 percent of the population is willing to use their home as collateral for borrowing.82 In addition, many of the customary land transactions are not arms‐length. Thus, even though customary law may provide secure tenure, the land could not be accepted as collateral by a bank because its repossession would be difficult. This would add to the time and cost necessary for the bank to dispose of the land in order to recover the loss of the loan. This is the case among housing microfinance officials in Ethiopia, who will do anything they can to avoid repossessing land if there is a loan default.83 Even where there is a clear foreclosure process, as in the case of Tanzania, jurisdiction may be ambiguous and therefore banks don’t trust the collateral value.84 In Mozambique, while traditional authorities are effective in administering tenure rights, it remains difficult to use such land to secure mortgages.85
A.1. The plurality of tenure systems, even within a single country, complicates access to land
The relationship between common and customary land law is ambiguous in many countries. Customary land rights, which are controlled by a system of typically unwritten customary laws that are administered through the hierarchy of a social or political unit,86 dominate the land systems of many SSA countries. For example, in Malawi, 90 percent of the land is customary land, although there are no legal documents specifying what this means, so land falls under dispute and cannot be easily collateralized.87 Similarly, in Botswana, 71 percent of the land is held under tribal control.88 Most land in Swaziland, even in peri‐urban areas, is considered “Swazi Nation Land,” held by tribes; converting such land requires the consent of the king and rarely occurs.

Stocktaking of the Housing Sector in Sub-Saharan Africa
42
Parallel systems of land administration cause complications in tenure security and establishment of development rights. For instance, Cameroon is a bi‐jural state as it inherited foreign systems from both French and British colonial administrations. Consequently, these two different legal systems operate concurrently in different parts of the country along with a customary system. In Cameroon, most land is still held under customary tenure arrangements and administered by traditional rulers. In Douala, an estimated 80‐94 percent of land transactions take place under this system.89 In Mali, Durand‐Lasserve, et al. (2015) identify three parallel systems of land delivery in Bamako, each with different gradations of formality and security of tenure. While the law allows for customary land in Bamako to be converted for agricultural use, in practice it is acquired exclusively for residential development on the urban fringe.
A.2. Governments struggle to establish consolidated, efficient land administration systems, despite promising reforms made in recent years.
Land administration systems do not adequately record tenure claims. The principal obstacles to improved land governance in SSA include: land grabs, poor documentation, inefficient land administration, a lack of transparency, and low capacity and demand for professional land surveyors.90 Many African governments utilize local registration databases, as they do not have the capacity to set up a central system, but this decentralization renders the process more vulnerable to capture by local elites.91 Paper‐based systems and deeds registries (rather than land registries) break down during conflicts as evidence of land title is lost by owners. Post‐conflict restoration is complex, expensive, and may become socially divisive as those who have developed land stand to lose it to earlier owners whose claims might be tenuous. Deeds are also relatively simple to forge, as in the case of Liberia.92
Box 8. Transparency in Public Land Management: The Case of Nigeria
Nigeria exemplifies how land administration is prone to inefficiency and a lack of transparency. At the state level, limited capacity and a lack of transparency often impede land development. The states own land, but the mechanisms for generating revenue from land are underdeveloped or undermined by complex local tenure arrangements and lack of property registration. As such, a number of state governments harbor little interest or ability to use land value capture to address the housing and infrastructure needs of the urban poor because they have neither the regulatory tools nor the incentives to do so.
Urban land owned by the offices of specific title holders, such as Presidents and state governors, raises questions of transparency.a Such land can be distributed as gifts to individuals and organizations, which makes public land susceptible to use for patronage and political reward rather than for public benefit. Reducing governors’ control over land supply, particularly in urban areas, is proving a huge challenge for the national legislators, with too little progress made towards a proposed Land Use Amendment Act. Nigeria has laws specifying that rent charged for occupying state‐owned land should be used for community investments. This is currently set at a very low rate, and mostly it is not collected, as most properties are not registered with a Certificate of Occupancy. Many agencies are attempting to address this problem with land information systems and land registration programs, but these improvements take a long time during which significant revenue may be foregone.
Finally, the uneven implementation of the 1978 Land Use Act (LUA) appears to encourage unplanned and informal expansion in urban areas. Land allocation procedures are not well known and subject to capture by local elites and special interests who can use the law for their benefit. The LUA provisions also limit the compensation for compulsorily acquired land to a “cost” estimate rather than a market valuation. This distorts land and property markets in areas that may be subject to government land acquisition for public use.
Source: World Bank Nigeria case study. Note: a. British Colonial “crown land” was transformed into the virtually personal property of the head of state. Crown land is, in fact, governed by Parliament in the British Constitutional Monarchy.
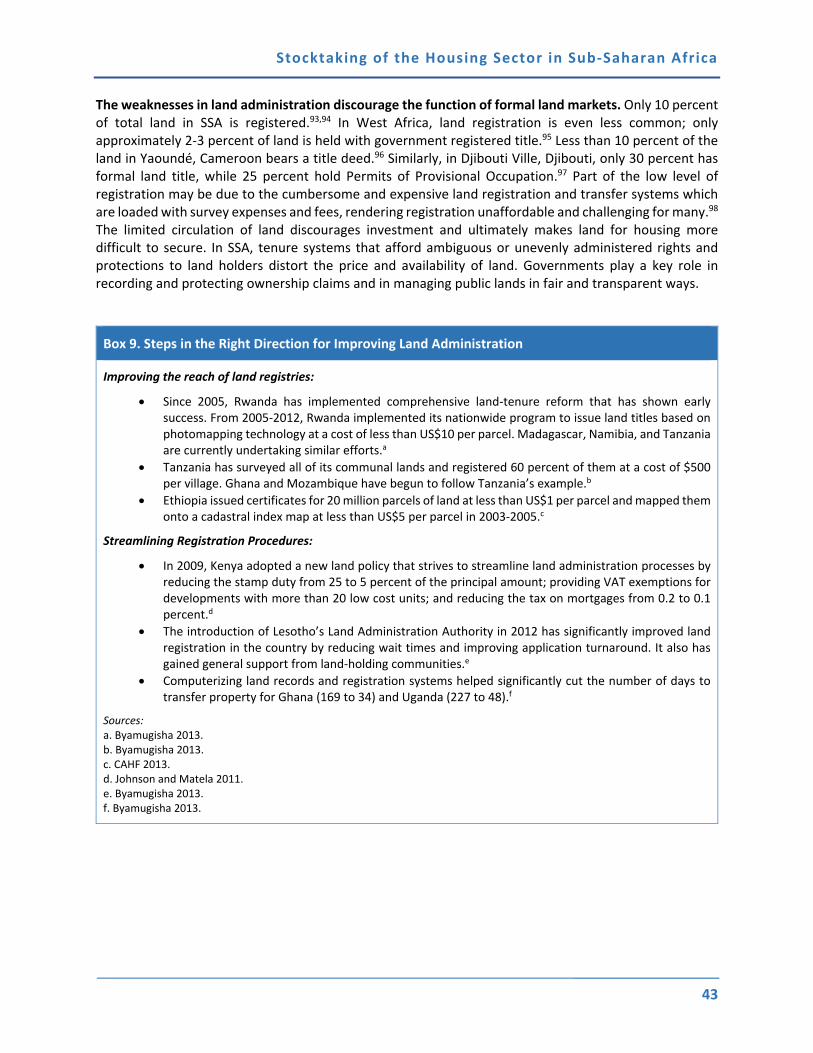
Stocktaking of the Housing Sector in Sub-Saharan Africa
43
The weaknesses in land administration discourage the function of formal land markets. Only 10 percent of total land in SSA is registered.93,94 In West Africa, land registration is even less common; only approximately 2‐3 percent of land is held with government registered title.95 Less than 10 percent of the land in Yaoundé, Cameroon bears a title deed.96 Similarly, in Djibouti Ville, Djibouti, only 30 percent has formal land title, while 25 percent hold Permits of Provisional Occupation.97 Part of the low level of registration may be due to the cumbersome and expensive land registration and transfer systems which are loaded with survey expenses and fees, rendering registration unaffordable and challenging for many.98 The limited circulation of land discourages investment and ultimately makes land for housing more difficult to secure. In SSA, tenure systems that afford ambiguous or unevenly administered rights and protections to land holders distort the price and availability of land. Governments play a key role in recording and protecting ownership claims and in managing public lands in fair and transparent ways.
Box 9. Steps in the Right Direction for Improving Land Administration
Improving the reach of land registries:
Since 2005, Rwanda has implemented comprehensive land‐tenure reform that has shown early success. From 2005‐2012, Rwanda implemented its nationwide program to issue land titles based on photomapping technology at a cost of less than US$10 per parcel. Madagascar, Namibia, and Tanzania are currently undertaking similar efforts.a
Tanzania has surveyed all of its communal lands and registered 60 percent of them at a cost of $500 per village. Ghana and Mozambique have begun to follow Tanzania’s example.b
Ethiopia issued certificates for 20 million parcels of land at less than US$1 per parcel and mapped them onto a cadastral index map at less than US$5 per parcel in 2003‐2005.c
Streamlining Registration Procedures:
In 2009, Kenya adopted a new land policy that strives to streamline land administration processes by reducing the stamp duty from 25 to 5 percent of the principal amount; providing VAT exemptions for developments with more than 20 low cost units; and reducing the tax on mortgages from 0.2 to 0.1 percent.d
The introduction of Lesotho’s Land Administration Authority in 2012 has significantly improved land registration in the country by reducing wait times and improving application turnaround. It also has gained general support from land‐holding communities.e
Computerizing land records and registration systems helped significantly cut the number of days to transfer property for Ghana (169 to 34) and Uganda (227 to 48).f
Sources: a. Byamugisha 2013. b. Byamugisha 2013. c. CAHF 2013. d. Johnson and Matela 2011. e. Byamugisha 2013. f. Byamugisha 2013.

Stocktaking of the Housing Sector in Sub-Saharan Africa
44
Box 10. Options for Improving Tenure Security for Informally Settled Populations
In 2012, Namibia passed the Flexible Land Tenure Act, which allows communities to obtain blocks of multiple plots and a “starter title” that grants perpetual occupancy and transfer rights. This Act is aimed at the 30 percent of Namibian residents that live in informal settlements.a Residents can also apply for full, mortgageable land titles. Upon receipt of title, the communities are responsible for upgrading the site infrastructure. The legislation has been regarded as innovative in its recognition of incremental tenure and building methodology.b
In 2011, Senegal passed a new Land Tenure Act under which those with temporary occupancy permits in urban areas can convert the permits into permanent title deeds at no cost. Improved tenure security further helps increase housing investment and improvement, access to housing finance, and the activity of the formal land market.
Kenya, Lesotho, and Tanzania are utilizing bulk surveying and land use planning approaches to regularize tenure in slums.c
Sources: a. CAHF 2013. b. Byamugisha 2013. c. Byamugisha (2013).
A.2. Planning regulations can increase the cost of formal housing.
Regulations of building material types, construction permits, minimum lot sizes, and density can unnecessarily add to the cost of construction. This encourages the creation of informal housing and leads to inefficient urban spatial development. Many governments often insist on using formal building technologies that may not be locally sourced, cost‐effective, or sustainable.99 In addition to the risks of corruption, the added costs are also driven by outdated building regulations that are material‐specific rather than performance‐based. This is the case for Ethiopia and many other SSA countries in that such regulations do not adapt to alternative technologies or building techniques, limiting the use of readily available local materials which are proven to be durable and safe when used properly. Local building materials, though capable of high performance standards,100 are often regarded as unworthy of urban use and outlawed from the formal sector.
Obtaining property registration and construction permits in SSA is more costly than in other regions. Registering property in SSA is generally more time consuming and costly (relative to property value) than in other regions of the world, while dealing with construction permits is fairly quick but still costly (relative to income per capita). Figure 17 below depicts the average time and cost to register property101 in Sub‐Saharan countries and international benchmarks. The overall mean for SSA is 57.5 days and 8.3 percent of property value, which is over twice that of Europe/Central Asia (22 days and 2.6 percent of property value) and OECD high‐income countries (21.8 days and 4.2 percent of property value). While SSA does not rank the highest among regions for the number of days to register property, it does entail the highest cost as a percent of property value. Figure 18 displays the international rankings of each SSA country for ease of registering property. Rwanda ranks highest at 12, with Botswana in second at 70. Togo ranks the lowest at 182.

Stocktaking of the Housing Sector in Sub-Saharan Africa
45
Figure 17. Average Time and Cost to Register Property in Sub-Saharan African Countries and International Benchmarks
Source: World Bank 2015b.
Figure 18. Ease of Registering Property Rankings for Sub-Saharan African Countries
Source: Generated using data from World Bank 2015b.
0
4
8
12
16
20
24
0
50
100
150
200
250
300Angola
Benin
Botswana
Burkina Faso
Burundi
Cabo Verde
Cam
eroon
Central African
Republic
Chad
Comoros
Congo, D
em. R
ep.
Congo, R
ep.
Côte d'Ivoire
Eritrea
Ethiopia
Gabon
Gam
bia, The
Ghana
Guinea
Guinea‐Bissau
Ken
yaLesotho
Liberia
Madagascar
Malaw
iMali
Mauritania
Mauritius
Mozambique
Nam
ibia
Niger
Nigeria
Rwanda
São Tomé and Principe
Senegal
Seychelles
Sierra Leo
ne
South Africa
South Sudan
Sudan
Swaziland
Tanzania
Togo
Uganda
Zambia
Zimbabwe
East Asia & Pacific
Europe & Central Asia
Latin America &…
Middle East & North…
OEC
D high income
South Asia
Sub‐Saharan
Africa
Cost (% of property value)
Time (days)
Time Cost
0
50
100
150
200
Rwanda
Botswana
Cabo Verde
Ghana
Sudan
Malaw
i
Burundi
Mauritius
Mauritania
South Africa
Mozambique
Lesotho
Côte d'Ivoire
Swaziland
Zimbabwe
Ken
ya
Uganda
Comoros
Gam
bia, The
Niger
Tanzania
Congo, D
em. R
ep.
Mali
Ethiopia
Guinea
Burkina Faso
Guinea
‐Bissau
Senegal
Chad
Zambia
Sierra Leo
ne
Madagascar
São Tomé and Principe
Congo, R
ep.
Cen
tral African
Rep
ublic
Angola
Ben
in
Gabon
Nam
ibia
Cam
eroon
Eritrea
Liberia
South Sudan
Nigeria
Togo
Ranking (out of 189)

Stocktaking of the Housing Sector in Sub-Saharan Africa
46
Policymakers have taken steps to reduce costs and streamline procedures for property registration. Although from 2012 to 2013 SSA implemented the most reforms to improve the ease of registering property, the region has recently fallen in rankings from 127 to 136 in the last year. There are still notable success stories. For example, over the past decade Rwanda reduced the time to transfer a property from more than a year to just one month, by implementing a computerized land administration system. Burundi recently made big strides by creating a one‐stop shop for property registration that consolidated the activities of the municipality, the revenue authority, and land registry. Elsewhere, Kenya introduced a unified form for land registration; Côte d’Ivoire digitized its land registry system; Guinea‐Bissau opened notary offices to handle property transactions; Lesotho eliminated ministerial approval on property transactions and hired new staff at the registry; Uganda introduced an online stamp duty certification system to save time; Cape Verde and Liberia digitized their land registries; and Guinea and Senegal both lowered their transfer taxes by five percentage points.102
The high costs of construction permits discourage informal developers from obtaining them. Figure 19 shows the average time and cost to obtain a construction permit in Sub‐Saharan Africa.103 The overall mean for SSA to obtain a construction permit for a warehouse is 162.2 days and 6.6 percent of the warehouse value. SSA’s average time is comparable to other regions, and lower than that of South Asia, Latin America/Caribbean, and Europe/Central Asia. However, its average cost is second only to South Asia, and nearly 4 times the percentage of the OECD high‐income countries (1.7 percent of the warehouse value).
Figure 19. Average Time and Cost to Obtain a Construction Permit in Sub-Saharan Africa and International Benchmarks
Source: Generated using data from World Bank 2015b.
Minimum lot sizes in Africa tend to be high, both in observation and as per existing planning regulations. Large plot sizes increase the cost of infrastructure provision and reduce urban density. It can also discourage private investment in housing where land costs and floor to area (FAR) ratios make such projects financially unfeasible. Table 5 compares minimum lot sizes for residential plots across five SSA countries. In each case, lot sizes for high density uses are a fraction of the size of low density minimums; in Malawi, sites and service neighborhoods have standards that permit 26 times more density than is
0
8
16
24
32
40
0
100
200
300
400
500
Angola
Benin
Botswana
Burkina Faso
Burundi
Cabo Verde
Cam
eroon
Central African…
Chad
Comoros
Congo, D
em. R
ep.
Congo, R
ep.
Côte d'Ivoire
Ethiopia
Gabon
Gam
bia, The
Ghana
Guinea
Guinea‐Bissau
Ken
yaLesotho
Liberia
Madagascar
Malaw
iMali
Mauritania
Mauritius
Mozambique
Nam
ibia
Niger
Nigeria
Rwanda
São Tomé and…
Senegal
Seychelles
Sierra Leo
ne
South Africa
South Sudan
Sudan
Swaziland
Tanzania
Togo
Uganda
Zambia
Zimbabwe
East Asia & Pacific
Europe & Central Asia
Latin America &…
Middle East & North…
OEC
D high income
South Asia
Sub‐Saharan
Africa
Cost (% of wareh
ouse value)
Time (days)
Time Cost
Stocktaking of the Housing Sector in Sub-Saharan Africa
47
allowed in low‐density minimum standards. Such large lots may be affordable in rural areas where land is inexpensive and agriculture is an important subsistence strategy, but such large lots in urban areas inevitably contribute to low density expansion and increased infrastructure costs when coupled with high population growth.
Table 5. Minimum Plot Sizes for Residential Uses (m2)
Ghana* Liberia Malawi Zambia Lesotho
Low density/High cost 1,880 1,012 5‐6,000 1,350 1,000
Medium density/Medium cost N/A 506 1‐2,000 540 N/A
High density/ Low cost 350 253 225† 288 375
Source: Generated using data from UN‐HABITAT Urban Housing Sector Profiles. Note: * Low density plots in Tesano CFC estate and the minimum legal plot size. † Minimum in Tradi onal Housing Areas, Malawi’s very successful version of ‘sites and services’ neighborhoods.
Large lot sizes increase the price of obtaining land and housing in urban areas. In Accra, Ghana for example, the minimum plot size required for construction is official 450m2—a large and often prohibitively costly size for most to acquire (UN Habitat 2011). Across the region, plot sizes of less than 200 m2 are uncommon; 400 m2 is the minimum in Lesotho, 288 m2 the minimum in Zambia. This drives low‐income households and informal home construction to the edges of the city where land is less expensive to acquire. As there is no serviced land at the periphery, this exacerbates the vulnerability of these populations. Strict density regulations, particularly in city centers, also negatively effect mobility. Low density can result in large welfare costs of 3‐6 percent of average household consumption or more due to longer commute times and energy wasted through poor building design and incomplete or poor infrastructure connections.104 Such unrealistic building and land regulations encourage the informal housing because the cost of compliance is much greater than the perceived negative consequences of informality.105 Ethiopia’s experience with local development plans suggests that graduated or context‐specific standards, particularly in the smaller cities, towns, and peripheral areas, can offer greater affordability and provide an adequate construction standard.
A.3. Conclusion
Complete and accurate tenure and cadaster records support investment in and exchange of land and property. Multiple tenure systems limit the scope of markets to value and exchange land according to price signals. This is exacerbated where permissions to obtain, transfer or retain land are given arbitrarily and without transparency. The inability to provide a discrete and objectively verifiable boundary for a piece of real estate property in much of SSA represents a major obstacle to the use of mortgage finance as a form of security to enable capital to flow into residential property. However, throughout the world, there is ample evidence that occupancy, use, and ownership of land was bought and sold and traded before there were formal title deeds, plats and surveys, or cadasters—and in such cases the registration and record came later.106 Recent reforms in a number of countries in the region also demonstrate that land administration reforms can both improve the quality of land registries and streamline the procedures required to obtain or transfer land.
Yet there remain significant challenges to implementing land reforms, especially in urban areas. Satellite and GPS technologies are promising tools to lower the cost of completing accurate land registries. However, in urban areas where there is a concentration of land and buildings, and a large volume of

Stocktaking of the Housing Sector in Sub-Saharan Africa
48
property transactions, accurate cadaster and registry systems may take many years to complete. To make land work for housing investment, first, it may be worth exploring alternatives using a non‐cadastral form of registration, or documentation of economic ownership could be the basis for a collateral‐based or partially‐collateralized form of formal or semi‐formal finance. Second, land administration reforms also require complementary changes in legal and professional institutions. This includes regulations (clarity of transfer procedures and rights), surveying records and procedures (cadaster and other forms of official record ownership), state institutions (e.g. title registries), professional intermediaries (e.g. notaries, attorneys), financial risk mitigation (e.g. title insurance), and governance (e.g. proper enforcement of entitlement, foreclosure, and eviction laws applicable to an individual country). Each of these requires an important and informed government involvement, both at national and local level, given the important role assigned to local governments in land management in many countries across the region.
The time and costs required to meet construction and development standards discourage informal sector developers from meeting them. This arises partly because the enabling environment—laws, regulations—is structured on the implicit assumption that property is formal and building codes must apply to all forms of construction. The result is per‐activity costs that render smaller formal housing unaffordable while smaller informal housing is affordable. The cost and availability of quality construction materials is also a major impediment to reducing housing costs. There are few local production sources for high quality construction materials, and government and private sector developers tend to prefer imported materials. Imported materials ultimately increase the cost of housing for consumers, which in turn perpetuates the housing affordability gap; self‐builders cannot afford materials necessary to meet standards and developers must include the cost of materials in the final price of a complete house, which raises the price. The lack of skilled architects, construction managers and laborers reduces the quality and consistency of the housing stock and limits the potential to develop economies of scale in housing development.
B. Infrastructure Provision is Scarce and Lags behind Housing
Development
Cities are attractive for people and investment because of their agglomeration and economies of scale. The density and diversity of urban areas improves economic gains and enhances the frequency and variety of social interactions. The spatial proximity also makes the provision of infrastructure cost‐effective for governments and beneficial for local economies. Infrastructure refers broadly to the physical or systems support for urban economy and society, and includes (a) aggregation of clean water, (b) sanitation and removal of human waste, (c) maintained roads107 plus higher‐volume modes (e.g. trains, streetcars), (d) non‐revenue social amenities (e.g. parks), (e) power supplies (especially electricity), and (f) extended‐coverage networks that run the infrastructure from its place of origin or collection (reservoir, landfill, hub, power plant) throughout the city. These networks can expand efficiently when marginal cost to include an additional beneficiary is low.
Infrastructure is under-supplied in poor and informal settlements. In SSA, such infrastructure is scarce and is directly linked to informal housing conditions found throughout the region. Regionally, less than 40 percent of all households have access to piped water, and the dearth of these amenities is particularly acute in rural regions.108 The infrastructure gap in Africa is greater than that of low‐income countries elsewhere, especially when it comes to paved roads, phone mainlines, and power generation capacity (Table 6).109 Infrastructure has high upfront capital costs, which governments often cannot afford. Public investments in infrastructure are often directed to those with land title and formal homes, such as those

Stocktaking of the Housing Sector in Sub-Saharan Africa
49
built by social housing programs or large private developers. Experience with sites and services programs meant to benefit the poor finds that infrastructure investments drive land speculation and eventual displacement, as middle‐ and upper‐income groups displace lower‐income groups that the interventions were intended to help.
Land is seldom used as a means to finance capital investments in infrastructure. In many cities across the world, local governments accommodate urban growth through the use of various land value capture instruments, such as fees and property taxes to pay for service provision. Yet in SSA, most cities lack the capacity to use land as a source of revenue, either through laws that prohibit or minimize land fees or taxation. Even if such laws were in place, weak fiscal cadaster records and capacities and a reliance on central government transfers reduce the ability and incentives for cities to leverage land for these purposes.
Table 6. Africa's Infrastructure Deficit
Normalized units Sub-Saharan Africa LICs Other low-income countries
Paved road density 31 134
Total road density 137 211
Mainline density 10 78
Mobile density 55 76
Internet density 2 3
Generation capacity 37 326
Electricity coverage 16 41
Improved water 60 72
Improved sanitation 34 51
Source: Foster 2008. Note: Road density is in kilometers per kilometer squared; telephone density is in lines per thousand population: generation capacity is in megawatts per million population; electricity, water and sanitation coverage are in percentage of population. LIC = low‐income country.
Across the region, recent data suggests that infrastructure coverage overall is actually declining. In 2010, when the urban population reached 37 percent, only 34 percent of urban residents had access to piped water, down from 43 percent in 1990.110 In many of the larger SSA cities, up to around 1950, developed areas tended to be fully serviced. However, as these cities rapidly grew in the pre‐ and post‐independence period, service provision fell behind development, particularly in the informal areas. In these areas, houses are often built before the plot is hooked up to water, electricity, and sanitation. The sequence of infrastructure planning and investment in informal settlements is the opposite of that in wealthier neighborhoods. The formal process of plan‐service‐build‐occupy is reversed into occupy‐build‐service‐plan.111 In this way, cities are being built “back to front,” as characterized in a recent study by the African Development Bank (AfDB 2015). Infrastructure coverage in SSA is mostly the preserve of upper classes, although coverage is not universal among the affluent. For the poorest 60 percent, coverage is less than 10 percent for most infrastructure services (Figure 20).
The cost of extending services to developed informal areas can increase the price of housing. Even in formal development, services are often promised for when development begins, but may take months or
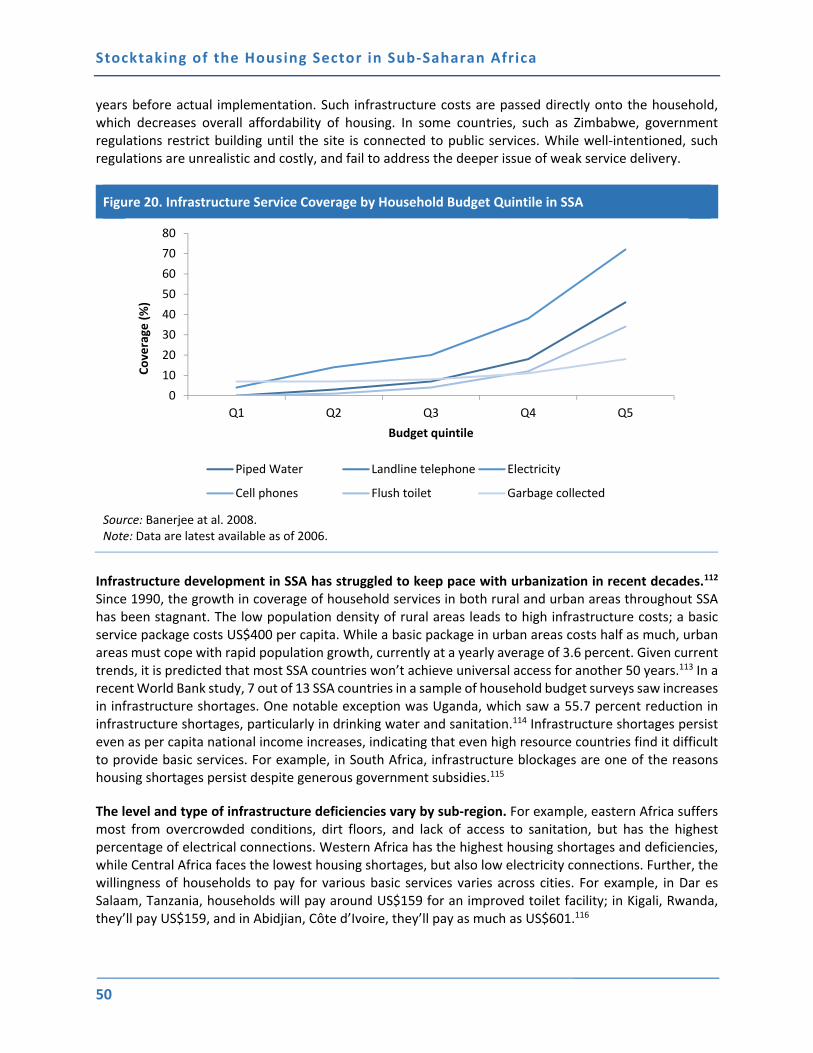
Stocktaking of the Housing Sector in Sub-Saharan Africa
50
years before actual implementation. Such infrastructure costs are passed directly onto the household, which decreases overall affordability of housing. In some countries, such as Zimbabwe, government regulations restrict building until the site is connected to public services. While well‐intentioned, such regulations are unrealistic and costly, and fail to address the deeper issue of weak service delivery.
Figure 20. Infrastructure Service Coverage by Household Budget Quintile in SSA
Source: Banerjee at al. 2008. Note: Data are latest available as of 2006.
Infrastructure development in SSA has struggled to keep pace with urbanization in recent decades.112 Since 1990, the growth in coverage of household services in both rural and urban areas throughout SSA has been stagnant. The low population density of rural areas leads to high infrastructure costs; a basic service package costs US$400 per capita. While a basic package in urban areas costs half as much, urban areas must cope with rapid population growth, currently at a yearly average of 3.6 percent. Given current trends, it is predicted that most SSA countries won’t achieve universal access for another 50 years.113 In a recent World Bank study, 7 out of 13 SSA countries in a sample of household budget surveys saw increases in infrastructure shortages. One notable exception was Uganda, which saw a 55.7 percent reduction in infrastructure shortages, particularly in drinking water and sanitation.114 Infrastructure shortages persist even as per capita national income increases, indicating that even high resource countries find it difficult to provide basic services. For example, in South Africa, infrastructure blockages are one of the reasons housing shortages persist despite generous government subsidies.115
The level and type of infrastructure deficiencies vary by sub-region. For example, eastern Africa suffers most from overcrowded conditions, dirt floors, and lack of access to sanitation, but has the highest percentage of electrical connections. Western Africa has the highest housing shortages and deficiencies, while Central Africa faces the lowest housing shortages, but also low electricity connections. Further, the willingness of households to pay for various basic services varies across cities. For example, in Dar es Salaam, Tanzania, households will pay around US$159 for an improved toilet facility; in Kigali, Rwanda, they’ll pay US$159, and in Abidjian, Côte d’Ivoire, they’ll pay as much as US$601.116
0
10
20
30
40
50
60
70
80
Q1 Q2 Q3 Q4 Q5
Coverage
(%)
Budget quintile
Piped Water Landline telephone Electricity
Cell phones Flush toilet Garbage collected

Stocktaking of the Housing Sector in Sub-Saharan Africa
51
Additionally, the cost of infrastructure connections in SSA is high by global standards.117 For example in 2013, the cost for connecting a single warehouse to a power supply in SSA was US$38,500, which was the highest in the world (Figure 21). South Asia had the lowest cost, at US$19,112.
Figure 21. Average Cost to Connect to Electricity for Businesses by Region
Source: World Bank 2015b.
Overall, the Africa Infrastructure Country Diagnostic (AICD) estimates that an annual investment of US$93 billion over the next 10 years will be needed to close the infrastructure gap with other regions and meet its stated development goals; water supply and sanitation alone will require US$21.9 billion a year.118 Currently, Africa invests US$45 billion a year in infrastructure, two thirds of which originate from taxes and user charges. Roads and water tend to be financed via development aid from Organization of Economic Cooperation and Development (OECD) countries. Private financing, seeking the highest and safest returns, concentrates on information and communication technology in countries that are middle‐income or resource rich. Fragile low‐income countries receive little financing from any source (Figure 22).119
In SSA, the public sector usually oversees infrastructure development. Since infrastructure is a welfare good, governments often price‐control service providers, making the business unprofitable and unattractive to the private sector. The quality of public sector infrastructure provision has been mixed, as governments in SSA often do not coordinate these basic services as part of long term urban planning.120 Instead, infrastructure building is primarily project‐driven, especially where foreign investment is involved.
Overall, it is estimated that Africa’s infrastructure providers waste US$7.5 billion a year in the following ways: overstaffing (usually in state‐owned enterprises); distribution losses due to poor network maintenance; revenue under‐collection due to social and political impediments to service disconnection; and deferred maintenance leading to excess capital spending on reconstructing existing assets.121
0
500
1,000
1,500
2,000
2,500
3,000
3,500
4,000
4,500
Sub‐SaharanAfrica
South Asia Middle East &North Africa
East Asia &Pacific
Latin America& Caribbean
Europe &Central Asia
OECD highincome
Cost (% of income per capita)
Region

Stocktaking of the Housing Sector in Sub-Saharan Africa
52
Figure 22. Sources of Financing for Capital Investment in Infrastructure in Africa
Source: African Development Bank Group 2011.
B.1. Conclusion
Infrastructure is a key component for encouraging housing investment and improving the quality of life in informal settlements. However, in many parts of urban SSA, the development of land often long precedes the extension of infrastructure and public services to informal settlements. The pattern of urban growth is: (1) economic expansion; (2) immigration (usually rural to urban); (3) an increase in informal housing and demand for services; (4) overload of the established infrastructure grids; and (5) the continued expansion of informal areas beyond the grid footprint. Infrastructure extension to these areas then proceeds incrementally through connecting households nearest the grid and slowly moving outward. The retroactive extension of network infrastructure connections to these areas can be both disruptive to residents and expensive for governments. The declining access to services speaks to the importance of establishing proper rights of way and prioritizing infrastructure expansion during the current rapid urban growth that Africa is experiencing. It also underscores the important link between reliable tenure security and improved access to services, since most utilities are unlikely to expand services in areas with unclear and insecure tenure systems.
Infrastructure has both high establishment costs and high network-effect value. However, these costs should be considered alongside the immediate and long‐term alternative costs borne by residents in informal settlements. For example, informal settlements must rely on alternatives such as trucks or kiosks for water, which are often more expensive than piped water tariffs. Similarly, a lack of adequate sewage and drainage systems increases the risks of contamination and flooding. Given the expenses of alternative sources of water and power, evidence suggests that infrastructure provision in low‐income communities is a supply, rather than a demand issue. Cities should not seek to stop immigration or urban growth, but rather plan to accommodate expansion by establishing public rights of way for future roads and trunk infrastructure and allow informal settlements to establish connections to trunk lines through targeted subsidies.

Stocktaking of the Housing Sector in Sub-Saharan Africa
53
Extending infrastructure to informal settlements requires a clear understanding of local resident priorities. It is also important to engage civil society and stakeholder groups in order to better understand local needs and to refine potential beneficiaries of subsidies and targeted investments. This would consist of a sequence of (1) land and household enumeration, (2) household registration and establishment of street addresses, mail and other services, (3) extension of grid networks so as to encourage community‐level pooling and rationalization of wiring, pipes, and neighborhood alley paving, and (4) periodic public investment in the retrofitting of limited municipal infrastructure. This approach, in line with parallel land administration and urban planning interventions, would provide a foundation for larger scale infrastructure upgrades in informal settlements. In this process, it is critical that local governments are sufficiently capacitated to manage, oversee and coordinate the provision of services within their jurisdiction and in close coordination with national utilities. Local governments with significant capacity constraints (financially, administratively, and in terms of supervision) or working within a contradictory or constraining legal framework will not be able to sufficiently deliver on these key tasks.
Governments can play a role in developing targeted subsidies and supporting private sector involvement in infrastructure provision. On the institutional side, governments can prioritize infrastructure investments to low‐income and service‐deficient informal settlements (such as subsidies for hookup costs) using explicit targeting criteria. Similarly, coordination between local and national governments can improve the system of transfers or fiscal autonomy for the use of tax revenue in order to invest in service delivery based on these criteria. Governments can also support the diversification of service delivery channels by reforming the scope of governance and activity of state‐owned enterprises in order to promote more competition and private sector participation. This can include the use of incentive‐based performance contracts and public‐private partnerships leveraging subsidies to stimulate private capital investments. A system of external audits with published results can ensure transparency in each of these areas.
C. The Cost of Formal Construction Is High Relative to
Household Incomes
In SSA, the cost of formal construction is high relative to household incomes due to factors like the high cost of formal building materials and inefficient building regulations and processes. Buildings that are delivered by the formal construction sector and meet all applicable planning and permitting standards are much less common than those built informally. Instead, the informal building materials and construction sector dominates home construction. Most homes are self‐built or built by informal contractors using inexpensive traditional materials, do not meet formal building standards, and are constructed incrementally over extended periods of time.
C.1. With the high cost of formal building materials, many homes are constructed from “informal” materials.
The scarcity of quality construction materials contributes significantly to the high cost of housing. A key obstacle to closing the gap is the high cost of standardized construction materials, which can easily add up to 80 percent of the value of a house in the region.122 In Kenya for example, construction materials alone may comprise 40 percent of the cost of a formal house (AfDB 2015). This is owing to a dysfunctional building materials industry that suffers from poor productivity, low diversification, and limited technological capacity.123 Competition, especially on the domestic front, is low but concentrated, which makes the barriers to entry too high for new firms. Many countries opt to import materials despite the

Stocktaking of the Housing Sector in Sub-Saharan Africa
54
existence of domestic resources, which distorts the local market by raising prices for substitute materials that might otherwise be less expensive to produce locally.124
For example, while the cement industry is growing in response to these market pressures, costs still vary widely from country to country. Varying infrastructure and domestic production capacities may be a factor; countries with less developed roads and less established domestic cement industries will naturally face higher prices.125 Furthermore, cement companies’ dependence on fuel imports for power generation renders them vulnerable to the rise and fall of international energy prices.126 In Nigeria, power generation accounts for 70 percent of production costs; the price of a 50 kilogram bag of cement is US$10, double the price of that in the United States.127
Figure 23. Average Price of 50 kg Bag of Cement in SSA
Sources: Cement prices from email surveys in 2010‐2013; email from AfriSam; CAHF research.
Durable materials like cement and new low cost technologies have not reached low-income households. However, even with increasing domestic production capacity, it is not likely that cement or other such durable materials will become the material of choice for most households in SSA. Instead, the majority of SSA homes are currently self‐built with materials that may be “temporary” or “traditional” or “semi‐permanent.” These materials vary in every country, but typically include mud, wood, plants, straw, clay, and sheet metal. Such materials often do not live up to formal building standards, but are inexpensive and abundant and thus form the core of most informal, affordable homes in SSA:
In Burundi, 70% of homes are built with adobe brick; 30% are covered in tiles and sheets; and 70% are covered in straw and plant leaves.128

Stocktaking of the Housing Sector in Sub-Saharan Africa
55
Over half of the housing Gambia is built with semi‐permanent materials.129
In Kenya, 70% of Nairobi housing is 10 m2 shacks built with wood, mud, tin sheets, and wattle.130,131
Nearly 40% of Namibians use found materials to build their homes.132
70% of houses in Uganda are built with temporary building materials.133
In Malawi, 66% live in traditional housing, 15% live in semi‐permanent housing, and 18% live in durable, permanent housing.134
While these materials are not preferred by many governments, experience shows that they can be durable in addition to being inexpensive and locally sourced. For example, the ubiquitous termite hills on Zambia’s Copperbelt are now being quarried for their fine clay to be burnt into bricks in an informal‐sector industry.135 Recognizing the importance of these materials to the affordable housing sector, Cameroon established a Local Materials Promotion Authority (MIPROMALO) to promote the use of locally manufactured materials that reduce the cost of housing.
C.2. There is a shortage of formally qualified construction firms.
The construction industry in many SSA countries lacks a mid-level supply market. There are a few major companies that are capable of fulfilling large‐scale, high‐value contracts and thousands of small firms or single artisans, for smaller low cost jobs. However, there are few or no firms in the middle. Smaller firms do not typically receive government contracts and receive little technical training from the government.136 Further, much formal construction is done by foreign firms: in 2013, 37 percent of projects were built by US/European contractors, 12 percent by Chinese companies, and the remaining half by various contractors from countries like Japan, the Republic of Korea, Brazil, Australia, and South Africa.
The formal and informal construction sectors often draw on the same labor pool. Often, it is difficult to separate informal contractors from other firms involved in housing construction. Formal private contractors are quite likely to draw from the same labor and skills pool as the informal sector. For large jobs, it is not uncommon for firms to go to particular places in the cities where construction labor gathers at the beginning of the day, often presenting their tools as an indication of their skills as carpenters, plasterers, and tilers. Such collaboration indicates that the formal‐informal locus is a continuum; firms, artisans and laborers move in and out of formality depending on the job being done. There is also significant crossover between formal and informal actors in government projects for housing and infrastructure,137 and in a number of cases, such collaboration has been beneficial. For example, Ethiopia’s IHDP housing has provided opportunities in training and contracts for informal workers to prefabricate lintels, sills, floor joists, and floor slabs, while large contractors assemble the components and cast the concrete frames on site. In Cameroon, the government’s engagement of informal sector small scale contractors in the government social housing program, while commendable, has met with mixed results. Many of the contractors have suffered from inadequate technical and financial support and irregular payments for work completed. As a result, construction works on some of the project sites have stalled.

Stocktaking of the Housing Sector in Sub-Saharan Africa
56
5. Housing Demand and Access to Finance
Housing is typically the most expensive single asset that an individual or household will ever purchase. As the previous section detailed, the cost of housing in SSA is influenced by several supply factors that influence the price to consumers. On the demand side, there are few tools to assist households in purchasing finished housing units. Along with the fact that most people have very low and irregular incomes, this lack of consumer finance limits how much people can borrow or spend to purchase housing. It also may encourage demand for other housing tenure arrangements, such as rentals, as an alternative to ownership. In contrast to other developed countries where housing finance is obtained through capital markets, the great majority of the investment for housing in SSA comes from domestic savings.138
Even so, commercial banks are limited by a comparatively small portfolio of deposits from domestic sources, mostly those from high‐income or public sector workers. Due to this, commercial banks lack the ability to access long term sources of finance supplied by capital markets that can be used to develop mortgages. As a result, mortgages are uncommon and are relatively expensive by global standards. The low‐income majority of the region, where possible, rely on microfinance, savings groups, family loans or personal savings for housing consumption. The small size of these loans means that most people invest in housing incrementally over time.
A. Most of the SSA Population Cannot Access Formal Housing Finance
Overall financial access in SSA is low, and most financial activity occurs outside of formal institutions. Apart from savings, supplementary sources of commercial finance are needed to purchase a complete home. However, access to financial services in SSA is extremely low. According to the World Bank’s Global Findex Database (Table 7), SSA’s financial access is low compared to those of the rest of the world, with the exception of the Middle E1ast and North Africa region.139 Only 24 percent of the adult population 15 years or older in SSA holds an account at a formal financial institution; this table is halved for those adults in the bottom 40 percent of income levels. The country by country variation goes from less than 5 percent in the Central African Republic to 80 percent in Mauritius. Moreover, only 6 percent of adults received a loan from a financial institution in 2014.
Table 7. Regional Comparisons between Financial Access Indicators
Source: World Bank 2012.
Account at a
formal financial
institution
Account at
formal financial
institution,
Female
Account at a
formal financial
institution and
bottom 40%
income
Saved at a formal
financial
institution in the
past year
Saved with a
savings club in
the past year
Obtained loan
from formal
financial
institution
Obtained loan
from family or
friends in the
past year
EAP 55% 52% 39% 28% 4% 9% 27%
ECA 45% 40% 36% 7% 1% 8% 28%
LAC 39% 35% 25% 10% 4% 8% 14%
MENA 18% 13% 9% 5% 4% 5% 31%
SA 33% 25% 26% 11% 3% 9% 20%
SSA 24% 21% 13% 14% 19% 5% 40%
Note: Developing countries in each region only. All financial information expressed as percentage of population over age 15.
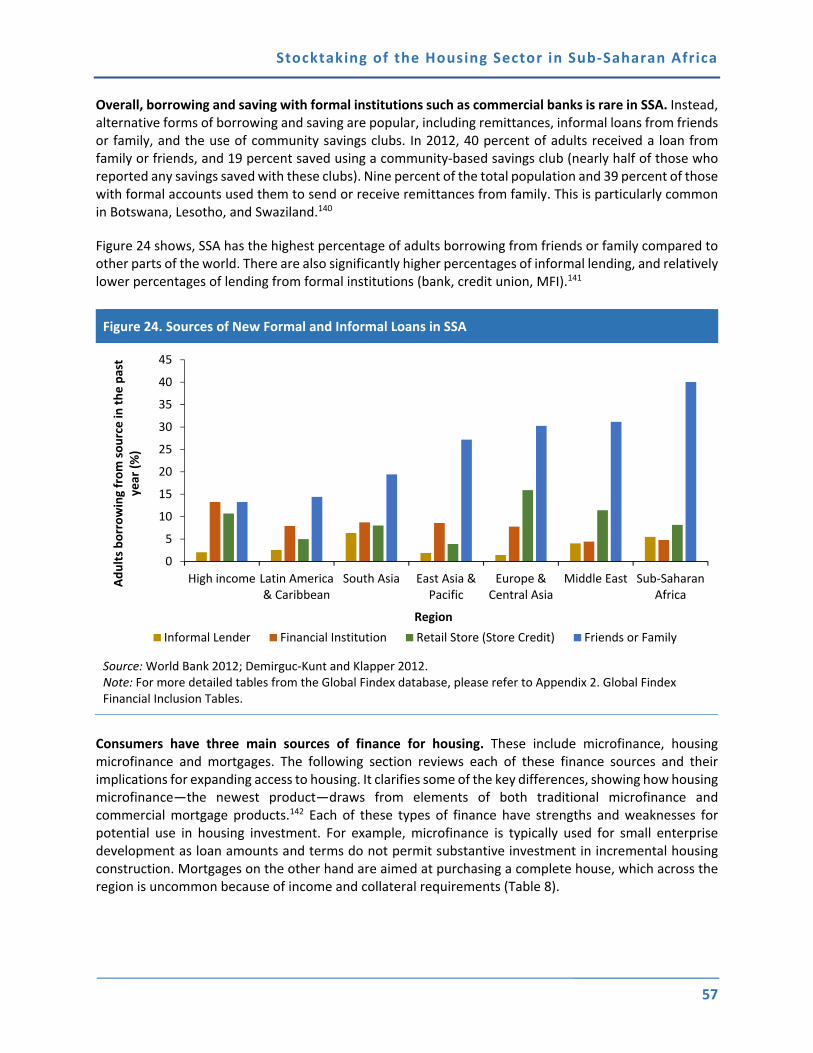
Stocktaking of the Housing Sector in Sub-Saharan Africa
57
Overall, borrowing and saving with formal institutions such as commercial banks is rare in SSA. Instead, alternative forms of borrowing and saving are popular, including remittances, informal loans from friends or family, and the use of community savings clubs. In 2012, 40 percent of adults received a loan from family or friends, and 19 percent saved using a community‐based savings club (nearly half of those who reported any savings saved with these clubs). Nine percent of the total population and 39 percent of those with formal accounts used them to send or receive remittances from family. This is particularly common in Botswana, Lesotho, and Swaziland.140
Figure 24 shows, SSA has the highest percentage of adults borrowing from friends or family compared to other parts of the world. There are also significantly higher percentages of informal lending, and relatively lower percentages of lending from formal institutions (bank, credit union, MFI).141
Figure 24. Sources of New Formal and Informal Loans in SSA
Source: World Bank 2012; Demirguc‐Kunt and Klapper 2012.Note: For more detailed tables from the Global Findex database, please refer to Appendix 2. Global Findex Financial Inclusion Tables.
Consumers have three main sources of finance for housing. These include microfinance, housing microfinance and mortgages. The following section reviews each of these finance sources and their implications for expanding access to housing. It clarifies some of the key differences, showing how housing microfinance—the newest product—draws from elements of both traditional microfinance and commercial mortgage products.142 Each of these types of finance have strengths and weaknesses for potential use in housing investment. For example, microfinance is typically used for small enterprise development as loan amounts and terms do not permit substantive investment in incremental housing construction. Mortgages on the other hand are aimed at purchasing a complete house, which across the region is uncommon because of income and collateral requirements (Table 8).
0
5
10
15
20
25
30
35
40
45
High income Latin America& Caribbean
South Asia East Asia &Pacific
Europe &Central Asia
Middle East Sub‐SaharanAfrica
Adults borrowing from source in
the past
year (%)
Region
Informal Lender Financial Institution Retail Store (Store Credit) Friends or Family
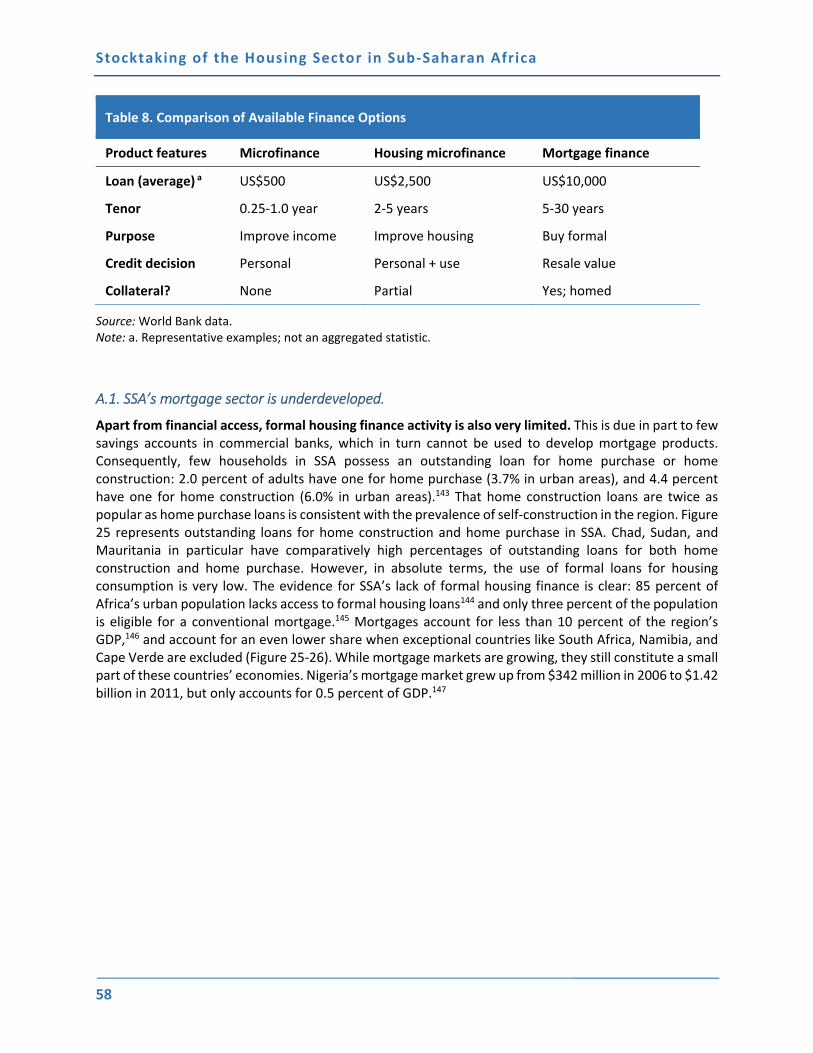
Stocktaking of the Housing Sector in Sub-Saharan Africa
58
Table 8. Comparison of Available Finance Options
Product features Microfinance Housing microfinance Mortgage finance
Loan (average) a US$500 US$2,500 US$10,000
Tenor 0.25‐1.0 year 2‐5 years 5‐30 years
Purpose Improve income Improve housing Buy formal
Credit decision Personal Personal + use Resale value
Collateral? None Partial Yes; homed
Source: World Bank data. Note: a. Representative examples; not an aggregated statistic.
A.1. SSA’s mortgage sector is underdeveloped.
Apart from financial access, formal housing finance activity is also very limited. This is due in part to few savings accounts in commercial banks, which in turn cannot be used to develop mortgage products. Consequently, few households in SSA possess an outstanding loan for home purchase or home construction: 2.0 percent of adults have one for home purchase (3.7% in urban areas), and 4.4 percent have one for home construction (6.0% in urban areas).143 That home construction loans are twice as popular as home purchase loans is consistent with the prevalence of self‐construction in the region. Figure 25 represents outstanding loans for home construction and home purchase in SSA. Chad, Sudan, and Mauritania in particular have comparatively high percentages of outstanding loans for both home construction and home purchase. However, in absolute terms, the use of formal loans for housing consumption is very low. The evidence for SSA’s lack of formal housing finance is clear: 85 percent of Africa’s urban population lacks access to formal housing loans144 and only three percent of the population is eligible for a conventional mortgage.145 Mortgages account for less than 10 percent of the region’s GDP,146 and account for an even lower share when exceptional countries like South Africa, Namibia, and Cape Verde are excluded (Figure 25‐26). While mortgage markets are growing, they still constitute a small part of these countries’ economies. Nigeria’s mortgage market grew up from $342 million in 2006 to $1.42 billion in 2011, but only accounts for 0.5 percent of GDP.147

Stocktaking of the Housing Sector in Sub-Saharan Africa
59
Figure 25. Outstanding Loan for Home Construction and Home Purchase (% age 15+) in 2011
Source: World Bank 2012.

Stocktaking of the Housing Sector in Sub-Saharan Africa
60
Figure 26. Mortgage Loans as a Percent of GDP vs. GDP Per Capita for Selected SSA Countries
Source: HOFINET 2013.
Most banking sectors in SSA countries are highly concentrated. In Kenya, 71 percent of mortgage lending is performed by the five largest banks, with the first two holding 50 percent of market share.148 In Mali, four banks compose 70 percent of the financial sector, and in Rwanda, three banks account for 60 percent of all assets, loans, and deposits. Average lending rates in SSA range from less than 10 percent to 60 percent. These statistics demonstrate that the formal banking sector serves a relatively small, high‐income population, and in many countries lacks a significant degree of competition.
Mortgage finance is a tool that emerges from the intersection of two complementary housing value chains. On the supply side, there is the delivery of a formal home (including land title, trunk and site infrastructure, construction codes and inspection); which yields on the demand side an enforceable collateral‐based loan security (including eligibility, underwriting, closing and recordation, funding and liquidity, servicing, and enforcement). For mortgage finance to operate in volume, both supply‐side and demand‐side value chains must be fully functional, and in Sub‐Saharan Africa these are unlikely to be in place in the intermediate future. In the meantime, other partial solutions (e.g. formalizing the informal housing delivery channels) deserve policy attention.
Burundi
Cape Verde
Kenya
Namibia
Nigeria
Rwanda
Senegal
Seychelles
South Africa
Tanzania
Uganda
Zimbabwe
0
5
10
15
20
25
30
0 2,000 4,000 6,000 8,000 10,000 12,000
Mortgage
Loan
s as % of GDP
GDP per capita in current USD
2010-2012

Stocktaking of the Housing Sector in Sub-Saharan Africa
61
Figure 27. Lending Interest Rates in Sub-Saharan Africa, 2013 (%)
Source: Calculations from IMF Financial Access Survey data. Note: Exceptions are Djibouti (2011), Mauritania (2012), and The Gambia (2012).
Mortgage lending is constrained by the availability of funds that can be used for mortgage products. At a basic level, growth in mortgage lending is constrained by a lack of the long term funds banks need to overcome a maturity mismatch between deposits and mortgages. The Central Bank of Kenya surveyed mortgage lenders and found that the lack of access to long term funds was their primary obstacle to further growth, followed by high interest rates.149 As is the case in many financial institutions, over 75 percent of the deposits in banks in Cameroon are short‐term, which renders them impractical for housing lending. Similarly, nearly 70 percent of the liabilities in Uganda are short term and mature in 30 days or less.150
Capital markets are an important source of long term finance necessary for mortgages. In order to overcome this obstacle, lenders in many developed countries obtain long‐term funding from investors in capital markets, or a secondary market. Secondary markets are often crucial for improving mortgage affordability because improving liquidity reduces risks, and consequently, risk premiums, for lenders. Moreover, it can facilitate competition in the primary market by giving thinly capitalized lenders the resources to participate in mortgage lending. In many industrialized countries, a robust secondary market has been crucial for the growth of mortgage lending. However, their success in emerging economies depends on proper regulatory frameworks and a liberalized financial sector.151
0
10
20
30
40
50
60
70
Nam
ibia
Mauritius
South Africa
Swaziland
Zambia
Lesotho
Botswana
Comoros
Cabo Verde
Djibouti
Seychelles
Liberia
Burundi
Mozambique
Angola
Tanzania
Nigeria
Mauritania
Ken
ya
Congo, D
em. R
ep.
Sierra Leo
ne
Uganda
São Tomé and Príncipe
Gam
bia, The
Malaw
i
Madagascar
Lending interest rate (%)

Stocktaking of the Housing Sector in Sub-Saharan Africa
62
Box 11. Housing Finance and Informality
Tenure and income have direct impacts on housing finance, and by extension the delivery of housing depending on the level of informality.
Tenure covers several options, such as a legal title or document (e.g. haq), or a contract (such as a lease), by rental (through contract or through verbal agreement) or by customary right. Property and land ownership may also be misaligned; a household may own (or have built) the structure, while the land it is on is possessed customarily, communally or by someone else. Formal housing has appropriate legal documents and permits that allow for collateralization.
Income: Formal income is typically steady, reliable and visible to banks and tax authorities. Informal income is cash‐based and prone to interruption due to seasonal or part‐time work patterns.
As there is a continuum of housing conditions, there is also a continuum of housing finance, which is related to tenure status. For example, “formal income” and “formal finance” represent only one arrangement of several alternatives. Non‐banking financial institutions (NBFIs) and microfinance institutions (MFIs) are other options typically available to those with less tenure security or income stability.. The table below summarizes these arrangements as well as the typical finance options available for each scenario.
Formal tenure Informal tenure
Formal
income
(FF)
Developers
(FI)
Contractors
Mortgages Cash
Employer NBFCs
Informal
income
(IF)
Contractors
(II)
Self‐improvers
NBFCs
Housing MFIs
Cash
Housing MFIs
Tontines
Housing supplier Finance instrument FF: Formal income, formal tenure; FI: Formal income, informal tenure; IF: Informal income, formal tenure; II: Informal income, informal tenure
Source: World Bank data.
Mortgage liquidity facilities, in particular, can help emerging economies begin establishing their secondary mortgage markets.152 Nigeria launched such a facility in January 2014, called the Nigeria Mortgage Refinance Company (NMRC). The NMRC regards itself as a “private sector driven company with the public purpose of developing the primary and secondary mortgage markets by raising long‐term funds from the domestic capital market as well as foreign markets and thereby providing accessible and affordable housing in Nigeria.”153 The World Bank approved the US$300 million concessional loan with a 40‐year term, of which US$250 million will go towards the NMRC, US$25 million will go towards establishing a Mortgage Guarantee Facility for low‐income borrowers, and US$25 million will go towards housing microfinance product development. The set‐up of the NMRC has been one of Nigeria’s first successful partnerships between the private financial sector and the public sector.154
Mortgage penetration across SSA is weak, especially for low-income groups. Those with stable incomes and titled property who could afford a mortgage face supply constraints because of the liquidity and

Stocktaking of the Housing Sector in Sub-Saharan Africa
63
unavailable long term secondary finance that lenders face. On the other hand, commercial lending for low‐income, informally employed populations is virtually nonexistent because of low incomes, lack of collateral and high default or payment delinquency risks. Lending to low‐income groups bears higher risks for the following reasons:
Historically low levels of participation in formal banking
Prospective borrowers’ aversion to holding debt
Low household incomes, coupled with mostly unstable and informal employment
Lack of proper collateral
Formal lenders’ lack of experience with due diligence and risk mitigation for informal borrowers
High transaction costs for both lender and borrower
Difficulties with enforcement of loan contracts
Lack of clear land and property rights frameworks
The most affordable mortgages are still too expensive for most low-income groups. Such a mortgage might require a 22 percent interest rate and a 10‐year term, which is cost‐prohibitive for much of the population.155 The down payment is also high; usually around 20 percent. In Uganda, for example, the lease expensive housing finance product in 2010 required a minimum monthly salary of US$400, which disqualified 99 percent of Ugandan households.156
Savings schemes improve the ability of low-income households to access mortgages, though their scope is limited. For example, the Senegal Housing Bank has a housing savings product that encourages savings by offering borrowers a reduced interest rate on their loan when they save 10 percent of the total purchase price.157 In Niger, EcoBank and the national union of teachers (SNEN) partnered to finance an affordable housing development program for teachers, who are typically in the lowest income bracket of salaried workers. SNEN members open an account with EcoBank, and are eligible for a loan after saving 15‐33 percent of the value of the house. Once they reach 10 percent, they receive access to land, which is used as a guarantee. The house is then built by a developer.158 These programs, however, are best suited to middle‐ and lower middle‐income groups with access to financial services and have a steady income for savings deposits.
Pension funds represent a significant pool of money that could be used to develop the formal housing sector. For example, these funds (up to 20 percent of GDP in Kenya), show promise as a source of funds for housing development as well as a savings vehicle and an avenue by which members could receive assistance in the purchase or construction of a home (via direct loans, guarantees, or asset‐backed securities). However, pension funds are currently limited in their use for housing finance because of a lack of experience among fund managers in low‐income housing markets, underdeveloped capital markets, the limited scale of some pension funds, liabilities for tying up funds in illiquid investments, lack of institutional capacity, and low coverage (2‐15 percent of labor force).159 In Nigeria, the Nigerian National Housing Fund160 was set up to encourage public sector workers to save towards mortgages. Formal sector workers or bank account holders would make a monthly contribution of, e.g., 2.5 percent of their monthly income (often matched by employers), for a minimum period of time. The balance would earn interest and serve as the basis of eligibility for a housing loan, or be refunded at a later date as a pension.161
The expansion of mortgage markets is important for the growth of formal private residential developments and, on a broader scale, for the health of national economies. If mortgages were accessible to even three percent of the population, they would contribute an additional US$300 million to African economies.162 However, when considering mortgage expansion, policymakers must first

Stocktaking of the Housing Sector in Sub-Saharan Africa
64
understand the singular features and constraints of the SSA housing landscape. One important feature of many urban areas of SSA—particularly in West Africa—is that there is no housing resale market. Over 80 percent of Nigerians live in family‐owned and held property, and very little of the housing stock changes hands. Homes are not seen as resale assets, but as use assets; perhaps in part because of the constraints and uncertainties of transferring land through customary systems or without formal title and registration.163,164 This complicates the internationally accepted notion that housing is an investment good, and may mean that there is little natural consumer demand for mortgages in these countries. Expanding mortgage markets will therefore require extensive consumer education along with complementary improvements to land registries and property laws.
Currently, expanding access to mortgages will only help close the housing gap for upper and middle-income populations. Mortgages are not the most suitable housing finance tool for low‐income, informally‐employed, informally‐housed populations. These populations require housing finance products that are calibrated to the fact that obtaining a home means building components of it incrementally as the resources are available. Housing microfinance, which is currently emerging and developing as sector, likely constitutes the most viable solution for these populations and holds the potential to provide affordability at a much larger scale.
Across SSA, most people do not have access to commercial mortgages. The price of mortgage finance has long kept affordable housing out of reach for low‐income households in the region, due to the formality requirements for the housing structure and land, and the viability of its collateral security interest. Microfinance, by contrast, does not face the same rigid barriers, but, classical microfinance—consumer lending of very small amounts with loan tenors typically less than one‐half a year—has not yet expanded into the domain of ‘housing microfinance.’ Reasons for this are set forth in the next section.
A.2. Microfinance for housing would improve access to quality housing for some low‐income groups
Microfinance institutions comprise several categories of formal financial services in Africa. These institutions include: microfinance banks, rural and community banks, cooperative networks, NGO microfinance institutions (MFIs), and non‐banking financial institutions.165 Cooperative networks include community‐based savings groups such as Rotating Savings and Credit Associations (ROSCAs), Savings and Credit Cooperative Organizations, (SACCOs), Village Savings and Loans Associations (VSLAAs), Accumulating Savings and Credit Associations, (ASCAs), Financial Service Associations (FSAs), mutualist institutions, and credit unions. Each of these institutions are local and member‐owned, and leverage the power of collective savings and accountability.
Microfinance has become increasingly popular throughout SSA. Since 2002, 22 African countries have passed microfinance‐enabling legislation.166 Microfinance attracts a wide range of actors: commercial banks, microfinance institutions, savings cooperatives, NGOs, family and friends, and informal moneylenders.167 In 2013, SSA’s microfinance sector reported a total of 4.5 million active borrowers and gross loan portfolio of US$7 billion,168 which is fairly moderate compared to the reported totals of other developing regions (Table 9).169 This represents an average amount loaned per borrower of US$1,555. The differences in average loan amount by region may be partially attributable to whether MFIs lend more to entities or to individual borrowers, and if MFIs tend to lend multiple loans to each client.
Unlike commercial banks, in many countries, MFI deposit and lending rates are not regulated.170 This supports wide variation in interest rates and lending terms across the region. In the absence of interest rate ceilings, interest rates vary greatly from one MFI to another, even within the same country. In Cameroon, interest rates on savings vary from 3.25 percent to as much as 15 percent annually, while

Stocktaking of the Housing Sector in Sub-Saharan Africa
65
interest rates on loans range from 3 to 10 percent monthly for overdrafts. The latter excludes other related charges such as subscription charges, file fees, and insurance. Interest charged on credits is over 30 percent, with the exception of the Community Growth Mutual Funds, a MC2 micro‐bank network where the maximum interest rate on loans is 15 percent. This variation in interest rates is likely due to differences in operating costs and access to secondary finance from which loans are originated (Dorftleiner et al. 2014; Cotler and Almazan 2013).
Table 9. Active Borrowers and Gross Loan Portfolio for Microfinance Institutions by Region
Source: MIX Market 2013.
SSA countries have a wide variation in competition in the microfinance sector. Figure 28 shows that South Africa, Kenya, and Ethiopia have the most microfinance activity among SSA countries in terms of gross loan portfolio, though the structure of each market varies. On the one hand, South Africa’s microfinance market is highly concentrated, with three microfinance institutions accounting for a total of US$3.42 billion in loans. A single retail bank (Capitec Bank), accounts for US$3.4 billion of that total; about 99 percent. Ethiopia, on the other hand, has 20 microfinance institutions that account for US$557 million, of which the biggest institution, Amhara Credit and Savings Institution (ACSI), accounts for US$270 million. By contrast, Kenya, has more than four times the number of MFIs as South Africa, though a loan portfolio that is only about half the size. Burundi however has among the greatest number MFIs, but among the smallest total portfolio sizes.
Region Active
Borrowers
Gross Loan Portfolio
(US$)
Average amount loaned
per borrower (US$)
Sub‐Saharan Africa 4.5 million 7 billion 1,555
East Asia and the
Pacific12.7 million 9.9 billion 780
Eastern Europe and
Central Asia2.7 million 12 billion 4,444
Latin America and
the Caribbean16.2 million 34.1 billion 2,105
Middle East and
North Africa1.6 million 1.1 billion 688
South Asia 47.3 million 8.5 billion 180
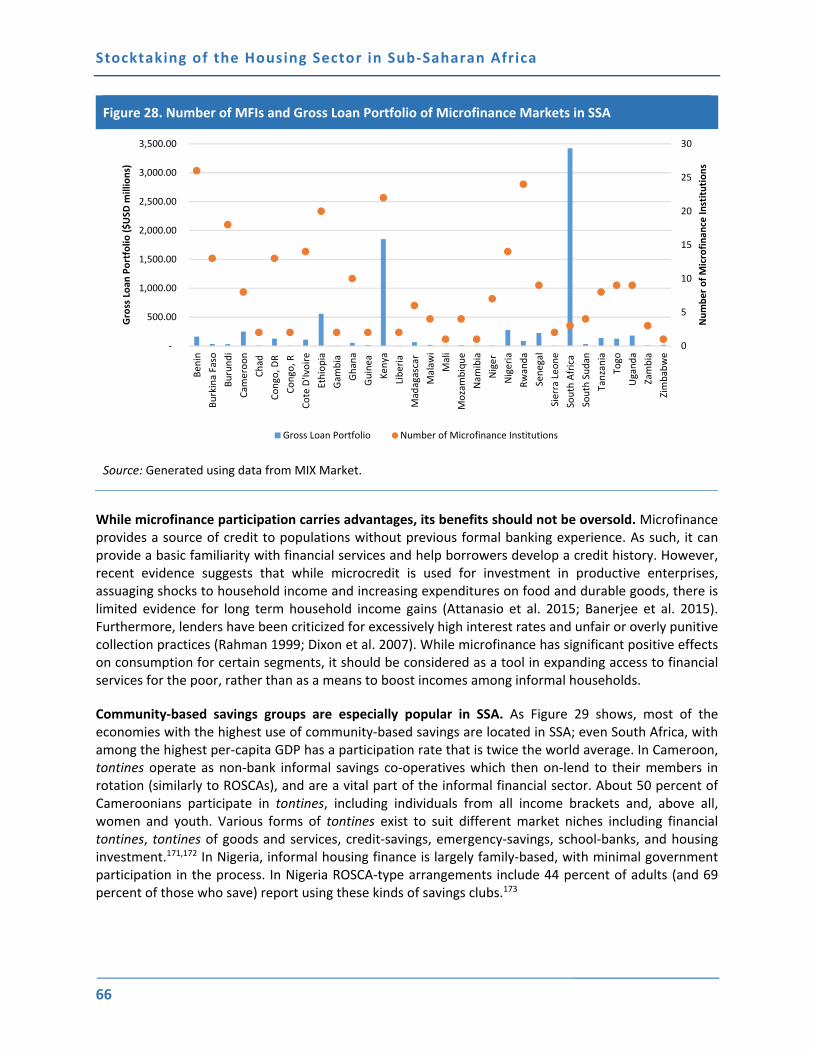
Stocktaking of the Housing Sector in Sub-Saharan Africa
66
Figure 28. Number of MFIs and Gross Loan Portfolio of Microfinance Markets in SSA
Source: Generated using data from MIX Market.
While microfinance participation carries advantages, its benefits should not be oversold. Microfinance provides a source of credit to populations without previous formal banking experience. As such, it can provide a basic familiarity with financial services and help borrowers develop a credit history. However, recent evidence suggests that while microcredit is used for investment in productive enterprises, assuaging shocks to household income and increasing expenditures on food and durable goods, there is limited evidence for long term household income gains (Attanasio et al. 2015; Banerjee et al. 2015). Furthermore, lenders have been criticized for excessively high interest rates and unfair or overly punitive collection practices (Rahman 1999; Dixon et al. 2007). While microfinance has significant positive effects on consumption for certain segments, it should be considered as a tool in expanding access to financial services for the poor, rather than as a means to boost incomes among informal households.
Community-based savings groups are especially popular in SSA. As Figure 29 shows, most of the economies with the highest use of community‐based savings are located in SSA; even South Africa, with among the highest per‐capita GDP has a participation rate that is twice the world average. In Cameroon, tontines operate as non‐bank informal savings co‐operatives which then on‐lend to their members in rotation (similarly to ROSCAs), and are a vital part of the informal financial sector. About 50 percent of Cameroonians participate in tontines, including individuals from all income brackets and, above all, women and youth. Various forms of tontines exist to suit different market niches including financial tontines, tontines of goods and services, credit‐savings, emergency‐savings, school‐banks, and housing investment.171,172 In Nigeria, informal housing finance is largely family‐based, with minimal government participation in the process. In Nigeria ROSCA‐type arrangements include 44 percent of adults (and 69 percent of those who save) report using these kinds of savings clubs.173
0
5
10
15
20
25
30
‐
500.00
1,000.00
1,500.00
2,000.00
2,500.00
3,000.00
3,500.00
Ben
in
Burkina Faso
Burundi
Cam
eroon
Chad
Congo, D
R
Congo, R
Cote D'Ivoire
Ethiopia
Gam
bia
Ghana
Guinea
Kenya
Liberia
Madagascar
Malaw
i
Mali
Mozambique
Nam
ibia
Niger
Nigeria
Rwanda
Senegal
Sierra Leone
South Africa
South Sudan
Tanzania
Togo
Uganda
Zambia
Zimbabwe
Number of Microfinan
ce In
stitutions
Gross Loan
Portfolio
($USD
millions)
Gross Loan Portfolio Number of Microfinance Institutions

Stocktaking of the Housing Sector in Sub-Saharan Africa
67
Figure 29. Savings Methods among Savers in Economies with the Highest Use of Community-Based Saving
Source: Demirguc‐Kunt and Klapper 2012.
Housing microfinance is a small but growing source of credit for the urban poor. While the microfinance sector is relatively well‐established, the housing microfinance (HMF) sector in SSA, and around the world, is still nascent though growing. Housing microfinance is well‐suited to the incremental self‐construction model which accounts for the bulk of new additions to the housing stock. Housing microfinance inhabits the gap between mortgage finance and microfinance.174 The Center for Affordable Housing Finance in Africa estimates that 15‐40 percent of general microfinance loans are channeled towards housing needs.175 Given a gross loan portfolio of US$7 billion for the region,176 that would amount to around US$1.05 to US$2.8 billion.
Dedicated housing microfinance initiatives are emerging across the region. Examples of dedicated housing microfinance funds include the Kuyasa Trust in South Africa,177 where about two‐thirds of the population cannot access formal bank credit, and savings and loans schemes operated by NGOs affiliated to Shack/Slum Dwellers’ International. Others include the Swalisano Urban Poor Fund in Zambia178 and the Mchenga Fund in Malawi.179 Kenya, with one of the more developed microfinance markets in SSA, is beginning to see the emergence of a nascent HMF sector. Jamii Bora Bank and Makao Mashinani are examples of MFIs that offer housing microfinance products. Makao Mashinani, in particular, offers incremental financing linked with technical assistance for self‐construction, and also finances land acquisition and infrastructure development; options that were pioneered in Latin American HMF institutions (Ferguson 1999).180
Microfinance and savings groups have the potential to reach a middle segment of the housing finance market. Figure 30 shows which services are available to different income levels in Uganda. Less than one percent of households in the country have access to mortgage loans from commercial banks, about 20 percent of the population is able to access housing microfinance loans, 17.5 percent access smaller loans from either MFIs or SACCOs, and over 60 percent of the population do not have access to any financial service.181 These numbers are roughly similar for a number of other countries in the region, and the

Stocktaking of the Housing Sector in Sub-Saharan Africa
68
hierarchy of mortgage finance, housing microfinance, and microfinance/informal finance tends to hold.182 In Tanzania, the bottom 54 percent are totally excluded from organized housing finance sources, the middle 35 percent have access to informal finance, the upper middle 8 percent can access microloans from MFIs, SACCOs, and banks, and only the top 3 percent can access mortgages.183
Figure 30. Financial Access Pyramid for Uganda
Source: Kalema and Kayiira 2008.
Estimates suggest that there is a modest potential for HMF expansion. Kihato (2009) estimated urban HMF demand in African countries by calculating the number of potential borrowers184 and the estimated total value of the market (number of borrowers multiplied by differentiated average loan sizes185). They estimate that the potential demand for HMF in urban areas is about US$2‐5 billion divided between 7 and 17 million borrowers, which constitutes only about 3 percent of the population. Also the data show, unsurprisingly, that most of the potential borrowers will be in higher‐income and predominantly urban SSA countries. Nonetheless, HMF represents a less expensive alternative to traditional mortgage finance and it can more easily accommodate incremental housing investment.
Although dedicated housing microfinance product offerings are increasing in number, their scale has been limited. In some countries, financial regulations constrain lending activities. For example, in Burundi, MFIs aren’t authorized to grant mortgage loans and do not offer any home improvement products, but, allow business loans for housing purposes.186 Even with a well‐developed microfinance sector, as in Ghana, it is challenging to roll out effective HMF products. Ghana’s Pro Credit launched one product in 2006, but had to switch to funding SMEs (small and medium enterprises) soon afterwards because of low repayment rates and a lack of funds.187

Stocktaking of the Housing Sector in Sub-Saharan Africa
69
Women’s savings groups have also become a means of supporting HMF. Funding streams developed by Shack/Slum Dwellers International (SDI) and used by their affiliates in many SSA countries (including Malawi, South Africa, Zambia, Namibia, Ghana, and Sierra Leone) not only allow women’s groups to save for their own housing but can also enable them to form together and build it themselves. Women’s groups can invest in a communal account that a national organization oversees and uses to leverage loans from international agencies. In this way, SDI’s Ghana affiliate (FED‐UP) put together a complex set of loans and grants to fund flats in Ashaiman188 and the Malawi affiliate (Centre for Community Organisation and Development—CCODE) raised funds to build in Angela Goveya.189
Box 12. The Growth of Housing Microfinance: The Case of LaFarge
In June 2012, a global cement company, LaFarge, launched a housing microfinance program with the goal of improving access to affordable housing for two million people by 2020, in partnership with development finance institutions and local microfinance banks. At the end of 2013, projects were established in 15 countries, including Indonesia, Serbia, the Philippines, Nigeria, and Zambia. In Nigeria, LaFarge will use 5 million euros from the French Development Agency (AFD) and partner with the largest microfinance bank in Nigeria, Lift Above Poverty Organization (LAPO). LAPO will offer housing microfinance to families for home construction, while LaFarge will offer technical assistance through architect visits or construction plan development. Additionally, in 2013, LaFarge organized the First International Workshop on Housing Microfinance, which drew organizations such as Habitat for Humanity, Global Communities, African Development Bank, and the International Finance Committee. Thus far, La Farge’s efforts have affected 120,000 people, and demonstrate the potential for private sector actors to help expand the scale of housing microfinance.
Sources: LaFarge2014; AFD 2013.
A.3. Conclusion
Formal financial institutions have limited coverage in SSA. Microfinance institutions have been more successful at extending access to credit to lower‐income groups, though experience across the region varies. The main difficulties to expanding mortgage lending are the high cost of capital required to package mortgage products and the limited demand for mortgages outside of high‐income groups. Informal workers with low and irregular incomes do not have formal savings accounts and are difficult to assess for creditworthiness. Instead, the majority of housing is financed through personal savings, remittance transfers, informal lending from friends and relatives and from community‐based savings clubs.
The microfinance sector has improved access to finance for lower-income groups. Forty years of experience with microfinance globally has established a ‘basic model’ of small‐scale loans aimed at income‐generating activities. This generally positive experience with pro‐poor lending stands in sharp contrast to formal‐sector down‐pyramid efforts, which have seldom been deeply impactful.190 However, without guidance and capacity development, housing microfinance will not emerge from mainstream microfinance. This is because it encounters scaling barriers; for example, loan amounts must be 5‐10 times larger and loan tenor must be likewise 5‐10 times longer. This changes the risk profile and requires, among other things, a different risk management strategy, revenue‐model equilibrium, and organizational structure.
While interest in HMF is growing and there is some potential to extend formal credit to those without access to mortgages, a more comprehensive assessment of the model is necessary. Successful ‘positive‐

Stocktaking of the Housing Sector in Sub-Saharan Africa
70
deviance’ business models for housing microfinance are scarce, small‐scale, and not well‐documented or connected with each other. A proper assessment of successful case studies is needed to better understand how these organizations emerged, how they assess markets, develop products and are able to scale up operations. Such work could be blended with global theory on housing microfinance191 to yield a global State of Housing Microfinance, testing whether current housing microfinance theory is in fact supported by emerging practice. If it is, then a further research agenda would be to create a franchise or “kit” model for adoption by interested MFIs globally and in SSA, as well as technical assistance to those early‐adopter MFIs.
Government policy support can help the development of urban HMF institutions. Based on the regional review and country case studies, there are several options for improving the conditions for HMF. On the policy side, HMFs should be regulated separately from MFIs, mortgage lending and or deposit‐taking institutions. Pilot programs would benefit from initial exemptions from interest rate ceilings. Donors and development finance institutions should be able to establish a separate funding body to develop an initial HMF loan portfolio. Such initiatives would find support in countries with a well‐established microfinance sector, large urban areas with rising incomes and a large informal housing stock and where proof of land occupation, such as powers of attorney, assignment letters or judicial rights of notice before relocation are held by residents.
B. Remittances Could Have a Substantial Impact on Housing, but
Further Understanding and Action Are Constrained by Limited Data
Remittances, or money sent back by emigrants to individuals in their home countries, are a considerable source of foreign investment in Africa. The continent’s total remittance flows were estimated at US$40 billion in 2010, half of which went to SSA. In a number of countries, remittances exceed other sources of funds, such as foreign direct investment, portfolio equity, and debt flows. Nigeria’s remittances inflows alone totaled US$20.6 billion in 2012.192 The World Bank projects that in 2016, SSA’s yearly remittance flows will reach US$41 billion.193 Further, around 40 percent of those adults with formal bank accounts use them for sending or receiving remittances.194 However, the cost of sending remittances to SSA is the highest in the world, with the fee ranging from 5 to 15 percent of the transaction.195
While the importance of remittances for housing finance is widely observed, limited data exists on the size and nature of these investments, particularly in SSA. This trend is not surprising given the high cost of land acquisition and housing construction discussed previously. Table 10 presents data from one of the few large‐scale studies on African migration, which suggests that households direct these funds towards land purchase, new construction, rebuilding, and rent, with variability between countries as to the most significant uses. For recipient households in Burkina Faso and Kenya, households concentrated their resources in new house construction. For Nigeria, it went towards land purchase. Remittances represent a significant source for enhancing overall household welfare, which can increase expenditures for housing consumption or savings rates. For example, if African banks were able to securitize future remittance flows—in order to leverage more external financing—they would be better positioned to fund low‐income housing and infrastructure projects.196 Further, there is evidence that remittances stabilize borrower’s capacity to repay and therefore reduce the incidence of non‐performing loans.197

Stocktaking of the Housing Sector in Sub-Saharan Africa
71
Table 10. Percentage of Remittances Going toward Housing Expenditures for Recipient Households in Selected African Countries
Country and
Remittance Origin Rent Home
Construction Home
Improvement Land Purchase
Burkina Faso Domestic 1.7 2.6 1.2 0.1
Within Africa 0.6 10.1 1 1.4
Outside Africa 1.4 35.7 0.3 0
Kenya Domestic 7.4 1.3 1.3 1.3
Within Africa 0.4 27.5 3.1 7
Outside Africa 5.7 11.2 5.3 8.4
Nigeria Domestic 0.8 0.1 7 18.2
Within Africa 4.9 0 3.2 7
Outside Africa 4.4 5.8 4.7 24.8
Senegal Domestic 2.2 0 0.1 0
Within Africa 0 0.7 0.7 0
Outside Africa 1 7 4.2 3
Uganda Domestic 4.5 0.4 2.1 2.1
Within Africa 8.1 1.6 3.2 4.8
Outside Africa 5.1 2.5 6.3 3.8
Source: World Bank Africa Migration Project 2011. Notes: OA = remittance flows from outside Africa WA = remittance flows from within Africa D = remittance flows from domestic sources

Stocktaking of the Housing Sector in Sub-Saharan Africa
72
6. Key Conclusions and Policy Directions
The report finds that informal housing is an adaptation to two basic conditions in many cities across the region. First, rapid urban growth is creating effective demand faster than any formal system, public or private, can adapt. This demand, however, is constrained by a low capacity of most households to pay for quality housing. As a result, much of the housing stock has some degree of informality. In short, informal settlements and slums, in short, are economically rational for those with limited resources facing high costs for obtaining land, who lack infrastructure and cannot afford homes that meet regulatory standards. Second, the complexity (economic, political, and legal) of a modern urban formal housing delivery system requires many ‘enabling institutions’ to be in place simultaneously and functioning sequentially. Improving capacity takes time. Legacies and practices of land use patterns, laws, zoning, governmental institutions, building practices, and finance markets all create obstacles for change and improvements. The prevalence of informal housing in the region, especially slums, underscores the importance of a comprehensive strategy for housing improvement and service provision in line with the SDGs, in particular Goal 11.
For the foreseeable future, Africa’s housing stock and future demand will remain largely informal in the continuum from slums to semi-formal structures. This is due to the overarching structural factors of low income levels limiting demand for formal housing, and constraining factors for supply associated with the poorly functioning housing sector (composed of land markets, access housing finance and the strength of construction and development industries. Housing affordability will improve not only with general economic expansion and income growth, but also with housing policy that both supports the incremental improvement of informal housing conditions for the majority of people and improves the function of the housing sector to bring down costs and improve the reach of the formal housing sector to lower income groups.
The preponderance of informal housing is due to a combination of poverty and high formal housing costs. The prevalence of low incomes across the region gives households fewer resources to spend on housing, which is typically obtained through informal delivery channels. Informal housing value chains mirror formal ones, though there are key challenges in the supply and demand side for quality housing delivery which effects access and prices. Value chains that deliver housing through formal channels—meaning that land and property are titled, registered and meet building standards and regulations, and can be purchased as a complete product with mortgage finance—are incomplete and uneven. The report has shown through a value chain analysis that different links in supply and demand chains distort the delivery of formal housing by raising the costs for building and financing, and therefore results in the development of an informal housing sector with a continuum of housing types and differing demands.
Government subsidy programs have done little to promote wide-scale housing affordability. There are two main limits to the reach of government subsidy programs. First, they are often poorly designed because they lack targeting and monitoring criteria, so subsidies can be captured by groups that are wealthier and could afford market‐rate housing. This is the case for government‐built housing units in a number of countries. Second, governments, like any other housing developer, must contend with the same structural limits in the supply and demand value chains. These inputs—including land, infrastructure, construction materials, and technology as well as consumer and developer finance—all raise the production cost of housing. Even subsidized prices remain unaffordable for low‐income groups and are not financially sustainable to bring to scale to meet demand.

Stocktaking of the Housing Sector in Sub-Saharan Africa
73
Land tenure and administration systems complicate the function of land markets. The plurality of tenure systems found across the region (and often even within the same country) discourages the market‐based circulation of land because rights to control or exchange land may be unclear and subject to dispute. Land administration systems such as registries and cadaster records are incomplete and are underused for enforcing legal claims or fiscal obligations of land holders, diminishing the ability for lenders to use land as collateral. Building standards and regulations, particularly with regard to plot sizes and land use intensity, discourage the efficient development of urban land and place additional burdens on infrastructure. Each of these factors raises the cost of all housing, especially in that provided through formal channels, by increasing the costs of land assembly, raising the risks for investment, and making infrastructure extensions less cost effective.
Construction costs increase the cost of all types of housing. Housing units cost more because building materials are imported and there are few locally‐based skilled contractors and development firms to build them at scale. Regulations and standards also add to the cost of housing and may be too outdated or unreasonably restrictive. Similarly, the region faces a challenge of scaling up the complementary service industries—architectural design, construction inspection, property valuation and appraisal, title review and verification, title insurance—that in other contexts have expedited the value chains and reduced the marginal cost of housing construction and consumer finance. This suggests that hand in hand with legislative reform must be the buildup of institutional capacity—education, accreditation, and training—so that new rules as written are consistently enforced as intended.
Housing finance options for low-income groups are limited. Across the region, the majority of residents do not have formal savings accounts and are not able to obtain mortgages for housing consumption. The lack of savings reduces the amount of finance available for lending institutions to develop consumer mortgage or other lending products. The major source of housing investment is from household savings and government investment, rather than capital markets. This can crowd out public investment in other important sectors such as education, health and infrastructure. The lack of credit for development finance limits investment in domestic construction activities that could provide housing at scale.
Most housing is built incrementally, which is reflected by the most typical sources of housing finance: savings and small loans. The majority of urban residents build shelter themselves or through the assistance of local laborers. Without access to mortgage finance to purchase complete homes, housing is consumed incrementally through investments from individual savings, remittance transfers, and participation in savings cooperatives or through the use of microfinance. The expansion of microfinance lending for small and medium enterprises has given more low‐income groups access to relatively affordable finance and banking services. Housing microfinance, though currently limited in its scope in SSA, could be a way to bridge the gap between small, short tenor microloans and large, long tenor mortgages, with a loan product tied to construction material discounts or technical assistance.
The incidence of poverty and housing informality in SSA countries requires a suite of complementary interventions to improve housing quality and affordability. In most SSA countries, the large majority of the population is too poor to access formal affordable housing and a large share of this group is living in slums. Due to the diversity of needs and challenges at different points in the value chains, there is no single fix. Rwanda’s housing policy is illustrative of this integrated approach (Box 13) Interventions may include investments in infrastructure, sites and services, land titling and transfer reforms, strengthening of MFIs and incubation of housing microfinance entities, reduction of tax or tariff barriers, earned‐amnesty and enumeration programs to allow informal housing to become formal, and buildup of savings cooperatives and credit unions to provide additional consumer finance, for example.

Stocktaking of the Housing Sector in Sub-Saharan Africa
74
Box 13. Rwanda’s National Housing Policy: Developing an Inclusive Housing Market
Rwanda’s 2015 National Housing Policy incorporates many of the housing affordability policy principles discussed in this report and takes a broad view of housing provision and tenure type. The policy recognizes that support for an array of housing and housing finance arrangements, including rental and self‐help construction, provides an important entry point toward improving the housing sector as a whole.
The document emphasizes collaboration across ministries and engagement with the private sector. For example, it integrates the need for including disaster risk mitigation and principles of green building and resource efficiency in planning and building standards which can both reduce the exposure to natural disasters and the consumption of water and energy in new units. It supports the incentives to densify land uses through the zoning code and introduces an “urban development fund” directed toward infrastructure investment priorities, where public services and utility connections are bundled and built together.
The policy also explicitly aims to avoid the market distortions caused by poorly designed housing subsidies and the direct provision of housing. Instead, the housing ministry will develop subsidy interventions according to needs based on income, “established through up‐to‐date‐ evidence‐based data” such as verifiable income data and detailed demand analyses. Support for social housing will be directed at specific groups (such as disabled and elderly people) with explicit resale restrictions that will both discourage selling to wealthier groups and will not crowd out private investment. Even further, housing subsidies aimed at developments for middle‐ and upper‐income groups will include a required set‐aside of affordable units.
The implementation strategy focuses on engaging the private sector by supporting alternative finance and investment arrangements such as savings groups, credit cooperatives, and microfinance and encouraging higher rates of savings to stimulate lending. It also makes room to strengthen the construction sector through assistance in training, workforce development and increasing the sourcing of building materials through local providers, which can provide jobs and lower the cost of home construction.
Source: Ministry of Infrastructure, Republic of Rwanda, National Housing Policy 17/3/2015
A Way Forward
This section identifies areas of priority and key interventions on the basis of the preceding analysis and discussion in this report. First, the overall perspective on housing and priority interventions in accordance with the core elements of the housing demand structure in SSA is outlined. Second, interventions and actions areas in accordance with the different areas of the housing value chain are identified. Third, the section covers additional proposals targeting the different layers of the continuum of informal housing. It is clear that these proposed interventions action areas remain fairly general given the regional scope of this report, and therefore would need to be contextualized and customized to be applicable at the detailed country level.
Complementary interventions can be targeted across three areas of the housing sector. Figure 31 summarizes key activities for improving the access to quality affordable housing. First, a number of cross‐cutting solutions will improve the function of the sector as a whole, both for formal and informal channels. These include improving the function of land markets and administration, flexible or incremental design and building standards and the inclusion of new and alternative building materials and techniques. Support for rental housing can improve its provision across income levels and shelter types. For informal settlements, targeted and incremental improvements in infrastructure access along with leveraging informal sources of credit for self‐built housing can improve housing quality and reduce overcrowding. Within the formal sector, support for the expansion of finance for long term lending through mortgages and developer finance will also improve the delivery of housing both for ownership and rental.

Stocktaking of the Housing Sector in Sub-Saharan Africa
75
Investments in both cross‐cutting activities as well as the informal housing sector will broaden access to quality affordable housing from the bottom up, while also reducing obstacles for formal investors and developers to build affordable housing at scale.
Figure 31. Key Activities for Improving Access to Quality Affordable Housing
The following section outlines a framework for housing reform based along three overlapping themes.198 Table 11 revisits the conceptual framework introduced at the beginning of the report, identifying the main areas of supply and demand value chains for housing delivery, contrasting the experience of SSA with a formal housing delivery model. It also organizes the key steps that policy makers can take to improve housing access and affordability and which groups these activities will benefit most directly. The conceptual framework is shown in Table 11. At the most basic level, “cross‐cutting” interventions are those that help a country’s entire land and housing sector, including both formal and informal delivery systems. Those solutions geared toward the informal sector are aimed at providing low‐income families with resources to access infrastructure and at improving the scope of affordable housing options. Finally, recommendations for the formal sector are intended to help governments use the housing sector as an engine for economic growth.

Stocktaking of the Housing Sector in Sub-Saharan Africa
76
Table 11. Summary of Key Findings and Recommendations
Housing Delivery Component
Formal condition
Common SSA Condition
Key Action Area Implementation Timeframe
Scope of Impact
Supply
Land Tenure and Administration
Freehold or leasehold title; title or deed registry
Competing tenure systems and or absence of title: squatting; land invasions; illicit subdivision and sales
Strengthen cadaster and land registry systems and land management practices
Medium term: Regulatory changes and technical assistance
First priorities: Cross cutting solutions that improve overall access to housing
Planning Standards and Regulations
Compliance with FAR, site setbacks, building codes
Variation in site density, design and lot coverage
Improve city planning and create more flexible regulations and standards
Short term: Regulatory and administrative changes
Construction sector
Sector with professional, licensed workers
Self-built, or use of informal often unlicensed laborers
Strengthen the capacity of the construction sector, improve access to finance for developers and builders to expand their businesses
Medium term: Skills training, access to finance
Building Materials
Mass produced materials with standardized quality
Variation in type and quality of materials: Scavenged items, traditional manufacturing techniques, some use of manufactured materials where they can be obtained
Improve the quality and scale of local building material manufacturers
Long term: Support for technology development, training, duties reform
Infrastructure Trunk line utility connections
No trunk lines: illegal wiring, pit latrines, household cisterns
Targeted investments in infrastructure and informal settlement upgrading
Long term: Capital investments
Addressing Informality: Improving access to quality housing for the poor
Demand
Formal savings accounts
Savings account deposits used for mortgage lending
Little formal savings: Reduces capital available for lending to consumers or developers
Support the development of alternative finance sources for the urban poor; housing microfinance, credit cooperatives, savings groups, community mortgages
Medium to long term: Market reforms for improving credit and investment
Underwriting and verification
Assessment of income and creditworthiness to create mortgage terms
Lack of formal income and land collateral: Reduces eligibility for housing subsidy programs, raises risks profile for commercial mortgage lending
Mortgage loans
Long term loan for obtaining complete, titled house
Few mortgages: Most households use personal savings, microcredit, savings groups and other non-commercial sources
Reform the commercial lending sector to allow access to longer term sources of finance to develop a more competitive mortgage market
Improving formal housing investment: Harnessing housing for growth
Stocktaking of the Housing Sector in Sub-Saharan Africa
77
A. Cross Cutting Solutions for the Housing Sector
Land, planning and construction issues affect the delivery of all housing. Improvements in these areas form the foundation for addressing informality and for catalyzing growth in the formal housing sector as well as the broader domestic economy. They can improve both the ability of low‐income households to obtain land and build their homes incrementally and also for formal developers to assemble land for new construction. Urban planning standards and regulations can improve densities and facilitate more efficient investments in network infrastructure and reduce the costs and time necessary to complete construction for informal and professional developers alike. Land use planning and infrastructure directly influence the form of cities, the mobility of residents, and the ease with which they can access jobs and services. Finally, governments should promote the adoption of low‐cost but superior materials and technology for home construction. Local sourcing of materials and the adoption of low cost, high durability building technologies would help these products reach the scale necessary to reach informal dwellers, and also stimulate labor participation and investment in the construction sector as a whole.
Key areas for policy attention are discussed below:
Encourage and support funding of pilots that allow for judicially accepted division of land rights that are short of formal land transfer evidenced by changes of title.
Within Sub‐Saharan Africa, even the formal land markets are subject to numerous weak or missing links: regulatory blockages, land hoarding and land cartels, overlapping administrative systems in force, and other disruptions that make formal urban development problematic. The result of rapid urbanization is a significant increase in the ’market share’ of Sub‐Saharan African land markets that are informal (see Selod 2015 for an in depth case study reflective of a number of countries in the region).
Hence, it is critical to develop property rights, with particular emphasis on instituting less‐costly titling systems (see Ethiopia, Nigeria case studies). Further, the property rights that are often clear and secure in developed economies, which can include ‘freehold’ can be subdivided, legally or contractually, in ways that could foster development without directly assaulting establishing laws or practices. The divisible components of land rights relevant to housing include:
1. Right of current occupancy (whether on payment of a cash sum up front, for a lease interval, or periodically).
2. Right to lease or sublease occupancy and use rights without transferring land ownership or registering an updated title.
3. Right to subdivide or partition a larger site for purposes of use, occupancy, or development. 4. Right to construct permanent dwellings on a site. 5. Right to increase density on a site by constructing ancillary outbuildings (‘backyard shacks’)199. 6. Guarantee of non‐eviction for a stated interval of time. 7. Right to pledge the foregoing rights as collateral for a debt.
These ‘rights‐divisible’ initiatives, however, are largely unexplored because land markets operate on the principle that freehold or long leasehold is the goal and therefore should be the standard of land transfer. Such a standard serves well in the formal markets (both supply and demand) and hence is naturally preferred and supported legislatively and through the political and judicial processes.

Stocktaking of the Housing Sector in Sub-Saharan Africa
78
A.1. Formalizing customary land administration systems
Instead of formal land transfer, informal or customary land‐transfer mechanisms are prevalent. These are not ‘title’ in a form recognized by the formal system (e.g. for a mortgage), but are broadly respected as rights of occupancy, construction/development, and use. In several of the studied countries, there is an obvious failure to acknowledge the real power and influence that the traditional heads have over the land management and subdivision process. The first step is to recognize this and agree some kind of compact or legal framework based on this. This would allow the heads, through the local government system, to take on the role of allocating land formally, as long as it conforms to the requirements of a metropolitan land use plan and the formal land registration process.
In some countries, local chiefs operate in parallel with, or as de facto agents of, local government officials. In such circumstances, it can be more effective to incorporate the customary positions into a formally recognized framework, rather than introducing formal‐sector ‘professionals’ into the informal value‐chain, risking both illegitimacy and unfamiliarity with local practices. Effective customary collaboration in a formally recognized process could be further strengthened by upgrading the technical input available to chiefs, educating and registering or licensing existing intermediary professionals. Transitioning these professionals with deep and proven local knowledge into some form of formally recognized framework may be more cost‐effective and locally accepted than introducing a new set of land, housing, and finance specialists who may have formal university training, but limited understanding of typical constraints and expectations faced by the informal sector.
A possible starting point for land administration reform could be introducing some form of “homestead amnesty”—that is, grant of non‐eviction rights for a period of time, possibly indefinite, upon condition that the occupant live in the house and improve it to a certain standard by a certain deadline. This could start in a sub‐national unit of government, e.g., province, region, or district, as a pilot. In Nigeria, states where similar activity is already similar activity going on200 could lead the way, such as Kaduna/Kamazou, Kano/Dilalai (informal land agents), or Enugu/Nike (indigenous, original land owners).
Encourage authorization of informal institutions (tribal, customary, or historically recognized) as quasi‐judicial and judicially‐compatible adjudicators of the subdivision of land for development compatible with rapid urban growth. Land‐use requirements (such as minimum lot size) and land‐transfer hurdles (such as Nigeria’s requirement that the State Governor must personally sign land transfers) not only make formal housing more expensive, they create incentives for informal land acquisition and housing provision. Addressing this is imperative if auto‐promotion (self‐improvement, incremental formalization) is to be regularized, as plots are the basis for such new housing construction.
Increasing density in the peri‐urban area depends in part on homesteaders upgrading their plots with larger structures that will support a living environment for more people. Sites that were designed as ‘single‐family homesteads’ in the formal zoning or land cadaster will be subdivided or incrementally developed, and for that they must have site infrastructure—pipes and wires from the property’s lot lines to the structures on the site. That, in turn, requires some form of acknowledgment by applicable local authority that the subdivision is tolerable and even desirable.
One way around this issue would be to devolve to local government the current practice of the formal framework of metropolitan land management. Devolution of power is implied in the present legislation but not implemented in practice.201 Creation of a localized land‐subdivision authority or

Stocktaking of the Housing Sector in Sub-Saharan Africa
79
responsibility within municipal governments will necessarily require devolution of authority from higher levels. In Nigeria, local governments used to produce such layouts in the past, but it was consolidated into State Urban Development Authority, which currently has a monopoly on formal layouts. (Nigeria) This faces a challenge in that here has been huge deterioration of local government and the professional work is substandard. What is required is a rudimentary upgrade of standards for the chieftaincy process and more transparent relation to normal local and state government processes.
Such quasi‐judicial land subdivision can also be possible in countries that have a tribal or religious overlay. For instance, in Nigerian states with a largely Muslim population, such as the city of Rigasa (150,000 population) in the extreme west of Kaduna (Igabi LGA), the Emir’s representatives202 adjudicate such matters, subdividing and allocating the land with the help of volunteer professionals from government. In Ethiopia, local officials play a dual role for the local authority and for the households; this role could be both formalized and extended to land subdivision and site‐infrastructure‐reservation authority. A similar pattern is visible in Ghana, where local authority professionals survey the land for the chiefs who allocate it, in a manner that was also observed in Malawi and Zambia.
Support technological innovation in sustainable building products, and pilot partnerships between pro‐poor building materials companies (such as global cement companies), government and NGOs, to create hybrid value chains that deliver sustainable and technologically supported low‐cost, low‐skill, local‐material building products for use in self‐built home improvement.
In this context, ‘design’ means both home layout and also identifying suitable low‐cost, low‐tech building materials that are both climatologically practical and culturally acceptable. Throughout Sub‐Saharan Africa, the dominant building material is cement, though the quality and cost vary widely (including in Nigeria, where for country‐specific reasons it is at least double the expected average cost). Advances in cementitious materials, including those led by the world’s major cement companies (Holcim, Lafarge, and Cemex to name three) create the possibility of lower‐cost, greener (carbon‐absorbing), higher R‐factor forms of cement that could (with the right establishing infrastructure) be manufactured using locally sourced materials and local, lower‐cost labor. Partnerships between large cement manufacturers, local savings groups or community groups, and government‐facilitated land subdivision and informal upgrading programs offer the prospect of creating a hybrid value chain.203
The formulation of the new design norms and standards for housing should be performance‐based rather than material‐specific to allow use of a wider variety of materials. The use of local building materials should be encouraged through subsidization and/or tax incentives. Governments should facilitate their appropriate and effective use in their social housing programme.204
Support development of a more flexible building code that grants exemptions from building requirements for small and lower‐density properties (e.g. retrofitting an informal home into potential formality).
Just as design regulations can inadvertently to favor formal development at the expense of home improvement and upgrading, so, too, do well‐intentioned building codes or minimum property or construction standards. Yet, in the informal sector, small‐scale contractors and artisans play a large role in overall delivery of housing, home improvements, home upgrading and expansion, and the emergence of multi‐household housing. Despite this, they are generally excluded from consideration in government programs, which tend to aim at large formal developers (reinforcing the upper‐middle‐income bias in production). Initiatives should be developed to effectively engage informal sector professionals them

Stocktaking of the Housing Sector in Sub-Saharan Africa
80
effectively into housing development. Capacity building of informal sector, small‐scale contractors and builders, through technical and financial support, should be prioritized, together with sensitization on planning and building standards and quality control
While informal housing is not subjected to building codes or construction‐safety requirements, the sector is so large that at its upper end the housing built is physically robust and its formalization may be more a matter of judicial acknowledgment than structural upgrading. This could be accomplished with a review of building code standards and requirements, leading to a streamlined informal settlement upgrading building code suitable for smaller‐density structures (e.g., walkups no taller than ten meters).
Similarly, locally‐developed building materials and technologies can be improved rather than rejected, and the building codes and contracting regulations should encourage rather than discourage this innovation. Each of these cities has a significant housing deficit and the alternative is not a standard house but a wholly informal house, or even an affirmatively dangerous and exploitative dwelling, or sleeping on the streets. Hence a professionally‐built affordable property using locally‐ sourced and crafted material will displace not the formal house envisioned by the rule‐writers but the overcrowded and unserviced house that the informal neighborhood will build on its own. (Ethiopia)
B. Engaging Informality: Toward Inclusive Housing Policy
Building on cross‐cutting solutions such as improved land tenure, planning and building regulations, in depth targeted interventions that can help address the challenges affecting the households at different tiers of the continuum of informal –to‐ formal households across the scale of housing stock, as highlighted in Table 12 below.
Low‐income and informally‐housed groups can improve their access to housing with infrastructure upgrading and support for incremental housing finance. This approach engages and enhances the shortcomings of existing informal housing development channels and is better suited to the abilities of low‐ and middle‐income groups to pay. This would require developing and experimenting with new housing microfinance, such as developing tools and best practices, and disseminating them throughout the sector across the region. These financial products could be combined with subsidies for low‐cost materials and construction technology, increasing access to these products and initiating a source of investment in the domestic building materials industry. Lending institutions also need greater policy support for more flexible lending terms, collateral requirements and more capacity to draw from client savings in order to develop and secure new loan products for housing.
Alternative financing strategies can improve targeting of infrastructure investments to lower‐income areas, rather than concentrate coverage in high‐ and middle‐income neighborhoods. On the institutional side, governments can prioritize infrastructure investments to low‐income and service‐deficient informal settlements (such as subsidies for hookup costs) using explicit targeting criteria. Similarly, coordination between local and national governments can improve the system of transfers or fiscal autonomy for investing tax revenue in service delivery based on these criteria. They can also support the diversification of service delivery channels by reforming the governance and activity scope of state‐owned enterprises in order to promote more competition and engage private sector participation.

Stocktaking of the Housing Sector in Sub-Saharan Africa
81
Table 12. Overview of Core Interventions across the Continuum of Formal and Informal Households
Housing Delivery Component
Core intervention
Slum Conditions
Partial Upgrade Semi-Formal Formal Housing
Supply
Land Tenure and Administration
Strengthen cadaster and land registry systems and land management practices
Assessment of location and resettlement options to reduce hazard exposure Improvement of protections for land tenure claims and regularization Street addressing
Improvement of protections for land tenure claims and regularization Adaptation of customary land administration systems for subdivision
Digitization and improved access to records and reduction in registration times
Digitization and improved access to records and reduction in registration times
Planning Standards and Regulations
Improve city planning and create more flexible regulations and standards
Flexibility and graded standards for incremental improvement
Flexibility and graded standards for incremental improvement
Consistent design, layout and construction standards supporting compact development
Consistent design, layout and construction standards supporting compact development
Construction sector
Strengthen the capacity of the construction sector, improve access to finance for developers and builders to expand their businesses
Availability of quality, low cost materials for self-builders and contractors
Availability of quality, low cost materials for self-builders and contractors Training and licensing systems to improve capacity and quality of builders
Access to finance for developers and construction firms
Access to finance for developers and construction firms
Building Materials
Improve the quality and scale of local building material manufacturers
Support for domestically produced, quality building materials. Realignment of building standards and codes to support a wider variety of lower cost material substitutes
Support for domestically produced, quality building materials. Review of VATs and tariffs imposed on imported building materials
Support for domestically produced, quality building materials. Review of VATs and tariffs imposed on imported building materials
Support for domestically produced, quality building materials. Review of VATs and tariffs imposed on imported building materials
Infrastructure
Targeted investments in infrastructure and informal settlement upgrading
Explore partnerships with community organizations and service delivery agents
Grid/arterial-based land planning for future infrastructure extension Targeted infrastructure investments based on specific criteria; income, tenure status, disaster risk, etc
Assessment of options for self-finance for infrastructure
Inclusion of development fees, special assessments for infrastructure provision in new construction

Stocktaking of the Housing Sector in Sub-Saharan Africa
82
Table 12. Overview of Core Interventions across the Continuum of Formal and Informal Households
Demand
Formal savings accounts
Support the development of alternative finance sources for the urban poor; housing microfinance, credit cooperatives, savings groups, community mortgages
Promotora model for increasing familiarity and access to credit and financial services
Stocktaking and support of non-banking financial institutions
Assessment of options for provident funds/ formal employer contributions
Assessment of options for provident funds/ formal employer contributions
Underwriting and verification
Assessment of income and creditworthiness to create mortgage terms
Assess alternative ways of identifying creditworthiness of borrowers for small loans for incremental improvements
Use of cooperatives or collective ownership schemes to off-load new development Mobile banking for improving loan servicing
Use of cooperatives or collective ownership schemes to off-load new development Mobile banking for improving loan servicing
Improve capacity of credit bureaus Regulatory reform to improve loan closing, underwriting and foreclosure
Mortgage loans
Reform the commercial lending sector to allow access to longer term sources of finance to develop a more competitive mortgage market
Support for housing microfinance, savings groups, cooperatives and other forms of non-bank lending
Support for housing microfinance, savings groups, cooperatives and other forms of non-bank lending
Support for housing microfinance, savings groups, cooperatives and other forms of non-bank lending Disclose criteria and target groups for any consumer mortgage subsidy
Support development of additional liquidity through secondary markets
Encourage and support expansion‐planning grid infrastructure or arterial layouts of rapidly growing cities so that the framework of informal settlement and private informal investment allows space for later retrofitting of physical infrastructure grids.
It is apparent that in the countries studied, and throughout Sub‐Saharan Africa, the scale of cities is consistently greater than the infrastructure grid designed for those cities. Therefore, the rate of urban expansion (measured in hectares under urban use) is outstripping the rate of infrastructure‐grid expansion. This ‘organic extension’ of the infrastructure grid poses significant problems for policy makers,205 as the business case for extending the infrastructure grid into rapidly‐growing peri‐urban areas is not feasible:
The costs for extension are higher than a greenfield grid because retrofitting is required.
If revenue capture systems were in place, beneficiaries would be unable or unwilling to pay what is needed for the debt service on even a concessionary loan for infrastructure upgrading and operation.

Stocktaking of the Housing Sector in Sub-Saharan Africa
83
The informal value chains (e.g. water sellers, night‐soil men) who address infrastructure in an informal community will resist formalization, seeing this as competition that will put them out of their jobs.
Estimating revenues from would‐be beneficiaries would be difficult to underwrite due to uncertainty of adoption of new technologies/delivery systems in place of existing informal systems.
For municipalities, these financial realities will not reverse themselves for many years. Expansion of the trunk infrastructure will continue to flow to the higher‐value sections of the city, rather than to the peri‐urban areas. If a peri‐urban area becomes suddenly much more valuable (owing to locational improvement as a consequence of urban growth), then it is likely land price increases will encourage eviction or displacement of the peri‐urban dwellers to clear the site for new investment in uses with higher returns.206 The resulting development may generate localized economic activity and tax revenue, but would not reduce income inequality or reduce poverty because it would move low income groups to another part of the city with lower costs of living. Social infrastructure, such as schools or clinics are also services that governments can plan and site in certain areas in order to encourage growth in certain areas, such as those with less exposure to natural hazard risk.
One way to reduce displacement is to link concessionary finance with the condition that such development be engaging and inclusive of low income groups that reside in neighborhoods set for private investment. Such processes are feasible and are stronger if supported by national law, an example of which being India’s Slum Relocation Act. In other countries, though not in Sub‐Saharan Africa, large developers will sometimes arrange with municipalities that the developer will provide the trunk infrastructure in exchange for VAT or tax concessions. This has proven effective as a means of expanding the infrastructure grid into peri‐urban areas, though of course it is self‐selected for the better neighborhoods, not the poorer ones. Governments could target infrastructure upgrading by providing implicit or explicit subsidies (e.g. VAT waivers) for developers that add infrastructure for residential development, with particular emphasis on recovering cost so that the project is economically sustainable, and can maintain and extend their systems.
Incubate and fund capacity‐building for ‘group owners’ (e.g., co‐operatives) that are formal entities whose members or beneficiaries are or may be wholly informal, so that these entities can be bulk buyers (and even collective owners) of higher‐density multi‐family properties.
Development finance and construction activities are limited by risks related to off‐take, or consumption of housing units at a scale that makes investment less risky. Self‐built homes are seldom sold and occupants obtain value from the use of the dwelling or renting rooms or portions of the property to others such as family members.
One way to enhance the demand for new housing would be to formalize rules under which a low‐income neighborhood or savings co‐operative could become titular owner of a multi‐home compound, structure, or set of plots, with individual rights that are worked out among the owners. Both legal forms of condominium (sectional title) and co‐operative (entity as owner of record and renter to shareholder members) have been used widely around the world for precisely this type of problem, and in many countries, co‐operatives, in particular, are seen as a permissible and legitimate form of ownership, and hence a source of offtake guarantees for developers seeking to recoup their capital and deploy it into the next development.

Stocktaking of the Housing Sector in Sub-Saharan Africa
84
Authorization of condominiums and co‐operatives should go hand‐in‐hand with demand‐side innovation. Government should prioritize upgrading of informal settlements by channeling housing production subsidies to informal settlement upgrading and housing improvement in existing informal settlements, rather than all into government‐led formal social housing programs that produce many fewer units, that in turn prove economically out of reach of the vast majority of the target population.
Support alternative approaches for improving access to credit, such as microloans, for home improvement
An example of this is the model of informally employed field operations staff and recruiters (usually women) who work as neighborhood‐based HMF originators, application‐facilitators, and subsequent loan servicers. Application is the process of identifying potential borrowers for a loan product, educating them as to its benefits, and value‐engineering the application. Successful MFIs and HMF lenders use individuals as a combination of recruiting agent, loan applications collector, property inspector, and loan servicer. These are typically people from the same community as the target customers— informally employed women.207 These individual agents have consistently proven to establish trust with customers and their follow‐up activities, while classified as loan servicing, are believed broadly to have proven successful at reducing the duration, severity, and loss of MFI defaults.
These people are as important to informal housing demand‐side interventions as are mortgage lenders and underwriters to formal supply‐side housing finance. In addition, they are more numerous and much more cost‐effective to develop, educate, and professionalize. Actions logically implied by the evidence include expanding Community HMF Promoter capacity via:
Low‐cost education seminars on customer financial literacy and lending training, followed by a written proficiency examination leading to a form of certification, preferably a standard endorsed by established microfinance institutions or trade associations of Non‐Banking Financial Companies (NBFCs).
Development of a code of ethics and fair dealing.
Aggregation and pooling of experience on effective practices for community promoters, perhaps via member‐based organizations that are providing establishment or incubation funding by governmental entities.
Develop an effective typology of informal assets and a similar definition of a Qualified Informal HMF Borrower, which can be used across multiple countries in Sub‐Saharan Africa.
As many people lack formal income or large assets that can be used as collateral, an alternative means of assessing creditworthiness must be established across the region. In this context, eligibility refers not to formal statutory or regulatory criteria, but rather to explicit or implicit biases or standards normally embedded in financing products or in demand‐side value chains and entities. Initiatives for consideration could include the ones that use a definition of Qualified Informal HMF Borrower incorporating inclusive informal housing HMF principles (shown in Box 14 below).

Stocktaking of the Housing Sector in Sub-Saharan Africa
85
Box 14. Qualified Informal HMF Borrower
A Qualified Informal HMF Borrower is a household meeting these criteria:
Has a durable right of occupancy in an existing informal dwelling that could benefit from a One‐Room Upgrade Loan (see definition).
Is informally employed at the time of loan, preferably in an activity where an improved home environment (e.g. an in‐home toilet) can be connected to likely increases in informal income
Has an income, however informal, that on past performance (e.g. savings history or MFI repayment history) shows a business case for having effective demand for the One‐Room Upgrade Loan.a
May have access to extended‐family resources (e.g. guarantors, remitting relatives either domestic or international) or intra‐neighborhood resources (e.g. a savings co‐operative) that can be plausibly included as repayment elements or default mitigants.
Source: World Bank data. Note: a. Demonstrated willingness to pay and ability to pay for a financing product of a size, loan term, and interest rate compatible with an HMF loan to build or improve one room in an informal urban house.
As noted, inherent in the Qualified Informal HMF Borrower definition is an expectation of a minimum‐size One‐Room Upgrade Loan (Box 15).
Box 15. Example: One-Room Upgrade Loan
A “One‐Room Upgrade Loan” is the smallest amount of money, within any particular country, that is sufficient for any of the following purposes:
To add a structurally sound (floor slab, walls, roof, windows, door) rough‐finished room onto an existing house.
To finish the interior of a rough‐finished room: non‐dirt floor; walls surfaced with durable materials (e.g. ceramic tile); weatherization joins around apertures; connections for water cistern, toilet, and electrical appliances.
The One‐Room Upgrade Loan is also presumed to come (a) from a non‐depository, non‐bank lending institution (such as an MFI or HFC) which has no access to inherent below‐market capital (e.g. from low‐interest community savings co‐operatives), (b) with an interest rate commensurate with market principles (i.e. higher than mortgage collateral, lower than microfinance), and (c) over a loan term (tenor) that is no greater than the expected tenure life of the one‐room upgrade for which it will be used.
Source: World Bank data.
In Sub‐Saharan Africa (and especially in the countries studied), a typical microfinance loan will be too little to meet the One‐Room Upgrading test, and that in turn compels a longer loan tenor than in the microfinance business and risk‐management model. These definitions should be formally enabled by government, either through waivers of banking or MFI regulations for a portion of the HMF lender’s portfolio, or by connection to approved pilot schemes.

Stocktaking of the Housing Sector in Sub-Saharan Africa
86
C. Harnessing the Formal Housing Sector for Economic Growth
Though the formal housing sector in most of the region is small, government support can encourage both the expansion of the formal housing delivery system down market, while at the same time enabling the formal housing sector to become an important driver of the national economy. Presently, most housing investment occurs through household savings or direct government investment, rather than international capital markets. These policy directions are aimed at improving formal lenders’ access to capital markets, which will strengthen mortgage markets and increase competition between lenders. Housing delivery also requires the coordination with overlapping sectors, such as construction firms, real estate agencies, appraisers, property manages and others which face impediments to growth. Allowing banks to more easily obtain secondary finance improves the variety and accessibility of consumer mortgages and sources of developer finance, which in turn stimulate both local and national economic growth.
Key areas for policy attention include:
Create domestic national‐level and state‐level development‐finance products and lending as a recognized commercial banking activity, which are in many ways more important than even liquidity facilities.
Countries that have a shortage of mortgage finance (for end‐user homeowners) likewise have no practical source of development finance (e.g. the classical developed‐nation construction loan or its predecessor, the land‐acquisition loan). Hence the presence, in countries such as Nigeria, of banks acting as de facto co‐developers because they will (i) accept off‐plan sale deposits and then (ii) allow developers to use those off‐plan‐sale deposits as cash for the property’s development, with no escrow or other form of consumer protection. Elsewhere, without loan finance, prospective owners must pay 100 percent up front before occupation, as in Ethiopia, Ghana and other places. Policy recommendation: Encourage employer‐assisted housing schemes through employer‐based provident funds to lower their employees’ cost of mortgage finance. As noted on the demand‐side discussion, the small size of the formal mortgage markets inhibits offtake of newly built homes. While that is a demand‐side failure, it also impacts the supply side, because developers have difficulty securing construction financing (discussed above). Some nations have used large formal employers, either public sector (e.g. police, hospital workers, the military) or private sector (e.g. banks, natural resource companies, utilities) as an intermediate buyer or aggregator of buyers, via employer‐assisted housing schemes or provident funds (which are an employer‐managed payroll‐deduction savings scheme that acts much like a credit union, or even an employer‐based tontine). In Ethiopia, the presence of so many large Chinese natural‐resource and manufacturing companies offers a unique opportunity to create employer‐assisted housing schemes. Though sensible, these innovations were not observed in the three studied Sub‐Saharan African countries. Indeed, throughout the region, mechanisms to aggregate potential buyers into an effective unitary counterparty for a developer are largely absent and warrant further consideration.
Continue to support, establish, capitalize, and improve national‐level secondary‐market liquidity facilities, products, and entities.
Primary Mortgage Institutions (PMIs) that are not deposit‐taking entities always face the ongoing challenge of liquidity. Their initial capital may be used to create a loan portfolio, but that loan portfolio is

Stocktaking of the Housing Sector in Sub-Saharan Africa
87
illiquid until and unless a secondary‐market liquidity provider is created. No such liquidity facility exists in Nigeria, for example, and its creation is the principal purpose of the recently approved US$300 million World Bank loan to Nigeria. Ethiopia addresses this by having government‐run banks as the mortgage givers, guaranteed by the Ministry of Finance. Otherwise, deposit‐taking institutions are generally regulated as banks, and as banks, are generally prohibited from engaging in loans with interest rates high enough to support HMF, or with non‐mortgageable‐collateral. Nor are banks interested in fostering bottom‐up competition that might erode their healthy profit margins on mortgage lending. This is a regional problem and a significant missing link in demand‐side informal housing finance.
Finally, additional research and data are needed to inform housing policy interventions. Low per‐capita incomes limit how much many households can spend on housing and, given the plurality of rental, ownership, and home construction patterns, a more nuanced understanding of affordability is critical. Research is needed that directly examines the scope and nature of the informal housing sector, including cross‐sectoral links to informal water, sanitation and health and informal income generation. Additional research should document the costs of each of the different inputs into housing production, ranging from land, building materials, labor and finance. This would allow countries to identify specific links in value chains that deserve the most urgent policy attention. This report and the country case studies demonstrate the importance of higher‐level country‐specific reports and diagnostics to inform policy priorities, rather than city‐, project‐ or exclusive sub‐sectoral‐level analyses (e.g. of construction or finance).
This report has shown that measures used to assess housing affordability in developed economies may be incomplete or misleading in assessing informal housing in SSA. Targeting housing support for the improvement of informal housing – ranging from slums to semi‐formal shelter – can be done more efficiently and in a way that is more suitable to urban dwellers’ needs and within their affordability constraints. Policy makers need a regionally‐appropriate concept of affordability based on multiple country case studies, an understanding of the production costs for different types of housing, and how informal housing markets operate in terms of prices, finance sources, and volumes. Additional research is necessary to understand how to better identify target groups for different types of housing subsidies, on both the consumer and supply sides, and at different linkages in the value chains in order to improve efficiencies and direct resources to the areas of greatest need. In particular, this would demand a better understanding of the ‘middle’ population that could be reached by housing microfinance products.

Stocktaking of the Housing Sector in Sub-Saharan Africa
88
References
Abdullahi, Bawa Chaf, and Abd Aziz, Wan Nor Azriyati Wan. 2011. “The Role of Private Sector
Participation in Achieving Anticipated Outcomes for Low‐Income Group: A Comparative Analysis of Housing Sector between Malaysia and Nigeria.” African Journal of Business Management 5(16): 6859–6890.
Abrams, Charles. 1964. Man’s Struggle for Shelter in an Urbanizing World. Cambridge, MA: MIT Press.
African Development Bank Group. 2011. “The Africa Infrastructure Knowledge Program.” http://www.infrastructureafrica.org/.
———. 2015. “Housing Market Dynamics in Africa” Presented at the 6th Annual Conference on Regional Integration, Lagos, July 1‐2.
Agence Francaise Developpement (AFD). 2013. “The AFD and Lafarge Partner in Microfinance for Affordable Housing in Nigeria.” Agence Francaise Developpement: Shaping Sustainable Futures, n.d. http://www.afd.fr/lang/en/home/pays/afrique/geo‐afr/nigeria?actuCtnId=104030.
Andersson, Lisa. “Migration, Remittances and Household Welfare in Ethiopia.” Department of Economics, University of Gothenburg, 2012.
Angel, Shlomo. 2012. Planet of Cities. Boston MA: Lincoln Institute of Land Development.
———. 2000. Housing Policy Matters: A Global Analysis Oxford Press: New York
Attanasio, Orazio Augsburg, Britta, de Haas, Ralph, Fitzsimons, Emla and Heike Harmgart. 2015. “The Impacts of Microfinance: Evidence from Joint‐Liability Lending in Mongolia” American Economic Journal: Applied Economics 7(1): 90–122.
Badev, Anton, Thorsten Beck, Ligia Vado, and Simon Walley. 2013. “Housing Finance Across Countries: New Data and Analysis (Draft).” June. World Bank, Washington, DC.
Banerjee, Abhijit, Esther Duflo, Rachel Glennerster, and Cynthia Kinnan. 2015. “The Miracle of Microfinance? Evidence from a Randomized Evaluation” American Economic Journal: Applied Economics 7(1): 22–53.
Baross, Paul. 1987. “Land Supply for Low‐Income Housing: Issues and Approaches.” Regional Development Dialogue 8: 29–45.
Barrios, Salvador, Eric Strobl, and Luisito Bertinelli. 2006. “Climactic Change and Rural‐Urban Migration: The Case of Sub‐Saharan Africa” Journal of Urban Economics 60(3): 357–371.
Belaunde, Sandra, Maria Cortes, Jonathan Hogstad, Enrique Ku, Kode Nascimento, and Leah Trzcinski. 2010. Land, Legitimacy and Governance in Cameroon. Institute for Research and Debate on Governance.

Stocktaking of the Housing Sector in Sub-Saharan Africa
89
Besong, Ben Ayuk. 2011. “The Cameroonian Banking and Financial Sector.” Ministry of Finance Cameroon.
Bradlow, Benjamin, Joel Bolnick, and Clifford Shearing. 2011. “Housing, Institutions, and Money: The Failures and Promise of Human Settlements Policy and Practice in South Africa.” In Environment and Urbanization. Institute for Environment and Development.
Buckley, Robert M., and Jerry Kalarickal. Shelter Strategies for The Urban Poor: Idiosyncratic and Successful, but Hardly Mysterious. The World Bank, 2004.
Byamugisha, Frank. 2013. “Securing Africa’s Land for Shared Prosperity” World Bank. http://www‐wds.worldbank.org/external/default/WDSContentServer/WDSP/IB/2013/05/31/000445729_20130531122716/Rendered/PDF/780850PUB0EPI00LIC00pubdate05024013.pdf.
Cameroon, Republic of. 2013. “3rd Periodic Report of Cameroon within the Framework of the Arican Charter on Human and People’s Rights.” Banjul.
CAHF (Centre for Affordable Housing Finance in Africa). 2012. 2012 Yearbook—Housing Finance in Africa: A Review of Some of Africa’s Housing Finance Markets. Parkview, South Africa: CHAF.
———. 2012. “Makao Mashinani Limitedhttp://www.housingfinanceafrica.org/link/makao‐mashinani‐limited/.
———. 2013. 2013 Housing Finance Yearbook. Parkview, South Africa: CHAF.
Charlier, Florence, and Charles N’Cho‐Oguie. 2009. Sustaining Reforms for Inclusive Growth in Cameroon: A Development Policy Review. World Bank.
Choguill, C. 1999. “Community infrastructure for low‐income cities: The potential of progressive
improvement” Habitat International Vol. 23, No. 2, pp. 289‐301
Coetzer, Pierre. 2010. Moladi—An Affordable Housing Solution for the Poor? New York: UNDP.
Cohen, M.A. 2007. “Aid, Density and Urban Form: Anticipating Dakar.” Built Environment 33(2): 145–156.
Clarke Annez, Patricia, and Robert M. Buckley. 2009 “Urbanization and Growth: Setting the Context.” In Urbanization and Growth eds. Michael Spence, Patricia Annez Clarke, and Robert M. Buckley. World Bank: Washington, DC
Collier, Paul, and Anthony J. Venables. Housing and Urbanization in Africa: Unleashing a Formal Market Process. Centre for the Study of African Economies, 2013.
Construction Industry Development Board, 2007. The Building and Construction Materials Sector, Challenges and Opportunities. South Africa: The Construction Industry Development Board.
Credit Foncier, n.d. www.creditfoncier.cm.
Dasgupta, Basab, Somik V. Lall, and Nancy Lozano‐Gracia. 2014. Urbanization and Housing Investment. Draft Report, The World Bank.

Stocktaking of the Housing Sector in Sub-Saharan Africa
90
Demirguc‐Kunt, Asli, and Leora Klapper. 2012. “Measuring Financial Inclusion: The Global Findex Database.” World Bank, April 2012. http://www‐wds.worldbank.org/external/default /WDSContentServer/IW3P/IB/2012/04/19/000158349_20120419083611/Rendered/PDF/WPS6025.pdf.
Dixon, Rob, John Ritchie, and Juliana Siwale. 2007. “Loan officers and loan delinquency in Microfinance:
A Zambian case.” Accounting Forum 31(1):47‐71.
Durand‐Lasserve, Alain, Maylis Durand‐Lasserve, and Harris Selod. 2015. Land Delivery Systems in West
African Cities: The Example of Bamako, Mali. World Bank, Washington DC.
Ebeke, Christian, Boileau Loko, and Arina Viseth. 2014. “Credit Quality in Developing Economies: Remittances to the Rescue?” International Monetary Fund, August. http://www.hofinet.org /upload_docs/Credit%20Quality%20in%20Developing%20Economies.pdf.
Ensminger, Jean. “Changing Property Rights: Reconciling Formal and Informal Rights to Land in Africa.” In The Frontiers of the New Institutional Economics, edited by John N. Drobak and John V.C. Nye, 165–96. San Diego: Academic Press, 1997.
Ethiopia Population and Housing Census, 2007.
European Investment Bank. 2013. Banking in Sub‐Saharan Africa: Challenges and Opportunities. Luxembourg.
Faye, M. and Opal, C. 2000. “Urbanization without Growth: A Not‐So‐Uncommon Phenomenon.” World Bank Policy Research Working Paper 2412.
Foster, Vivien. 2008. “Overhauling the Engine of Growth: Infrastructure in Africa.” World Bank, Washington DC. September. http://siteresources.worldbank.org/EXTPRAL/Resources/africa_ country_diagnostic.pdf.
Ferguson, B. 1999. “Microfinance of housing: a key to housing the low or moderate income majority?” Environment and Urbanization, Vol. 11, No. 1, pp 185‐200.
Fotabong, Leonard Ajonakoh. 2012. The Microfinance Market of Cameroon: Analyzing Trends and Current Developments.
Habitat for Humanity, 2014. Shelter Report 2014: Supporting Incremental Building throughHousing Microfinance. Habitat for Humanity.
Halle, Nico. n.d. Banking in Cameroon (An Overview). Nico Halle & Co. Law Firm.
Hansen, Karen Tranber, and Mariken Vaa. 2004. Reconsidering Informality: Perspectives from Urban Africa. Uppsala: Nordic Africa Institute.
Harvard Joint Center for Housing Studies (JCHS). 2005. More than Shelter: Housing as an Instrument of Economic and Social Development ‐ Setting the Context: South Africa.

Stocktaking of the Housing Sector in Sub-Saharan Africa
91
———. n.d. “Setting the Context: South Africa (for More Than Shelter: Housing as an Instrument of Economic and Social Development).” Conference. http://www.jchs.harvard.edu/sites /jchs.harvard.edu/files/south_africa_background.pdf.
Helmore, Kristin. 2009. State of the Sector Report: Bringing Financial Services to Africa’s Poor. Canada: CARE.
Henderson, J, Mark Roberts, and Adam Storeygard. 2013. “Is Urbanization in Sub‐Saharan Africa Different?” World Bank. http://www.hofinet.org/upload_docs/UPLOADED_Henderson%20storeygard%20Roberts%20Is%20African%20Urbanization%20Different%206‐2013.pdf.
Hoek‐Smit, Maria C. 2012. Scaling up Housing Finance in Africa. St. Catherine’s College, Oxford: University of Pennsylvania.
HOFINET (Housing Finance Information Network). 2013. ‘Sub‐Saharan Africa” http://www.hofinet.org /countries/region.aspx?regionID=8&id=13
Huit, Groupe. 2009. Évaluation Des Capacités Des Acteurs Publics et Prives Du Secteur de l’Habitat Social Au Cameroun. Communauté Urbaine de Douala—MINDUH.
Ikejiofor, U. 1997. “The Private Sector and Urban Housing Production Process in Nigeria: A Study of Small‐Scale Landlords in Abuja.” Habitat International 21(4): 409‐425.
IMF Financial Access Survey, n.d. http://fas.imf.org.
Javelle, Anne‐Gaelle. 2013. Cameroon: Land Registration in Cameroon.
Jenkins, Paul. 2004. “Beyond the Formal/Informal Dichotomy: Access to Land in Maputo, Mozambique.” In Reconsidering Informality: Perspectives from Urban Africa, edited by Karen Tranber Hansen and Mariken Vaa, 210–26. Uppsala: Nordic Africa Institute.
Johnson, S., and M. Matela. 2011. Reforming Land Administration in Lesotho: Rebuilding the Institutions. http://www.landadmin.co.uk/Documents/PN‐32%20Reforming%20Land%20Administration%20in%20Lesotho.pdf
Kalema, William, and Duncan Kayiira. 2008. Overview of the Housing Finance Sector in Uganda. Access to Housing Finance in Africa: Exploring the Issues. FinMark Trust, June 2008.
Kasanga, R.K., J. Chochranc, R. King, and M Roth. 1996. Land Markets and Legal Contradictions in the Peri‐Urban Area of Accra, Ghana: Informant Interviews and Secondary Data Investigations. Madison, WI: Land Tenure Center, University of Wisconsin‐Madison.
Kihato, Michael 2009. “Scoping the Demand for Housing Microfinance in Africa: Status, Opportunities, and Challenges.” Centre for Affordable Housing Finance in Africa, September. http://www.housingfinanceafrica.org/wp‐content/uploads/2009/09/HMF_Africa.pdf.
———.. 2012. Infrastructure and Housing Finance: Exploring the Issues in Africa. Centre for Affordable Housing Finance in Africa.

Stocktaking of the Housing Sector in Sub-Saharan Africa
92
———. 2013. State of Housing Microfinance in Africa. Centre for Affordable Housing Finance in Africa.
Kractovac, Anesa. 2013. “33 Microfinance Institutions to Close Down in Cameroon.” Microcapital.
Komu, F. 2011. Housing Decay and Maintenance: The Case of Public Housing in Tanzania. Doctoral Thesis, School of Architecture and Built Environment, KTH Royal Institute of Technology.
LaFarge. 2014. “Access to Housing: Ambitions 2020.” LaFarge: Building Better Cities, 2014. http://www.lafarge.com/wps/portal/2_7_1‐Ambitions‐2020‐Logement‐abordable#editoEncartVide0000000000035717.
Lozano‐Gracia, Nancy, and Cheryl Young. Housing Consumption and Urbanization (Draft). The World Bank, 2014.
Maffengang, Lea Pulcherie. Tontines: The Informal Financial Sector in Cameroon, 2013.
Majale, Michael et al. 2011. Affordable Land and Housing in Africa. Kenya: UN Habitat.
Malpezzi, S.K. and Ball, G. 1991. “Rent control in developing countries”, World Bank Discussion Papers
129, Washington DC.
Marx, B., Stoker, T. and Tavneet Suri. 2013. “The economics of slums in the developing world” Journal of
Economic Perspectives Vol. 27, No. 4, pp. 187‐210
Mazzolini, Anna. 2014. “Housing the New Urban Middle Class in Sub‐Saharan Africa.” IUAV Italy.
Ministère de l'Habitat et du Développement urbain (MINHDU), 2014. Interview with the Director, Department of Social Housing and Real Estate, MINHDU, 2014.
Mills, S. 2007. “The Kuyasa Fund: Housing Microcredit in South Africa.” Environment and Urbanization 19(2): 457–69.
MIX Market. 2013. “Africa Market Profile.” http://www.mixmarket.org/mfi/region/Africa.
———. n.d. “MIX Market Microfinance Institutions Database.”. http://mixmarket.org/mfi.
Mutero, James. Overview of the Housing Finance Sector in Tanzania. Access to Housing Finance in Africa: Exploring the Issues. FinMark Trust, n.d.
Mutero, James, Mwijage Bishota, William Kalema, and Duncan Kayiira. “Mobilizing Pension Assets for Housing Finance Needs in Africa—Experiences and Prospects in East Africa.” Centre for Affordable Housing Finance in Africa, December 2010. http://www.hofinet.org/upload_docs /CAHF_Mobilizing%20Pension%20Assets.pdf.
Nigeria Mortgage Refinance Company (NMRC). 2014. “NMRC: Frequently Asked Questions.” http://www.nmrc.com.ng/?page_id=26.
Norton, John. Building with Earth: A Handbook. London: Intermediate Technology Publications, Ltd., 1997.

Stocktaking of the Housing Sector in Sub-Saharan Africa
93
Office of the United Nations High Commissioner for Human Rights (OHCHR). 2013. “Cameroon: National Report Submitted in Accordance with Paragraph 5 of the Annex to Human Rights Council Resolution 16/21.” Geneva, 2013.
Payne. G. 2001. “Lowering the ladder: Regulatory Frameworks for Sustainable Development”
Development in Practice 11 (2‐3): 308–318.
———. 2005. “Getting ahead of the game: A twin‐track approach to improving existing slums and
reducing the need for future slums” Environment and Urbanization Vol 17. No. 1, pp‐135‐146
Payne, Geoffrey, and Michael Majale. 2004 The Urban Housing Manual: Making Regulatory Frameworks
Work for the Urban Poor Earthscan: New York.
Platteau, Jean‐Philippe. 1995. Reforming Land Rights in Sub‐Saharan Africa: Issues of Efficiency and Equity. Switzerland: United Nations Research Institute for Social Development.
Prahalad, C.K. 2004. Fortune at the bottom of the pyramid: Eradicating poverty through profits. Upper Saddle River, NJ: Prentice Hall
Rahman, Aminur. 1999. “Micro‐credit initiatives for equitable and sustainable development: Who pays?”
World Development 27(1):67‐82.
Ratha, Dilip. 2012. 2012 Data: Leveraging Migration for Africa. Washington, DC: The World Bank.
Ratha, Dilip, et al. 2011. Leveraging Migration for Africa: Remittances, Skills, Investments. Washington, DC: The World Bank.
Socio‐Economic Rights Institute of South Africa (SERI). 2011. “A Resource Guide to Housing in South Africa 1994‐2010: Legislation, Policy, Programmes and Practice.” Mimeo.
Shelter‐Afrique Center. 2012. “Shelter Afrique and Makao Mashinani LTD (Kenya) Sign Agreement for a Social Housing Loan of KSHS 40,000,000.” Shelter Afrique, July 12. http://www.shelterafrique.org/index.php/shelter‐afrique‐and‐makao‐mashinani‐limited‐kenya‐sign‐agreement‐for‐a‐social‐housing‐loan‐of‐kshs‐40000000/.
———. 2014. Shelter‐Afrique: 2013 Annual Report and Financial Statements. Nairobi: Shelter‐Afrique Center.
Tipple, Graham. 2012. Regional Assessment of the GSS, 2000: Sub‐Saharan Africa.
Tipple, A. G., B. Amole, D. Korboe and H. Onyeacholem. 1994. "House and Dwelling, Family and Household." Third World Planning Review 16 (4): 429‐50.
Tipple, Graham, and Suzanne Speak. 2009. The Hidden Millions: Homelessness in Developing Countries. London: Routledge.
Tipple, A. G., D. Korboe, G. Garrod, and K. Willis. 1999. “Housing Supply in Ghana: A Study of Accra, Kumasi and Berekum.” Progress in Planning 51(4): 253–324.

Stocktaking of the Housing Sector in Sub-Saharan Africa
94
Toulmin, Camilla. 2005. “Securing Land and Property Rights in Sub‐Saharan Africa: The Role of Local Institutions.” Switzerland.
Triki, Thouraya, and Issa Faye. 2013. Financial Inclusion in Africa. Tunisia: African Development Bank.
UN (United Nations). 2014. World Urbanization Prospects 2014 Revisions United Nations: New York
UN‐Habitat. 2006. Enabling Shelter Strategies: Review of Experience from Two Decades of Implementation. Kenya: UN Habitat, 2006.
———. 2008. State of the World’s Cities 2010‐2011: Bridging the Urban Divide. UN Habitat: Nairobi.
———. 2010. “Urban Land Markets: Economic Concepts and Tools for Engaging in Africa” UN‐Habitat: Nairobi
———. 2011a. Ghana Housing Profile. UN Habitat, 2011. http://mirror.unhabitat.org/pmss/ listItemDetails.aspx?publicationID=3258.
———. 2011b. Malawi Housing Sector Profile UH‐Habitat: Nairobi
———. 2012. Zambia Urban Housing Sector Profile. UN Habitat: Nairobi.
———. 2014. Liberia Housing Profile UN‐Habitat: Nairobi.
UN‐Habitat and Cities Alliance. 2011. Rental Housing: A Much Neglected Housing Option for the Poor. Housing the Poor in African Cities.
UN‐HABITAT and Urban LandMark. 2010. “Africa’s Urban Land Markets: Piecing Together an Economic Puzzle.” http://www.urbanlandmark.org.za/downloads/handbook_aulm_2010.pdf.
UNHCS and ILO. 1995. Shelter Provision and Employment Generation. Nairobi and Geneva: UNHCS and ILO.
United Nations Population Division. 2008. An Overview of Urbanization, Internal Migration, Population Distribution and Development in the World. http://sustainabledevelopment.un.org/content /documents/2529P01_UNPopDiv.pdf.
USAID. 2010. “USAID Country Profile Property Rights and Resource Governance: Namibia.” USAID, October. http://usaidlandtenure.net/sites/default/files/country‐profiles/full‐reports/USAID _Land_Tenure_Namibia_Profile.pdf.
Willis, K.G., and A.G. Tipple. 1991. “Discriminant Analysis: Tenure Choice and Demand for Housing Services in Kumasi, Ghana.” In Housing the Poor in the Developing World: Methods of Analysis, Case Studies and Policy, edited by A. G. Tipple and K. G. Willis, 126–42. London: Routledge.
World Bank. 2011. “Developing Kenya’s Mortgage Market.” Washington, DC: World Bank. http://siteresources.worldbank.org/FINANCIALSECTOR/Resources/Kenya_Expanding_Mortgage_Finance_May_2011.pdf.

Stocktaking of the Housing Sector in Sub-Saharan Africa
95
———. 2012. “Global Findex Database: Financial Inclusion Data.” Washington, DC: World Bank. http://datatopics.worldbank.org/financialinclusion/home/.
———. 2013a. “Doing Business 2014: Understanding Regulations for Small and Medium‐Size Enterprises.” Washington, DC: World Bank. http://www.doingbusiness.org/reports/global‐reports/doing‐business‐2014.
———. 2013b. “Doing Business: Measuring Business Regulations.” Washington, DC: World Bank. http://www.doingbusiness.org/.
———. 2013c. “Implementation Completion and Results Report no. ICR1359, Urban Development Project.” Washington, DC: World Bank.
———. 2013d. “Migration and Remittance Flows: Recent Trends and Outlook, 2013‐2016.” Washington, DC: World Bank. http://siteresources.worldbank.org/INTPROSPECTS/Resources/334934‐1288990760745/MigrationandDevelopmentBrief21.pdf.
———. 2013e. World Development Indicators. Washington, DC: World Bank.
———. 2013f. Planning, Connecting and Financing Cities—Now: Priorities for City Leaders. Washington, DC: World Bank.
———. 2014a. “Doing Business 2014: Understanding Regulations for Small and Medium‐Size Enterprises.” Washington, DC: World Bank.
———. 2014b. “Urban Land Acquisition and Involuntary Resettlement: Linking Innovation and Local Benefits.” Washington, DC: World Bank.
———. 2014c. World Development Indicators. Washington, DC: World Bank.
———. 2015a (forthcoming). Ethiopia Urbanization Review. World Bank: Washington DC
———. 2015b. “Doing Business 2016: Measuring Regulatory Quality and Efficiency.” Washington, DC: World Bank.
World Resources Institute. 2007. The Next 4 Billion: Market Size and Business Strategy at the Base of the Pyramid. WRI: Washington, DC.

Stocktaking of the Housing Sector in Sub-Saharan Africa
96
Appendix 1. Affordability in Sub‐Saharan Africa
Definition of Housing Affordability in Sub-Saharan Africa
This report uses two working definitions of ‘housing affordability:
Demand‐based definition Supply‐based definition
Total Cost of Urban Living 60% of Household Income
Total Cost of Occupancy Amount paid by a
median‐income urban household for TCO
Definitions of TCO and TCUL are provided below.
Though both these definitions could be quantified, as the report makes clear, information does not exist to provide reliable estimates of affordable housing supply using either method, a negative finding sufficient for this stocktaking.
The Tacit Assumptions of Developed-World Housing Affordability Metrics
Though ‘housing affordability’ as a concept is globally comprehensible and locally understood, many local contexts define housing affordability in ways that are not portable from region to region. This makes adopting and using a universal definition difficult.
In developed economies, with relatively efficient housing markets in both supply side (homes) and demand side (mortgage loans), a widely accepted rule‐of‐thumb sets affordability at 30 percent of household income. In those economies the definition is robust: it applies to the overwhelming majority of households, housing markets, and program definitions. But the rule has implicitly embedded within it a set of assumptions about the similarity of markets across income levels, cities, countries, and regions—assumptions that break down when dealing with:
Very poor populations, many of whom are economic migrants into the city, where non‐cash resources are a big part of total value.
Rapidly growing cities with vast informal or peri‐urban areas where utilities are absent and hence daily essential utility costs are high.
Developing nations whose governance systems, especially in land and title, inhibit or disable market efficiency and responsiveness.
Sub‐Saharan Africa as a region, where land systems and mortgage collateral systems are both in their earliest stages, and where many millions of urban households do not regard a dwelling as a marketable good.
Total Cost of Urban Living (TCUL)
For any household, total monthly expenses divide into five categories: (1) housing/shelter (including basic utilities); (2) transportation (especially the daily commute); (3) food for the family; (4) family necessities (clothing, household goods); and (5) aspirational investments (savings, children’s education, income‐generation assets).
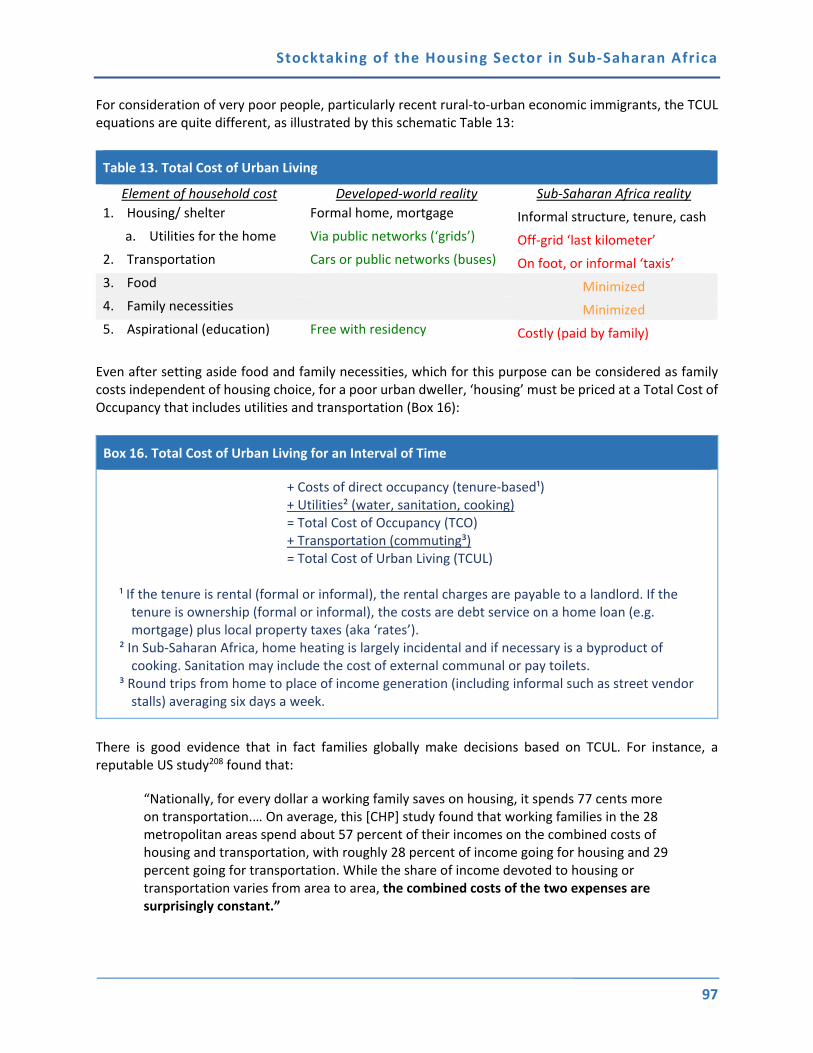
Stocktaking of the Housing Sector in Sub-Saharan Africa
97
For consideration of very poor people, particularly recent rural‐to‐urban economic immigrants, the TCUL equations are quite different, as illustrated by this schematic Table 13:
Table 13. Total Cost of Urban Living
Element of household cost Developed‐world reality Sub‐Saharan Africa reality
1. Housing/ shelter Formal home, mortgage Informal structure, tenure, cash
a. Utilities for the home Via public networks (‘grids’) Off‐grid ‘last kilometer’
2. Transportation Cars or public networks (buses) On foot, or informal ‘taxis’
3. Food Minimized
4. Family necessities Minimized
5. Aspirational (education) Free with residency Costly (paid by family)
Even after setting aside food and family necessities, which for this purpose can be considered as family costs independent of housing choice, for a poor urban dweller, ‘housing’ must be priced at a Total Cost of Occupancy that includes utilities and transportation (Box 16):
Box 16. Total Cost of Urban Living for an Interval of Time
+ Costs of direct occupancy (tenure‐based¹) + Utilities² (water, sanitation, cooking) = Total Cost of Occupancy (TCO) + Transportation (commuting³) = Total Cost of Urban Living (TCUL)
¹ If the tenure is rental (formal or informal), the rental charges are payable to a landlord. If the tenure is ownership (formal or informal), the costs are debt service on a home loan (e.g. mortgage) plus local property taxes (aka ‘rates’).
² In Sub‐Saharan Africa, home heating is largely incidental and if necessary is a byproduct of cooking. Sanitation may include the cost of external communal or pay toilets.
³ Round trips from home to place of income generation (including informal such as street vendor stalls) averaging six days a week.
There is good evidence that in fact families globally make decisions based on TCUL. For instance, a reputable US study208 found that:
“Nationally, for every dollar a working family saves on housing, it spends 77 cents more on transportation.… On average, this [CHP] study found that working families in the 28 metropolitan areas spend about 57 percent of their incomes on the combined costs of housing and transportation, with roughly 28 percent of income going for housing and 29 percent going for transportation. While the share of income devoted to housing or transportation varies from area to area, the combined costs of the two expenses are surprisingly constant.”

Stocktaking of the Housing Sector in Sub-Saharan Africa
98
As indicated by the foregoing, unlike rural families, for urban families, transportation costs were actually higher than housing costs—in other words, shifting to job‐growth centers increased the importance of transportation as a component in ability to pay for, and consumption of, housing.
Tradeoffs made by poor informally employed urban dwellers in Sub-Saharan Africa
These findings can be extended into other contexts; in particular, poor people who move to cities do so for economic motivations, with several frequently observed consequences and choices:
Many informally employed urban dwellers walk from their home to their place of daily work;209 this enables them to pay much higher percentages of income for housing because they are shifting the components of their TCUL, not changing their TCUL.
Many informally employed urban households also choose deliberately to under‐consume housing so as to fit within a manageable spending envelope.210
Many informal entrepreneurs choose to increase their hours of work to improve their income flow for a short period when construction is possible. This may not be possible for long so building incrementally, informally, simple structures, by stages, with cash, suits their needs.
In tenure situations where ownership cannot be collateralized (that is, a homeowner who cannot access finance, a landlord owner who will not or cannot resell a property, or a rental tenant), there may be economic motivations not to invest in the property, leading to income‐constrained housing consumption that is not deducible from statistics.
Additions to existing properties are, therefore, likely to be popular if finance is available whereas building elsewhere on a planned layout might not be.
Further, housing size and housing consumption are not income‐independent; as a nation’s per‐capita GDP rises, (a) average household size (people per household) tends to decline and (b) housing consumption (square meters of dwelling area per person) tends to increase. This occurs at different rates so housing consumption across countries211 cannot be perfectly ordered by their GDP; e.g., Ghana’s urban households (GDP per capita = $1,850) consume less housing than Malawi’s urban households (GDP per capita = $226). Furthermore, dwelling size can increase household size, as relatives seek to capitalize on ‘spare’ space as a place to stay in the city while free‐riding on a household head, which, in turn, reduces household per capita consumption.
Policy implications
‘Affordability’ as a concept is a continuum. While 30 percent of income may be a useful norm for stabilized mature economies with functioning supply‐side and demand‐side housing delivery systems, in emerging countries higher levels of income may be considered affordable, especially in cities with rapid economic expansion leading to rapid urban population growth. Each country may have different supply conditions, consumption patterns, and preferences, which may make a 30 percent threshold inappropriate for assessing the scale of excessive spending on housing. Thus a more practical gradation might be the following:
Housing/income <25% 25‐30% 30‐35% 35‐40% 40‐45% >45%
Affordability Excellent Very good Good Fair Burdened Severe

Stocktaking of the Housing Sector in Sub-Saharan Africa
99
Poor people may be willing to pay more than 30 percent of their income as TCO. The poorest, however, have other competing expenditure priorities, such as food, and may not be able to pay this amount for housing. Temporary homelessness, shelter sharing or rent‐free arrangements are responses to this.212 For these households, this represents a tradeoff of the possibility of savings accumulation in lieu of adequate shelter. Extremely poor people facing high transportation or utility costs will simply do without them, and choose a corresponding housing solution. This may also increase homelessness as a wage‐earner may choose, during the work week, to live on the streets close to work.
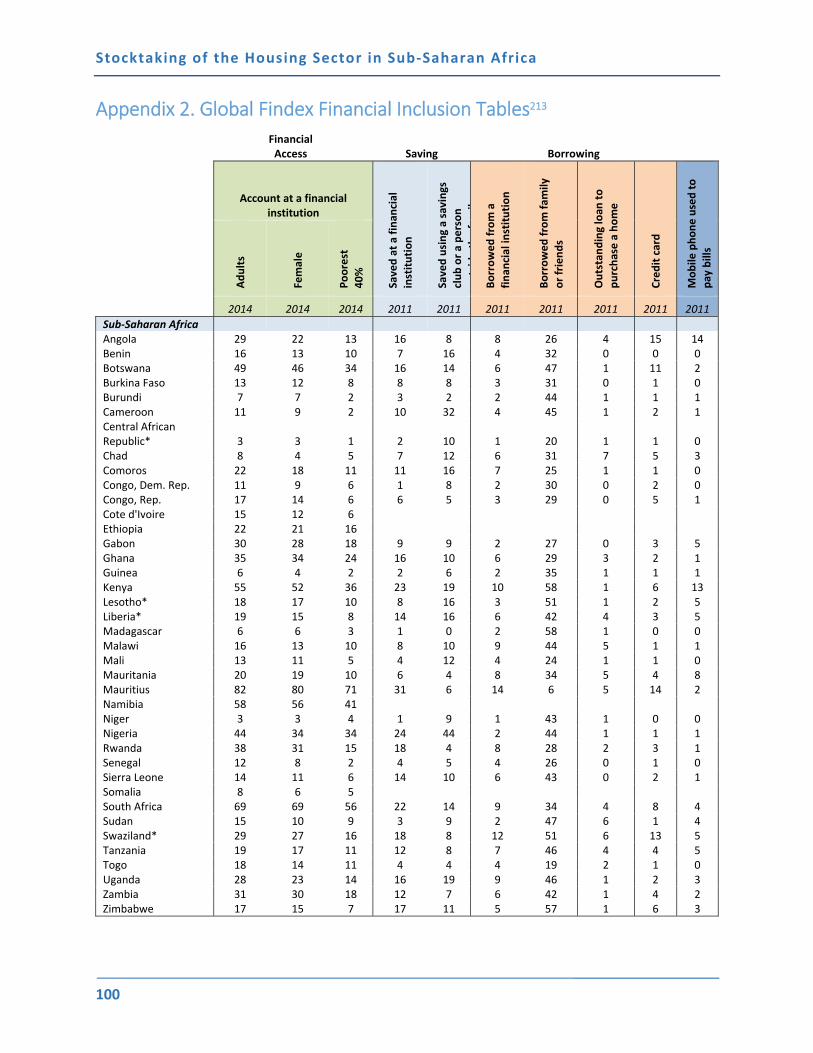
Stocktaking of the Housing Sector in Sub-Saharan Africa
100
Appendix 2. Global Findex Financial Inclusion Tables213
Financial Access Saving Borrowing
Account at a financial institution
Saved at a finan
cial
institution
Saved using a savings
club or a person
tid
thf
il
Borrowed from a
finan
cial institution
Borrowed from fam
ily
or friends
Outstanding loan
to
purchase a home
Credit card
Mobile
phone used to
pay bills
Adults
Female
Poorest
40%
2014 2014 2014 2011 2011 2011 2011 2011 2011 2011
Sub‐Saharan Africa Angola 29 22 13 16 8 8 26 4 15 14 Benin 16 13 10 7 16 4 32 0 0 0 Botswana 49 46 34 16 14 6 47 1 11 2 Burkina Faso 13 12 8 8 8 3 31 0 1 0 Burundi 7 7 2 3 2 2 44 1 1 1 Cameroon 11 9 2 10 32 4 45 1 2 1 Central African Republic* 3 3 1 2 10 1 20 1 1 0 Chad 8 4 5 7 12 6 31 7 5 3 Comoros 22 18 11 11 16 7 25 1 1 0 Congo, Dem. Rep. 11 9 6 1 8 2 30 0 2 0 Congo, Rep. 17 14 6 6 5 3 29 0 5 1 Cote d'Ivoire 15 12 6 Ethiopia 22 21 16 Gabon 30 28 18 9 9 2 27 0 3 5 Ghana 35 34 24 16 10 6 29 3 2 1 Guinea 6 4 2 2 6 2 35 1 1 1 Kenya 55 52 36 23 19 10 58 1 6 13 Lesotho* 18 17 10 8 16 3 51 1 2 5 Liberia* 19 15 8 14 16 6 42 4 3 5 Madagascar 6 6 3 1 0 2 58 1 0 0 Malawi 16 13 10 8 10 9 44 5 1 1 Mali 13 11 5 4 12 4 24 1 1 0 Mauritania 20 19 10 6 4 8 34 5 4 8 Mauritius 82 80 71 31 6 14 6 5 14 2 Namibia 58 56 41 Niger 3 3 4 1 9 1 43 1 0 0 Nigeria 44 34 34 24 44 2 44 1 1 1 Rwanda 38 31 15 18 4 8 28 2 3 1 Senegal 12 8 2 4 5 4 26 0 1 0 Sierra Leone 14 11 6 14 10 6 43 0 2 1 Somalia 8 6 5 South Africa 69 69 56 22 14 9 34 4 8 4 Sudan 15 10 9 3 9 2 47 6 1 4 Swaziland* 29 27 16 18 8 12 51 6 13 5 Tanzania 19 17 11 12 8 7 46 4 4 5 Togo 18 14 11 4 4 4 19 2 1 0 Uganda 28 23 14 16 19 9 46 1 2 3 Zambia 31 30 18 12 7 6 42 1 4 2 Zimbabwe 17 15 7 17 11 5 57 1 6 3
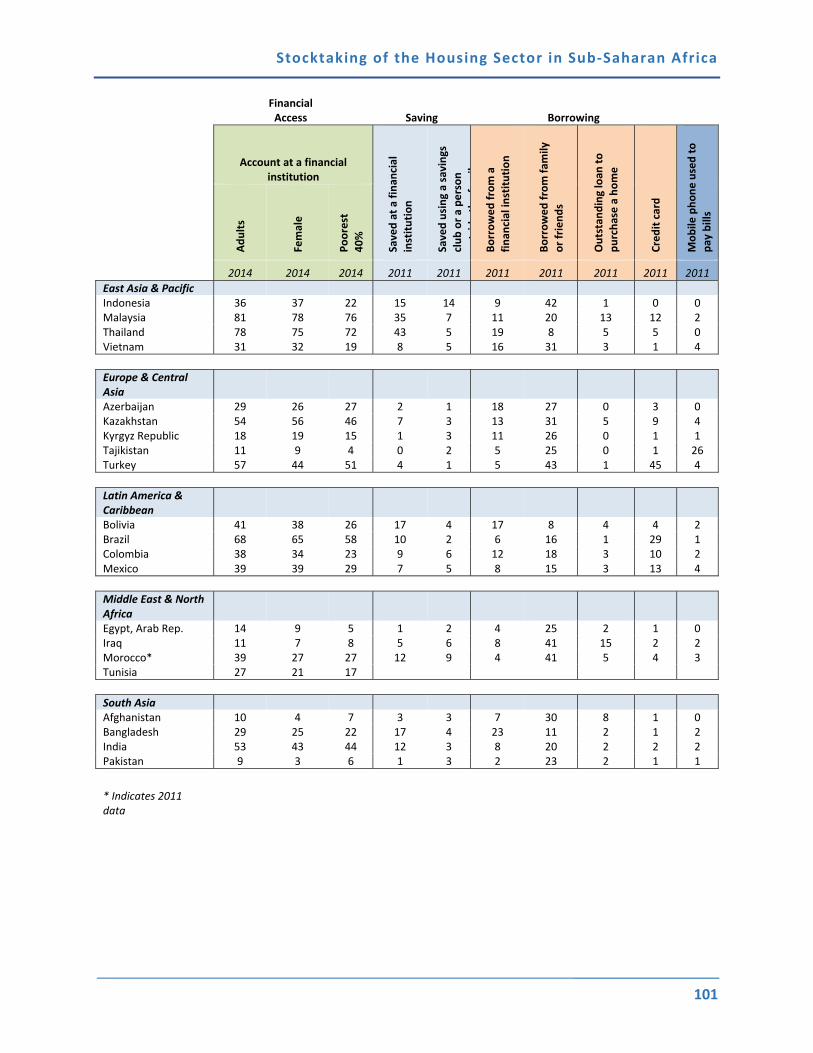
Stocktaking of the Housing Sector in Sub-Saharan Africa
101
Financial Access Saving Borrowing
Account at a financial institution
Saved at a finan
cial
institution
Saved using a savings
club or a person
tid
thf
il
Borrowed from a
finan
cial institution
Borrowed from fam
ily
or friends
Outstanding loan
to
purchase a home
Credit card
Mobile
phone used to
pay bills
Adults
Female
Poorest
40%
2014 2014 2014 2011 2011 2011 2011 2011 2011 2011
East Asia & Pacific Indonesia 36 37 22 15 14 9 42 1 0 0 Malaysia 81 78 76 35 7 11 20 13 12 2 Thailand 78 75 72 43 5 19 8 5 5 0 Vietnam 31 32 19 8 5 16 31 3 1 4
Europe & Central Asia Azerbaijan 29 26 27 2 1 18 27 0 3 0 Kazakhstan 54 56 46 7 3 13 31 5 9 4 Kyrgyz Republic 18 19 15 1 3 11 26 0 1 1 Tajikistan 11 9 4 0 2 5 25 0 1 26 Turkey 57 44 51 4 1 5 43 1 45 4
Latin America & Caribbean Bolivia 41 38 26 17 4 17 8 4 4 2 Brazil 68 65 58 10 2 6 16 1 29 1 Colombia 38 34 23 9 6 12 18 3 10 2 Mexico 39 39 29 7 5 8 15 3 13 4
Middle East & North Africa Egypt, Arab Rep. 14 9 5 1 2 4 25 2 1 0 Iraq 11 7 8 5 6 8 41 15 2 2 Morocco* 39 27 27 12 9 4 41 5 4 3 Tunisia 27 21 17
South Asia Afghanistan 10 4 7 3 3 7 30 8 1 0 Bangladesh 29 25 22 17 4 23 11 2 1 2 India 53 43 44 12 3 8 20 2 2 2 Pakistan 9 3 6 1 3 2 23 2 1 1
* Indicates 2011 data

Stocktaking of the Housing Sector in Sub-Saharan Africa
102
Notes 1 For example: Out of 34 SSA countries, only six (Mauritius, South Africa, Namibia, Swaziland, Lesotho and Mali) have a GNI per capita higher than or on par with the least expensive formal dwelling. 2 An overview of the main challenges along each step of the supply and demand value chains is provided in “Appendix 2. Overview of Challenges along Supply and Demand Value Chains.” 3 UN‐HABITAT, The State of African Cities 2014: Re‐Imagining Sustainable Urban Transitions (United Nations Human Settlements Programme (UN‐Habitat), 2014). 4 Ibid. 5 World Urbanization Prospects: The 2014 Revision, Highlights (United Nations, Department of Economic and Social Affairs, Population Division, 2014), http://esa.un.org/unpd/wup/Highlights/WUP2014‐Highlights.pdf. 6 UN‐Habitat, “Affordable Land and Housing in Africa,” (Kenya: UN‐Habitat, 2011). 7 UN‐Habitat, “Ghana Housing Profile,” (2011). 8 In the capital city of Lusaka, 70 percent of housing is informal and accommodates 90 percent of the city’s population while occupying 20 percent of residential land UN‐Habitat, “Zambia Urban Housing Sector Profile,” (2012). 9 CAHF, 2013 Yearbook ‐ Housing Finance in Africa: A Review of Some of Africa’s Housing Finance Markets. 10 UN‐Habitat, “Zambia Urban Housing Sector Profile,” (2012). 11 CAHF, 2013 Yearbook ‐ Housing Finance in Africa: A Review of Some of Africa’s Housing Finance Markets. 12 UN‐Habitat, “Malawi Urban Housing Sector Profile,” (2011). 13 The scarcity of data is due to a tendency by governments and the private sector to privilege the formal housing delivery system in their analyses and assessments. This is in part because of experience in developed countries but also because traditional tools for assessing the housing markets rely on data sources that assume a formal delivery system. 14 Definitions of key terms also vary according to context. Tenure categories are difficult to compare across countries because they confer different rights and have different levels of legal clarity and enforcement. Also, as previously discussed, definitions of “slums” and “informality” refer to a continuum of inter‐related issues that includes built‐environment characteristics but also financial and regulatory systems and legal frameworks. 15 For example, at the most basic level, there are data on housing expenditures and qualities in some informal neighborhoods, but this cannot be generalized to the whole informal sector in the city, let alone the country or the region. Similarly, research exists on many other topics that also provides ancillary data on informal settlement conditions. For example: on quality of life and on the housing‐health nexus in informal settlements in South Africa (Richards and Mutsonziwa 2007); living conditions and housing costs in ‘slums’ in Nairobi (Gulyani and Talukdar 2008) and their micro‐enterprises (Gulyani and Talukdar 2010); and additional research from previous decades. John Turner’s seminal work (1976) is an illustrative case study, but the data presented are not consistent or comparable enough to be aggregated with any confidence for regional generalization. While such aggregated data may be available in the formal sector through relatively reliable and transparently collected census data or the Demographic and Health Surveys conducted by USAID, there remain limits to their comparability and representativeness. 16 This is a view that has been developed by scholars and practitioners since expressed in Abrams’ (1964) seminal work as well as that of Turner (1976) and others. 17 For a framework of understanding formality and informality as it relates to housing finance, please see Appendix 6. Formality and Informality in Housing Finance. 18 Housing shortage change is estimated by difference between the share of respondents reporting a lack of access to quality housing across two separate survey periods. For Senegal this period is 2001‐2005. 19 The number of rooms occupied by a household is generated in the Demographic and Housing Surveys (DHS) being rolled out across Sub‐Saharan Africa. 20 Kingdom of Lesotho (2009). Kingdom of Lesotho (2009) 2006 Lesotho Population and Housing Census: Analytical Report, Volume IIIB Socio‐economic characteristics. Maseru. 21 UN‐HABITAT, Draft Lesotho Urban Housing Profile (UN‐HABITAT, forthcoming). 22 2013 Housing Finance Yearbook (Centre for Affordable Housing Finance in Africa, 2013). 23 Using dwelling equivalents (cost equivalent in dwellings of renovations), the final annual need calculation falls between 31,740 and 43,700 dwellings per year until 2020 (Malawi Urban Housing Sector Profile (UN Habitat, 2011).
Stocktaking of the Housing Sector in Sub-Saharan Africa
103
24 The data are based on urban population growth estimates and a cut off 3.5 people per household and construction cost of $20,000.Based on available data, this housing cost estimate is likely far lower than actual market conditions in many countries. For example, the mean housing price for all of these countries collected by CAHF in 2014 was $34,122. With this cost assumption, the per‐capita cost for providing a new housing unit is $5,714. 25 UN‐Habitat, “Ghana Housing Profile,” (2011). 26 Ethiopia 2007 Population and Housing Census. 27 Rental Housing: A Much Neglected Housing Option for the Poor, Housing the Poor in African Cities (UN‐Habitat and Cities Alliance, 2011). 28 Section A.3 below considers the issue of affordability assessment. 29 These data are about 10 years old and it is likely that the extent of these deprivations has narrowed given steady GDP growth across the region of 2‐4 percent during this period. 30 Basab Dasgupta et al., “Urbanization and Housing Investment” (World Bank, 2014). 31 Housing price data are collected through a convenience sample of private developer respondents. Housing quality and sizes, along with the cost of land vary between countries. 32 CAHF’s data is limited because it refers to the least expensive dwelling provided by the private sector only and neglects any dwellings provided by government housing programs. It is also unclear how much, if any, subsidies are hidden in these house prices, such as discounted construction materials or the allocation of public land at below market prices. 33 CAHF, 2013 Yearbook ‐ Housing Finance in Africa: A Review of Some of Africa’s Housing Finance Markets (Centre for Affordable Housing Finance in Africa, 2013). 34 Ibid. 35 Karley (2008: 10) adjusted for 2010 values and assuming one‐third of income as housing payments. 36 Ibid. 37 CAHF has developed affordability pyramids to highlight the differing opportunity sets of various income segments for each African country, in subjective illustrations that marshal a wide range of data and knowledge of particular policy measures in each country. The full set can be found in: CAHF, 2013 Yearbook ‐ Housing Finance in Africa: A Review of Some of Africa’s Housing Finance Markets (Centre for Affordable Housing Finance in Africa, 2013). 38 This is less than half the cost of a the least expensive privately built unity, which can range in price from $23,000‐$52,000. 39 Lozano‐Gracia and Young (2014) have found that in most African countries, food expenditures remain above 50% of total expenditures for 60% or more of the population. As income levels rise, the share of food expenditures decreases. The authors suggest that increased expenditure on housing will not occur in developing countries if food expenditures remain high. 40 Malawi Urban Housing Sector Profile. 41 BUCREP, 3è RGPH Volume II ‐ Tome 05: Caractéristiques de l’Habitat et Cadre de Vie Des Populations (Bureau Central des Recensements et des Etudes de Population (BUCREP), 2012). 42 The providers of such housing are often members of the national elite who see the commercial sense of building for rent or who may build for their retirement and rent out to expatriates in the meantime. This is notably common in Lesotho (personal communication, Kabelo Lethunya, Chief Housing Officer, Government of Lesotho, Maseru). 43 Ikejiofor, U., (1997), “The Private Sector and Urban Housing Production Process in Nigeria: A Study of Small‐Scale Landlords in Abuja”, Habitat International, vol. 21, No.4, pp. 409‐425. 44 For example, council‐built and mine workers’ housing in the Copperbelt of Zambia form a significant percentage of the housing stock. 45 Rental housing achieved by the supply intended for ownership is not the result of purposeful policy. Landlords in these cases typically have few tenants and tend to operate through personal relationships, which render them unlikely to be exploitative. 46 Tipple, A. G. (Ed.). (2000). Extending themselves: User‐initiated transformations of government‐built housing in developing countries. Liverpool University Press. 47 Ibid. 48 Tipple, G., Korboe, D., Garrod, G., & Willis, K. (1999). Housing supply in Ghana: a study of Accra, Kumasi and Berekum. Progress in Planning, 51(4), 255‐324. 49 UN‐HABITAT, Affordable Land and Housing in Africa (United Nations Human Settlements Programme (UN‐HABITAT), 2014).

Stocktaking of the Housing Sector in Sub-Saharan Africa
104
50 Amole, B., Korboe, D. and Tipple, G., (1993), “The family house in West Africa”, Third World Planning Review, vol. 15, pp. 355‐372. 51 Gough, K. V., & Yankson, P. (2011). A neglected aspect of the housing market the caretakers of Peri‐urban Accra, Ghana. Urban Studies, 48(4), 793‐810. 52 UN‐Habitat (2003). Rental housing: An essential option for the urban poor in developing countries. Nairobi: UN HABITAT. 53 Tipple, A.G. and Willis, K.G., (1991), “Tenure choice in a West African city”, Third World Planning Review, vol. 13, pp. 27‐46. 54 Rental Housing: A Much Neglected Housing Option for the Poor. 55 UN‐Habitat, “Zambia Urban Housing Sector Profile,” (2012). 56 CAHF, 2013 Yearbook ‐ Housing Finance in Africa: A Review of Some of Africa’s Housing Finance Markets. 57 Ibid. 58 For example, more than one third of all total private wealth among households in Britain is in the form of housing (Collier and Venables 2013). 59 Examples include public housing in the United States and the HLM in France. 60 For future research, a systematic categorization of each SSA country and the extent to which governments and other benefactors (notably, DFIs) use each of the 16 housing affordability tools would be an invaluable resource for further understanding the housing sector in SSA. 61 CAHF, 2013 Yearbook ‐ Housing Finance in Africa: A Review of Some of Africa’s Housing Finance Markets. 62 Thouraya Triki and Issa Faye. “Financial Inclusion in Africa” (Tunisia: African Development Bank, 2013). 63 “Doing Business: Measuring Business Regulations” (World Bank, 2013), http://www.doingbusiness.org/. 64 Top sectors include: energy, transportation, mining, real estate, water, oil and gas. 65 “Deloitte on Africa: African Construction Trends Report 2013” (Deloitte, 2013), http://www.deloitte.com/ assets/Dcom‐Kenya/Local%20Assets/Documents/Deloitte%20Africa%20ConstructionTrends.pdf. 66 UN‐Habitat, “Affordable Land and Housing in Africa,” (Kenya: UN‐Habitat, 2011). 67 Enabling Shelter Strategies—World Bank. 68 Côte d’Ivoire’s public housing authorities underwent a similar evolution from public agency to state‐owned enterprise over the same period. Housing production and affordability outcomes mirrored the experience of Tanzania (World Bank CIV Urbanization Review; Rakodi 1997). 69 In Ghana, subsidies are used to encourage poor renters to become owners of single family houses, rather than owners of their apartments. 70 For example, tax exemptions and import benefits are directed to a group of estate developers (GREDA) who build exclusively for the middle‐ and high‐income groups. In many other countries, policies that purport to target the lower‐income brackets actually focus on the middle‐income brackets, often due to inadequate market assessments and targeting criteria (UN Habitat 2011; Ghana Housing Profile). 71 For example, Ethiopia’s IHDP program, while reducing costs through economies of scale and out‐sourcing of components, still produces a relatively expensive housing product. In spite of the subsidy, the high cost of the units is still too great for many households. 72 Land administration refers to the rights afforded by different tenure categories, the development rights afforded to land, the procedures required to obtain and transfer land, as well as any system of fees or taxes enacted to capture value from land. 73 UN‐HABITAT 2010 74 Camilla Toulmin, “Securing land and property rights in Sub‐Saharan Africa: The role of local institutions,” (Switzerland: World Economic Forum, 2005). 75 “UN‐Habitat 2010.” 76 This arrangement can still allow for an effective land market to exist if there are long‐term secure leases on the land. 77 “UN‐Habitat 2010.” 78 Ibid. 79 Kasanga, R.K., J. Chochranc, R. King and M. Roth. 1996. Land markets and legal contradictions in the peri‐urban area of Accra, Ghana: Informant interviews and secondary data investigations. Land Tenure Centre Paper 127. Madison, WI: Land Tenure Centre, University of Wisconsin‐Madison; Kumasi: Land Administration Research Centre, University of Science and Technology.

Stocktaking of the Housing Sector in Sub-Saharan Africa
105
80 Malawi Urban Housing Sector Profile. 81 Anecdotally, there is evidence that a program to fit VIP toilets in housing in Kumasi in the 1980s was less successful than hoped because house‐owners were reluctant to borrow even a small amount against their house. 82 World Bank, Developing Kenya’s Mortgage Market (World Bank, 2011). 83 Interview with Addis Credit and Savings Institution, 2014. 84 CAHF, 2013 Yearbook ‐ Housing Finance in Africa: A Review of Some of Africa’s Housing Finance Markets. 85 Ibid. 86 World Bank, Developing Kenya’s Mortgage Market. 87 CAHF, 2013 Yearbook ‐ Housing Finance in Africa: A Review of Some of Africa’s Housing Finance Markets. 88 Ibid. 89 Dr. Gilbert Baluba, Chief of Planning in the Department of \Housing, Lands and Urban Planning of the Douala Commune, cited in Sandra Belaunde et al., "Land, Legitimacy and Governance in Cameroon," (Paris: Institute for Research and Debate on Governance, 2010). 90 Frank Byamugisha, Securing Africa’s Land for Shared Prosperity (The World Bank, 2013), http://www‐wds.worldbank.org/external/default/WDSContentServer/WDSP/IB/2013/05/31/000445729_20130531122716/Rendered/PDF/780850PUB0EPI00LIC00pubdate05024013.pdf. 91 ibid. 92 UN‐Habitat, “Liberia Housing Profile,” (Forthcoming). 93 Ibid. 94 “Doing Business 2014: Understanding Regulations for Small and Medium‐Size Enterprises” (World Bank, October 29, 2013), http://www.doingbusiness.org/reports/global‐reports/doing‐business‐2014. 95 Camilla Toulmin, “Securing land and property rights in Sub‐Saharan Africa: the role of local institutions,” (Switzerland: World Economic Forum, 2005). 96 CAHF, 2013 Yearbook ‐ Housing Finance in Africa: A Review of Some of Africa’s Housing Finance Markets. 97 Ibid. 98 Camilla Toulmin, “Securing Land and Property Rights in Sub‐Saharan Afrca: The Role of Local Institutions” (Switzerland, 2005). 99 UN‐Habitat, “Affordable Land and Housing in Africa,” (Kenya: UN‐Habitat, 2011). 100 John Norton, Building With Earth: A Handbook (London: Intermediate Technology Publications, Ltd., 1997). 101 Assumptions are that the buyer and seller are LLCs in a peri‐urban area, and the property is fully owned by the seller, is free of title disputes or attached mortgages, and consists of 6,000 sq ft of land and 10,000 sq ft building. It is assumed that there are no special natural or historical protections, that the property is not intended for residential use, and there are no occupants. These assumptions are for commercial, rather than residential purposes, but the findings still reveal much about the general state of property registration systems in these countries. In fact, the magnitude of the issue for residential systems may be understated, as residential processes may take longer and cost more as a percent of property value, especially if there is any informality involved. 102 “Doing Business 2016: Measuring Regulatory Quality and Efficiency.” 103 Assumptions are that the construction company is a fully licensed domestic LLC and owns the land on which the warehouse is built. The warehouse itself will be used for general storage activities, two stories, located in a peri‐urban area, built on land free of title disputes, has complete architectural/technical plans, is connected to water/sewer/telephone and will take 30 weeks to construct. These assumptions are for commercial, rather than residential purposes, but the findings still reveal much about the general state of property registration systems in these countries. In fact, the magnitude of the issue for residential systems may be understated, as residential processes may take longer and cost more as a percent of property value, especially if there is any informality involved. 104 Robert M. Buckley and Jerry Kalarickal, “Shelter Strategies for the Urban Poor: Idiosyncratic and Successful, but Hardly Mysterious,” (World Bank, 2004). 105 Paul Collier and Anthony J. Venables, “Housing and Urbanization in Africa: Unleashing a Formal Market Process,” (Oxford: Centre for the Study of African Economies, 2013). 106 Such as the US’s Homestead Act of 1862, which enabled squatters to gain formal title to land through an adverse possession approach; if they lived on it continuously for five years, improved the land with a structure.

Stocktaking of the Housing Sector in Sub-Saharan Africa
106
107 The first roads are simply paths or lines of convenience that are geodesic across the urban terrain. Unmaintained roads arise naturally because they are efficient for everyone. Maintaining a road—grading, drainage, paving, and so on—is what distinguishes the purely private path from transportation infrastructure. 108 Nancy Lozano‐Gracia and Cheryl Young, “Housing Consumption and Urbanization,” (Forthcoming). 109 Vivien Foster, “Overhauling the Engine of Growth: Infrastructure in Africa” (World Bank, September 2008), http://siteresources.worldbank.org/EXTPRAL/Resources/africa_country_diagnostic.pdf. 110 Progress on drinking water and sanitation, 2012 update (UNICEF/WHO). 111 Paul Baross et al., “Land supply for low‐income housing: issues and approaches,” Regional Development Dialogue, 8 (1987): 29‐45. 112 Nancy Lozano‐Gracia and Cheryl Young, “Housing Consumption and Urbanization,” (Forthcoming). 113 “The Africa Infrastructure Knowledge Program” (African Development Bank Group, 2011), http://www.infrastructureafrica.org/. 114 Nancy Lozano‐Gracia and Cheryl Young, Housing Consumption and Urbanization (Draft Report, The World Bank, 2014). 115 CAHF, 2013 Yearbook ‐ Housing Finance in Africa: A Review of Some of Africa’s Housing Finance Markets. 116 Ibid. 117 Foster, “Overhauling the Engine of Growth: Infrastructure in Africa.” 118 “The Africa Infrastructure Knowledge Program.” 119 Ibid. 120 Michael Kihato, “Infrastructure and Housing Finance: Exploring the Issues in Africa,” (Centre for Affordable Housing Finance in Africa, 2012). 121 “The Africa Infrastructure Knowledge Program.” 122 UN‐Habitat, “Affordable Land and Housing in Africa,” (Kenya: UN‐Habitat, 2011). 123 Ibid. 124 Paul Collier and Anthony J. Venables, “Housing and Urbanization in Africa: Unleashing a Formal Market Process” (Oxford: Centre for the Study of African Economies, 2013). 125 CAHF, "2013 Yearbook ‐ Housing Finance in Africa: A Review of Some of Africa's Housing Finance Markets," (Parkview: Centre for Affordable Housing Finance in Africa, 2013). 126 Ecobank. “Middle Africa’s cement sector: explosive growth,” (2014). http://www.ecobank.com/upload/ 20140724011129637822cPHHGNvnw6.pdf 127 CAHF, 2013 Yearbook ‐ Housing Finance in Africa: A Review of Some of Africa’s Housing Finance Markets. 128 CAHF, 2013 Yearbook ‐ Housing Finance in Africa: A Review of Some of Africa’s Housing Finance Markets. 129 Ibid. 130 Combination of soil, clay, sand, manure, and straw. 131 CAHF, 2013 Yearbook ‐ Housing Finance in Africa: A Review of Some of Africa’s Housing Finance Markets. 132 Ibid. 133 Ibid. 134 Ibid. 135 UN‐Habitat, “Zambia Urban Housing Sector Profile,” (2012). 136 Graham Tipple, “Regional Assessment of the GSS, 2000: Sub‐Saharan Africa,” (2012). 137 UNCHS (Habitat)/ILO, “Shelter provision and employment generation” (Nairobi and Geneva: UNCHS (Habitat) and International Labour Office, 1995). 138 Dasgupta et al. 2014 139 In the MENA region, the most commonly cited reason for not having an account is religious, as many financial institutions don’t have the appropriate structures to accommodate Islamic financial tenets. 140 Asli Demirguc‐Kunt and Leora Klapper, “Measuring Financial Inclusion: The Global Findex Database” (World Bank, April 2012), http://www‐wds.worldbank.org/external/default/WDSContentServer/IW3P/IB/2012/04/19/ 000158349_20120419083611/Rendered/PDF/WPS6025.pdf. 141 Ibid. 142 For example, loan sizes and tenors fall are greater than traditional microfinance, but less than a standard mortgage. It is currently more common for general microfinance loans and institutions to service housing needs as they arise, rather than developing dedicated housing microfinance products. Nonetheless, there is evidence of demand for small loans for housing investment.

Stocktaking of the Housing Sector in Sub-Saharan Africa
107
143 For reference, in the US, it is 31.2%.(“Global Findex Database: Financial Inclusion Data” (World Bank, 2012), http://datatopics.worldbank.org/financialinclusion/home/.) 144 UN‐Habitat, “Affordable Land and Housing in Africa,” (Kenya: UN‐Habitat, 2011). 145 Michael Kihato, “State of Housing Microfinance in Africa” (Centre for Affordable Housing Finance in Africa, 2013). 146 Marja C. Hoek‐Smit, “Scaling Up Housing Finance in Africa,” Workshop on Research on Urban Mass Housing in Africa, St. Catherine’s College, Oxford. (University of Pennsylvania, 2012). 147 CAHF, 2013 Yearbook ‐ Housing Finance in Africa: A Review of Some of Africa’s Housing Finance Markets. 148 Ibid. 149 Ibid. 150 James Mutero et al., “Mobilizing Pension Assets for Housing Finance Needs in Africa ‐ Experiences and Prospects in East Africa” (Centre for Affordable Housing Finance in Africa, December 2010), http://www.hofinet.org/upload_docs/CAHF_Mobilizing%20Pension%20Assets.pdf. 151 Bank, Developing Kenya’s Mortgage Market. 152 Ibid. 153 “NMRC: Frequently Asked Questions,” Nigeria Mortgage Refinance Company, 2014, http://www.nmrc.com.ng/?page_id=26. 154 Ibid. 155 Paul Collier and Anthony J. Venables, “Housing and Urbanization in Africa: Unleashing a Formal Market Process” (Oxford: Centre for the Study of African Economies, 2013). 156 CAHF, 2013 Yearbook ‐ Housing Finance in Africa: A Review of Some of Africa’s Housing Finance Markets. 157The built‐in rate/ discount incentives such as this are a common feature of better‐run pro‐poor housing finance and microfinance institutions. The industry as a whole would benefit from an open‐source innovations lab/ innovations library where these case studies are presented and analyzed. 158 CAHF, 2013 Yearbook. 159 Mutero et al., 2010 “Mobilizing Pension Assets for Housing Finance Needs in Africa ‐ Experiences and Prospects in East Africa.” Center for Affordable Housing Finance in Africa http://www.hofinet.org/upload_docs/ CAHF_Mobilizing%20Pension%20Assets.pdf 160 This program had good intentions but its subsequent implementation has left much to be desired. It is not recommended as a model for replication without significant and obvious programmatic changes, some of which are referenced in the Nigeria country case study. 161 CAHF, 2013 Yearbook ‐ Housing Finance in Africa: A Review of Some of Africa’s Housing Finance Markets. (Parkview: Centre for Affordable Housing Finance in Africa, 2013) 162 Ibid. 163 Tipple et al., “Housing Supply in Ghana: A Study of Accra, Kumasi and Berekum.” 164 K. Konadu‐Agyemang, “Structural Adjustment Programs and Housing Affordability in Accra, Ghana,” The Canadian Geographer 45, no. 4 (2001): 528–45. 165 Kristin Helmore, “State of the Sector Report: Bringing Financial Services to Africa’s Poor” (Canada: CARE, 2009). 166 ibid. 167 Ibid. 168 “MIX Market Microfinance Institutions Database,” MIX Market, n.d., http://mixmarket.org/mfi. 169 These figures are aggregations of self‐reported data from individual MFI institutions, so they are likely not comprehensive. Active borrowers are defined as either individuals or entities (such as savings groups) that hold an outstanding loan balance with the MFI, while Gross Loan Portfolio is defined as outstanding principal for all outstanding client loans. 170 Cameroon is not among the 17 of the 48 countries in SSA that have interest rate caps for MFIs. Mix and CGAP, "MIX Microfinance World: Sub‐SaharanAfrica MicrofinanceAnalysis and Benchmarking Report 2010," A report from Microfinance Information Exchange (MIX) and Consultative Group to Assist the Poor (CGAP) (Washington, DC: Microfinance Information Exchange, Inc, 2011). 171 Lea Pulcherie Maffengang, "Tontines: The Informal Financial Sector in Cameroon," Fair Observer(2013), http://www.fairobserver.com/region/africa/tontines‐informal‐financial‐sector‐and‐sustainable‐development‐cameroon. 172 CAHF, "2013 Yearbook ‐ Housing Finance in Africa: A Review of Some of Africa's Housing Finance Markets," (Parkview: Centre for Affordable Housing Finance in Africa, 2013).

Stocktaking of the Housing Sector in Sub-Saharan Africa
108
173 Demirguc‐Kunt and Klapper, “Measuring Financial Inclusion: The Global Findex Database.” 174 For any loan product, R = P x L. Risk (R) is the Probability of default (P) times the Loss (L) given default. As referenced in the preceding discussion of mortgage finance, a mortgage loan is a collateralized interest—and its value chain and business model are designed to reduce L, the loss after default, by allowing for seizure and repossession of the collateral and then its successful resale. Microfinance approaches the problem differently. L, loss given default, is closer to 100%, so P must be reduced down to the smallest number possible, which means limiting the loan to a small amount, for a very short time, to a low risk customer. These two risk‐management models are at odds: one emphasizes reducing risk (P), the other at reducing loss (L), and they use different credit decision models. Housing microfinance sits between the two, but neither the mortgage finance risk model nor the microfinance risk model applies without adaptation. 175 Michael Kihato, “State of Housing Microfinance in Africa” (Centre for Affordable Housing Finance in Africa, 2013). 176 MIX Market 2013. “Africa Market Profile” http://www.mixmarket.org/mfi/region/Africa “ 177 S. Mills, "The Kuyasa Fund: Housing Microcredit in South Africa," Environment and urbanization 19, no. 2 (2007). 178 UN‐HABITAT, "Zambia Urban Housing Sector Profile." 179 "Malawi Urban Housing Sector Profile." 180In 2012, Makao Mashinani received a loan from Shelter Afrique of KSHS 40 million (US$450,959) to support low cost and social housing initiatives in Kenya, see “Shelter Afrique and Makao Mashinani LTD (Kenya) Sign Agreement for a Social Housing Loan of KSHS 40,000,000,” Shelter Afrique, July 12, 2012, http://www.shelterafrique.org/index.php/shelter‐afrique‐and‐makao‐mashinani‐limited‐kenya‐sign‐agreement‐for‐a‐social‐housing‐loan‐of‐kshs‐40000000/. 181 William Kalema and Duncan Kayiira, Overview of the Housing Finance Sector in Uganda, Access to Housing Finance in Africa: Exploring the Issues (FinMark Trust, June 2008). 182 Detailed information on the breakdown for other countries, as well as rich data on other housing finance indicators, is provided in FinMark Trust’s “Access to Housing Finance in Africa: Exploring the Issues” series. 183 James Mutero, Overview of the Housing Finance Sector in Tanzania, Access to Housing Finance in Africa: Exploring the Issues (FinMark Trust, n.d.). 184 This was done by filtering (i) those not served by formal lenders, (ii) those who may want a loan, and (iii) those who can afford a loan. The range for “willingness to borrow” and affordability are determined from literature. Please see Kihato 2009 for further information on methodology. 185 Differentiated analysis in which (i) specific loan averages used where available in the literature and (ii) where they are not available, proxy amounts used by drawing on loan averages for countries in (i) with the closest Human Development Index. Average loan sizes were found in the literature for the following countries: Morocco (US$1,150), South Africa (US$430), Kenya (US$533), Uganda (US$942), Ethiopia (US$228), Benin (US$666), Rwanda (US$350). 186 CAHF, 2013 Yearbook ‐ Housing Finance in Africa: A Review of Some of Africa’s Housing Finance Markets. 187 Ibid. 188 UN‐Habitat, “Ghana Housing Profile,” (2011). 189 UN‐Habitat, “Malawi Urban Housing Sector Profile,” (2011). 190 The global experience with microfinance shows that it has been successful extending credit to those who previously did not have it. However, there remains uncertainty over how much this reduces poverty or what other impacts it has on poor households (c.f. Banerjee et al. 2009; Chliova et al. 2014) 191 The Affordable Housing Institute has published concept papers around Home Asset Loan Finance (HALF), an exposition of housing microfinance reflecting its unique nature halfway between microfinance and mortgage finance. HALF is consistent with the successful case examples observed globally, but more research is needed to illuminate the more general conditions for success. 192 Dilip Ratha et al, Leveraging Migration for Africa: Remittances, Skills and Investments, (Washington D.C.: World Bank, 2011). 2012 data obtained directly from author. 193 “Migration and Remittance Flows: Recent Trends and Outlook, 2013‐2016” (The World Bank, October 2, 2013), http://siteresources.worldbank.org/INTPROSPECTS/Resources/334934‐1288990760745/MigrationandDevelopmentBrief21.pdf. 194 World Bank 2014 “Global Findex Database: Financial Inclusion Data.” 195 World Bank 2013“Migration and Remittance Flows: Recent Trends and Outlook, 2013‐2016.” 196 Ibid.

Stocktaking of the Housing Sector in Sub-Saharan Africa
109
197 Christian Ebeke, Boileau Loko, and Arina Viseth, “Credit Quality in Developing Economies: Remittances to the Rescue?” (International Monetary Fund, August 2014), http://www.hofinet.org/upload_docs/ Credit%20Quality%20in%20Developing%20Economies.pdf. 198 For an in‐depth discussion of each recommendation, please refer to Appendix 5. Detailed Recommendations Implied by Value Chain Analysis. 199 Such rights, if available, also raise building‐code and property‐standards issues, but those are unrelated to the land‐rights issue. The Lesotho Development Control Code specifically allows the local equivalent of backyard shacks up to the same area as the main dwelling. 200 Even Abuja has acknowledged the place of original inhabitants, by not demolishing their ‘illegal’ settlements. 201 Similar experience with decentralization/devolution in Cameroon (see for example Mbuagbo, Oben Timothy. "Cameroon: Flawed Decentralization & the Politics of Identity in the Urban Space." Global Journal of Human Social Science Sociology, Economics & Political Science 12, no. 11 (2012): 15‐25.) 202 Emirs’ representatives are often district heads paid for by local government, a curious example of practical intra‐legitimacy network connections. 203As coined by Ashoka. See Harvard Business Review, A New Alliance for Global Change, http://hbr.org/2010/ 09/a‐new‐alliance‐for‐global‐change/ar/1 204 In Cameroon, the establishment of the Local Materials Promotion Authority (MIPROMALO) in 1990, at the height of the economic crisis, to promote the use of locally manufactured materials in order to reduce the cost of housing, was an important addition to the institutional framework. 205 India’s July, 2012 blackout, which left 300+ million people without power for up to two days, was triggered in part because in that country roughly 15‐30% of all electricity is stolen via similar informal/ illegal wiring. See http://www.csmonitor.com/Commentary/the‐monitors‐view/2012/0802/India‐blackout‐flips‐a‐switch. 206 This model is prevalent in the emerging world now (for a current example, see Tarlabasi in Istanbul) and was a common pattern in Paris, London, and various US cities, particularly during the 1950s and 1960s. 207 Cemex’s Patrimonio Hoy program called them promotoras; SEWA’s lending programs call them saathibens. 208 A Heavy Load: The Combined Housing and Transportation Burdens of Working Families, National Housing Partnership’s Center for Housing Policy, October, 2006, available at http://www.nhc.org/media/documents/ pub_heavy_load_10_06.pdf 209 Many, especially women, are home‐based workers, so their commuting costs are minimal. 210 Among recent rural‐to‐urban immigrants, the phenomenon of a geographically separated family is common, with the principal breadwinner working ‘in the city’ and sending money ‘back home’ to the village and the family, where the money is invested incrementally in building the family house. 211 Statistics taken from UN Habitat Housing Sector Profiles. 212 See Graham Tipple and Suzanne Speak, 2009, The Hidden Millions: Homelessness in Developing Countries, London: Routledge. 213 Demirguc‐Kunt and Klapper, “Measuring Financial Inclusion: The Global Findex Database.”


