1 Stonehenge State School 2017 ANNUAL REPORT Queensland State School Reporting Inspiring minds. Creating opportunities. Shaping Queensland’s future. Every student succeeding. State Schools Strategy 2017-2021 Department of Education
Transcript
1
Stonehenge State School
2017 ANNUAL REPORT
Queensland State School Reporting
Inspiring minds. Creating opportunities. Shaping Queensland’s future. Every student succeeding. State Schools Strategy 2017-2021
Webpages: Additional reporting information pertaining to Queensland state schools is located on the My School website and the Queensland Government data website.
Stonehenge is situated in Central Queensland 161km South-West of Longreach in the Barcoo
Shire, one of Queensland's largest shires. Though drought impacts on the town's population,
Stonehenge maintains a population of approximately 30 people. Macropod harvesting is a common
occupation for town-based residents while the surrounding pastoural properties graze sheep and
cattle. The Barcoo Shire Council is also a source of employment for residents of Stonehenge.
Stonehenge (Provisional) School was officially opened on the 3rd September, 1900 with an
enrolment of twenty four (24) students. The school closed during World War 1 (1943-1945) and
again for the period 1977-1980 due to lack of students. During the war, although the school was
officially closed, Edie McGrath taught the children by correspondence at the school to keep their
education continuing. The first (1st) principal was Mr William James Doherty.
The original school building was replaced in 1976 when the number of student’s enrolled outgrew
the school. In recent years the original school together with the former police station have been
relocated to the grounds of Stonehenge Community Centre. Both historic buildings are available
for public viewing.
Currently, the school provides education to four students with a strong focus on the core values Be
Respectful, Be Responsible and Be Safe. Teachers and Teacher Aides implement
various technologies meaningfully to assist the teaching and learning process and ensure that
distance is not a barrier to 21st century learning.
Stonehenge State School operates within a cluster called the Outback Advantage who, through
commitment to the Education Queensland mantra, Every Student Succeeding, work collaboratively
to innovate curriculum delivery within multi-age classes. Schools in the Outback Advantage cluster
include:
Stonehenge State School
Jundah State School
Windorah State School
Birdsville State School
Bedourie State School
Muttuburra State School
Jericho State School
Ilfracombe State School
Isisford State School Principals and teachers at each of these schools partake in frequent teleconferences, instructional rounds, curriculum planning meetings and principal business meetings to share and improve
practice.
4
Principal’s Foreword
Introduction
At Stonehenge State School we are committed to providing an intellectually rigorous curriculum and relevant learning experiences to cater for all students from Kindergarten to Year 6. Staff, parents and the wider community all play an integral role in prompting a safe, friendly and respectful environment that promotes active learners. This is achieved not only in academic results but in preparation of students for their future. This School Annual Report is a snapshot of Stonehenge State School in the 2017 calendar year and is used to set goals for future years.
The School Annual Report is issued to parents and is available on the school website. A hard copy can be requested through the school office.
School Progress towards its goals in 2017
2017 Improvement Priorities Progress
Numeracy
Students will make relative gains equal to or above the nation on NAPLAN Numeracy Tasks and show improvement between the pre- and post- diagnostic assessment results on the North Coast Maths Program
Ongoing
Writing
All students will be at or above the NMS and 50% will achieve M2Bs or above in NAPLAN writing tasks. Students will made relative gains equal to or above the nation on NAPLAN writing tasks and will achieve a C or higher in Semester 1 and 2 for English.
Ongoing
Reading
All students will be at NMS or above and 50% of students will be in the M2Bs or above in NAPLAN reading tasks. Students will make relative gains equal to or above the nation on NAPLAN reading tasks.
Ongoing
Attendance
Attendance will increase to 95% or above.
Ongoing
Professional Development
All staff to develop and monitor a Developing Performance Plan
Achieved
Future Outlook
2018 Improvement Priorities
Hass Implementation (v8)
100% of students will be accessing version 8 of the HASS curriculum and achieving a C grade or better
Stem
100% of OA cluster schools will participate in the STEM pilot and will develop knowledge and skills in staff. STEM will be implemented over S1, 2018.
Reveal the Reasoning in Mathematics
100% of students will achieve a C or better in Mathematics and will be able to ‘reveal the reasoning’. 100% of staff will be proficient in teaching mathematics.
Curriculum Planning Meetings
Create a data literate teaching team that understands the pedagogical framework for Mathematics.
Develop a specific statement of roles and responsibilities for all School Staff
Achieve a working document that identifies roles and responsibilities for all staff members.
5
Our School at a Glance
School Profile
Coeducational or single sex: Coeducational
Independent Public School: No
Year levels offered in 2017: Early Childhood - Year 6
Student enrolments for this school:
Total Girls Boys Indigenous
Enrolment Continuity
(Feb – Nov)
2015 5 5 2 100%
2016 4 4 2 100%
2017 7 2 5 2 100%
Student counts are based on the Census (August) enrolment collection.
In 2017, there were no students enrolled in a pre-Prep** program.
** pre-Prep is a kindergarten program for Aboriginal and Torres Strait Islander children, living across 35 Aboriginal and Torres Strait Islander
communities, in the year before school (https://qed.qld.gov.au/earlychildhood/families/pre-prep-indigenous).
Characteristics of the Student Body
Overview Stonehenge State School comprises of four (4) male and two (2) female students from Kindergarten – Year 6 who live on pastoral properties and in houses both within and surrounding the Stonehenge Township. The school provides education for two (2) students who identify as Aboriginal or Torres Strait Islander. Traditionally there is a 100% enrolment continuity rate for students at Stonehenge State School. Though Kindergarten is offered, there are currently no students enrolled in this phase of learning.
Average Class Sizes The following table shows the average class size information for each phase of schooling.
Our Approach to Curriculum Delivery - Delivery of English, Mathematics and Science above DoE recommended time scales. - Literacy, Numeracy and Writing support lessons delivered weekly. - Languages other than English (LOTE) offered online via eLearn. - Developing HASS implementation - Integrated Arts curriculum - Onsite HPE curriculum delivery.
How Information and Communication Technologies are used to Assist Learning Students at Stonehenge State School are offered 1:1 access to computers and iPads to assist with delivery of curriculum and to support the development of Literacy and Numeracy capabilities. Access to the internet is provided on a wired and wireless basis and is regularly utilised to plan, research and publish student work and to access subject specific online learning objects. Students access the internet to engage in online eLearning environments for Languages other than English (LOTE). In addition to computers and iPads, Stonehenge State Schools incorporates the use of a tablet, interactive learning panels, data projectors, drones, digital cameras, photocopiers, scanners and printers to develop 21st century learners.
Social Climate
Overview Stonehenge State School offers a safe and friendly educational setting for all students from Kindergarten to Year 6 and prides itself on the standard of behaviour exhibited by our students. It is an expectation that staff and students model the school wide core values of Be Responsible, Be Respectful and Be Safe both in and outside of the classroom and while participating in co- and extra-curricular activities. Student leaders reinforce and mentor students on the school values. These principles are designed to maintain the high standards of behaviour and assist with the development of holistic, well-mannered students and citizens of the community. Stonehenge State School commits itself to acknowledging positive behaviour and rewarding it accordingly. This is achieved in line with the Stonehenge State School Responsible Plan for Students. Stonehenge State School has a Student Wellbeing Framework from which all staff operate. This is available on the school website.
Parent, Student and Staff Satisfaction Parent opinion survey
Performance measure
Percentage of parents/caregivers who agree# that: 2015 2016 2017
their child is getting a good education at school (S2016)
100% DW 100%
this is a good school (S2035) 100% DW 100%
their child likes being at this school* (S2001) 100% DW 100%
their child feels safe at this school* (S2002) 100% DW 100%
their child's learning needs are being met at this school* (S2003)
100% DW 100%
their child is making good progress at this school* (S2004)
100% DW 100%
teachers at this school expect their child to do his or her best* (S2005)
100% DW 100%
teachers at this school provide their child with useful feedback about his or her school work* (S2006)
100% DW 100%
7
Performance measure
Percentage of parents/caregivers who agree# that: 2015 2016 2017
teachers at this school motivate their child to learn* (S2007)
100% DW 100%
teachers at this school treat students fairly* (S2008) 100% DW 100%
they can talk to their child's teachers about their concerns* (S2009)
100% DW 100%
this school works with them to support their child's learning* (S2010)
100% DW 100%
this school takes parents' opinions seriously* (S2011) 100% DW 100%
student behaviour is well managed at this school* (S2012)
100% DW 100%
this school looks for ways to improve* (S2013) 100% DW 100%
this school is well maintained* (S2014) 100% DW 100%
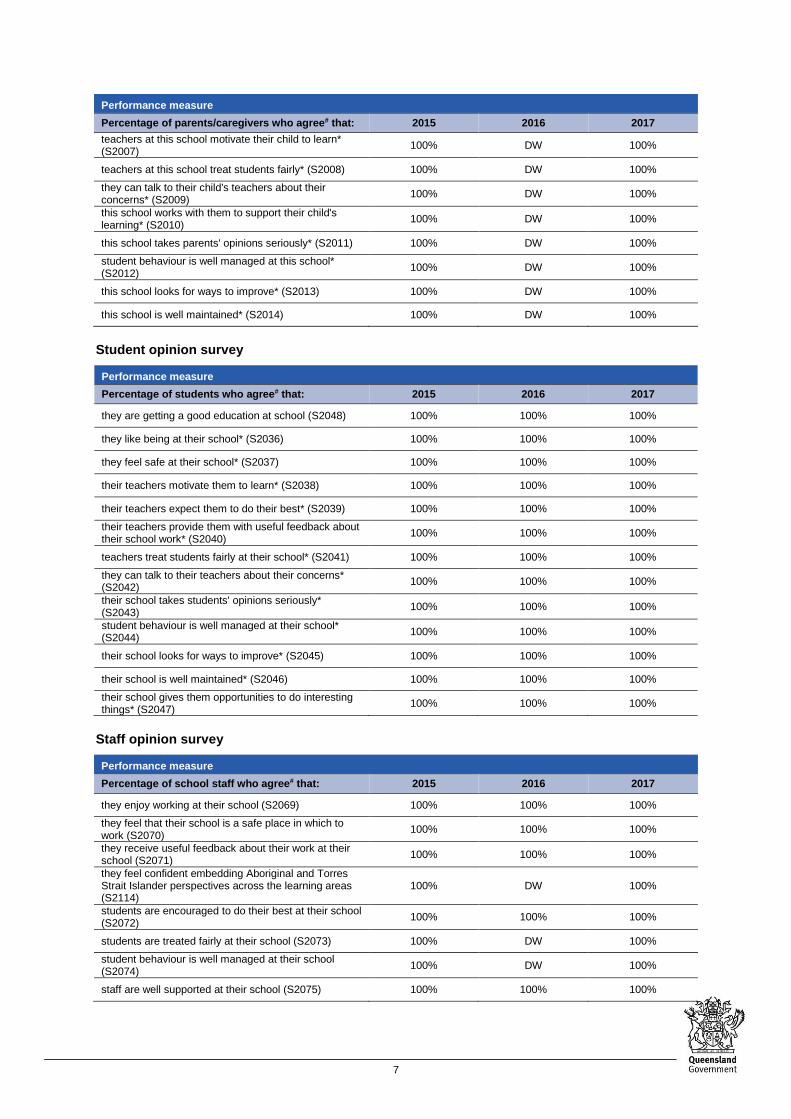
Student opinion survey
Performance measure
Percentage of students who agree# that: 2015 2016 2017
they are getting a good education at school (S2048) 100% 100% 100%
they like being at their school* (S2036) 100% 100% 100%
they feel safe at their school* (S2037) 100% 100% 100%
their teachers motivate them to learn* (S2038) 100% 100% 100%
their teachers expect them to do their best* (S2039) 100% 100% 100%
their teachers provide them with useful feedback about their school work* (S2040)
100% 100% 100%
teachers treat students fairly at their school* (S2041) 100% 100% 100%
they can talk to their teachers about their concerns* (S2042)
100% 100% 100%
their school takes students' opinions seriously* (S2043)
100% 100% 100%
student behaviour is well managed at their school* (S2044)
100% 100% 100%
their school looks for ways to improve* (S2045) 100% 100% 100%
their school is well maintained* (S2046) 100% 100% 100%
their school gives them opportunities to do interesting things* (S2047)
100% 100% 100%
Staff opinion survey
Performance measure
Percentage of school staff who agree# that: 2015 2016 2017
they enjoy working at their school (S2069) 100% 100% 100%
they feel that their school is a safe place in which to work (S2070)
100% 100% 100%
they receive useful feedback about their work at their school (S2071)
100% 100% 100%
they feel confident embedding Aboriginal and Torres Strait Islander perspectives across the learning areas (S2114)
100% DW 100%
students are encouraged to do their best at their school (S2072)
100% 100% 100%
students are treated fairly at their school (S2073) 100% DW 100%
student behaviour is well managed at their school (S2074)
100% DW 100%
staff are well supported at their school (S2075) 100% 100% 100%
8
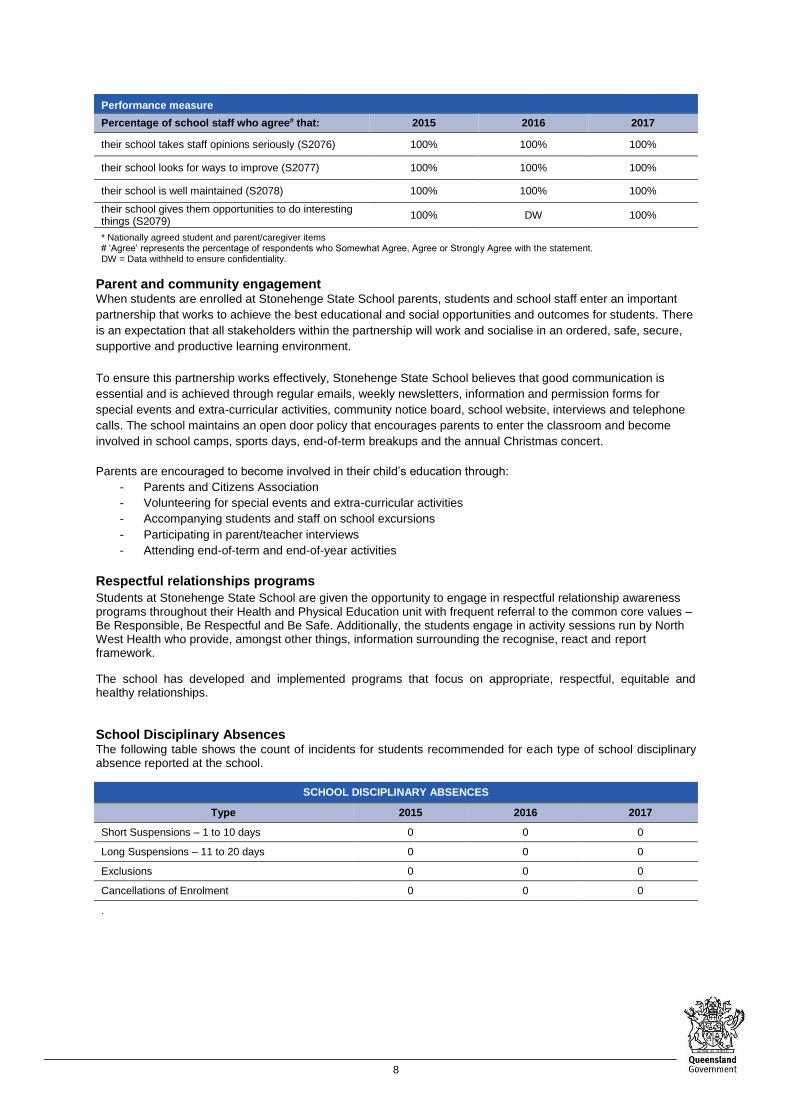
Performance measure
Percentage of school staff who agree# that: 2015 2016 2017
their school takes staff opinions seriously (S2076) 100% 100% 100%
their school looks for ways to improve (S2077) 100% 100% 100%
their school is well maintained (S2078) 100% 100% 100%
their school gives them opportunities to do interesting things (S2079)
100% DW 100%
* Nationally agreed student and parent/caregiver items # ‘Agree’ represents the percentage of respondents who Somewhat Agree, Agree or Strongly Agree with the statement. DW = Data withheld to ensure confidentiality.
Parent and community engagement When students are enrolled at Stonehenge State School parents, students and school staff enter an important
partnership that works to achieve the best educational and social opportunities and outcomes for students. There
is an expectation that all stakeholders within the partnership will work and socialise in an ordered, safe, secure,
supportive and productive learning environment.
To ensure this partnership works effectively, Stonehenge State School believes that good communication is
essential and is achieved through regular emails, weekly newsletters, information and permission forms for
special events and extra-curricular activities, community notice board, school website, interviews and telephone
calls. The school maintains an open door policy that encourages parents to enter the classroom and become
involved in school camps, sports days, end-of-term breakups and the annual Christmas concert.
Parents are encouraged to become involved in their child’s education through:
- Parents and Citizens Association
- Volunteering for special events and extra-curricular activities
- Accompanying students and staff on school excursions
- Participating in parent/teacher interviews
- Attending end-of-term and end-of-year activities
Respectful relationships programs
Students at Stonehenge State School are given the opportunity to engage in respectful relationship awareness programs throughout their Health and Physical Education unit with frequent referral to the common core values – Be Responsible, Be Respectful and Be Safe. Additionally, the students engage in activity sessions run by North West Health who provide, amongst other things, information surrounding the recognise, react and report framework.
The school has developed and implemented programs that focus on appropriate, respectful, equitable and healthy relationships.
School Disciplinary Absences The following table shows the count of incidents for students recommended for each type of school disciplinary absence reported at the school.
SCHOOL DISCIPLINARY ABSENCES
Type 2015 2016 2017
Short Suspensions – 1 to 10 days 0 0 0
Long Suspensions – 11 to 20 days 0 0 0
Exclusions 0 0 0
Cancellations of Enrolment 0 0 0
.
9
Environmental Footprint
Reducing the school’s environmental footprint Stonehenge State School is committed to implementing and enforcing energy and water saving measures. It is an expectation that all students and staff manage consumable energies with care through consideration of economical cooling/heating temperatures, use of lights and power draw of electronic equipment such as computers and charging stations.
Stonehenge State School has numerous water tanks installed and rainwater is solely used within the classroom. Students are aware of how precious water is and are careful when turning off taps in and out of the classroom. Raw town water supplied by the Thompson River is used in the toilets and for watering school grounds.
ENVIRONMENTAL FOOTPRINT INDICATORS
Years Electricity
kWh Water
kL
2014-2015 12,212 200
2015-2016 8,754 200
2016-2017 12,388 200
The consumption data is compiled from sources including ERM, Ergon reports and utilities data entered into OneSchool by each school. The data provides an indication of the consumption trend in each of the utility categories which impact on the school’s environmental footprint.
School Funding
School income broken down by funding source School income, reported by financial year accounting cycle using standardized national methodologies and broken down by funding source is available via the My School website at http://www.myschool.edu.au/.
To access our income details, click on the My School link above. You will then be taken to the My School website with the following ‘Find a school’ text box.
Where it states ‘School name’, type in the name of the school you wish to view, select the school from the drop-down list and select <GO>. Read and follow the instructions on the next screen; you will be asked to confirm that you are not a robot then by clicking continue, you acknowledge that you have read, accepted and agree to the Terms of Use and Privacy Policy before being given access to the school’s profile webpage.
School financial information is available by selecting ‘School finances’ in the menu box in the top left corner of the school’s profile webpage. If you are unable to access the internet, please contact the school for a paper copy of income by funding source.
Highest level of qualification Number of classroom teachers and school leaders at the
school
Doctorate
Masters
Graduate Diploma etc.** 1
Bachelor degree 1
Diploma
Certificate
*Teaching staff includes School Leaders **Graduate Diploma etc. includes Graduate Diploma, Bachelor Honours Degree, and Graduate Certificate.
Professional Development Expenditure On and Teacher Participation in Professional Development
The total funds expended on teacher professional development in 2017 were $5000.
The major professional development initiatives are as follows:
- Central Queensland Regional Principal’s Conference - Principal’s Business Meetings - Instructional Rounds – Outback Advantage - Numeracy Improvement Project Moderation - Curriculum Planning - Data Analysis - One School Finance Workshops - First Aid Training.
The proportion of the teaching staff involved in professional development activities during 2017 was 100%.
11
Staff Attendance and Retention Staff attendance
AVERAGE STAFF ATTENDANCE (%)
Description 2015 2016 2017
Staff attendance for permanent and temporary staff and school leaders. 100% 98% 99%
Proportion of Staff Retained from the Previous School Year From the end of the previous school year, 100% of staff was retained by the school for the entire 2017.
Performance of Our Students
Key Student Outcomes
Student Attendance
Student attendance
The table below shows the attendance information for all students at this school:
STUDENT ATTENDANCE 2017
Description 2015 2016 2017
The overall attendance rate* for the students at this school (shown as a percentage). 97% 92% 91%
The attendance rate for Indigenous students at this school (shown as a percentage). 98% 87% 86%
*The student attendance rate is generated by dividing the total of full-days and part-days that students attended, and comparing this to the total of all possible days for students to attend, expressed as a percentage.
The overall student attendance rate in 2017 for all Queensland Primary schools was 93%.
AVERAGE STUDENT ATTENDANCE RATE* (%) FOR EACH YEAR LEVEL
Year Level
Prep Year
1 Year
2 Year
3 Year
4 Year
5 Year
6 Year
7 Year
8 Year
9 Year 10
Year 11
Year 12
2015 DW DW DW DW DW
2016 DW DW DW DW
2017 DW 90% DW 87%
*Attendance rates effectively count attendance for every student for every day of attendance in Semester 1. The student attendance rate is generated by dividing the total of full-days and part-days that students attended, and comparing this to the total of all possible days for students to attend, expressed as a percentage.
DW = Data withheld to ensure confidentiality.
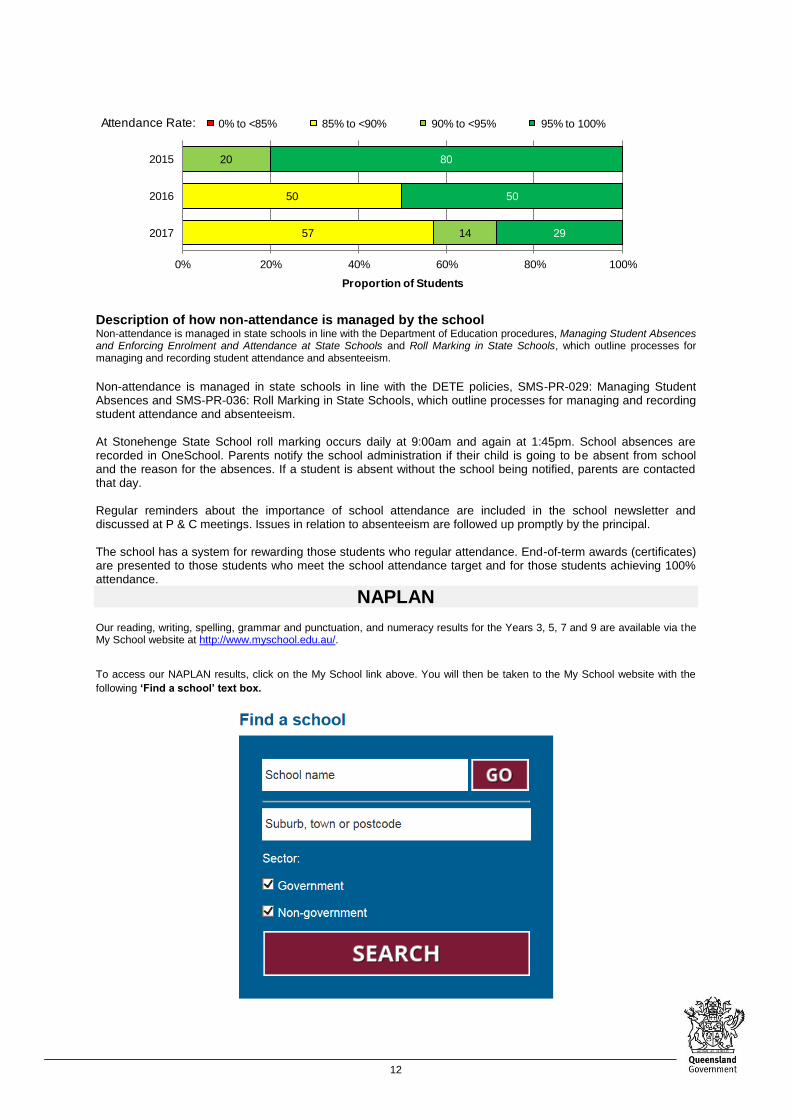
Student Attendance Distribution The proportions of students by attendance range:
12
57
50
14
20
29
50
80
0% 20% 40% 60% 80% 100%
2017
2016
2015
Proportion of Students
Attendance Rate: 0% to <85% 85% to <90% 90% to <95% 95% to 100%
Description of how non-attendance is managed by the school Non-attendance is managed in state schools in line with the Department of Education procedures, Managing Student Absences and Enforcing Enrolment and Attendance at State Schools and Roll Marking in State Schools, which outline processes for managing and recording student attendance and absenteeism.
Non-attendance is managed in state schools in line with the DETE policies, SMS-PR-029: Managing Student Absences and SMS-PR-036: Roll Marking in State Schools, which outline processes for managing and recording student attendance and absenteeism. At Stonehenge State School roll marking occurs daily at 9:00am and again at 1:45pm. School absences are recorded in OneSchool. Parents notify the school administration if their child is going to be absent from school and the reason for the absences. If a student is absent without the school being notified, parents are contacted that day. Regular reminders about the importance of school attendance are included in the school newsletter and discussed at P & C meetings. Issues in relation to absenteeism are followed up promptly by the principal. The school has a system for rewarding those students who regular attendance. End-of-term awards (certificates) are presented to those students who meet the school attendance target and for those students achieving 100% attendance.
NAPLAN
Our reading, writing, spelling, grammar and punctuation, and numeracy results for the Years 3, 5, 7 and 9 are available via the My School website at http://www.myschool.edu.au/.
To access our NAPLAN results, click on the My School link above. You will then be taken to the My School website with the
Where it states ‘School name’, type in the name of the school you wish to view, select the school from the drop-down list and select <GO>. Read and follow the instructions on the next screen; you will be asked to confirm that you are not a robot then by clicking continue, you acknowledge that you have read, accepted and agree to the Terms of Use and Privacy Policy before being given access to the school’s profile webpage.