Page 1
UNITED STATESSECURITIES AND EXCHANGE COMMISSION
Washington, D.C. 20549
FORM 8-K
CURRENT REPORTPURSUANT TO SECTION 13 OR 15(d)
OF THE SECURITIES EXCHANGE ACT OF 1934
Date of Report: (Date of earliest event reported): December 14, 2016
StoneMor Partners L.P.(Exact name of Registrant as Specified in Its Charter)
Delaware 001-32270 80-0103159
(State or other jurisdictionof incorporation)
(Commissionfile number)
(I.R.S. EmployerIdentification No.)
3600 Horizon Boulevard Trevose, PA 19053(Address of principal executive offices) (Zip Code)
Registrant’s telephone number, including area code (215) 826-2800
Not Applicable(Former name or former address, if changed since last report)
ChecktheappropriateboxbelowiftheForm8-Kfilingisintendedtosimultaneouslysatisfythefilingobligationoftheregistrantunderanyofthefollowingprovisions:
☐ WrittencommunicationspursuanttoRule425undertheSecuritiesAct(17CFR230.425)
☐ SolicitingmaterialpursuanttoRule14a-12undertheExchangeAct(17CFR240.14a-12)
☐ Pre-commencementcommunicationspursuanttoRule14d-2(b)undertheExchangeAct(17CFR240.14d-2(b))
☐ Pre-commencementcommunicationspursuanttoRule13e-4(c)undertheExchangeAct(17CFR240.13e-4(c))
Page 2
Item 7.01. Regulation FD Disclosure
RepresentativesofStoneMorPartnersL.P.(the“Company”)willparticipateinmeetingswithinvestorsonDecember14,2016.PresentationslideswillbemadeavailableintheInvestorssectionoftheCompany’swebsiteatwww.stonemor.com.AcopyofthepresentationslidestobeusedisattachedheretoasExhibit99.1.
TheinformationfurnishedpursuanttothisItem7.01,includingExhibit99.1,shallnotbedeemedtobe“filed”forpurposesofSection18oftheSecuritiesExchangeActof1934,asamended(the“ExchangeAct”),orotherwisesubjecttotheliabilitiesofthatsection,norshallitbedeemedtobeincorporatedbyreferenceintoanyfilingundertheSecuritiesActof1933,asamended,ortheExchangeAct.TheCompanyisnotundertakingtoupdatethispresentation.Thisreportshouldnotbedeemedanadmissionastothematerialityofanyinformationcontainedintheinvestorpresentation.
Item 9.01. Financial Statements and Exhibits
(d) Exhibits.
Thefollowingexhibitisfurnishedwiththisreport.Exhibitnumber Description
99.1 InvestorPresentationdatedDecember14,2016.
2
Page 3
SIGNATURES
PursuanttotherequirementsoftheSecuritiesExchangeActof1934,theregistranthasdulycausedthisreporttobesignedonitsbehalfbytheundersignedhereuntodulyauthorized.Date:December14,2016 STONEMOR PARTNERS L.P.
By: StoneMorGPLLC itsgeneralpartner
By: /s/SeanP.McGrath Name: Sean P. McGrath Title: Chief Financial Officer
3
Page 4
Exhibit 99.1
Exhibit99.1StoneMorPartnersL.P.2016InvestorDay–TheLondonNYCHotelDecember14,2016
Page 5
ForwardLookingStatements2Thispresentationcontainsforward-lookingstatementsthatinvolveanumberofassumptions,risksanduncertaintiesthatcouldcauseactualresultstodiffermateriallyfromthosecontainedintheforward-lookingstatements.ThePartnershipcautionsreadersthatanyforward-lookinginformationisnotaguaranteeoffutureperformance.Suchforward-lookingstatementsinclude,butarenotlimitedto,statementsaboutfuturefinancialandoperatingresults,thePartnership’splans,objectives,expectationsandintentionsandotherstatementsthatarenothistoricalfacts.Risks,assumptionsanduncertaintiesthatcouldcauseactualresultstomateriallydifferfromtheforward-lookingstatementsinclude,butarenotlimitedto,thoseassociatedwiththecashflowfromourpreneedandat-needsales,ourtrusts,andfinancings,whichmayimpactourabilitytomeetourfinancialprojections,ourabilitytoserviceourdebtandpaydistributions,andourabilitytoincreaseourdistributions;futurerevenueandrevenuegrowth;theintegrationoranticipatedbenefitsofourrecentacquisitionsoranyfutureacquisitions;ourabilitytocompleteandfundadditionalacquisitions;theeffectofeconomicdownturns;theimpactofourleverageonouroperatingplans;thedeclineinthefairvalueofcertainequityanddebtsecuritiesheldinourtrusts;ourabilitytoattract,trainandretainanadequatenumberofsalespeople;thevolumeandtimingofpre-needsalesofcemeteryservicesandproducts;increaseduseofcremation;changesinthedeathrate;changesinthepoliticalorregulatoryenvironments,includingpotentialchangesintaxaccountingandtrustingpolicies;litigationorlegalproceedingsthatcouldexposeustosignificantliabilitiesanddamageourreputation;theeffectsofcybersecurityattacksduetooursignificantrelianceoninformationtechnology;thefinancialconditionofthird-partyinsurancecompaniesthatfundourpre-needfuneralcontracts;andotherrisks,assumptionsanduncertaintiesdetailedfromtimetotimeinthePartnership’sreportsfiledwiththeU.S.SecuritiesandExchangeCommission,includingquarterlyreportsonForm10-Q,reportsonForm8-KandannualreportsonForm10-K.Forward-lookingstatementsspeakonlyasofthedatehereof,andthePartnershipassumesnoobligationtoupdatesuchstatements,exceptasmayberequiredbyapplicablelaw.
Page 6
Today’sAgenda3TopicSpeakerIntroduction&HistoryBobHellman,ChairmanoftheGPDeathcareIndustryTrendsLarryMiller,CEOHowStoneMorMakesMoneySeanMcGrath,CFOWhatWentWrongBobHellman,ChairmanoftheGPActionPlansLarryMiller,CEONextSteps/ProgressVisibilityBobHellman,ChairmanoftheGPQ&A
Page 7
AnswersFirst…4StoneMorhasbeenoperatingforoveradozenyearsasamasterlimitedpartnership,pursuingoneconsistentstrategyandoperationalmodelDistributioncutdrivenbyself-inducedoperatingchallengeswhichmanifestedoverthepastfewquartersNotanindustryproblem–industryhasterrifictailwindsNotabusinessmodelproblemOperatingchallengesareknown,solutionsidentifiedandprogressunderwayAsprogressmanifestsitselfinincreasecashflow,weexpectthatdistributionswillbeincreasedoverthenext12-24months
Page 8
DiscussionTopicsTopicsThisPresentationWillAddress5StoneMorhistoryDeathcareindustrytrendsHowStoneMormakesmoneyWhatwentwrong?SustainabilityofcurrentdistributionActionplansNextsteps/progressvisibility
Page 9
WhoWeAre6317cemeteries/105funeralhomesacross28statesandPuertoRicoCompleterangeoffuneralmerchandiseandservices,soldbothatthetimeofneedandonapre-needbasis$840millionoftrustinvestments~53,500/16,800funeralservicecallsperformedinthelasttwelvemonthsStructuredasamasterlimitedpartnership(MLP)tooptimizetaxefficiencyNote:AsofSeptember30,2016.SecondLargestOwnerAndOperatorOfCemeteriesInTheU.S.
Page 10
NationalFootprint7317Cemeteries+105FuneralHomes=422TotalLocationsWAORCACOKSIAILMOINMIOHPAWVKYTNVANCSCMSALGAFLWICurrentStates2004IPOStatesNote:AsofNovember30,2016.NJMDDERIHIPR
Page 11
22459110010312213914414517117518561943454551647783919898050100150200250300200520062007200820092010201120122013201420152016CemeteriesFuneralHomes8LongHistoryofSteadyGrowth185cemeteriesand98funeralhomesacquiredsince2004IPO(1)Acquisitionshavebeenmadeatmultiplesof4x–6xEBITDACumulativePropertiesAcquiredSinceIPO(1)(1)Netofsales,divestituresandconsolidations.
Page 12
9DeathcareIndustryTrends
Page 13
DeathcareIndustryOverview10$20billionindustryConcentratedindependents/non-economicownershipFewscaleplayerstoactasindustryconsolidatorsSubstantialBarrierstoEntryStableDeathRateFavorableDemographicsVirtuallynogrowthincemeterysupplySignificantfinancialandoperatingregulations(stateandfederal)OveralldeathrateremainsstableAgingpopulationdrivingat-needandpre-needdemandPre-needpenetrationonly17%ofpopulationCremationcreatesopportunityformemorializationLargeandHighlyFragmentedIndustry
Page 14
CemeteriesFuneralHomes&Crematories$16billion$4billionCemeteries&FuneralHomesLargeandHighlyFragmentedIndustry11$20BillionDeathcareIndustryHighlyFragmentedOwnership86%offuneralhomesarefamilyownedorsmallbusinesses;14%ownedbylargecorporationsSources:NationalFuneralDirectorsAssociation;IBIS,Industryresearch70%30%ForProfit7,500Municipal,Military,Religious,Non-Profit,17,500HospiceCarerevenue–$25billionin2016growing7%AssistedLiving–$79billionin2016growing6%CemeteriesOnly
Page 15
12SubstantialBarrierstoEntryScarcityandcostofrealestateneardenselypopulatedareasZoningrestrictionsInitialcapitalrequirementsAdministrativelycomplexbusinessfornewentrantsCemeteries(SocialInfrastructure)FuneralHomes(SpecialtyRetail)LicensingrequirementsFuneralhomesarepartofthecommunityStrengthoffamilytraditionandheritageBarrierstoentrydrivenbyheritage
Page 16
StableDeathRate13Industrygrowthdrivenbydemographicsandsupportedbyever-presentdemandformemorializationandcelebrationsoflife2.12.32.42.52.62.73.31990199520002005201020152030PU.S.DeathRate(mm)Sources:NationalFuneralDirectorsAssociation;U.S.CensusBureau;NCHS.
Page 17
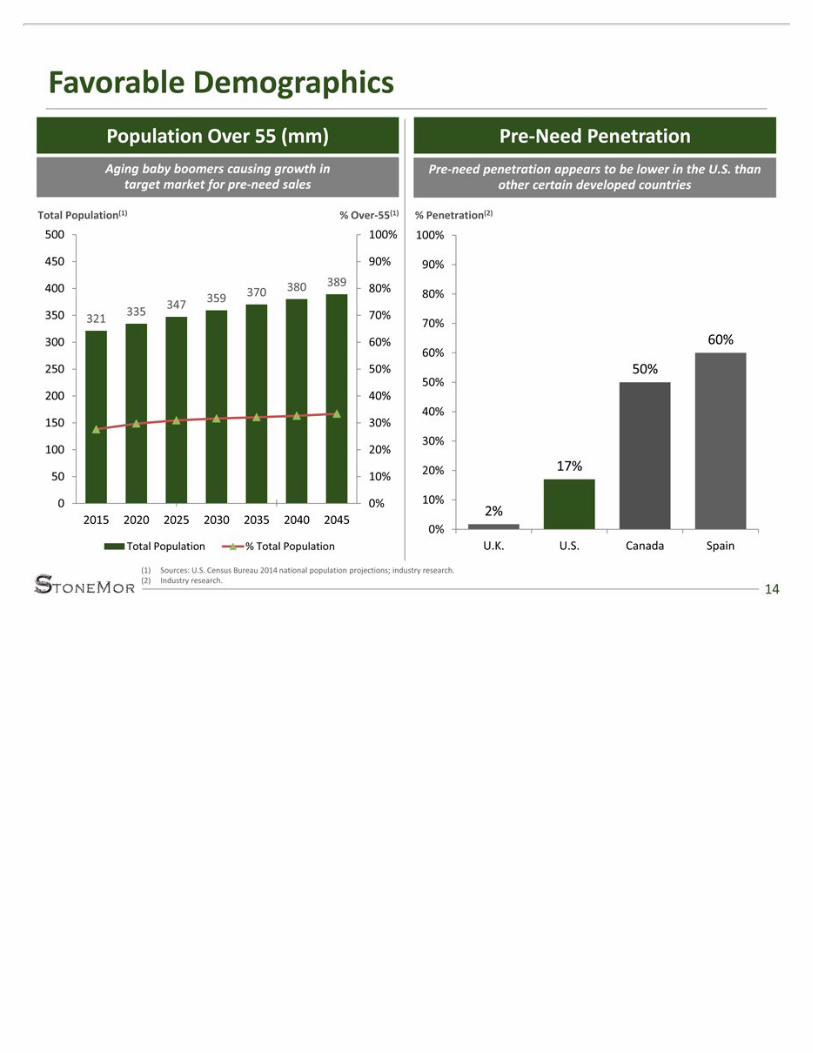
FavorableDemographics14PopulationOver55(mm)Pre-NeedPenetrationAgingbabyboomerscausinggrowthintargetmarketforpre-needsalesTotalPopulation(1)%Over-55(1)(1)Sources:U.S.CensusBureau2014nationalpopulationprojections;industryresearch.(2)Industryresearch.3213353473593703803890%10%20%30%40%50%60%70%80%90%100%0501001502002503003504004505002015202020252030203520402045TotalPopulation%TotalPopulationPre-needpenetrationappearstobelowerintheU.S.thanothercertaindevelopedcountries%Penetration(2)2%17%50%60%0%10%20%30%40%50%60%70%80%90%100%U.K.U.S.CanadaSpain
Page 18
CremationCreatesOpportunity15CremationNon-Cremation#ofDeaths(mm)(1))(1)TotalanticipateddeathsperU.S.CensusBureau2009projections.TraditionalBurialCosts:~$8,000•Traditionalspace•Vault•Opening/closing•Bronzemarker/granitebaseSampleCremationCosts:~$5,000-$7,000•IndoorNicheorGroundSpace•Cremationvault•Opening/closing•Bronzemarker/plate/granitebaseMarginsupto90%Marginsupto60%Note:Pricesandpackagesvarybylocation.0.00.51.01.52.02.53.03.54.020052010201520202025203020352040Non-CremationRiseofCremationMarginforCremationvs.BurialCremationprofitmarginopportunityasgreatastraditionalburialGrowingdeathrateexpectedtooffset
Page 19
DeathcareIndustryContext16Deathcareindustrycontinuestogrow,drivenbydemographictailwindsFragmentedownershipandlackofindustryconsolidatorsresultsinsubstantialconsolidationopportunityCremationasmuchofanopportunityasathreatBarrierstoentryserveasthebasisforcompanystability
Page 20
17HowStoneMorMakesMoney
Page 21
HowStoneMorMakesMoney18IncomegeneratedfromtrustfundinvestmentsAt-NeedSalesPre-NeedSalesSaleofproductsandservicesattimeofdeathSaleofproductsandservicesinadvanceofneedTrustFundRevenueThreeSourcesofOperatingProfitability
Page 22
TrustFundRevenue19CemeteriesarerequiredbystatelawtodepositaportionofsalespriceintotrustsFundsinvestedacrossadiversifiedportfoliooffixedincomeandequityinvestmentsActivelymanagedbyCambridgeAssociatesasinvestmentadvisor$376$432$485$465$505$282$312$345$308$335$658$743$830$772$840$0$100$200$300$400$500$600$700$800$900$1,00012/1212/1312/1412/159/16MerchandiseTrustPerpetualCareTrustHistoricalTrustAssets($mm)RealizedProfit($mm)$33$34$37$40$40$9$20$15$14$4-$5$5$15$25$35$45$55$652012201320142015LTMMDSERealizedGains&LossesTotalInterestandDividendsTrendline(InterestandDividends)
Page 23
At-NeedSales20CloselycorrelatedtodeathrateMarketsharebasedonheritageandrelativelystablePerformancelargelybasedoncostcontrol,servicequalityanddeathrateExpectedtoincreaseinnearfutureasbaby-boomersageU.S.DeathRate(mm)Source:NationalFuneralDirectorsAssociation;U.S.CensusBureau;NCHS.2.12.32.42.52.62.73.31990199520002005201020152030P
Page 24
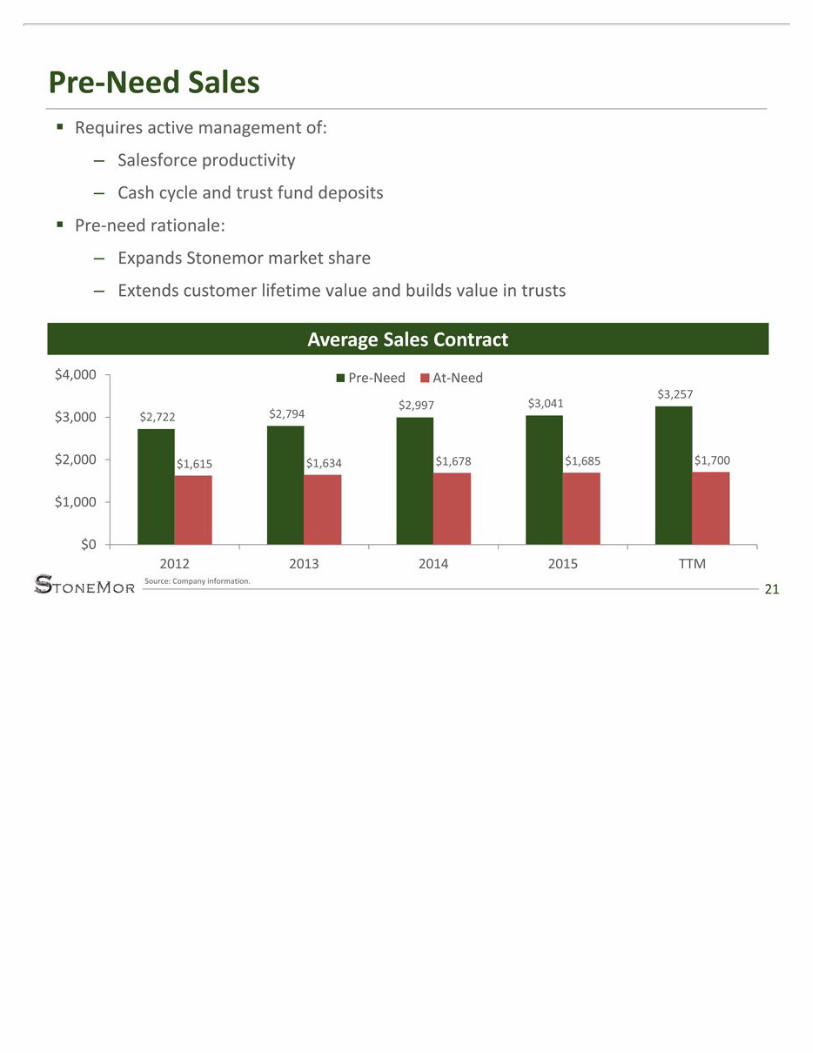
Pre-NeedSales21Requiresactivemanagementof:–Salesforceproductivity–CashcycleandtrustfunddepositsPre-needrationale:–ExpandsStonemormarketshare–Extendscustomerlifetimevalueandbuildsvalueintrusts$2,722$2,794$2,997$3,041$3,257$1,615$1,634$1,678$1,685$1,700$0$1,000$2,000$3,000$4,0002012201320142015TTMPre-NeedAt-NeedAverageSalesContractSource:Companyinformation.
Page 26
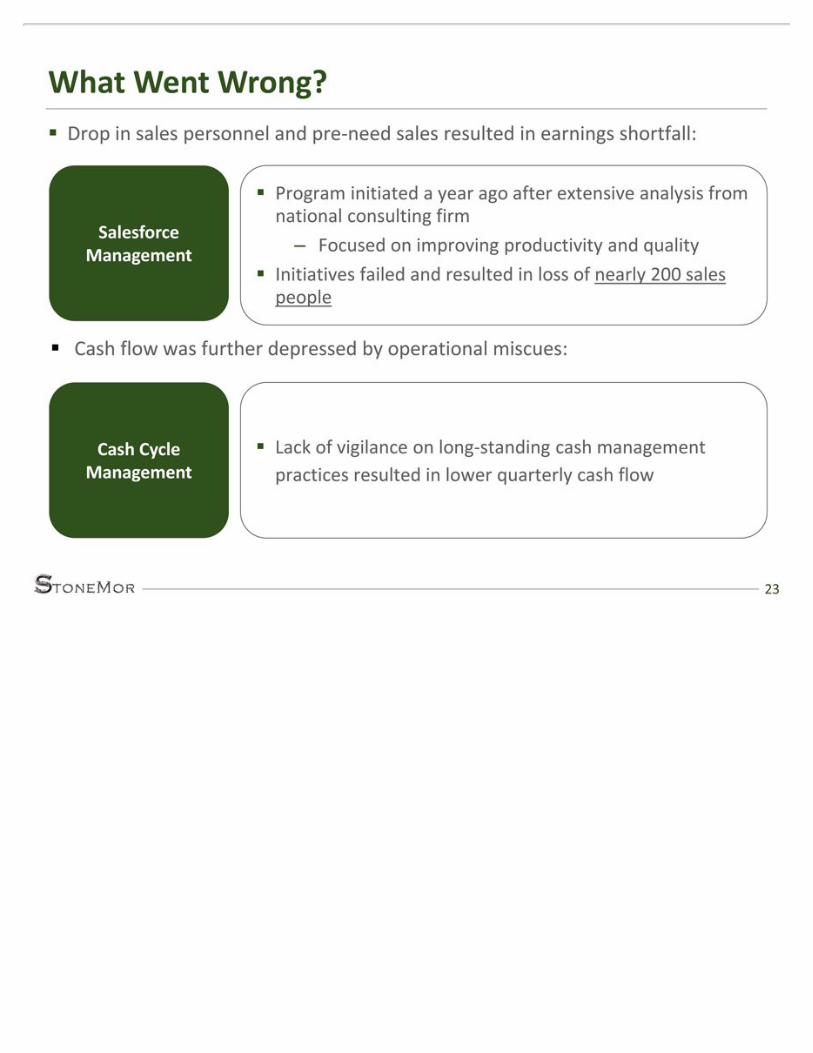
WhatWentWrongDropinsalespersonnelandpre-needsalesresultedinearningsshortfall:23Programinitiatedayearagoafterextensiveanalysisfromnationalconsultingfirm–FocusedonimprovingproductivityandqualityInitiativesfailedandresultedinlossofnearly200salespeopleCashCycleManagementLackofvigilanceonlong-standingcashmanagementpracticesresultedinlowerquarterlycashflowSalesforceManagementCashflowwasfurtherdepressedbyoperationalmiscues:
Page 27
SalesforceAttrition24SevereattritioninlowerperformingtiersTotalUniqueProducingSalespeoplePerQuarter916957788824640690740790840890940990Mar-15Jun-15Sep-15Dec-15Mar-16Jun-16Sep-16
Page 28
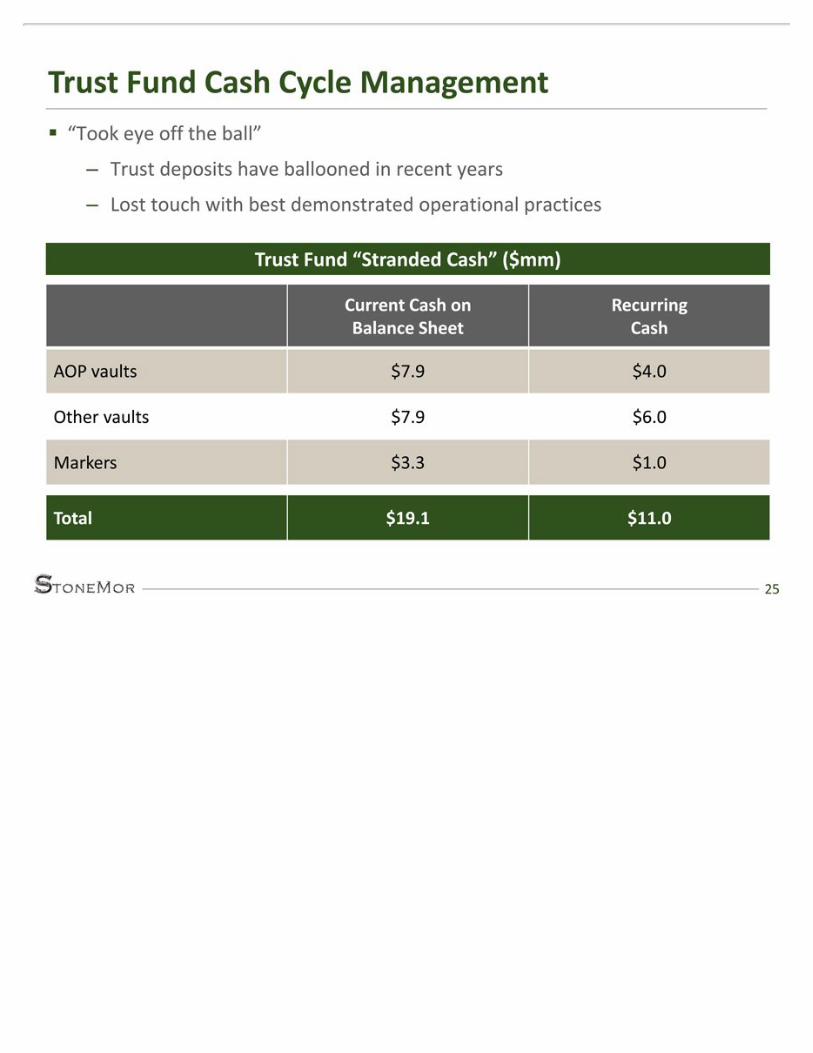
TrustFundCashCycleManagement“Tookeyeofftheball”–Trustdepositshaveballoonedinrecentyears–Losttouchwithbestdemonstratedoperationalpractices25CurrentCashonBalanceSheetRecurringCashAOPvaults$7.9$4.0Othervaults$7.9$6.0Markers$3.3$1.0Total$19.1$11.0TrustFund“StrandedCash”($mm)
Page 29
AOPTransactionSignificantcashdragfromdevelopmentofpre-needsalesforAOPproperties26Pre-NeedBillings($mm)WorkingCapitalNeeds($mm)$8$12$20$0$5$10$15$20$25CumulativeSinceInceptionA/RBuild-upTrustBuild-up$40$40$0$5$10$15$20$25$30$35$40$45$50CumulativeSinceInceptionPre-NeedBillingsBudgetPre-NeedBillingsActual
Page 31
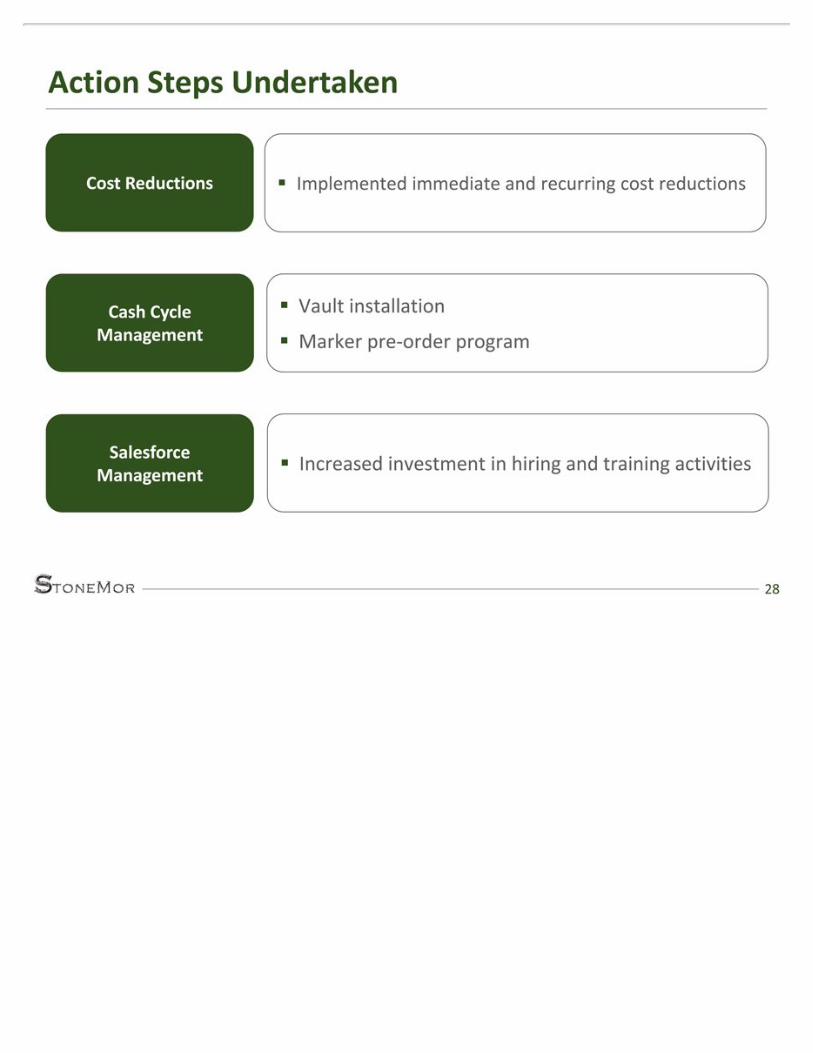
ActionStepsUndertaken28IncreasedinvestmentinhiringandtrainingactivitiesCashCycleManagementCostReductionsVaultinstallationMarkerpre-orderprogramImplementedimmediateandrecurringcostreductionsSalesforceManagement
Page 32
CostReductions29Abletoachieverealcashsavingsofover$6mmCurrentlyimplementing$5mmofadditionalsavings(completedbyyearend)Byyearend,StoneMorwillhaveimplementedover$11mmofcostsavingsthatwilldirectlyaffect2017cashflowInaddition,StoneMorisevaluatingoptionofusinglifeinsurancecontractstoreplacefuturepre-needtrustdepositsforMerchandiseTrustfund
Page 33
CashCycleManagement30CostsRequiredExpectedResultsSpecificActionItemsOnlythelossoffuturetrustearningsfromredeemedtrustdepositsInstallingbacklogofuninstalledvaultsAutomatingmarkerordersChangingcontractingandcompensationsystemtobettermanagecashcycleoftrustfunddepositsRecaptureover$20mmofstrandedcapitalImplementationwellunderwayMaterialimprovementinongoingcashflowefficiency
Page 34
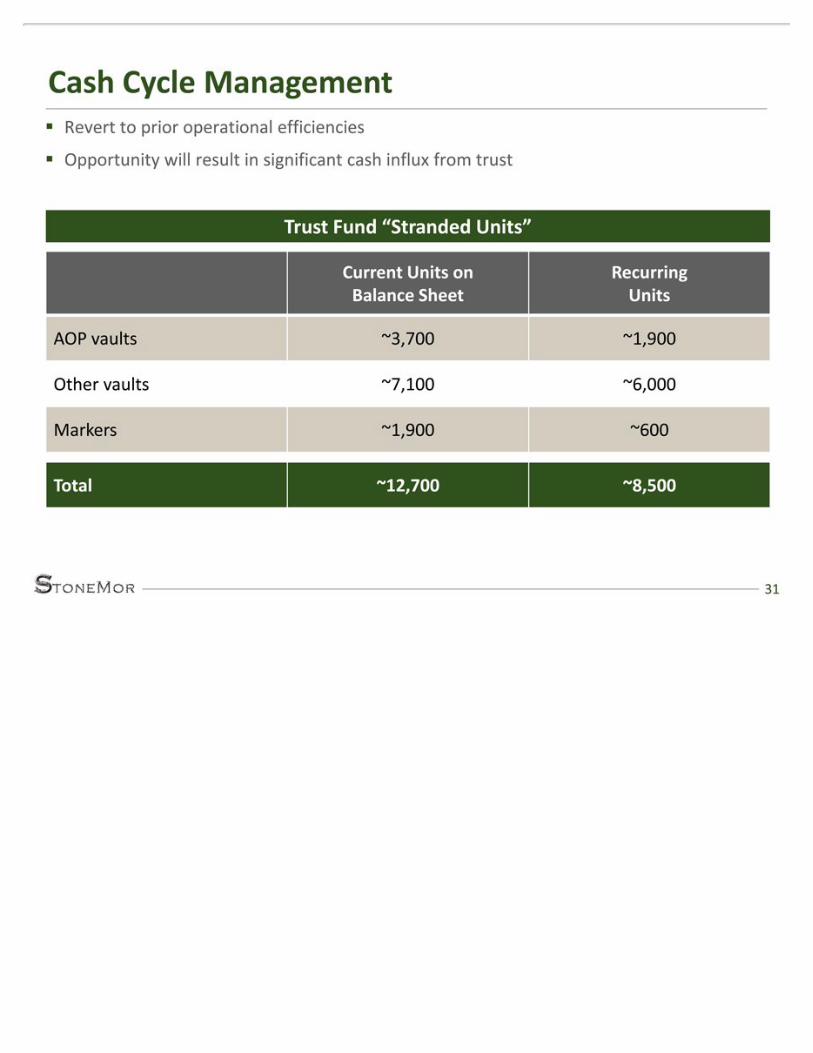
CashCycleManagement31CurrentUnitsonBalanceSheetRecurringUnitsAOPvaults~3,700~1,900Othervaults~7,100~6,000Markers~1,900~600Total~12,700~8,500TrustFund“StrandedUnits”ReverttoprioroperationalefficienciesOpportunitywillresultinsignificantcashinfluxfromtrust
Page 35
SalesforceManagement32CostsRequiredExpectedResultsSpecificActionItemsHiredNationalSalesManagerHirednationalsalesforcerecruitingfirm,XelerateHired3additionaltrainers(8total)Salesforcerebuildingcosts,including:–Trainerandnewsalescounselorpayroll–TravelexpensesIncreasedsalesforceheadcounttotargetlevelsIncreasedsalesforceretentionInitiativethatwilltake6to9monthstocomplete
Page 36
Salesforce“Efficiency”Consequences33RecentlossesinheadcountpartiallyoffsetbyimprovementsinproductivityHistoricaldatashowthataveragesalespersonproductivityimprovedevenduringperiodsofgrowingheadcount$38$55$0$10$20$30$40$50$60Avg.MonthlySalesPerPerson($000s)SalesforceRecruiting—Headcount68972269776476801002003004005006007008009007/168/169/1610/1611/16Top300SalespeopleBasedon2014StaticCohort
Page 37
SalesforceROI34RecruitingandTrainingCostsAvg.LTMBillingsBySalespersonNeartermrecruitingandtraininginvestmentswillresultinhiringandretentionofqualitysalespeopleSalespersonTierAverageLTMBillings($000s)1-100$946101-200$503201-500$253Note:LTMasofQ3’16.Annualrecruitingcosts:$350,000•$250,000fornationalrecruitingfirm,Xelerate•$100,000forinternalrecruitingstaffAnnualtrainingcosts:$3,100,000•$2,100,000forsalesforcetrainingsalaries•$1,000,000forinternaltrainingstaff+otherTotalannualrunratecosts:$3,450,000Total2015costs:$1,500,000Hiringof100“Tier3”salespeoplewouldresultin3.1xROIonannualrecruitingandtrainingcosts(1)(1)Assumes~30%cashmarginbasedonYear1+2cashflow.
Page 38
35NextSteps/Visibility
Page 39
WhereWeAreNowBusinessisstabilized–Recentsales,headcountandothermetricsreflectpositivemomentum36AnnualizedYTDSeptYTDSept20162016GAAPOperatingCashFlow$18.5$24.7ActionsundertakentoimpactGAAPOperatingCashFlowin2017:-Recurringtrustfundcashduetoimprovedpractices$10.6-Implementedrecurringcostsavings$11.0EvenAtToday’sReducedRevenuesCurrentDistributionIsSustainable3rdQuarter2016CashDistributionAnnualizedis$44.4
Page 40
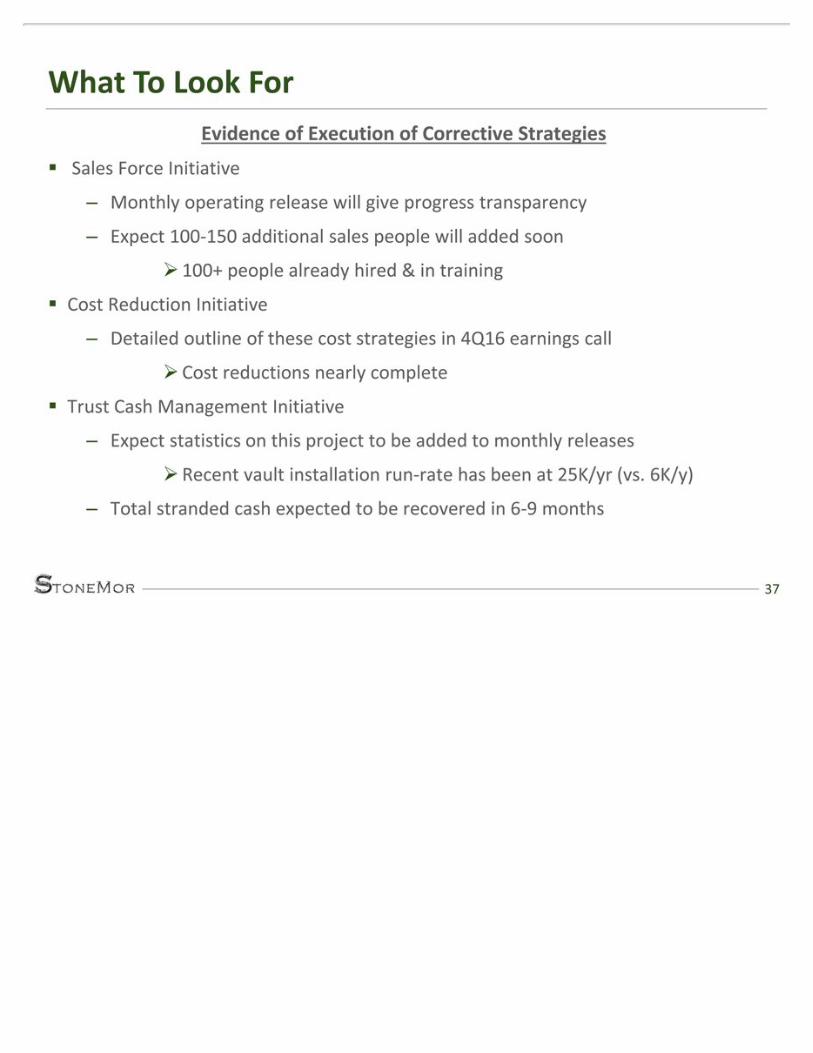
WhatToLookForEvidenceofExecutionofCorrectiveStrategiesSalesForceInitiative–Monthlyoperatingreleasewillgiveprogresstransparency–Expect100-150additionalsalespeoplewilladdedsoon100+peoplealreadyhired&intrainingCostReductionInitiative–Detailedoutlineofthesecoststrategiesin4Q16earningscallCostreductionsnearlycompleteTrustCashManagementInitiative–ExpectstatisticsonthisprojecttobeaddedtomonthlyreleasesRecentvaultinstallationrun-ratehasbeenat25K/yr(vs.6K/y)–Totalstrandedcashexpectedtoberecoveredin6-9months37
Page 41
PathToDistributionGrowthThetrustfundcashmanagementandcostsinitiativesarewellunderwayWearenowsingularlyfocusedonthesalesrecoveryeffortThereisadirectcorrelationbetweensalesheadcountandoperatingresultsHowever,successofthisinitiativeinitiallyshowsupinnon-GAAPoperatingresultsVisibilityofthecashflowimpactofthisiscomplicatedbySECfocusonnon-GAAPreportingTherefore,asthesalesforcerecovers,weexpecttobeginmodestlyincreasingdistributionsHowever,thebulkoftheincreaseinourDCFwillinitiallybeutilizedtoincreaseourcoverageratioWeexpecttheoperatingrecoverytobecompletebyYE2017,withGAAPoperatingcashflowdemonstratingthisin2018.38
Page 43
StoneMorPartnersL.P.3600HorizonBlvd.,Suite100Trevose,PA1905340Contact:JohnMcNamara,Director–InvestorRelationsPhone:(215)826-2945E-mail:[email protected]