60
STOP, SWITCH OR STAY Research into STEM persistence at the University of New Mexico Conference on Excellence in Gateway Course Completion April 2013

STOP, SWITCH OR STAY Research into STEM persistence at the University of New Mexico
Conference on Excellence in Gateway Course Completion April 2013

Conference on Excellence in Gateway Course Completion April 2013
TIM SCHROEDER Project Director STEM Gateway Program University of New Mexico [email protected] 505-277-1761 http://unmstemgateway.blogspot.com/ (RESEARCH Tab) MISSION OF STEM GATEWAY: • Improve STEM instruction and student support
at the University of New Mexico • Improve STEM graduation rates among
Hispanic and/or low-income students
GRANT OVERVIEW: • Funded by US Depart of Education Hispanic
Serving Institution STEM Program • $3.8 million over five years • October 2011 through September 2016
For this presentation: http://unmstemgateway.blogspot.com/ … RESEARCH Tab, first QUICK LINK

Conference on Excellence in Gateway Course Completion April 2013
Specialties: • How the data is originally collected and entered into
Banner • How the data is pulled from Banner and organized into a
single data set • How the data is analyzed for statistical significance and
predictive modeling • How the data impacts policy and practice (my role) Acknowledgments • Vicky Dueer, Senior Institutional Researcher (former STEM
Gateway Institutional Researcher), University of New Mexico
• Patrick Coulombe, Graduate Assistant, STEM Gateway, University of New Mexico
• Terry Turner and Phil Handwerk, Office of Institutional Analytics, University of New Mexico
• Gary Smith, Principal Investigator, STEM Gateway, University of New Mexico
For this presentation: http://unmstemgateway.blogspot.com/ … RESEARCH Tab, first QUICK LINK

Conference on Excellence in Gateway Course Completion April 2013
THE UNIVERSITY OF NEW MEXICO, Main Campus…
• Is located in Albuquerque, New Mexico • Is a Carnegie Research University Very High Institution • Is a Hispanic Serving Institution • Is the flagship research university in New Mexico • Serves rural and urban students • In the fall of 2011, enrolled 29,056 students • In the fall of 2011, enrolled 10,749 Hispanic students (37%
of student population) • Is funded directly by the New Mexico legislature, and is not
part of a state-wide University system
For this presentation: http://unmstemgateway.blogspot.com/ … RESEARCH Tab, first QUICK LINK

Conference on Excellence in Gateway Course Completion April 2013
STOP, SWITCH OR STAY… Explores STEM degree completion patterns at UNM through two primary lenses: Degree outcomes. How do undergraduate students who graduate with STEM degrees differ from those who switch majors out of STEM, and from those who stop attending UNM prior to completing their degrees? Course outcomes. How do undergraduate STEM students perform in the core math & science gateway courses that lead into their STEM degrees?
For this presentation: http://unmstemgateway.blogspot.com/ … RESEARCH Tab, first QUICK LINK

Conference on Excellence in Gateway Course Completion April 2013
Our goal is to study the UNM STEM undergraduate student experience from beginning to end, and with a reasonable expectation of a maximum six year time to graduation. This information will be used to improve the STEM education experience at UNM. This data should not be used to blame departments or individuals in any way. Our data does not go deep enough to draw such conclusions.
Goal of this Study

Underlying Assumptions It is in the University’s best interest for us to increase the number of STEM graduates and to diversify the STEM workforce. This leads us to a few assumptions that may or may not be true to varying degrees: • When students state their STEM intent,
they do so with self-knowledge and deliberation.
• When students encounter difficulties in their STEM pursuit, it is in their best interest and the institution’s best interest for them to overcome those challenges and continue in STEM.

Conference on Excellence in Gateway Course Completion April 2013
POPULATION DESCRIPTION / DEFINITIONS
For both of these lenses, we studied: • 1503 first-time full-time freshmen students from the falls of 2005,
2006 and 2007 … • who initially stated they were interested in STEM degrees … • representing 16.6% of the freshman population during these three
fall semesters. These students indicated an interest in STEM majors when completing their admissions applications, or when visiting with academic advisors during their first semesters.

Conference on Excellence in Gateway Course Completion April 2013
DEGREE OUTCOMES LENS Student Outcomes This portion of the study seeks to identify patterns regarding four subsets of STEM students from the 2005, 2006 and 2007 cohorts as described above: • ENROLLED: Students who are still enrolled in courses at
UNM, and who indicate that as of Fall 2012 they were still working towards STEM degrees.
• GRADUATED: Students who graduated with STEM degrees prior to the Fall 2012 semester.
• SHIFTED: Students who switched out of STEM areas, but who continued taking courses at UNM. These students may or may not have graduated with degrees in non-STEM disciplines.
• STOPPED: Students who stopped attending courses at UNM.

Conference on Excellence in Gateway Course Completion April 2013
Table 1. Overview of Population
Total Number of Students 1503
Number of students who changed majors
out of STEM (SHIFTED) 639
Number of students who graduated with
STEM degrees (GRADUATED) 334
Number of students who stopped
attending UNM (STOPPED) 444
Number of students still enrolled at UNM
(ENROLLED) 86

Conference on Excellence in Gateway Course Completion April 2013
DEGREE OUTCOMES LENS Stem Definition For the purpose of this study, STEM (Science, Technology, Engineering and Mathematics) degrees are defined narrowly as those bachelor’s degrees within the following disciplines: astrophysics, biology, biochemistry, chemistry, computer science, earth & planetary sciences, engineering (all majors), environmental science, mathematics, physics, and statistics.

Conference on Excellence in Gateway Course Completion April 2013
DEGREE OUTCOMES LENS Variables This study attempts to define patterns related to each group that could help UNM identify for whom the status quo is working best and for whom we most need to redesign the ways that we teach and support students. In exploring these patterns, we considered the following student variables: • Ethnicity • Gender • Pell eligibility and median estimated family contribution (family income level) • Lottery scholarship status • First generation college student status • Average high school GPA • Average ACT scores • ACT scores and high school GPAs correlated to account for possible grade inflation • Cumulative college GPA at most recent semester completed • Average number of semesters taken to matriculate into a STEM program • Average number of remedial courses completed • Number of credit hours completed at the time of shifting out of STEM (for “shifted” and
“stopped” subgroups only) • Number of semesters completed at the time of shifting out of STEM (for “shifted” and
“stopped” subgroups only) • Cumulative UNM GPA when shifting out of STEM (for “shifted” and “stopped” subgroups
only)
Conference on Excellence in Gateway Course Completion April 2013
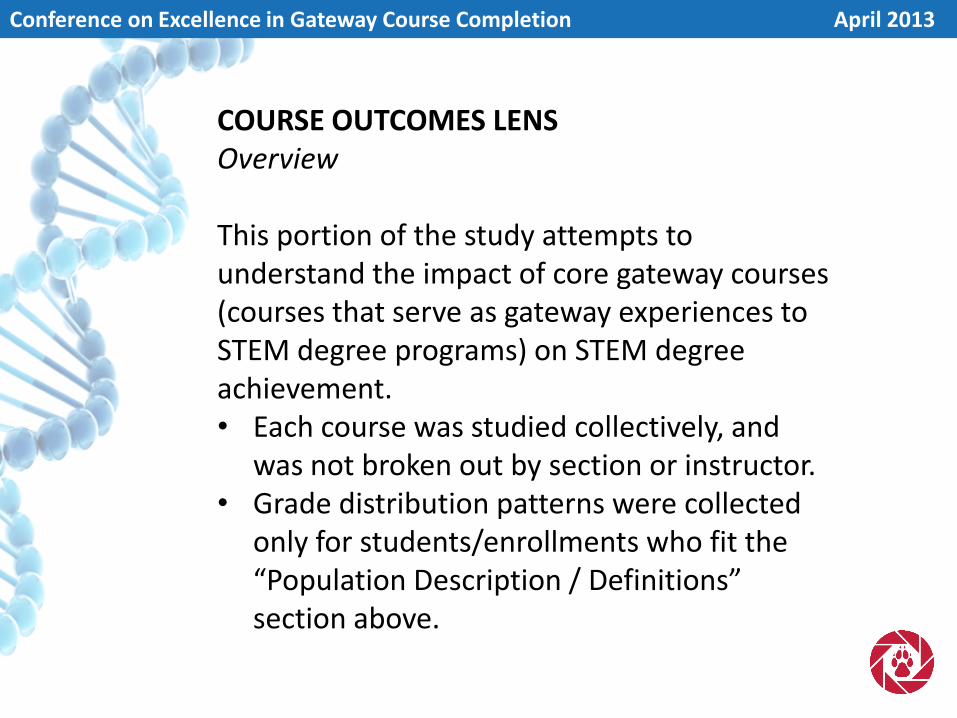
COURSE OUTCOMES LENS Overview This portion of the study attempts to understand the impact of core gateway courses (courses that serve as gateway experiences to STEM degree programs) on STEM degree achievement. • Each course was studied collectively, and
was not broken out by section or instructor. • Grade distribution patterns were collected
only for students/enrollments who fit the “Population Description / Definitions” section above.

Conference on Excellence in Gateway Course Completion April 2013
COURSE OUTCOMES LENS Definition for STEM Gateway Courses For purposes of the STEM Gateway Title V Program, STEM Gateway Courses are defined as those which meet at least one of the following criteria: • Entry level (100 and 200 level) program-requirement
courses that lead to degrees in the approved STEM disciplines
• Companion courses (labs, problem solving courses, etc) that are connected to Core Requirement or Program Requirement courses (as specified above)
• Pre-requisite courses that are required by students to take Core Requirement or Program Requirement courses (as specified above)
• Large-enrollment (>500 students/year) courses required for degrees in the approved STEM disciplines and typically taken within the first two years in the field.

Conference on Excellence in Gateway Course Completion April 2013
BIO 201 Molecular Cell Biology BIO 202 Genetics BIO 203 Ecology and Evolution CHEM 121 General Chemistry I CHEM 122 General Chemistry II CHEM 123 General Chemistry I LAB CHEM 124 General Chemistry II LAB CHEM 301 Organic Chemistry CHEM 302 Organic Chemistry CHEM 303 Organic Chemistry LAB CHEM 304 Organic Chemistry LAB CS 152 Computer Programming Fundamentals ECE 131 Program Fundamentals ENVS 101 The Blue Planet ENVS 102 The Blue Planet LAB EPS 101 Intro Geology, How Earth Works EPS 105 Physical Geology LAB EPS 201 Earth History
GATEWAY COURSES STUDIED

Conference on Excellence in Gateway Course Completion April 2013
MATH 107 Problems in College Algebra MATH 110 Problems in Elementary Calculus MATH 120 Intermediate Algebra MATH 121 College Algebra MATH 123 Trigonometry MATH 150 Pre-Calculus Math MATH 162 Calculus I MATH 163 Calculus II MATH 180 Elements of Calculus I MATH 181 Elements of Calculus II PHYC 151 General Physics PHYC 151L General Physics LAB PHYC 152 General Physics PHYC 152L General Physics LAB PHYC 157 Problems in General Physics PHYC 158 Problems in General Physics PHYC 160 General Physics PHYC 160L General Physics LAB PHYC 161 General Physics PHYC 161L General Physics LAB PHYC 167 Problems in General Physics PHYC 168 Problems in General Physics
GATEWAY COURSES STUDIED, continued
Conference on Excellence in Gateway Course Completion April 2013
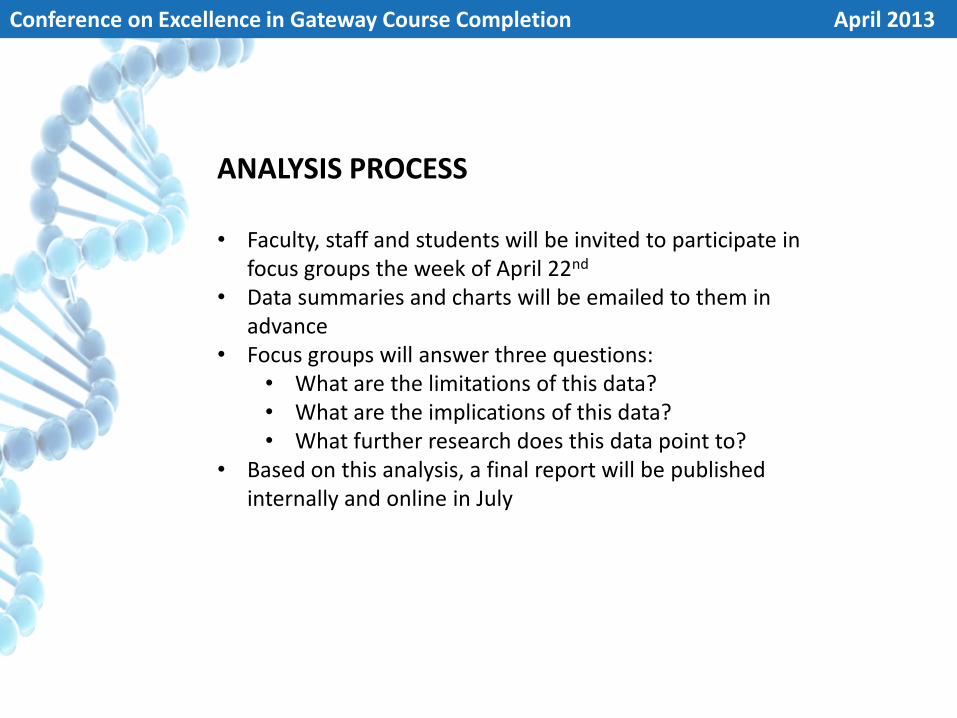
ANALYSIS PROCESS
• Faculty, staff and students will be invited to participate in
focus groups the week of April 22nd • Data summaries and charts will be emailed to them in
advance • Focus groups will answer three questions:
• What are the limitations of this data? • What are the implications of this data? • What further research does this data point to?
• Based on this analysis, a final report will be published internally and online in July

Conference on Excellence in Gateway Course Completion April 2013
PRELIMINARY FINDINGS DEGREE OUTCOMES LENS

Conference on Excellence in Gateway Course Completion April 2013
SPECIFIC MAJORS
There is a significant relationship between specific majors and students classification among the four categories (p<.001).
Conference on Excellence in Gateway Course Completion April 2013
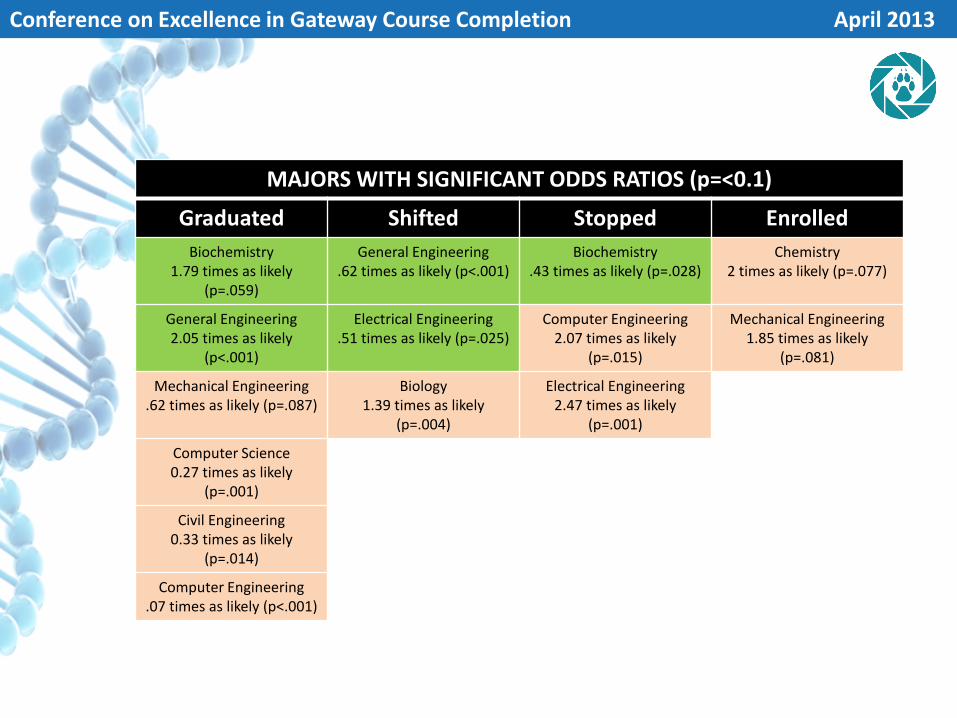
MAJORS WITH SIGNIFICANT ODDS RATIOS (p=<0.1)
Graduated Shifted Stopped Enrolled
Biochemistry 1.79 times as likely
(p=.059)
General Engineering .62 times as likely (p<.001)
Biochemistry .43 times as likely (p=.028)
Chemistry 2 times as likely (p=.077)
General Engineering 2.05 times as likely
(p<.001)
Electrical Engineering .51 times as likely (p=.025)
Computer Engineering 2.07 times as likely
(p=.015)
Mechanical Engineering 1.85 times as likely
(p=.081)
Mechanical Engineering .62 times as likely (p=.087)
Biology 1.39 times as likely
(p=.004)
Electrical Engineering 2.47 times as likely
(p=.001)
Computer Science 0.27 times as likely
(p=.001)
Civil Engineering 0.33 times as likely
(p=.014)
Computer Engineering .07 times as likely (p<.001)

Conference on Excellence in Gateway Course Completion April 2013

Conference on Excellence in Gateway Course Completion April 2013

Unanswered Questions Do the small N’s call into question significant findings in individual degree programs? Is there a relationship between a program’s level of math rigor and GRADUATE, SWITCH and STOP rates? Do these trends hold true at other institutions? To what extent are these numbers impacted by students who switch out of hard STEM and into other similar non-STEM programs (for instance, from Biology to Health Science)?

Conference on Excellence in Gateway Course Completion April 2013
THIS POPULATION OF
STEM STUDENTS
THE GENERAL
POPULATION OF
CREDIT-BEARING
STUDENTS FROM UNM
2011-12 FACTBOOK (Fall
2011)
ODDS RATIO (p-
value)
Percent American Indian 6.4% 5.5% 1.17 (.148)
Percent Asian/Pacific
Islander/Native Hawaiian 5.5% 3.5% 1.62 (< .001)
Percent Black/African
American 2.3% 2.6%
0.87 (.503)
Percent Hispanic 35.5% 37.0% 0.94 (.239)
Percent White, Non-
Hispanic 46.2% 42.4% 1.17 (.004)
Percent Male 62.3% 44.4% 2.08 (< .001)
Percent Female 37.7% 55.6% 0.48 (< .001)
SUBPOPULATIONS Ethnicities in Students Opting to Go Into STEM

Conference on Excellence in Gateway Course Completion April 2013
SUBPOPULATIONS Ethnicities in Degree Outcomes
American Indian STEM students are 2.55 times as likely to stop attending UNM (p<.001) and are 0.30 times as likely to graduate with STEM degrees (p<.001) as non-American Indian students.
MORE LIKELY
LESS LIKELY
ODDS RATIO P-VALUE
STOPPED 2.55 < .001
SHIFTED 0.80 .338
GRADUATED 0.30 < .001

Conference on Excellence in Gateway Course Completion April 2013
SUBPOPULATIONS Ethnicities in Degree Outcomes
Hispanic STEM students are .65 times as likely to graduate with STEM degrees than non-Hispanic students (p=.001).
LESS LIKELY
ODDS RATIO P-VALUE
STOPPED 1.17 .175
SHIFTED 1.03 .827
GRADUATED 0.65 .001

Conference on Excellence in Gateway Course Completion April 2013
SUBPOPULATIONS Ethnicities in Degree Outcomes
Black/African American STEM students are 1.96 times as likely to switch majors out of STEM than non-African American students (p=.001).
MORE LIKELY
ODDS RATIO P-VALUE
STOPPED 0.61 .341
SHIFTED 1.96 .055
GRADUATED 0.91 > .999
Conference on Excellence in Gateway Course Completion April 2013
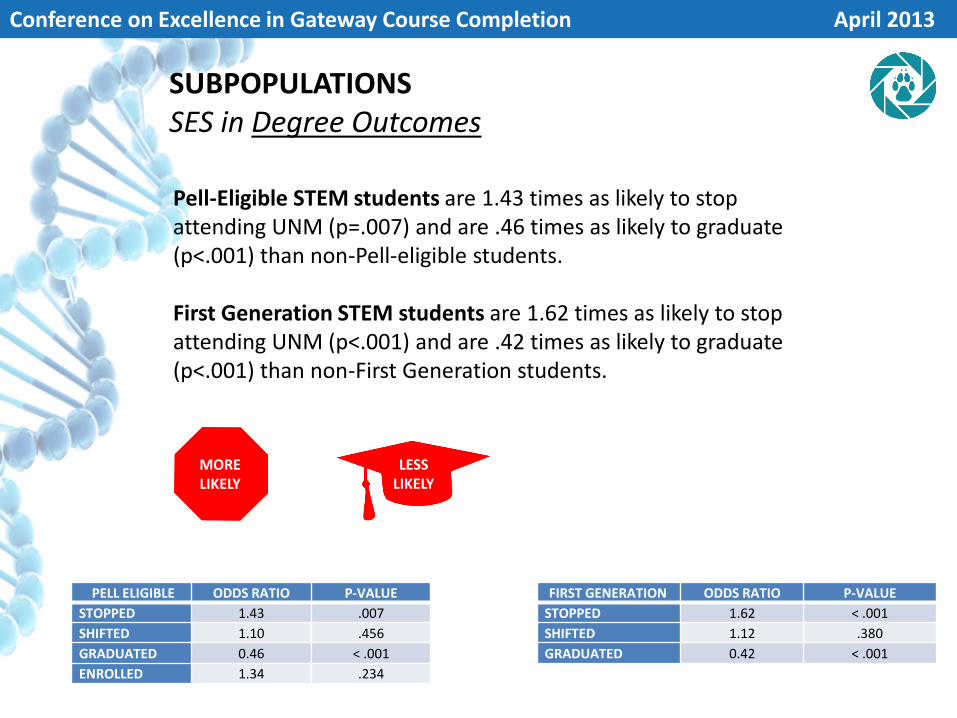
SUBPOPULATIONS SES in Degree Outcomes
Pell-Eligible STEM students are 1.43 times as likely to stop attending UNM (p=.007) and are .46 times as likely to graduate (p<.001) than non-Pell-eligible students. First Generation STEM students are 1.62 times as likely to stop attending UNM (p<.001) and are .42 times as likely to graduate (p<.001) than non-First Generation students.
MORE LIKELY
LESS LIKELY
PELL ELIGIBLE ODDS RATIO P-VALUE
STOPPED 1.43 .007
SHIFTED 1.10 .456
GRADUATED 0.46 < .001
ENROLLED 1.34 .234
FIRST GENERATION ODDS RATIO P-VALUE
STOPPED 1.62 < .001
SHIFTED 1.12 .380
GRADUATED 0.42 < .001

Conference on Excellence in Gateway Course Completion April 2013
SUBPOPULATIONS Gender in Degree Outcomes
Female STEM students are .48 times as likely to pursue STEM degrees (p,.001), and are 1.36 times as likely to switch majors out of STEM (p=.005) than male students.
MORE LIKELY
LESS LIKELY
ODDS RATIO P-VALUE
STOPPED 0.88 .294
SHIFTED 1.36 .005
GRADUATED 0.89 .406

Conference on Excellence in Gateway Course Completion April 2013

Conference on Excellence in Gateway Course Completion April 2013
SUBPOPULATIONS Gender in Degree Outcomes
White females are .69 times as likely to stop attending (p=.024), 1.34 times more likely to graduate (p=.069), 1.32 times as likely to switch majors out of STEM (p=.044) and .23 times as likely to still be enrolled as students who are not white females (p=.001) Non-white females are .63 times as likely to graduate as students who are not non-white females (p=.006).
MORE LIKELY
LESS LIKELY
MORE LIKELY
LESS LIKELY

Conference on Excellence in Gateway Course Completion April 2013
SUBPOPULATIONS Gender in Degree Outcomes
White males are 1.35 times as likely to graduate than students who are not white males (p=.029). Non-white males are .82 times as likely to shift out of STEM degrees (p=.086) and are 1.91 times as likely to still be enrolled than students who are not non-white males (p=.004).
MORE LIKELY
LESS LIKELY

Possible Implications UNM needs to do focus resources on recruiting women to STEM fields. UNM needs to provide resources to connect STEM academic and support to the faculty, staff and departments who most understand the needs of Hispanic, American Indian, African American, Low-income, First-generation and Female students.

Possible Implications UNM needs to improve instruction to better meet the learning needs of students who are Hispanic, American Indian, African American, Low-income, First-generation and Female.

Conference on Excellence in Gateway Course Completion April 2013
INSTITUTIONAL PRIORITY OF OUTCOMES
Graduate STEM
Switch Majors
Stop Attending

Conference on Excellence in Gateway Course Completion April 2013
PRIORITY OF OUTCOMES Variables
VARIABLE GRADUATE SHIFT STOP
Percent of this group
who are Pell Eligible 13.5% 23.6% 27.3%
Average of High School
GPAs within this group 3.75 3.45 3.27
Average of ACT
Composite scores
within this group
25.8 22.9 22.2
Average of ACT Math
scores within this group 26.3 22.8 22.0
Percent of this group
who are First
Generation
19.5% 34.2% 40.6%
Average of College
GPAs within this group 3.51 2.95 2.09

Conference on Excellence in Gateway Course Completion April 2013
PRIORITY OF OUTCOMES Variables
VARIABLE GRADUATE SHIFT STOP
Percent of students in
this group who
required remediation
12% 30.7% 39.5%
Percent of students in
this group who
required MATH
remediation
4.2% 18.2% 26.4%
Percentage of students
in this group who
received a Lottery
Scholarship
91% 77.5% 36.9%
Percentage of Lottery-
receiving students in
this group who lost
their Lottery
Scholarship
18.4% 28.7% 42.1%

PRIORITY OF OUTCOMES ACT Scores

Unanswered Questions None of these numbers are surprising, since they often appear in the literature. But how well do these factors, when combined to produce the most effective predictor, predict whether a student will graduate, shift or stop? Stated another way, how much of the variance in student outcomes can be related to these factors that UNM routinely collects and reports?

Conference on Excellence in Gateway Course Completion April 2013
TRIGGERPOINTS Number of Credits
The average number of credits completed when STEM students stop attending UNM is 38. The average number of credits completed when STEM students shift majors is 44.8. 15cr 30cr 45cr 60cr
Freshman Sophomores
STOPPED STUDENTS: 38
SHIFTED STUDENTS: 44.8

Conference on Excellence in Gateway Course Completion April 2013
TRIGGERPOINTS Number of Semesters
On average, STOPPED students leave UNM after 3.5 semesters. On average, SHIFTED students changed majors after 3.5 semesters, the same as for STOPPED students.
1 sem 2 sem 3 sem 4 sem Freshman Sophomores
STOPPED STUDENTS: 3.5
SHIFTED STUDENTS: 3.5

Possible Implications Students who SHIFT appear to be taking more credits per semester than students who STOP. Leaving STEM may be more related to the number of semesters completed than it is to the number of credits completed. If so, what are the implications?

Conference on Excellence in Gateway Course Completion April 2013
TRIGGERPOINTS Grade Point Average
On average, STOPPED students left UNM with an average cumulative GPA of 2.08. This is contrasted by SHIFTED students, who had an average 2.94 cumulative GPA when they changed majors.
2.09 2.95

Unanswered Questions Does this imply that students who leave UNM may be heavily impacted by academic performance issues, while SHIFTED students may be less impacted by poor grades and more impacted by other factors?

Conference on Excellence in Gateway Course Completion April 2013
PRELIMINARY FINDINGS COURSE OUTCOMES LENS

Conference on Excellence in Gateway Course Completion April 2013
GRADUATED SHIFTED STOPPED
Percentage of
enrollments in this
group that resulted
in an A, B or C
86.18 %
65.33%
(20.85 points lower
than GRADUATED)
54.36%
(31.82 points lower
than GRADUATED)
The “UNM Killer Course List” from Fall 2011 includes eighty two courses with high enrollments (121 and above) and low student pass rates. STEM Gateway studied the grade distribution patterns for the following sixteen STEM-based courses on this list: MATH 120, 121, 123, 150, 162, 163, 180, 181; ENVS 101; CHEM 121, 122, 301, 302; BIOL 201, 202; PHYC 160. Taken together, these courses represent a sizable portion of the gateway courses that STEM students complete en route to their degrees.
ALL THE WAY TO “A” Overview

Conference on Excellence in Gateway Course Completion April 2013
ALL THE WAY TO “A” Grade Distribution Patterns
Comparing GRADUATED to SHIFTED
A B C D F WD CR NCR ABC
Graduated 37.78 32.74 15.66 3.72 0.84 7.09 1.80 0.04 86.18
Shifted 15.19 26.05 24.09 10.88 4.73 15.68 1.55 1.60 65.33
Difference 22.59 6.69 -8.43 -7.16 -3.89 -8.58 0.25 -1.56 20.85
Comparing GRADUATED to SHIFTED
A B C D F WD CR NCR ABC
Graduated 37.78 32.74 15.66 3.72 0.84 7.09 1.80 0.04 86.18
Stopped 11.09 22.53 20.74 12.96 9.46 21.82 1.20 1.61 54.36
Difference 26.69 10.21 -5.08 -9.24 -8.61 -14.73 0.60 -1.58 31.82

Unanswered Questions How much of this difference in “A” grades is actually a function of other factors (pre-college preparation, ACT scores, etc)? How would this same pattern hold in non-STEM disciplines?

Possible Implications Colleges and universities often stress successful passing (A,B or C) as the desired course outcome for their students, and as a measure for their programs meeting student learning needs. However, in STEM, it may be more important to stress mastery (in this case, as measured by “A” percentage) over passing or course completion.
Conference on Excellence in Gateway Course Completion April 2013
COURSE CATEGORIES
SUBJECT N GRAD SHIFT STOP
PCT
Grad
PCT
Shift
PCT
Stop
All Courses 9540 3475 3558 1470 36.43% 37.30% 15.41%
All Math Courses 3440 854 1523 693 24.83% 44.27% 20.15%
All Pre-Calc Math
Courses 2044 309 1047 492 15.12% 51.22% 24.07%
All 100 Level Courses 7510 2451 2943 1288 32.64% 39.19% 17.15%
All <151 Level Courses 4359 1016 2016 878 23.31% 46.25% 20.14%
All 151-199 Level
Courses 3151 1435 927 410 45.54% 29.42% 13.01%
All 200+ Level Courses 2030 1024 615 182 50.44% 30.30% 8.97%
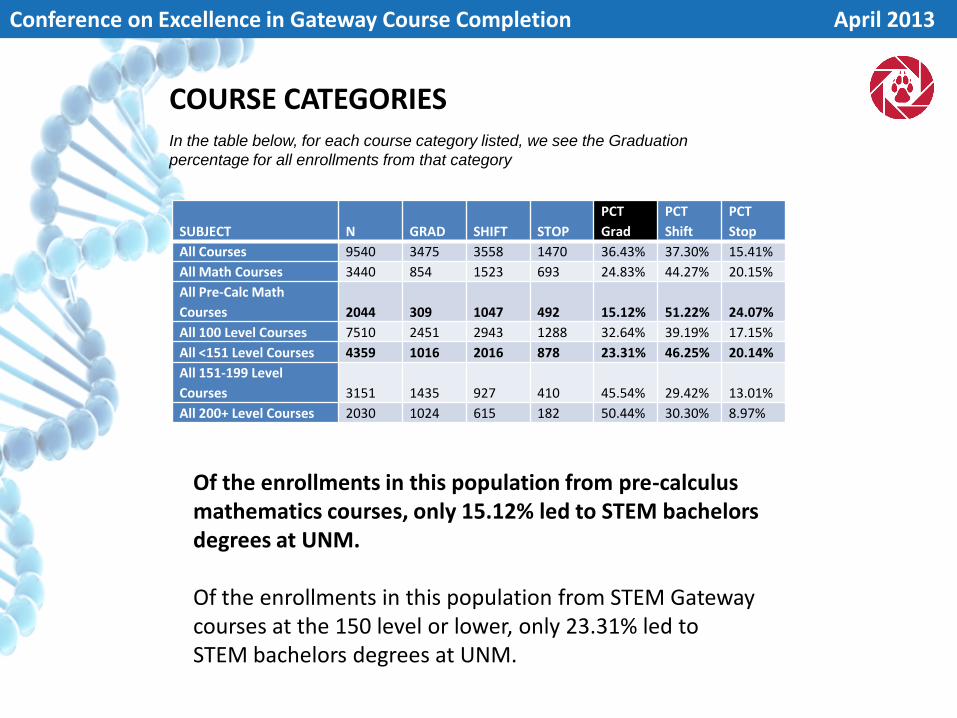
In the table below, for each course category listed, we see the Graduation
percentage for all enrollments from that category
Of the enrollments in this population from pre-calculus mathematics courses, only 15.12% led to STEM bachelors degrees at UNM. Of the enrollments in this population from STEM Gateway courses at the 150 level or lower, only 23.31% led to STEM bachelors degrees at UNM.

Possible Implications Resources and strategies for keeping students engaged in STEM should be focused on mathematics courses and first-year STEM courses.

Conference on Excellence in Gateway Course Completion April 2013
PRE-CALC MATH, ETHNICITY AND PELL-ELIGIBILITY The following tables show grade distribution patterns for enrollments in our population for the four primary pre-cal math courses: Intermediate Algebra, College Algebra, Trigonometry and Pre-Calculus Mathematics.

Pre-Calc Math, Ethnicity and Pell-Eligibility
MATH 120, Intermediate Algebra
Subpopulation N at end of semester
Pct “A” Pct “A-B-C-CR”
Hispanic 188 14.8 72.1
American Indian 45 8.9 50.0
Asian / Pacific Islander
18 5.3 73.8
Black / African American
18 16.7 72.2
White, Non-Hispanic
145 23.1 60.1
Pell-Eligible during first semester
136 17.3 67.2

Pre-Calc Math, Ethnicity and Pell-Eligibility
MATH 121, College Algebra
Subpopulation N at end of semester
Pct “A” Pct “A-B-C”
Hispanic 252 9.9 63.8
American Indian 41 7.7 59.6
Asian / Pacific Islander
29 18.9 67.5
Black / African American
16 31.6 57.9
White, Non-Hispanic
328 14.3 65.7
Pell-Eligible during first semester
198 13.8 63.0

Pre-Calc Math, Ethnicity and Pell-Eligibility
MATH 123, Trigonometry
Subpopulation N at end of semester
Pct “A” Pct “A-B-C”
Hispanic 131 13.2 57.2
American Indian 29 5.7 48.5
Asian / Pacific Islander
20 18.2 59.1
Black / African American
4 14.3 42.9
White, Non-Hispanic
198 18 61.2
Pell-Eligible during first semester
92 13.1 55.7

Pre-Calc Math, Ethnicity and Pell-Eligibility
MATH 150, Pre-Calc Math
Subpopulation N at end of semester
Pct “A” Pct “A-B-C”
Hispanic 184 12.2 53.0
American Indian 41 0.0 52.4
Asian / Pacific Islander
29 20.6 55.9
Black / African American
6 22.2 33.3
White, Non-Hispanic
231 14.7 62.5
Pell-Eligible during first semester
126 8.0 52.0

Pre-Calc Math, Ethnicity and Pell-Eligibility
40
45
50
55
60
65
70
75
80
M120 M121 M123 M150
Pct
Su
cce
ssfu
l
Math Courses
Hispanic
White, Non-Hispanic
Pell Eligible
Hispanic Range = 19.1
White, Non-Hispanic Range = 5.6
Pell Eligible Range = 15.2
Other ethnicities excluded from this chart because their “N” in one or more of these classes was too small to be considered conclusive.

Conference on Excellence in Gateway Course Completion April 2013
Unanswered Questions To what degree are Pell-eligibility and Hispanic ethnicity related? Why are Hispanic and Pell-eligible students decreasing in achievement as they proceed through the pre-calc math sequence? How do female students progress through pre-calc math and beyond?

Conference on Excellence in Gateway Course Completion April 2013
How do these preliminary findings relate to your institutions? What are the implications for this data for STEM education in general? What additional questions are raised by this research?
Discussion Questions

Conference on Excellence in Gateway Course Completion April 2013
TIM SCHROEDER Project Director STEM Gateway Program University of New Mexico [email protected] 505-277-1761 http://unmstemgateway.blogspot.com/ (RESEARCH Tab)


![Emergency Stop Switch [Pushubutton type] SG-E1 SERIES · Designation Pushbutton type emergency stop switch Item Series. SG-E1 . series Applicable standards. JIS C 8201-5-1, IEC 60947-5-1,](https://static.documents.pub/doc/80x56/5e1c82ba253af466582de9e9/emergency-stop-switch-pushubutton-type-sg-e1-series-designation-pushbutton-type.jpg)


