Page 1
© 2017 Electric Power Research Institute, Inc. All rights reserved.
Ben Kaun, Program Manager
Giovanni Damato, Senior Project Manager
CPUC/CEC Joint Workshop
November 2, 2017
10:00AM
StorageVET® Applications
and DemonstrationEnergy Storage Valuation Workshop
Page 2
2© 2017 Electric Power Research Institute, Inc. All rights reserved.
Today’s Workshop Objectives
1. Explain StorageVET® capabilities and methodology
2. Provide concrete illustrations of StorageVET to evaluate
energy storage project cost-effectiveness
3. Provide access and engagement instructions
4. Answer audience StorageVET questions and dive deeper
into issues of interest
Page 3
3© 2017 Electric Power Research Institute, Inc. All rights reserved.
Agenda
CEC Greeting - Mike Gravely, Energy Commission 10:00-10:05am
Meeting Objectives and EPRI Introduction - Ben Kaun, EPRI 10:05-10:15am
StorageVET® Introduction - Giovanni Damato, EPRI 10:15-10:30am
Use Case Analyses with StorageVET - Miles Evans, EPRI and
Ram Ravikumar, EPRI10:30-12:15pm
User Engagement - Giovanni Damato, EPRI and Udi Helman,
Helman Analytics12:15-12:30pm
Lunch 12:30-1:30pm
User Q&A and Advanced Training - Giovanni Damato, EPRI 1:30-3:00pm
Page 4
4© 2017 Electric Power Research Institute, Inc. All rights reserved.
StorageVET Use Cases—Sneak Peak
Page 5
5© 2017 Electric Power Research Institute, Inc. All rights reserved.
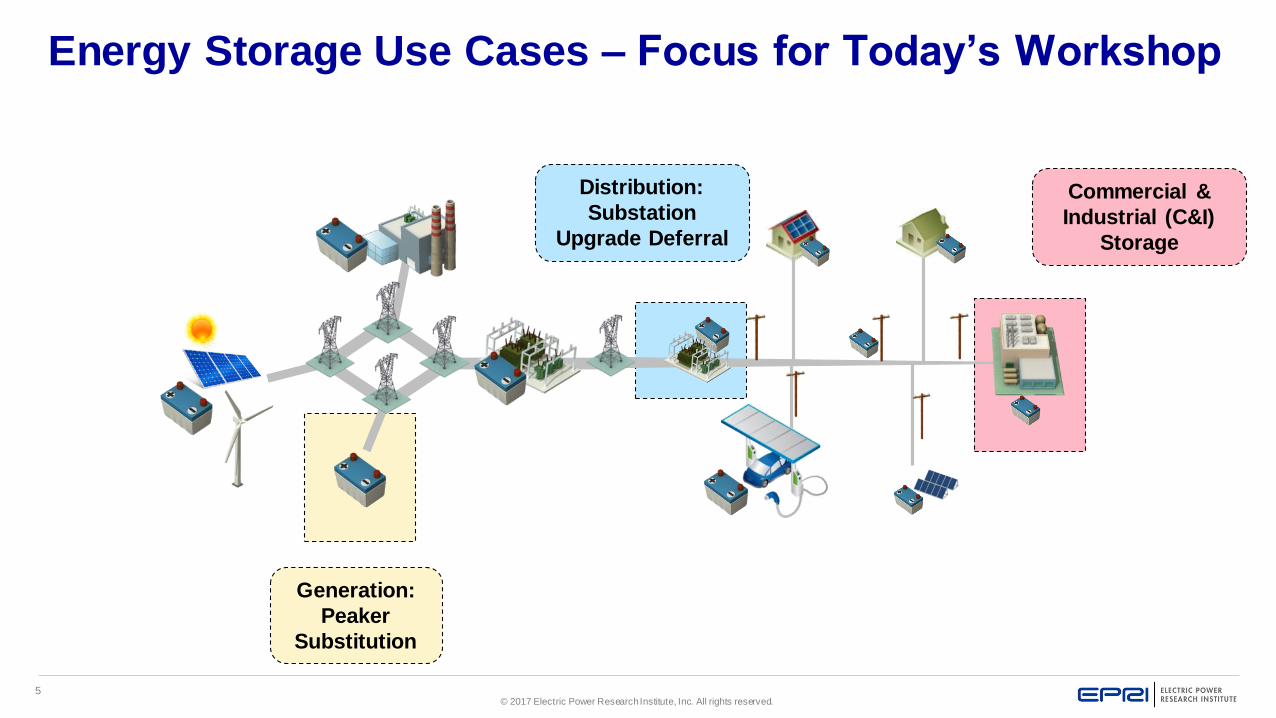
Energy Storage Use Cases – Focus for Today’s Workshop
Generation:
Peaker
Substitution
Distribution:
Substation
Upgrade Deferral
Commercial &
Industrial (C&I)
Storage
Page 6
6© 2017 Electric Power Research Institute, Inc. All rights reserved.
StorageVET Use Case Demos – Focus on Value Stacking
Peaker Substitution
• Gas Peaker Substitution
• Energy Storage vs Conventional Capacity Resources
• Capacity, frequency regulation, spinning reserves and energy time shift
C&I Storage
• Customer-sited Commercial & Industrial (C&I) Storage
• SGIP Incentive
• Sensitive to TOU rate structure, demand charges and load profile
T&D Deferral
• Distribution feeder with thermal violations due to load growth
• Substation deferral with market services with 20 years horizon
Page 7
7© 2017 Electric Power Research Institute, Inc. All rights reserved.
EPRI Energy Storage Program Overview
Page 8
8© 2017 Electric Power Research Institute, Inc. All rights reserved.
EPRI’s Public Benefit Mission
Advancing safe, reliable, affordable and environmentally
responsible electricity for society
through global collaboration, thought leadership
and science & technology innovation
Page 9
9© 2017 Electric Power Research Institute, Inc. All rights reserved.
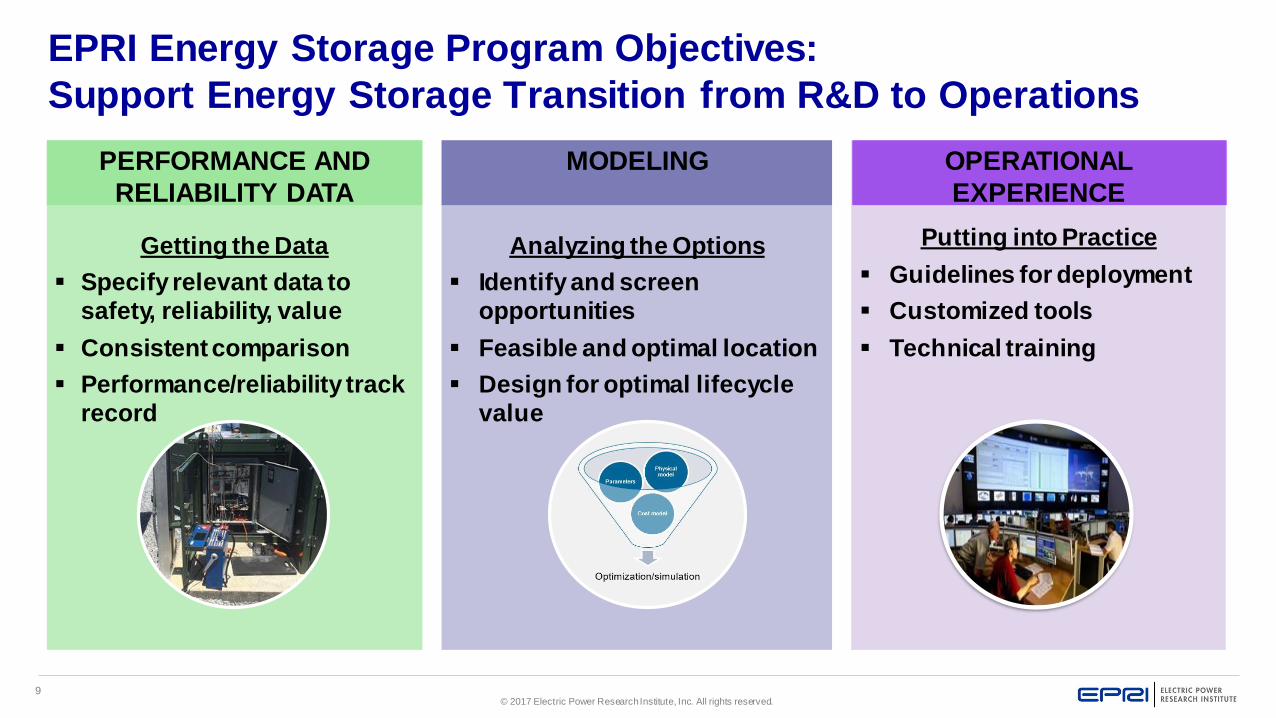
Getting the Data
Specify relevant data to
safety, reliability, value
Consistent comparison
Performance/reliability track
record
PERFORMANCE AND
RELIABILITY DATA
EPRI Energy Storage Program Objectives:
Support Energy Storage Transition from R&D to Operations
OPERATIONAL
EXPERIENCE
Putting into Practice
Guidelines for deployment
Customized tools
Technical training
Analyzing the Options
Identify and screen
opportunities
Feasible and optimal location
Design for optimal lifecycle
value
MODELING
Page 10
10© 2017 Electric Power Research Institute, Inc. All rights reserved.
More than Batteries: Facilitating Grid-Ready Energy Storage
Systems
Integrated Product
• Ensure safety and reliability
• Understand cost and performance
• Simplify procurement and operation through standardization of specification and interfaces
Storage Technology
• Explore technology tradeoffs
• Optimize technology for utilityapplications
Power Electronics
• Guide common functionsand control algorithms
• Ensure efficient and reliable operation
Project Deployment
• Establish best practices forsiting and permitting
• Standardize grid connection
• Communication and control
Communications and Control
• Developing operational anddispatch algorithms
• Updated communications and grid controllers to accommodate storage functions and services
Page 11
11© 2017 Electric Power Research Institute, Inc. All rights reserved.
Identify Gaps
Define Work Needed
Develop products together
Industry review
Publish / collect
experiences
Collaboratively Building Reference Tools through the
Energy Storage Integration Council (ESIC)
Started in 2013, >1000 participants from utilities, suppliers and research community
Seven (7) published products at ESIC
website: www.epri.com/esic
Page 12
12© 2017 Electric Power Research Institute, Inc. All rights reserved.
StorageVET Introduction
Page 13
13© 2017 Electric Power Research Institute, Inc. All rights reserved.
Challenges to Modeling Storage
Storage and limited energy resources are still not common
Rules and regulations still are evolving
Benefit stacking is appealing, but will it be possible
– More services = more value
– More services = more requirements Can they be satisfied?
Locational value of storage requires site-specific analysis
Complex optimization between storage degradation and service participation scheduling
Page 14
14© 2017 Electric Power Research Institute, Inc. All rights reserved.
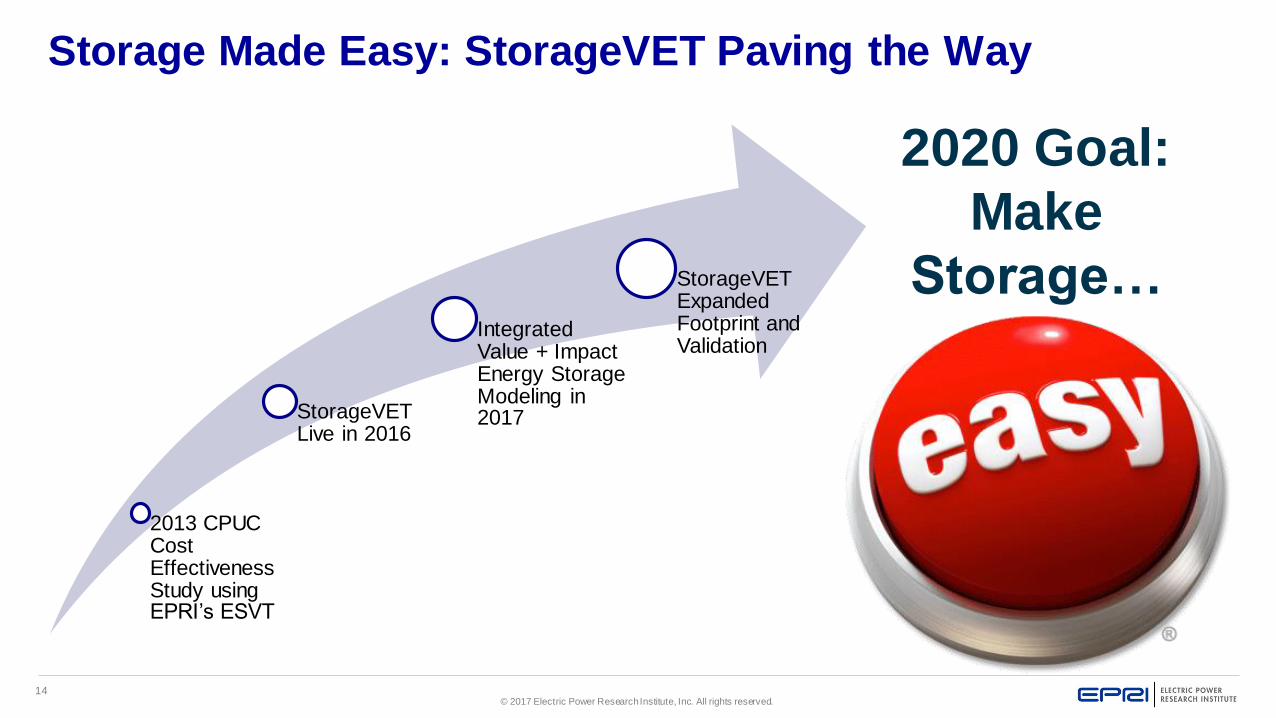
Storage Made Easy: StorageVET Paving the Way
2013 CPUC Cost Effectiveness Study using EPRI’s ESVT
StorageVET Live in 2016
Integrated Value + Impact Energy Storage Modeling in 2017
StorageVET Expanded Footprint and Validation
2020 Goal:
Make
Storage…
Page 15
15© 2017 Electric Power Research Institute, Inc. All rights reserved.
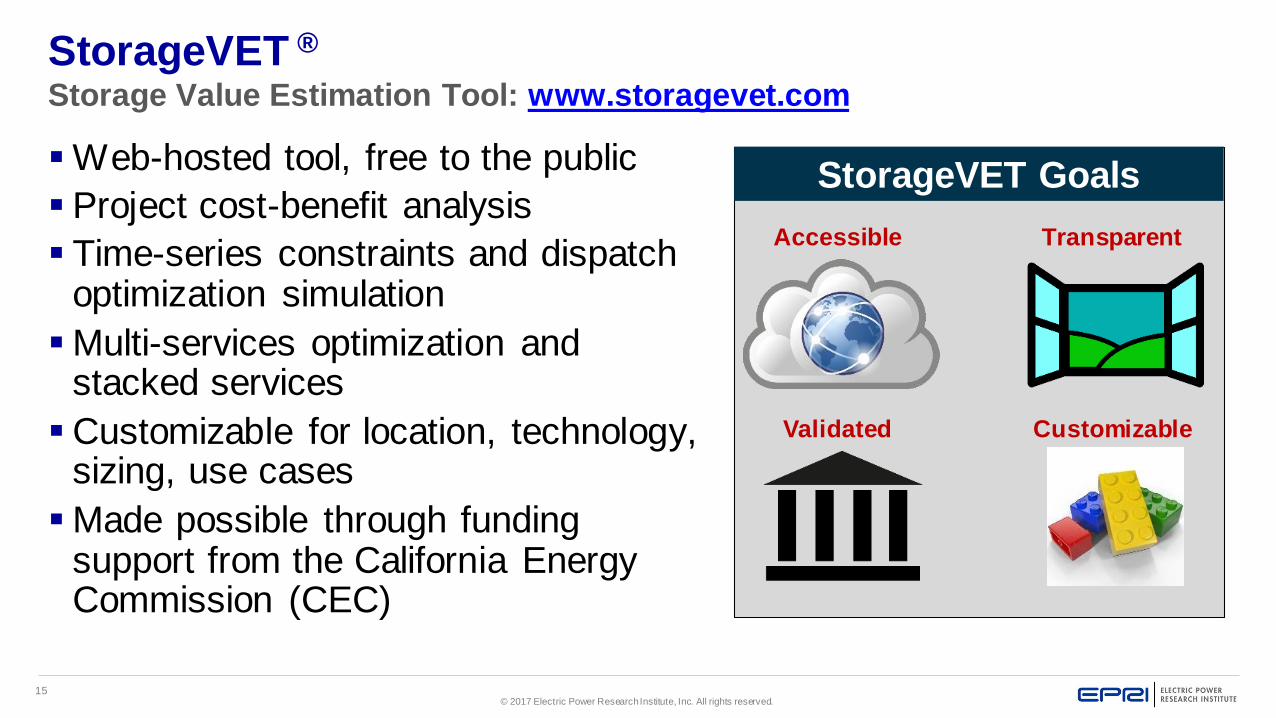
StorageVET ®
Storage Value Estimation Tool: www.storagevet.com
Web-hosted tool, free to the public
Project cost-benefit analysis
Time-series constraints and dispatch optimization simulation
Multi-services optimization and stacked services
Customizable for location, technology, sizing, use cases
Made possible through funding support from the California Energy Commission (CEC)
Accessible Transparent
Validated Customizable
StorageVET Goals
Page 16
16© 2017 Electric Power Research Institute, Inc. All rights reserved.
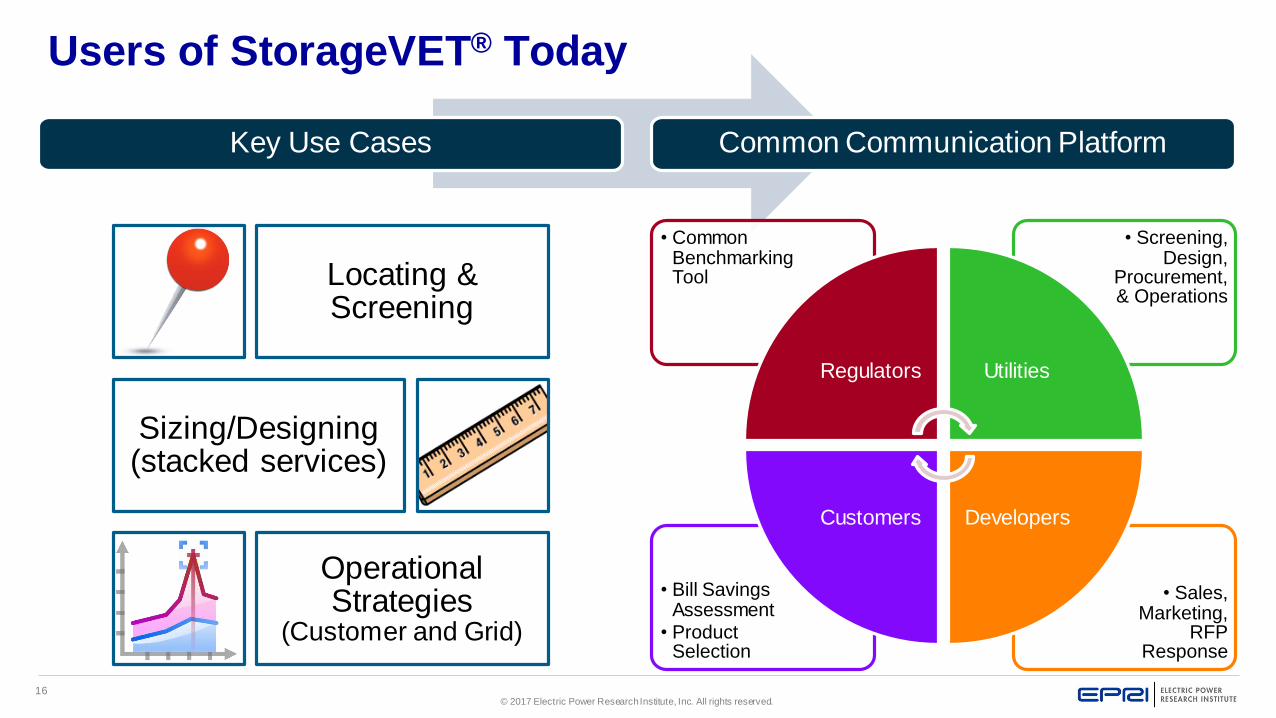
Users of StorageVET® Today
Locating & Screening
Sizing/Designing (stacked services)
Operational Strategies
(Customer and Grid)
Key Use Cases Common Communication Platform
• Sales, Marketing,
RFP Response
• Bill Savings Assessment
• Product Selection
• Screening, Design,
Procurement, & Operations
• Common Benchmarking Tool
Regulators Utilities
DevelopersCustomers
Page 17
17© 2017 Electric Power Research Institute, Inc. All rights reserved.
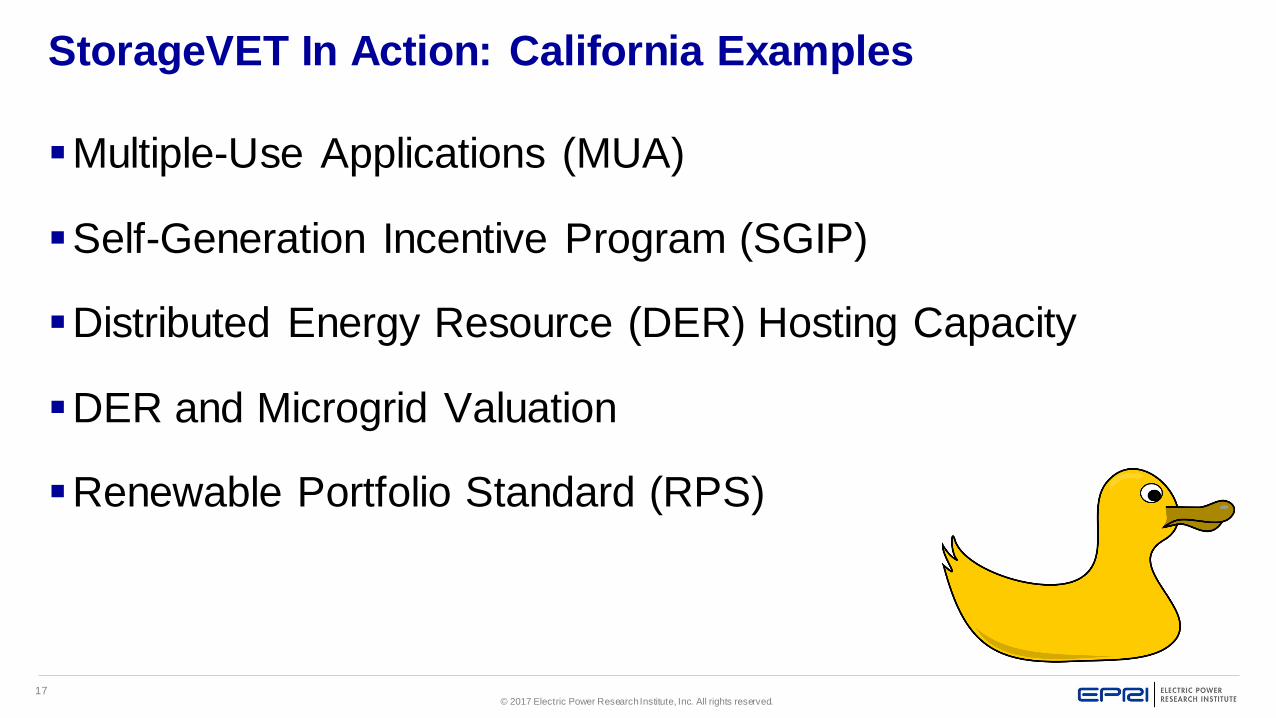
StorageVET In Action: California Examples
Multiple-Use Applications (MUA)
Self-Generation Incentive Program (SGIP)
Distributed Energy Resource (DER) Hosting Capacity
DER and Microgrid Valuation
Renewable Portfolio Standard (RPS)
Page 18
18© 2017 Electric Power Research Institute, Inc. All rights reserved.
Use Case Analyses with StorageVET
Miles Evans, EPRI
Ram Ravikumar, EPRI
Use Cases Are Illustrative Only, Do Not Cite
Page 19
© 2017 Electric Power Research Institute, Inc. All rights reserved.
How does a customer economically justify
storage?
Customer Storage
Page 20
20© 2017 Electric Power Research Institute, Inc. All rights reserved.
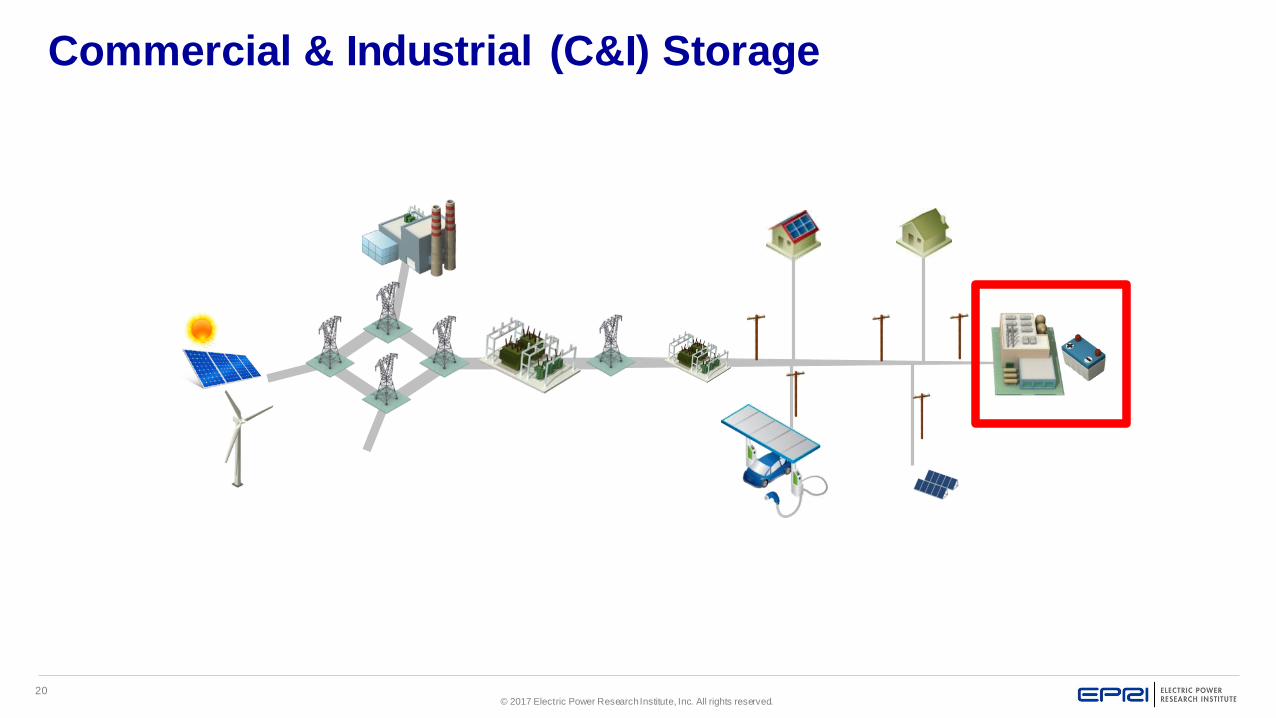
Commercial & Industrial (C&I) Storage
Page 21
21© 2017 Electric Power Research Institute, Inc. All rights reserved.
Customer-sited Services
Page 22
22© 2017 Electric Power Research Institute, Inc. All rights reserved.
Customer Storage - Introduction
Customer-sited energy storage for demand charge reduction
– Not performing energy time shift
– Reserve SOC because load uncertain
There are ‘soft’ reasons for customer-sited ES, including
corporate goals or maintaining a green image.
Page 23
23© 2017 Electric Power Research Institute, Inc. All rights reserved.
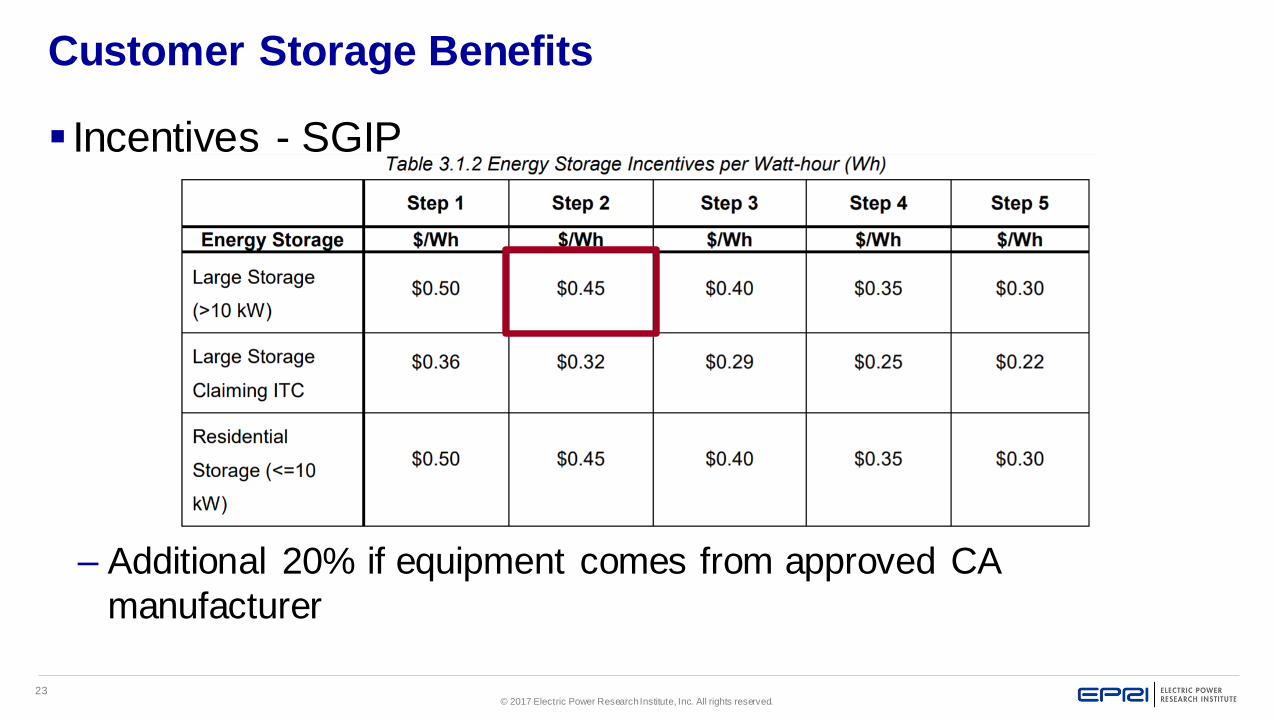
Customer Storage Benefits
Incentives - SGIP
– Additional 20% if equipment comes from approved CA
manufacturer
Page 24
24© 2017 Electric Power Research Institute, Inc. All rights reserved.
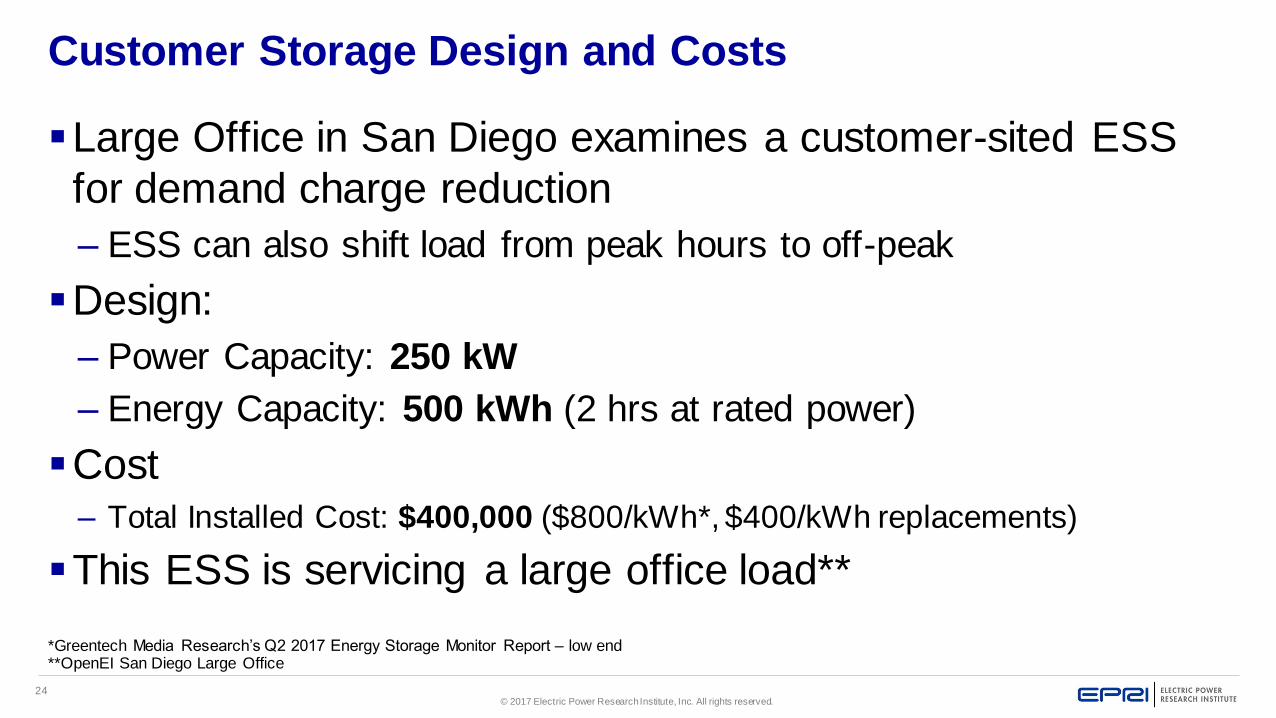
Customer Storage Design and Costs
Large Office in San Diego examines a customer-sited ESS
for demand charge reduction
– ESS can also shift load from peak hours to off-peak
Design:
– Power Capacity: 250 kW
– Energy Capacity: 500 kWh (2 hrs at rated power)
Cost– Total Installed Cost: $400,000 ($800/kWh*, $400/kWh replacements)
This ESS is servicing a large office load**
*Greentech Media Research’s Q2 2017 Energy Storage Monitor Report – low end**OpenEI San Diego Large Office
Page 25
25© 2017 Electric Power Research Institute, Inc. All rights reserved.
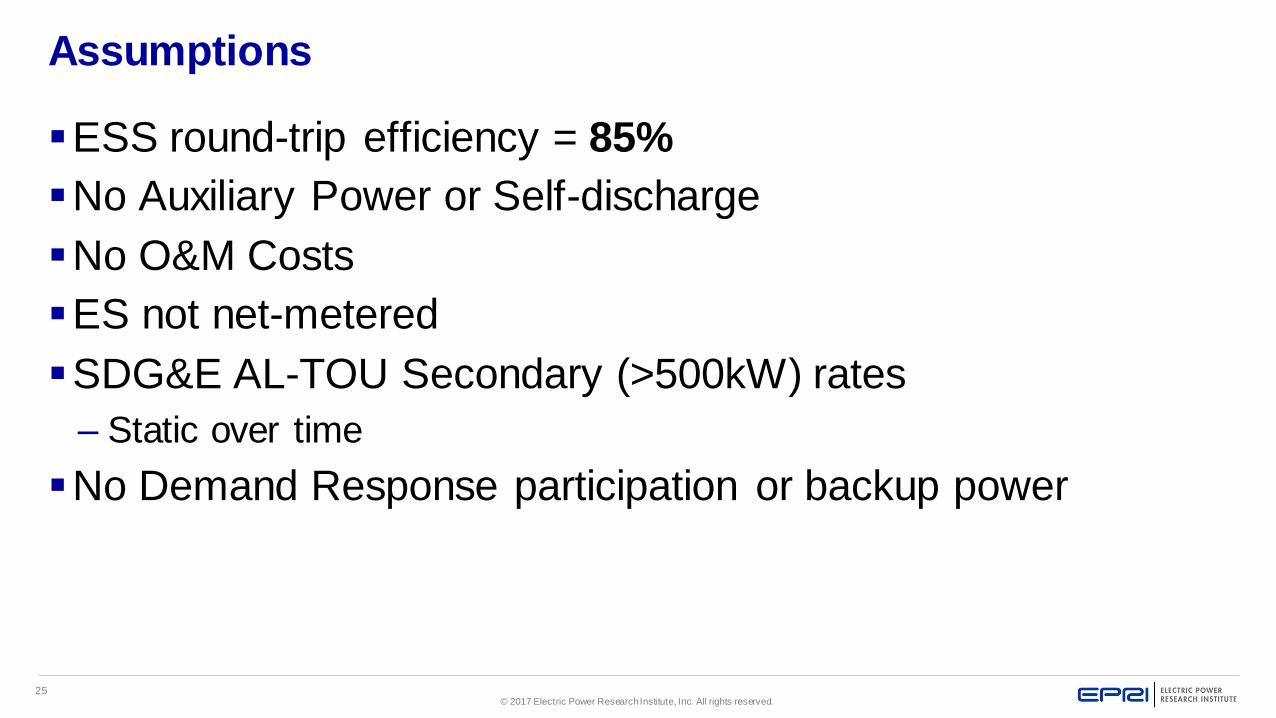
Assumptions
ESS round-trip efficiency = 85%
No Auxiliary Power or Self-discharge
No O&M Costs
ES not net-metered
SDG&E AL-TOU Secondary (>500kW) rates
– Static over time
No Demand Response participation or backup power
Page 26
26© 2017 Electric Power Research Institute, Inc. All rights reserved.
Demand Charges
Two additive monthly demand charges
– Facility demand charge (all times)
$24.51/kW
– On-peak demand charge
$21.13/kW summer
$7.57/kW winter
Flat fee of $465.74/mo
– Only $116.44/mo if load <500kW
– Edge case for energy storage here
Page 27
27© 2017 Electric Power Research Institute, Inc. All rights reserved.
Energy Charges
SDG&E AL-TOU Secondary
(>500kW) rates
Summer
𝑃𝑃𝑒𝑎𝑘 − 𝑃𝑂𝑓𝑓𝑝𝑒𝑎𝑘 = 4.059¢/kWh
Winter
𝑃𝑃𝑒𝑎𝑘 − 𝑃𝑜𝑓𝑓𝑝𝑒𝑎𝑘 = 3.697 ¢/kWh
These are enough to overcome
efficiency losses but maybe not
degradation losses
¢/kWh Winter SummerHour of Day Weekday Weekend Weekday Weekend
1
7.322
7.322
8.148
8.148
2
3
45
6
9.464
11.2337
8
9
12.207
10
11
12
13
14
15
16
11.233
17
11.01918
19
209.464
21
22
7.322 8.14823
24
Page 28
28© 2017 Electric Power Research Institute, Inc. All rights reserved.
Operational Results – StorageVET™
0
200
400
600
800
1000
1200
1400
1600
0 2000 4000 6000 8000
Load P
ow
er
(kW
)
Time (hrs)
Yearly Peak on Oct 6
Page 29
29© 2017 Electric Power Research Institute, Inc. All rights reserved.
Operational Results – StorageVET™
Image of peak day load profile before and after
0
200
400
600
800
1000
1200
1400
1600
0 20 40 60 80
Load P
ow
er
(kW
)
Time (hrs)
Original Peak Load
Modified Peak Load
This month, the battery saved $4615 in
demand charges
Page 30
30© 2017 Electric Power Research Institute, Inc. All rights reserved.
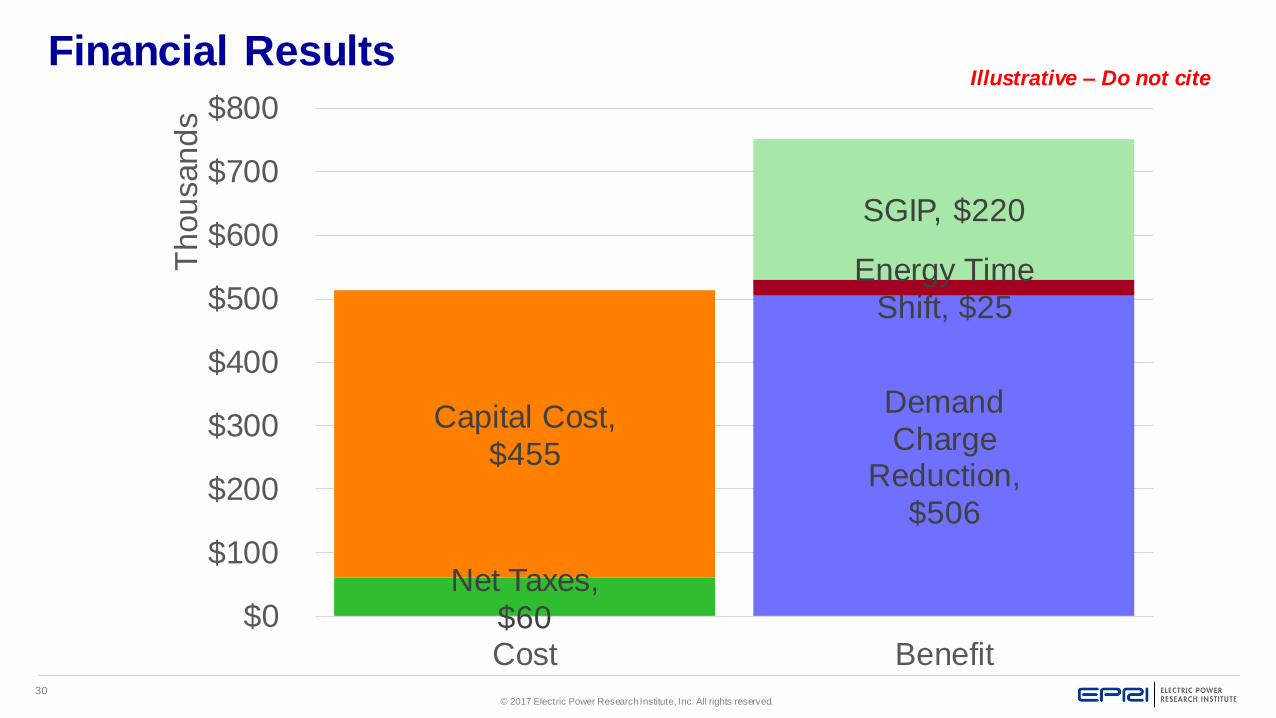
Financial Results
Demand Charge
Reduction, $506
Energy Time Shift, $25
Net Taxes, $60
SGIP, $220
Capital Cost, $455
$0
$100
$200
$300
$400
$500
$600
$700
$800
Cost Benefit
Th
ou
san
ds
Illustrative – Do not cite
Page 31
31© 2017 Electric Power Research Institute, Inc. All rights reserved.
Financial Results
ESS shifted enough load from peak hours to off-peak hours
to reduce energy charges by $26,880 over 10 years
– Dispatch not optimized against cycling degradation cost
– SOC not bounded
Break-even cost of storage:
$1,383/kWh
Page 32
32© 2017 Electric Power Research Institute, Inc. All rights reserved.
Financial Results
20% SOC
Reservation
No Energy Time
Shift
Demand Charge
Reduction, $457
Net Taxes,
$18
SGIP, $220
Capital Cost, $455
$0
$100
$200
$300
$400
$500
$600
$700
$800
Cost Benefit
Th
ou
san
ds
Illustrative – Do not cite
Page 33
33© 2017 Electric Power Research Institute, Inc. All rights reserved.
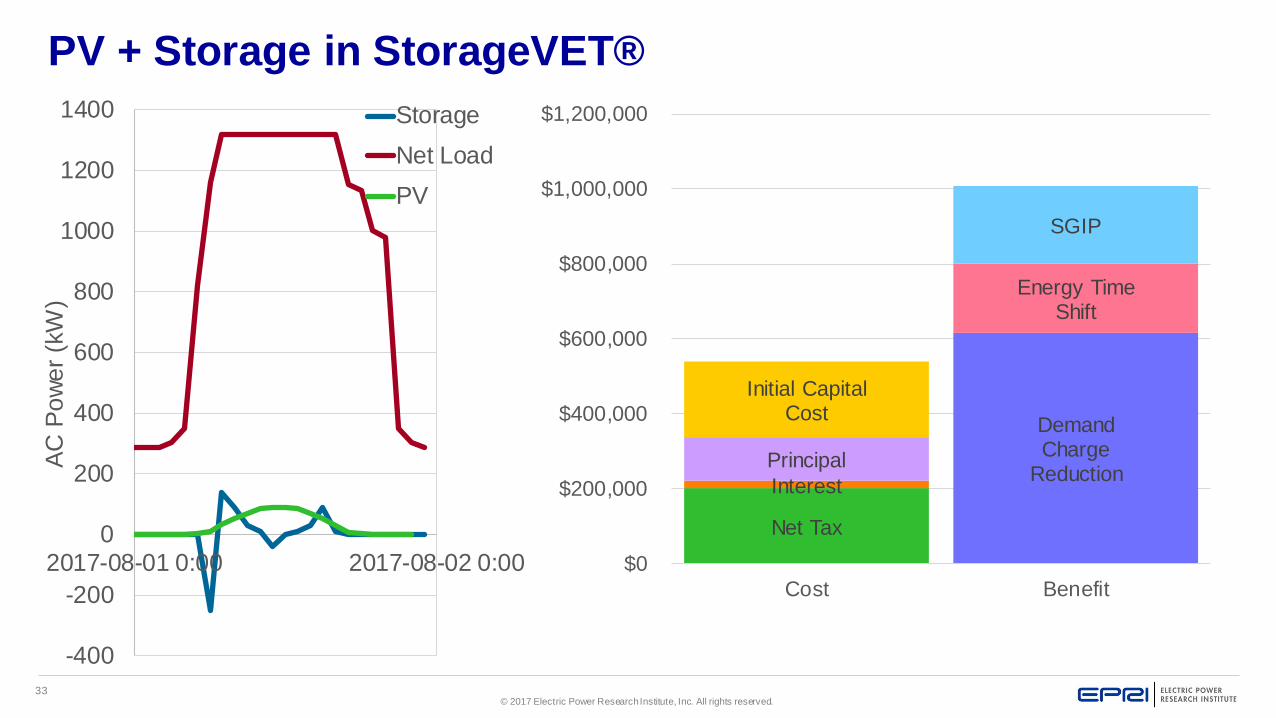
PV + Storage in StorageVET®
Demand Charge
Reduction
Energy Time Shift
Net Tax
Interest
Principal
Initial Capital Cost
SGIP
$0
$200,000
$400,000
$600,000
$800,000
$1,000,000
$1,200,000
Cost Benefit
-400
-200
0
200
400
600
800
1000
1200
1400
2017-08-01 0:00 2017-08-02 0:00
AC
Po
we
r (k
W)
Storage
Net Load
PV
Page 34
© 2017 Electric Power Research Institute, Inc. All rights reserved.
Does the benefit of deferring an upgrade
outweigh the cost of energy storage?
Substation Upgrade
Deferral
Page 35
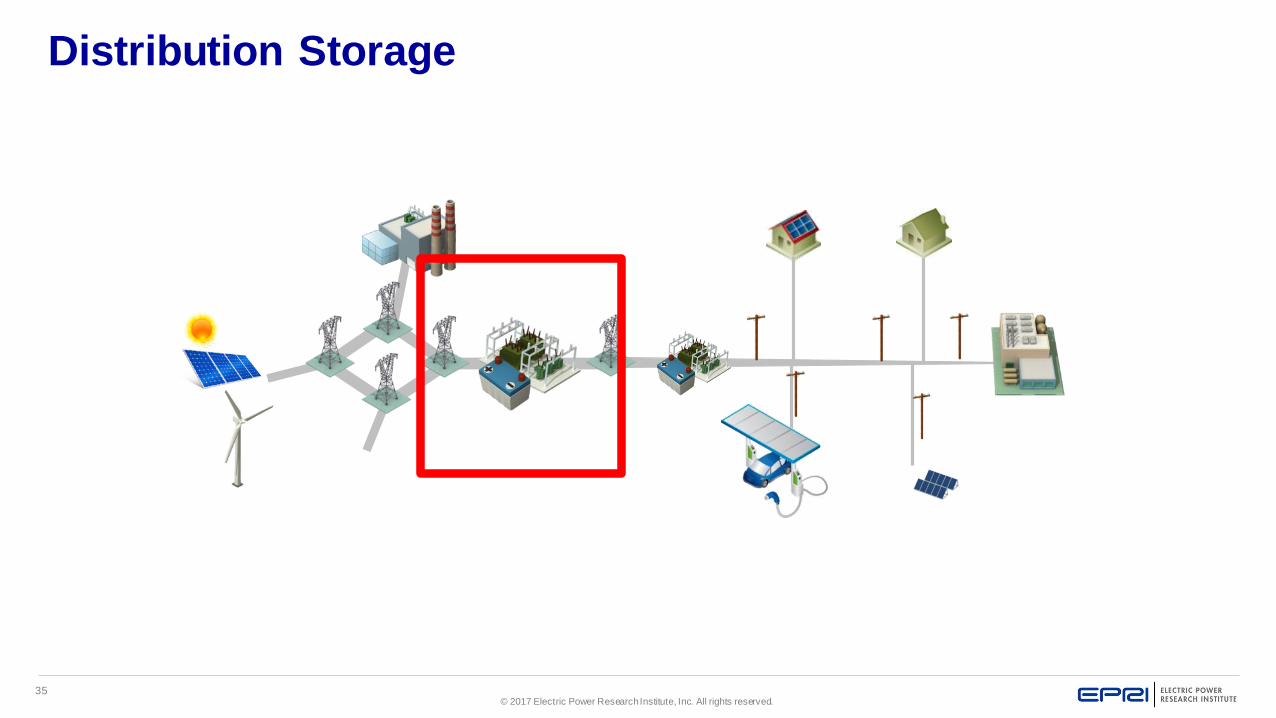
35© 2017 Electric Power Research Institute, Inc. All rights reserved.
Distribution Storage
Page 36
36© 2017 Electric Power Research Institute, Inc. All rights reserved.
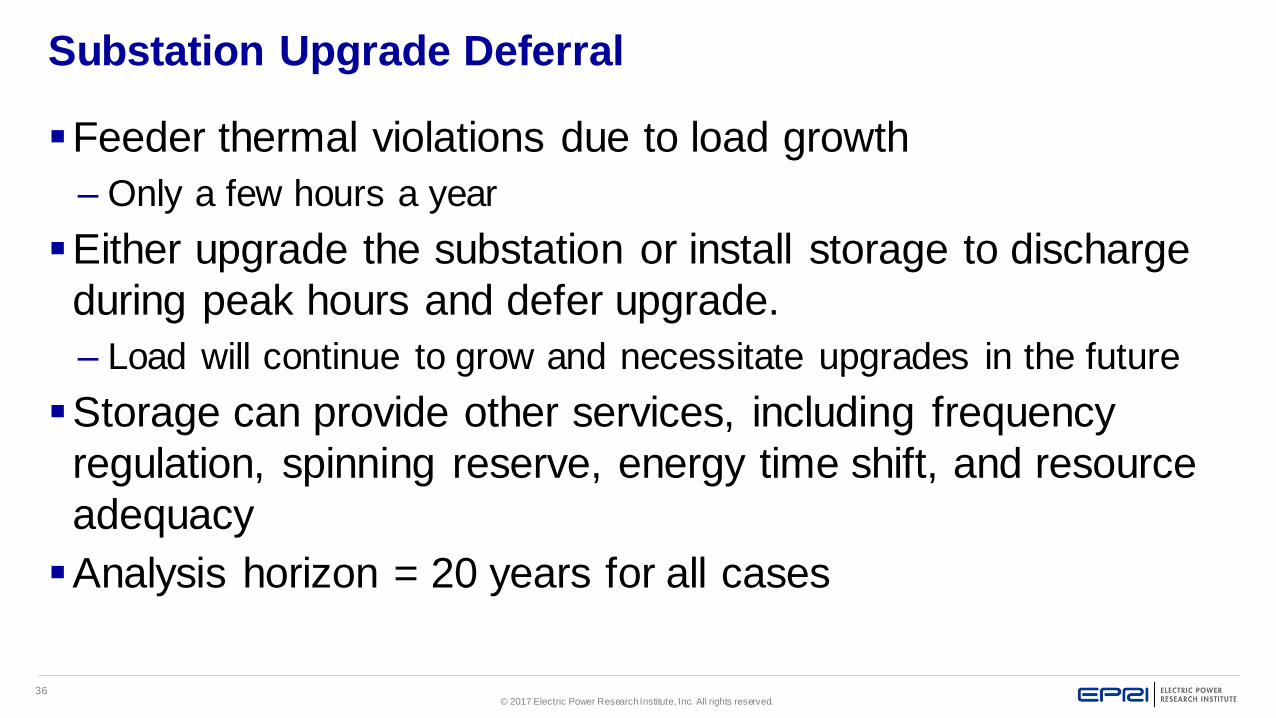
Substation Upgrade Deferral
Feeder thermal violations due to load growth
– Only a few hours a year
Either upgrade the substation or install storage to discharge
during peak hours and defer upgrade.
– Load will continue to grow and necessitate upgrades in the future
Storage can provide other services, including frequency
regulation, spinning reserve, energy time shift, and resource
adequacy
Analysis horizon = 20 years for all cases
Page 37
37© 2017 Electric Power Research Institute, Inc. All rights reserved.
Substation Upgrade Deferral
0
2
4
6
8
10
12
14
16
0 1000 2000 3000 4000 5000 6000 7000 8000 9000
Pow
er
(MW
)
Hour of Year
2022 Feeder Load
Thermal Limit
Page 38
38© 2017 Electric Power Research Institute, Inc. All rights reserved.
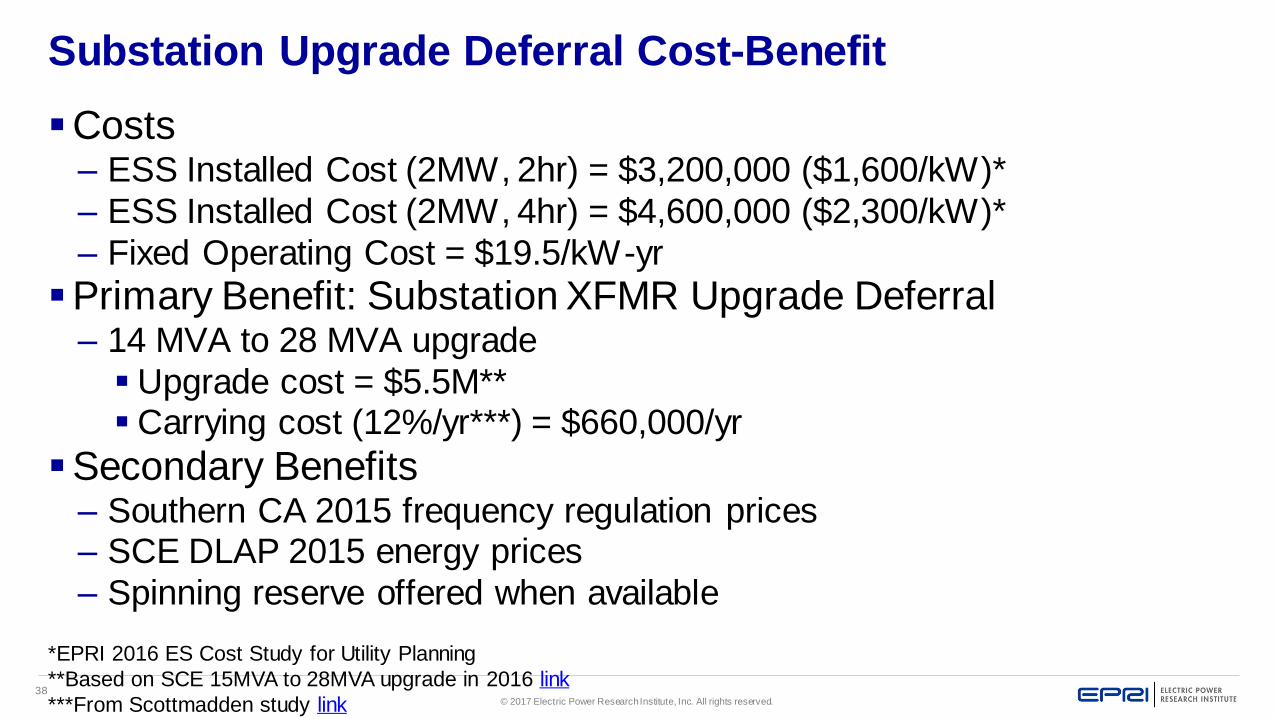
Substation Upgrade Deferral Cost-Benefit
Costs– ESS Installed Cost (2MW, 2hr) = $3,200,000 ($1,600/kW)*
– ESS Installed Cost (2MW, 4hr) = $4,600,000 ($2,300/kW)*
– Fixed Operating Cost = $19.5/kW-yr
Primary Benefit: Substation XFMR Upgrade Deferral– 14 MVA to 28 MVA upgrade
Upgrade cost = $5.5M**Carrying cost (12%/yr***) = $660,000/yr
Secondary Benefits– Southern CA 2015 frequency regulation prices– SCE DLAP 2015 energy prices
– Spinning reserve offered when available
*EPRI 2016 ES Cost Study for Utility Planning
**Based on SCE 15MVA to 28MVA upgrade in 2016 link
***From Scottmadden study link
Page 39
39© 2017 Electric Power Research Institute, Inc. All rights reserved.
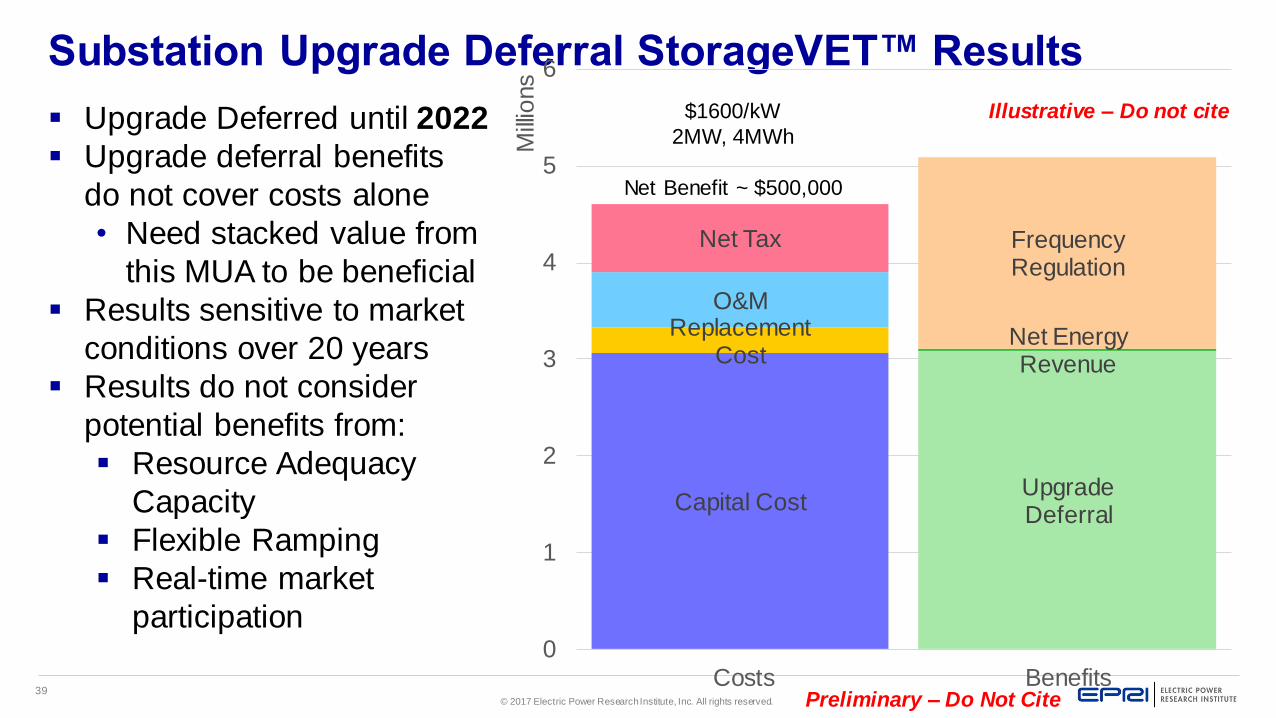
Substation Upgrade Deferral StorageVET™ Results
Preliminary – Do Not Cite
Illustrative – Do not cite Upgrade Deferred until 2022
Upgrade deferral benefits
do not cover costs alone
• Need stacked value from
this MUA to be beneficial
Results sensitive to market
conditions over 20 years
Results do not consider
potential benefits from:
Resource Adequacy
Capacity
Flexible Ramping
Real-time market
participation
Upgrade Deferral
Net Energy Revenue
Frequency Regulation
Capital Cost
Replacement Cost
O&M
Net Tax
0
1
2
3
4
5
6
Costs Benefits
Mill
ions
$1600/kW
2MW, 4MWh
Net Benefit ~ $500,000
Page 40
40© 2017 Electric Power Research Institute, Inc. All rights reserved.
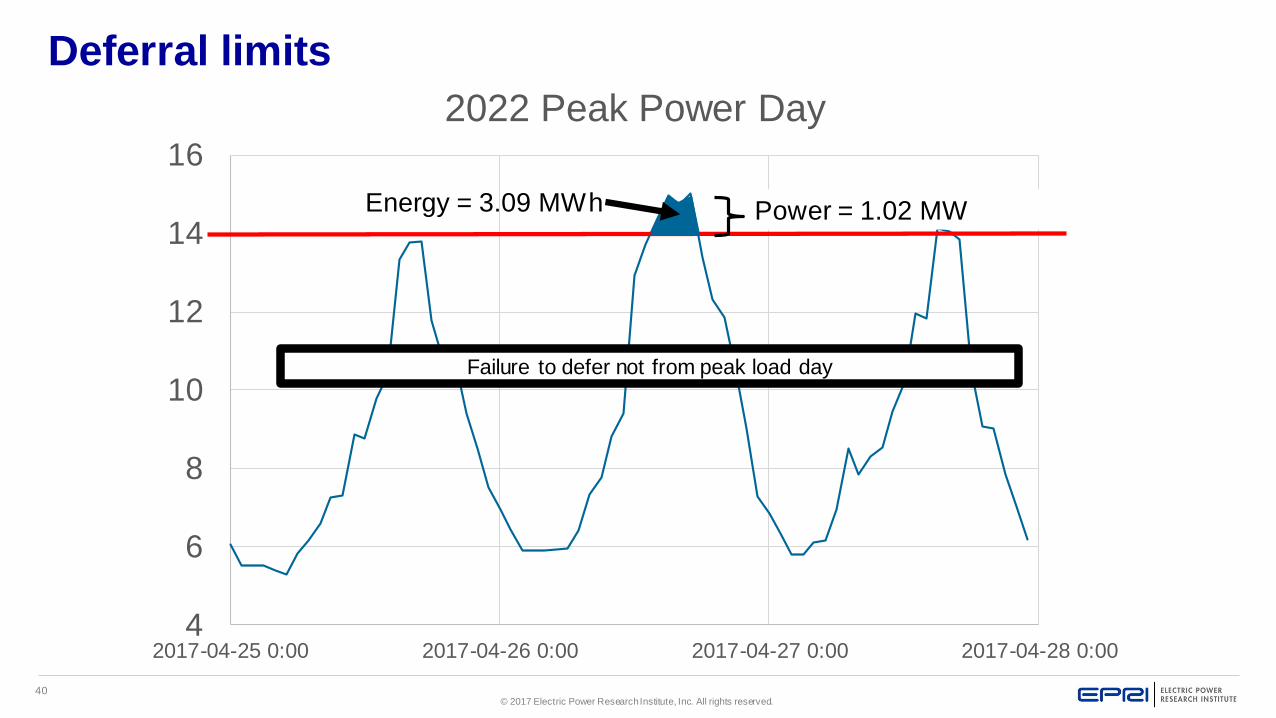
Deferral limits
4
6
8
10
12
14
16
2017-04-25 0:00 2017-04-26 0:00 2017-04-27 0:00 2017-04-28 0:00
2022 Peak Power Day
Power = 1.02 MWEnergy = 3.09 MWh
Failure to defer not from peak load day
Page 41
41© 2017 Electric Power Research Institute, Inc. All rights reserved.
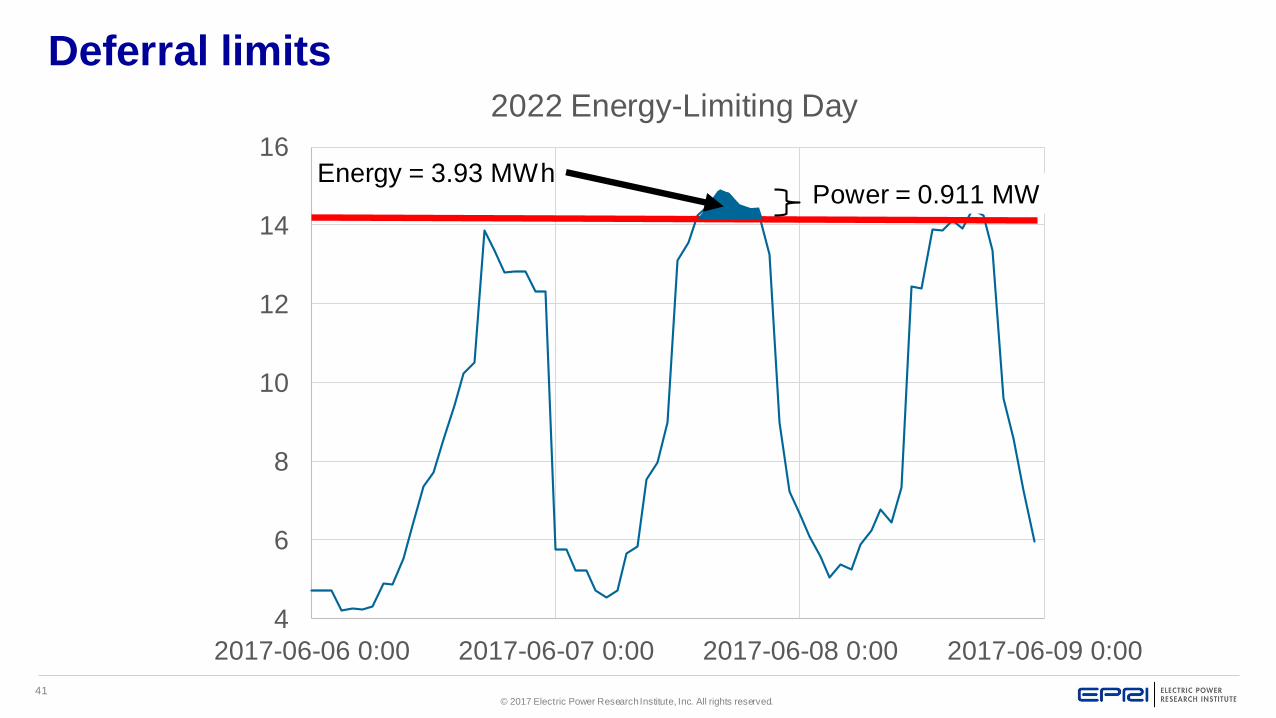
Deferral limits
4
6
8
10
12
14
16
2017-06-06 0:00 2017-06-07 0:00 2017-06-08 0:00 2017-06-09 0:00
2022 Energy-Limiting Day
Power = 0.911 MWEnergy = 3.93 MWh
Page 42
42© 2017 Electric Power Research Institute, Inc. All rights reserved.
Deferral with 4hr Energy Storage
Preliminary – Do Not Cite
Illustrative – Do not cite
Upgrade Deferral
Frequency Regulation
Capital Cost
Replacement Cost
O&M
Net Tax
-1
0
1
2
3
4
5
6
7
8
Costs Benefits
Mill
ions
$2300/kW
2MW, 8MWh
Net Benefit ~ $1M
Upgrade deferred from
2017 to 2030
Higher costs due to larger
ESS and more
replacements over 20 years
Page 43
43© 2017 Electric Power Research Institute, Inc. All rights reserved.
Substation Upgrade Deferral Conclusions
In this example, storage needs stacked benefits to break
even
– Can provide flexible ramping, RTM participation, primary frequency
response, and resource adequacy capacity (all not considered)
Batteries have small footprint, so can be added to already-
owned property relatively easily
– Need to decide on how to prioritize land
– ESSs have the potential to be moved, but not often done in practice
Page 44
© 2017 Electric Power Research Institute, Inc. All rights reserved.
What is the net cost of resource adequacy from
energy storage?
Peaker Substitution
Economics Example
Page 45
45© 2017 Electric Power Research Institute, Inc. All rights reserved.
Generation: Standalone Storage
Page 46
46© 2017 Electric Power Research Institute, Inc. All rights reserved.
Resource Adequacy Services
Page 47
47© 2017 Electric Power Research Institute, Inc. All rights reserved.
Peaker Substitution – Overview and Illustrative Economic
Case
Primary service: resource adequacy
Secondary services: frequency regulation, spinning reserves, and energy time shift
Alamitos Energy Storage– Economic 100MW peaker substitution with grid
services contracted in LA Basin
Aliso Canyon gas leak caused emergency resource adequacy problem, due to peaking gas delivery constraint– 6 month development vs years for CT if it were
an option
Tesla Battery in Southern California
Page 48
48© 2017 Electric Power Research Institute, Inc. All rights reserved.
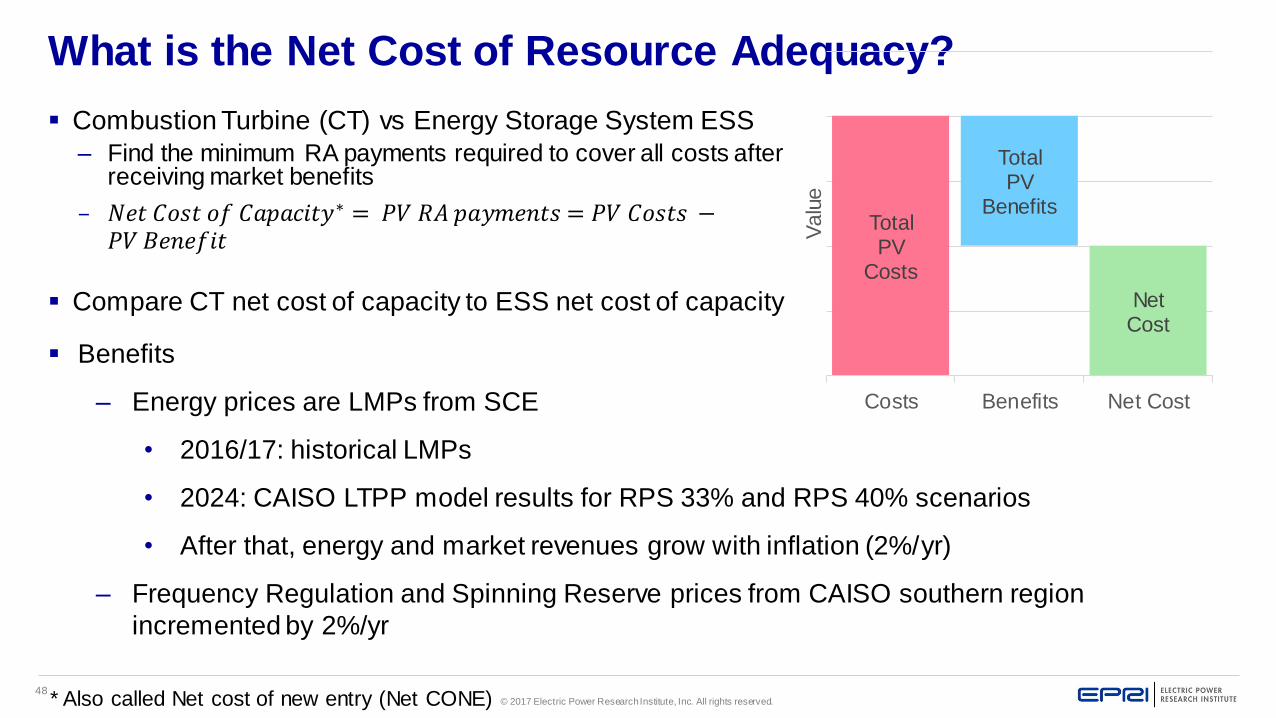
What is the Net Cost of Resource Adequacy?
Combustion Turbine (CT) vs Energy Storage System ESS
– Find the minimum RA payments required to cover all costs after receiving market benefits
– 𝑁𝑒𝑡 𝐶𝑜𝑠𝑡 𝑜𝑓 𝐶𝑎𝑝𝑎𝑐𝑖𝑡𝑦∗ = 𝑃𝑉 𝑅𝐴 𝑝𝑎𝑦𝑚𝑒𝑛𝑡𝑠 = 𝑃𝑉 𝐶𝑜𝑠𝑡𝑠 −𝑃𝑉 𝐵𝑒𝑛𝑒𝑓𝑖𝑡
Compare CT net cost of capacity to ESS net cost of capacity
* Also called Net cost of new entry (Net CONE)
Total PV
Costs
Total PV
Benefits
Net Cost
Costs Benefits Net Cost
Valu
e
Benefits
– Energy prices are LMPs from SCE
• 2016/17: historical LMPs
• 2024: CAISO LTPP model results for RPS 33% and RPS 40% scenarios
• After that, energy and market revenues grow with inflation (2%/yr)
– Frequency Regulation and Spinning Reserve prices from CAISO southern region
incremented by 2%/yr
Page 49
49© 2017 Electric Power Research Institute, Inc. All rights reserved.
Costs
Battery Costs (100MW, 400MWh)
– $1600/kW – $2700/kW Installed Cost*
– $250/kWh Replacement Cost
– 1.5% per year Fixed Operating Costs
CT Costs (100MW) – based on GE LMS100PA
– $1305/kW Installed Cost **
– 0.9% per year Fixed Operating Costs
– $5.9/MWh Variable Operating Costs***
– Historical fuel prices (not important due to low capacity factor)
*EPRI 2016 ES Cost Study for Utility Planning low and high end **CEC 2017 Estimated Cost of New Renewable and Fossil Generation in California***Reciprocating Internal Combustion Engine Study: 2016 Review. EPRI, Palo Alto, CA: 2016. 3002008269.
Page 50
50© 2017 Electric Power Research Institute, Inc. All rights reserved.
Dispatch Requirements
In StorageVET® ESS and CT dispatch based on energy and
ancillary services prices
ES is free to co-optimize services other than RA
CT can provide energy, frequency regulation, and spinning
reserves when profitable to turn on (~1.5% capacity factor)
Page 51
51© 2017 Electric Power Research Institute, Inc. All rights reserved.
Standalone Peaker Substitution Economics (StorageVET)Assumes 3rd Party Developer-Owned Business Model
Preliminary – Do Not Cite
Net Cost of Resource Adequacy
Net Energy Revenue
Frequency Regulation
O&MO&M
Net Tax
Net Tax
Interest
Interest
Principal
Principal
Initial Capital Expenses
Initial Capital Expenses
Replacement Expenses
$-
$50.00
$100.00
$150.00
$200.00
$250.00
$300.00
$350.00
ESS Cost ESS Benefit ESS Net Cost CT Net Cost CT Benefit CT Cost
Mill
ions
2016/17: Historical Energy and Ancillary Services Prices
2024: CAISO’s LTPP RPS 33% Model Projections EPRI 2016 ES Cost Study For Utility Planning High-End ES Prices
Net cost of resource adequacy
comparison for high-cost ESS vs CT
Page 52
52© 2017 Electric Power Research Institute, Inc. All rights reserved.
Standalone Peaker Substitution Economics (StorageVET)Assumes 3rd Party Developer-Owned Business Model
Illustrative – Do not cite
Net Cost of Resource Adequacy
Net Energy Revenue
Frequency Regulation
O&M
Net Tax
Interest
Principal
Initial Capital Expenses
Replacement Expenses
CT Net Cost
$-
$50.00
$100.00
$150.00
$200.00
$250.00
ESS Cost ESS Benefit ESS Net Cost
Mill
ions
Lower net cost of
resource adequacy
capacity due to low ESS
costs
Page 53
53© 2017 Electric Power Research Institute, Inc. All rights reserved.
Net Cost of Capacity Sensitivity to Renewable Penetration
-10
10
30
50
70
90
110
130
2016Incremented
33% RPS 40% RPS RPS 33%(min=0)
RPS 40%(min=0)
Ne
t C
ost o
f C
apa
city (
$/k
W-y
r)
Low ESS Cost High ESS Cost CT Net Cost
Net Profit,
Not Cost
Illustrative – Do not citeNet cost of capacity
decreases under higher
renewables scenario
Net cost of capacity
increases when
negative prices are
eliminated
Page 54
54© 2017 Electric Power Research Institute, Inc. All rights reserved.
Peaker Substitution - Conclusions
In this example, the net cost of resource adequacy between storage and CT is in the same range but,
– Need to normalize for capacity contribution of each resource
Thermal derating is well-established for fossil generators
Duration derating for energy storage is an under investigation.
Other considerations for battery storage– Fast development timeline
– No gas or water connections
– No emissions
– However, unproven durability
– Participation in real-time market and flexible ramping
Page 55
55© 2017 Electric Power Research Institute, Inc. All rights reserved.
StorageVET User Engagement
Giovanni Damato, EPRI
Udi Helman, Helman Analytics
Page 56
56© 2017 Electric Power Research Institute, Inc. All rights reserved.
Becoming a StorageVET User
Visit www.storagevet.com for the latest user information
Send an email with subject “StorageVET Account Setup Request”
to [email protected] and [email protected]
Include the following in the email body:
– Name
– Title
– Organization
– Address: Street, City, State, Zip
– Company Email
– Phone xxx-xxx-xxxx
Receive email response within 3-5 business days from Analytica Cloud Player
[email protected] with subject “Invitation to Analytica Cloud Player”
Page 57
57© 2017 Electric Power Research Institute, Inc. All rights reserved.
Engage with the StorageVET® Community
Create a StorageVET® account and build your model
– Visit www.storagevet.com
Browse through User Guides and documents for assistance
– Visit www.storagevet.com/documentation
Engage in ESIC User Community
– Email [email protected] with your information
Give feedback on your models during ESIC StorageVET® Online and
In-person meetings
– ESIC In-person Meeting November 16th Cleveland, OH
Join ESIC Subgroup Validation Efforts, led by industry partners
Research collaborative
Page 58
58© 2017 Electric Power Research Institute, Inc. All rights reserved.
ESIC StorageVET Validation
Giovanni Damato, EPRI
Udi Helman, Helman Analytics
Page 59
59© 2017 Electric Power Research Institute, Inc. All rights reserved.
Methodology
1. Check StorageVET solutions for different applications
2. Compare model results to other commercial and research
models
3. Compare model results to operational results from
perspective of ISOs and project operators
4. Modify model algorithms as necessary or provide additional
data to adjust results
5. Update StorageVET documentation
Page 60
60© 2017 Electric Power Research Institute, Inc. All rights reserved.
General approach
Start from more simple and proceed to more complex
– Energy arbitrage (day-ahead)
– Regulation only (CAISO NGR-REM; other ISO Regulation only models)
– Energy + Regulation co-optimized (CAISO NGR)
– Energy + Regulation + Spinning Reserve co-optimized (CAISO NGR)
– Same as above with generic and flexible RA capacity obligations
(CPUC/CAISO capacity obligations in day-ahead market)
– Real-time energy and ramping reserves
Once the wholesale market applications have been evaluated,
address distribution-connected, customer-sited, and multiple use
applications
Page 61
61© 2017 Electric Power Research Institute, Inc. All rights reserved.
Why model historical market revenues?
Accurate historical day-ahead and real-time market prices
and market value are a baseline for future price and value
projections
Users can validate model results using historical prices
against actual revenues of operating projects
However, historical revenues are not necessarily a guide to
future value due to rapidly changing system conditions
Page 62
62© 2017 Electric Power Research Institute, Inc. All rights reserved.
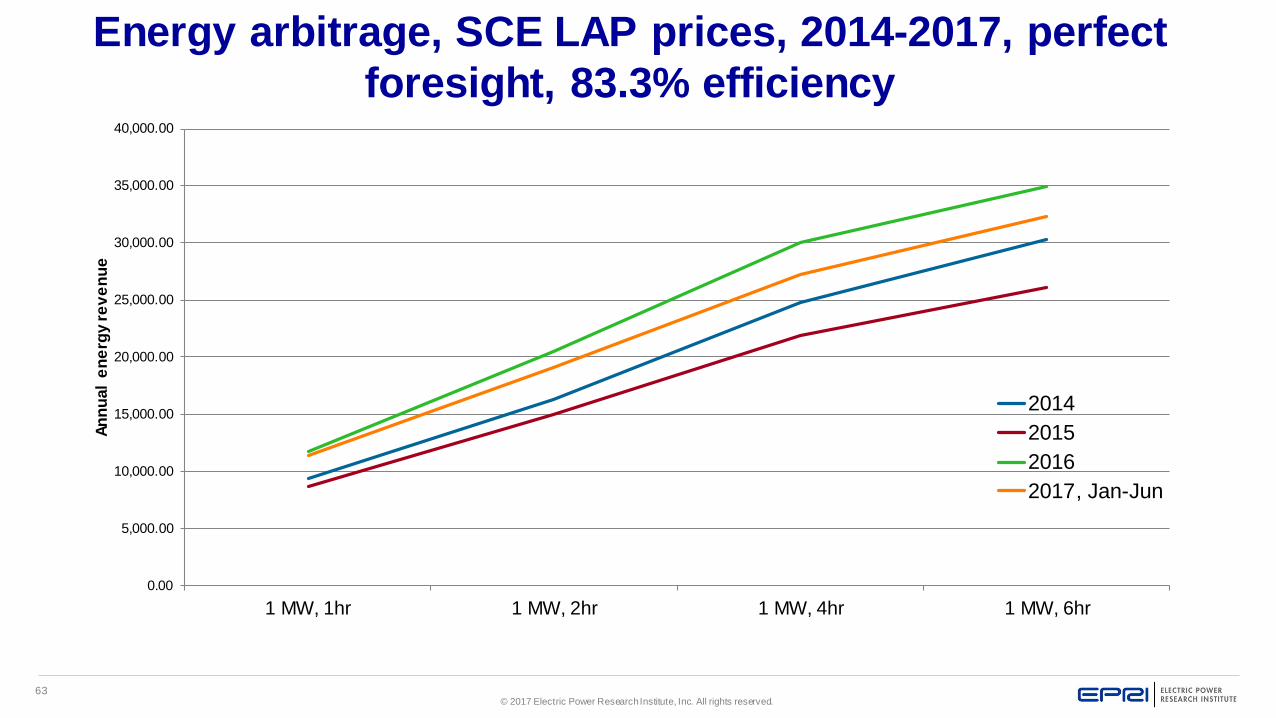
Energy arbitrage, SCE LAP prices, 2014-2017, perfect
foresight, 83.3% efficiency
System
Specifications
2014 Revenue
2015
Revenue
2016
Revenue
2017
Revenue,
Jan. – June
1 MW, 1 hr $9,363 $8,616 $11,746 $11,354
1 MW, 2 hr $16,257 $14,972 $20,472 $19,113
1 MW, 4 hr $24,808 $21,939 $30,026 $27,151
1 MW, 6 hr $30,229 $26,072 $34,946 $32,281
Page 63
63© 2017 Electric Power Research Institute, Inc. All rights reserved.
Energy arbitrage, SCE LAP prices, 2014-2017, perfect
foresight, 83.3% efficiency
0.00
5,000.00
10,000.00
15,000.00
20,000.00
25,000.00
30,000.00
35,000.00
40,000.00
1 MW, 1hr 1 MW, 2hr 1 MW, 4hr 1 MW, 6hr
An
nu
al
en
erg
y re
ve
nu
e
2014
2015
2016
2017, Jan-Jun
Page 64
64© 2017 Electric Power Research Institute, Inc. All rights reserved.
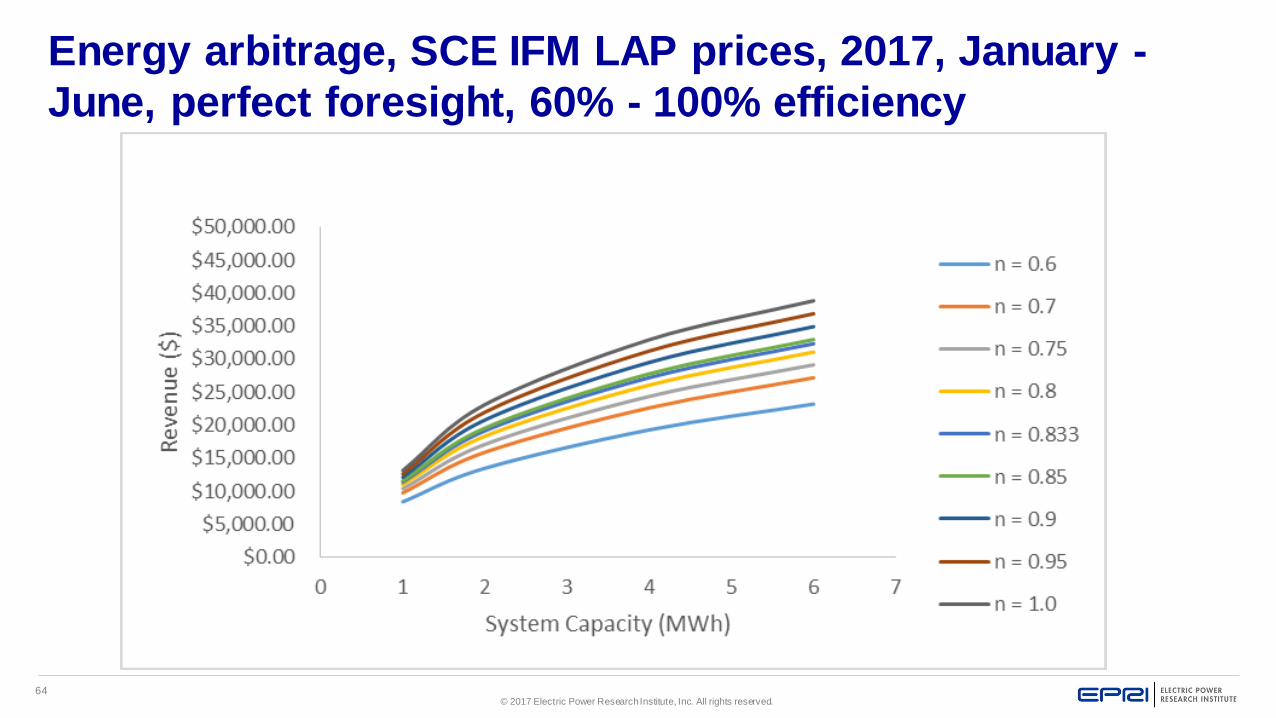
Energy arbitrage, SCE IFM LAP prices, 2017, January -
June, perfect foresight, 60% - 100% efficiency
Page 65
65© 2017 Electric Power Research Institute, Inc. All rights reserved.
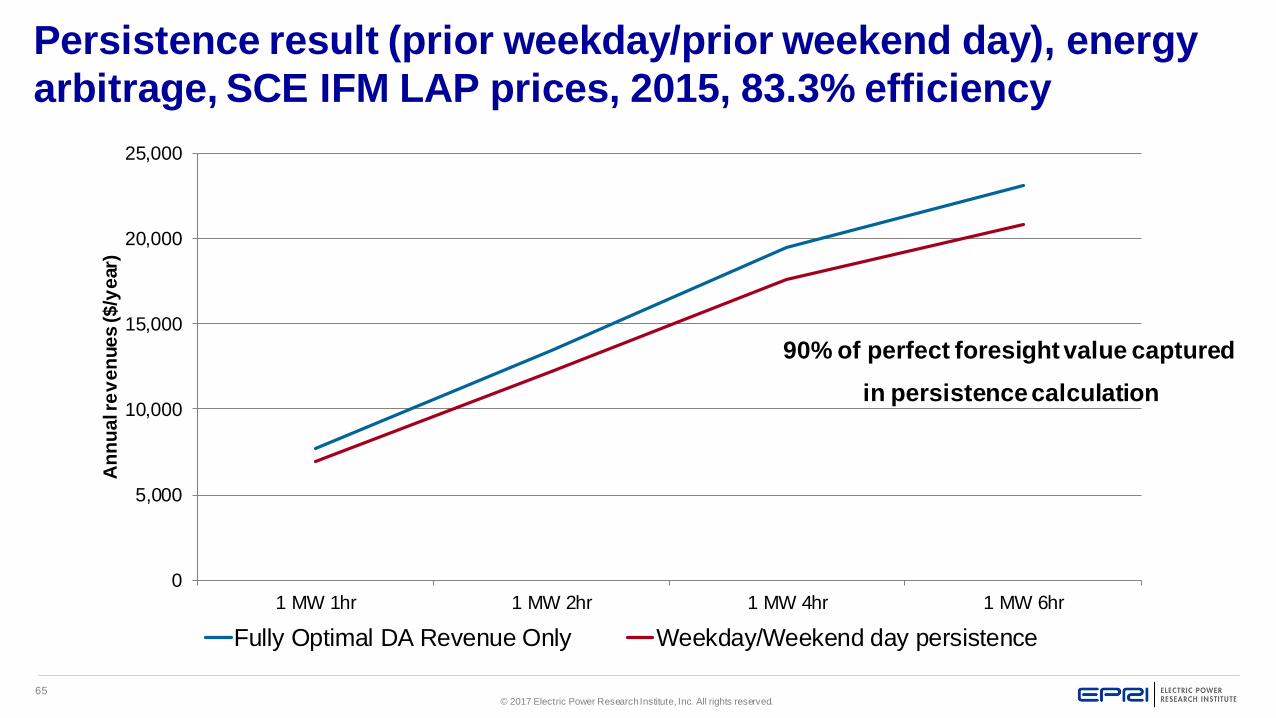
Persistence result (prior weekday/prior weekend day), energy
arbitrage, SCE IFM LAP prices, 2015, 83.3% efficiency
0
5,000
10,000
15,000
20,000
25,000
1 MW 1hr 1 MW 2hr 1 MW 4hr 1 MW 6hr
An
nu
al r
ev
en
ue
s ($
/ye
ar)
Fully Optimal DA Revenue Only Weekday/Weekend day persistence
90% of perfect foresight value captured
in persistence calculation
Page 66
66© 2017 Electric Power Research Institute, Inc. All rights reserved.
All results are available on the ESIC collaboration site
All inputs and outputs shown on prior slides are now
available on ESIC collaboration site:
https://collab.epri.com/esic
Review and comparison to your own results are requested
Page 67
© 2017 Electric Power Research Institute, Inc. All rights reserved.
12:30-1:30PM
Lunch
Page 68
© 2017 Electric Power Research Institute, Inc. All rights reserved.
1:30-3:00PM
User Q&A and Advanced
Training Session
Page 69
69© 2017 Electric Power Research Institute, Inc. All rights reserved.
Together…Shaping the Future of Electricity