67
Storing CO 2 and Producing Domestic Crude Oil with Next Generation CO 2 -EOR Technology: An Update April 30, 2010 DOE/NETL- 2010/1417
Storing CO2 and Producing Domestic Crude Oil with Next Generation CO2-EOR Technology: An Update April 30, 2010
DOE/NETL- 2010/1417

Disclaimer This report was prepared as an account of work sponsored by an agency of the United States Government. Neither the United States Government nor any agency thereof, nor any of their employees, makes any warranty, express or implied, or assumes any legal liability or responsibility for the accuracy, completeness, or usefulness of any information, apparatus, product, or process disclosed, or represents that its use would not infringe privately owned rights. Reference therein to any specific commercial product, process, or service by trade name, trademark, manufacturer, or otherwise does not necessarily constitute or imply its endorsement, recommendation, or favoring by the United States Government or any agency thereof. The views and opinions of authors expressed therein do not necessarily state or reflect those of the United States Government or any agency thereof.

STORING CO2 AND PRODUCING DOMESTIC CRUDE OIL WITH NEXT GENERATION CO2-EOR
TECHNOLOGY
DOE/NETL- 2010/1417
FINAL REPORT April 30, 2010
NETL Contact: Donald Remson
General Engineer Office of Systems, Analyses and Planning
National Energy Technology Laboratory www.netl.doe.gov

This page intentionally left blank

Storing CO2 and Producing Domestic Crude Oil with Next Generation CO2-EOR Technology
I
Table of Contents TABLE OF CONTENTS .............................................................................................................. I LIST OF FIGURES ..................................................................................................................... II LIST OF TABLES ...................................................................................................................... III 1. EXECUTIVE SUMMARY....................................................................................................1 2. BACKGROUND ....................................................................................................................5
2.1 UPDATED RESERVOIR AND ECONOMICS DATA .................................................................5 2.2 STUDY METHODOLOGY ....................................................................................................5 2.3 REPORT OUTLINE ..............................................................................................................7
3. THE DOMESTIC OIL RESOURCE BASE .......................................................................8 4. DETAILED DISCUSSION OF CO2-EOR ........................................................................12
4.1 USING CO2-EOR TO RECOVER “STRANDED” OIL ..........................................................12 4.2 CURRENT CO2-EOR ACTIVITY AND PRODUCTION .........................................................13 4.3 PERFORMANCE OF CURRENT CO2-EOR TECHNOLOGY ...................................................15
4.3.1 Barriers to Improved CO2-EOR Performance ...........................................................15 4.3.2 Evolution in CO2 Flooding Practices ........................................................................19
4.4 “NEXT GENERATION” CO2-EOR TECHNOLOGY .............................................................23 4.4.1 Overview of Next Generation Technology Performance ...........................................23
4.5 EXAMINING THE COSTS AND BENEFITS OF USING “NEXT GENERATION” EOR CO2
TECHNOLOGY .............................................................................................................................25 5. TECHNICALLY RECOVERABLE RESOURCES FROM “NEXT GENERATION” CO2-EOR OPERATIONS ...........................................................................................................28 6. ECONOMICALLY RECOVERABLE RESOURCES ....................................................30
6.1 PERSPECTIVE ON CO2-EOR ECONOMICS ........................................................................30 6.2 ECONOMICALLY RECOVERABLE RESOURCES: BASE CASE ..............................................30 6.3 ECONOMICALLY RECOVERABLE RESOURCES: SENSITIVITY CASES .................................31
7. THE MARKET FOR STORING CO2 WITH EOR .........................................................33 7.1 THE CO2 INJECTION AND STORAGE PROCESS OF CO2-EOR ............................................33 7.2 CO2 STORAGE CAPACITY ................................................................................................33 7.3 THE MARKET FOR CO2 ...................................................................................................34
APPENDIX A: STUDY METHODOLOGY .......................................................................... A-1 APPENDIX B: ECONOMICS OF “NEXT GENERATION” CO2-EOR TECHNOLOGY ........................................................................................................................B-1 APPENDIX C: CO2-EOR USING GRAVITY STABLE CO2 INJECTION AND OIL DISPLACEMENT .................................................................................................................... C-1 APPENDIX D: DETAILED REGION-LEVEL TABLES .................................................... D-1

Storing CO2 and Producing Domestic Crude Oil with Next Generation CO2-EOR Technology
II
List of Figures
Figure 1 - U.S. Basins/Regions Studied For Future CO2 Storage and Enhanced Oil Recovery .... 6Figure 2 - The Domestic Oil Resource Base .................................................................................. 9Figure 3 - One-Dimensional Schematic Showing the CO2 Miscible Process .............................. 13Figure 4 - U.S. CO2-EOR Activity ............................................................................................... 14Figure 5 - Growth of CO2-EOR Production in the U.S ................................................................ 15Figure 6 - Oil Recovery in Miscible Flooding for Five-Spot Well Patterns ................................. 16Figure 7 - Schematic of Macroscopic Displacement Efficiency Improvement with Polymer-
Augmented Waterflooding (Quarter of a Five-Spot Pattern) ................................................ 18Figure 8 - Relative Location of the Water Front in a Layered Reservoir ..................................... 19Figure 9 - Science Behind Volume of CO2 Injection and Oil Recovery Efficiency: Actual
Practice .................................................................................................................................. 20Figure 10 - Evolution of “Industry Standard” for Volume CO2 Injection (“Slug Size”) ............. 21Figure 11 - Overcoming the Effects of Geologic Complexity on CO2-EOR Performance .......... 22Figure 12 - Comparison of Technically Recoverable Resource between State of the Art and Next
Generation CO2-EOR Technologies ..................................................................................... 29Figure A-1 - Estimating CO2 Minimum Miscibility Pressure .................................................... A-5Figure A-2 - Correlation of MW C5+ to Tank Oil Gravity ........................................................ A-5Figure C-1 - Illustration of Gravity Stable Integration of CO2 Storage and EOR ..................... C-3

Storing CO2 and Producing Domestic Crude Oil with Next Generation CO2-EOR Technology
III
List of Tables
Table 1 - Comparison of “Best Practices” and “Next Generation” CO2-EOR Technologies – Example Light Oil Reservoir .................................................................................................. 2
Table 2 - Technically and Economically Recoverable Domestic Oil and CO2 Storage Capacity from “Next Generation” CO2-EOR: National Totals* ............................................................ 3
Table 3 - National In-Place, Conventionally Recoverable and “Stranded” Crude Oil Resources 10Table 4 - Comparison of Oil Resources of National and Major Oil Reservoirs Databases .......... 10Table 5 - Major Oil Reservoirs Screened as Favorable for CO2-EOR ......................................... 11Table 6 - Example Secondary Oil Recovery Efficiency vs. HCPV of CO2 Injection* ................ 17Table 7 - Economic Comparison of Alternative CO2-EOR Technologies – Example Light Oil
Reservoir ............................................................................................................................... 25Table 8 - Economic Comparison of Alternative CO2-EOR Technologies - Example Light Oil
Reservoir* ............................................................................................................................. 26Table 9 - Technically Recoverable Resources from Applying “Next Generation” CO2-
EOR:Totals from Extrapolating Advanced Resources’ Database to National Level ........... 28Table 10 - Economically Recoverable Resources from Applying “Next Generation” CO2-EOR:
National Totals at Base Case Economics* ............................................................................ 31Table 11 - Economically Recoverable Resource from “Next Generation” CO2-EOR : National
Totals at Alternative Economic Cases .................................................................................. 32Table 12 - Technical CO2 Storage Capacity using “Next Generation” CO2-EOR: Totals from
Extrapolating Advanced Resources’ Database to National Level (Eleven Basins/Areas) ... 34Table 13 – Economically Feasible Market for CO2 for “Next Generation” CO2-EOR: Base case*
(Eleven Basins/Areas) ........................................................................................................... 35Table 14 - Economically Feasible Market Demand for CO2 by CO2-EOR: Alternative Cases
(Eleven Basins/Areas) ........................................................................................................... 36Table 15 - Existing CO2 Supplies – volumes of CO2 injected for EOR ...................................... 37Table A-1 - Reservoir Data Format: Major Oil Reservoirs Database ........................................ A-3Table C-1 - Case Study: Integration of “Next Generation” CO2 Storage with EOR ................. C-2Table D-3 - National In-Place, Conventionally Recoverable and “Stranded” Crude Oil Resources
............................................................................................................................................. D-2Table D-4 – Comparison of National and Database Domestic Oil Resource Base .................... D-3Table D-5 – Major Oil Reservoirs Screened as Favorable for CO2-EOR .................................. D-4Table D-9 – Technically Recoverable Resources from Applying “Next Generation” CO2-EOR:
Totals from Extrapolating Advanced Resources’ Database to National Level .................. D-5Table D-10 – Economically Recoverable Resources from Applying “Next Generation” CO2-
EOR: National Totals at Base Case Economics* ................................................................ D-6Table D-11 – Economically Recoverable Resource from “Next Generation” CO2-EOR: National
Totals at Alternative Economic Cases ................................................................................ D-7Table D-12 – Technical CO2 Storage Capacity using “Next Generation” CO2-EOR: Totals from
Extrapolating Advanced Resources’ Database to National Level (Eleven Basins/Areas) . D-8Table D-13 – Economically Feasible Market for CO2 for “Next Generation” CO2-EOR: Base
Case* (Eleven Basins/Areas) .............................................................................................. D-9

Storing CO2 and Producing Domestic Crude Oil with Next Generation CO2-EOR Technology
IV
Table D-14 – Economically Feasible Market Demand for CO2 by CO2-EOR: Alternative Cases (Eleven Basins/Areas) ....................................................................................................... D-10
Storing CO2 and Producing Domestic Crude Oil with Next Generation CO2-EOR Technology
1
1. In order to build on work published in two previous reports - - “Storing CO2 with Enhanced Oil Recovery”
EXECUTIVE SUMMARY
1 and a series of “Ten Basin-Oriented Reports” 2
The four “next generation” CO2-EOR technology options are: (1) increasing the volume of CO2 injected into the oil reservoir; (2) optimizing pattern design and orientation, including adding infill wells, to achieve increased contact between injected CO2 and the oil reservoir; (3) improving the mobility ratio between the injected CO2/water and the residual oil; and, (4) extending the miscibility range, thus helping more reservoirs achieve higher oil recovery efficiency.
, Advanced Resources International (ARI) was sponsored by the U.S. DOE/NETL, Office of Systems, Analysis and Planning to examine both the potential for increased oil recovery as well as CO2 storage which could result from new technologies. CO2 enhanced oil recovery (CO2-EOR) offers the potential for storing significant volumes of carbon dioxide emissions while increasing domestic oil production. However, a number of technical challenges limit the full theoretical potential offered by integrated CO2 storage and CO2-EOR. In this report, ARI identifies and analyzes four “next generation” CO2-EOR technology options that address some of these technical challenges.
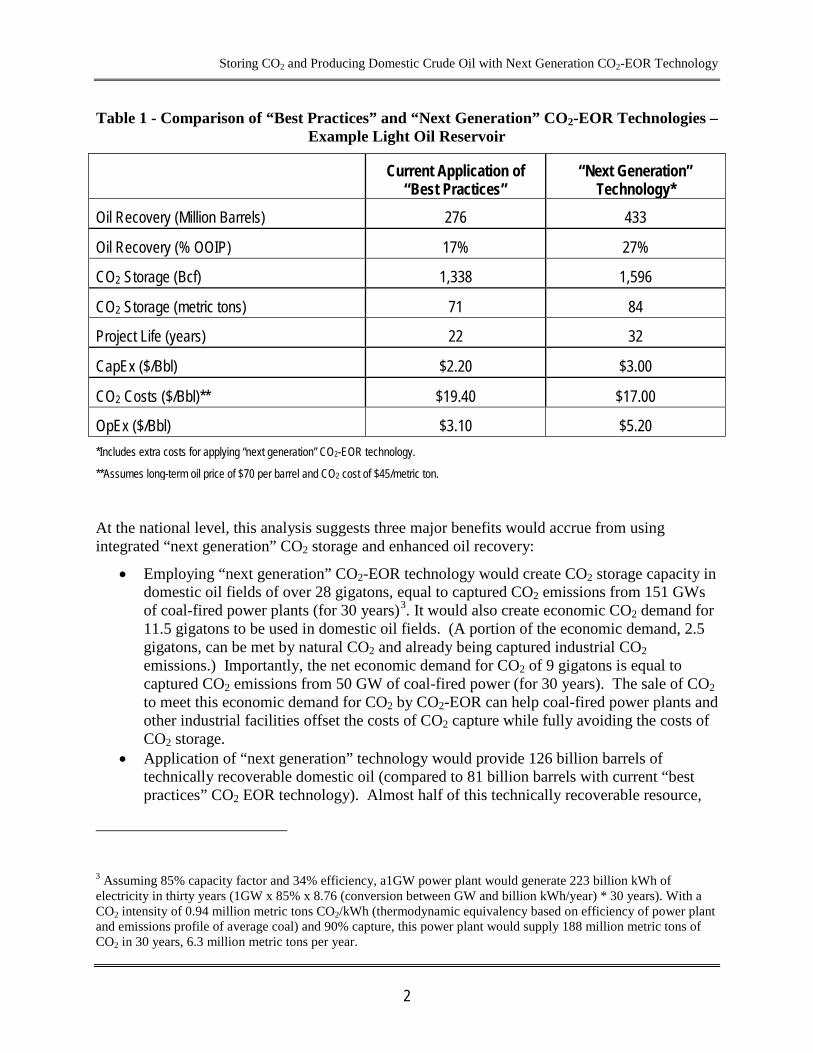
These practices could dramatically increase the performance of CO2-EOR technology and increase the volume of CO2 that could be stored in oil reservoirs compared to current practices. Table 1 shows the improvements that “next generation” technology would bring to a sample CO2-EOR project. In this instance, incremental oil recovery is improved by 57% and CO2 storage is increased by 18%.
1 “Storing CO2 with Enhanced Oil Recovery” report prepared for U.S. DOE/NETL, Office of Systems, Analyses and Planning, DOE/NETL-402/1312/02-07-08, February 7, 2008. http://www.netl.doe.gov/energy-analyses/pubs/Storing%20CO2%20w%20EOR_FINAL.pdf 2 The Advanced Resources completed series of ten “basin studies” were the first to comprehensively address CO2 storage capacity from combining CO2 storage and CO2-EOR. These ten “basin studies” covered 22 of the oil producing states plus offshore Louisiana and included 1,581 large (>50 MMBbls OOIP) oil reservoirs, accounting for two thirds of U.S. oil production. These reports are available on the U.S. Department of Energy’s web site at: http://www.fe.doe.gov/programs/oilgas/eor/Ten_Basin-Oriented_CO2-EOR_Assessments.html.
Storing CO2 and Producing Domestic Crude Oil with Next Generation CO2-EOR Technology
2
Table 1 - Comparison of “Best Practices” and “Next Generation” CO2-EOR Technologies – Example Light Oil Reservoir
Current Application of
“Best Practices” “Next Generation”
Technology* Oil Recovery (Million Barrels) 276 433
Oil Recovery (% OOIP) 17% 27%
CO2 Storage (Bcf) 1,338 1,596
CO2 Storage (metric tons) 71 84
Project Life (years) 22 32
CapEx ($/Bbl) $2.20 $3.00
CO2 Costs ($/Bbl)** $19.40 $17.00
OpEx ($/Bbl) $3.10 $5.20 *Includes extra costs for applying “next generation” CO2-EOR technology.
**Assumes long-term oil price of $70 per barrel and CO2 cost of $45/metric ton.
At the national level, this analysis suggests three major benefits would accrue from using integrated “next generation” CO2 storage and enhanced oil recovery:
• Employing “next generation” CO2-EOR technology would create CO2 storage capacity in domestic oil fields of over 28 gigatons, equal to captured CO2 emissions from 151 GWs of coal-fired power plants (for 30 years)3
• Application of “next generation” technology would provide 126 billion barrels of technically recoverable domestic oil (compared to 81 billion barrels with current “best practices” CO2 EOR technology). Almost half of this technically recoverable resource,
. It would also create economic CO2 demand for 11.5 gigatons to be used in domestic oil fields. (A portion of the economic demand, 2.5 gigatons, can be met by natural CO2 and already being captured industrial CO2 emissions.) Importantly, the net economic demand for CO2 of 9 gigatons is equal to captured CO2 emissions from 50 GW of coal-fired power (for 30 years). The sale of CO2 to meet this economic demand for CO2 by CO2-EOR can help coal-fired power plants and other industrial facilities offset the costs of CO2 capture while fully avoiding the costs of CO2 storage.
3 Assuming 85% capacity factor and 34% efficiency, a1GW power plant would generate 223 billion kWh of electricity in thirty years (1GW x 85% x 8.76 (conversion between GW and billion kWh/year) * 30 years). With a CO2 intensity of 0.94 million metric tons CO2/kWh (thermodynamic equivalency based on efficiency of power plant and emissions profile of average coal) and 90% capture, this power plant would supply 188 million metric tons of CO2 in 30 years, 6.3 million metric tons per year.

Storing CO2 and Producing Domestic Crude Oil with Next Generation CO2-EOR Technology
3
58 billion barrels, would be economically recoverable under the mid-range (Base Case) oil price used in the study, Table 2.4
Table 2 - Technically and Economically Recoverable Domestic Oil and CO2 Storage Capacity from “Next Generation” CO2-EOR: National Totals*
Basin/Area
Technically Recoverable Oil*
(Billion Barrels)
Economically Recoverable Oil**
(Billion Barrels)
“Next Generation” CO2 Storage Capacity (Million Metric Tons )
“Best Practices”
“Next Generation”
“Best Practices”
“Next Generation”
Technical Potential
Economic Demand
1. Lower-48 Onshore 66.7 107.1 34.7 49.4 23,990 9,910
2. Offshore GOM 5.7 5.7 0.7 0.7 1,740 200
3. Alaska 8.6 12.7 2.1 7.8 2,670 1,400
Total 81.2 125.6 37.5 57.9 28,400 11,510 *Incremental technically recoverable oil resources after subtracting 2.3 billion barrels already being developed with CO2-EOR.
**Base Case economics uses an oil price of $70 per barrel (constant, real) and a CO2 cost of $45 per metric ton ($2.38/Mcf), delivered at pressure to the field.
• Third, the oil produced with injection of captured CO2 emissions is to a large extent “carbon-free”, after balancing the carbon content in the oil produced and the volume of CO2 stored with CO2-EOR in the reservoir. If operators were incentivized to change their CO2-EOR and storage design (including continuing to inject CO2 at the end of the project), they could store more CO2 in the oil reservoir than contained in the produced oil, resulting in over 100% carbon free (“green”) oil. A case study of pursuing high capacity CO2 storage and CO2-EOR, that helps illustrate this point, is presented in Appendix C.
The results from this study presented in this report are based on using Advanced Resources database of 6,344 large domestic oil reservoirs, screened and evaluated using a streamline reservoir simulation and a detailed cost and cash-flow based economic model.
4 In addition to the mid-range oil price case of $70/barrel, the study investigated a low price case of $50/barrel with a CO2 price of $35/metric ton and a high price case of $100/barrel with a CO2 price of $60/metric ton.

Storing CO2 and Producing Domestic Crude Oil with Next Generation CO2-EOR Technology
4
An additional opportunity for storing CO2 with CO2-EOR is in saline aquifers containing residual oil (ROZ) in zones that underlie the primary oil interval (main pay zone). Due to their low oil concentrations, these residual oil zones are not economically feasible to pursue with primary/secondary recovery. However, we believe that the potential CO2 storage capacity offered by the ROZ is large, on the order of 50 gigatons of CO2. While needing further study, the ROZ/saline aquifer interval would provide storage for captured CO2 emissions from over 250 GWs of coal-fired power (30 years). The ability to receive credits for sequestering CO2 into saline reservoirs containing residual oil would make the ROZ attractive for storing CO2 and producing additional oil, particularly when operated jointly with a CO2 flood in the main pay zone. The quantification of the additional CO2 storage and oil recovery potential offered by ROZs is an important area for further work.
Additionally, advanced drilling and modeling technology have made vertical (“gravity stable”) CO2 floods more of a possibility. Generally speaking, vertical floods produce crude oil at a slower rate than conventional floods but enable a higher amount of the oil in-place to be recovered. Furthermore, this alternative method would allow a much greater amount of CO2 to be stored within the oil reservoir, as discussed in Appendix C. Vertical floods are also an important area for future study.
Storing CO2 and Producing Domestic Crude Oil with Next Generation CO2-EOR Technology
5
2.
2.1 UPDATED RESERVOIR AND ECONOMICS DATA
BACKGROUND
In January 2008, Advanced Resources International, with sponsorship by the U.S. Department of Energy’s Office of Fossil Energy, issued a study entitled, “Storing CO2 with Enhanced Oil Recovery.” This study examined the domestic oil recovery and CO2 storage potential offered by widespread application of currently used “best practices” CO2-EOR technology (In the Storing CO2 with CO2 Enhanced Oil Recovery report, the term “State of the Art” is synonymous with the term “best practices” used in this report). It also synthesized the analysis previously contained in the series of ten basin reports, noted above.
This report builds on the reservoir data and CO2-EOR performance provided in the above cited study “Storing CO2 with Enhanced Oil Recovery” and includes an updated cost model and field-by-field reservoir modeling of evaluating and then applying “next generation” CO2-EOR technology to 1,715 domestic oil reservoirs.
A brief description of the updated data and analytical work contained in this report is set forth below.
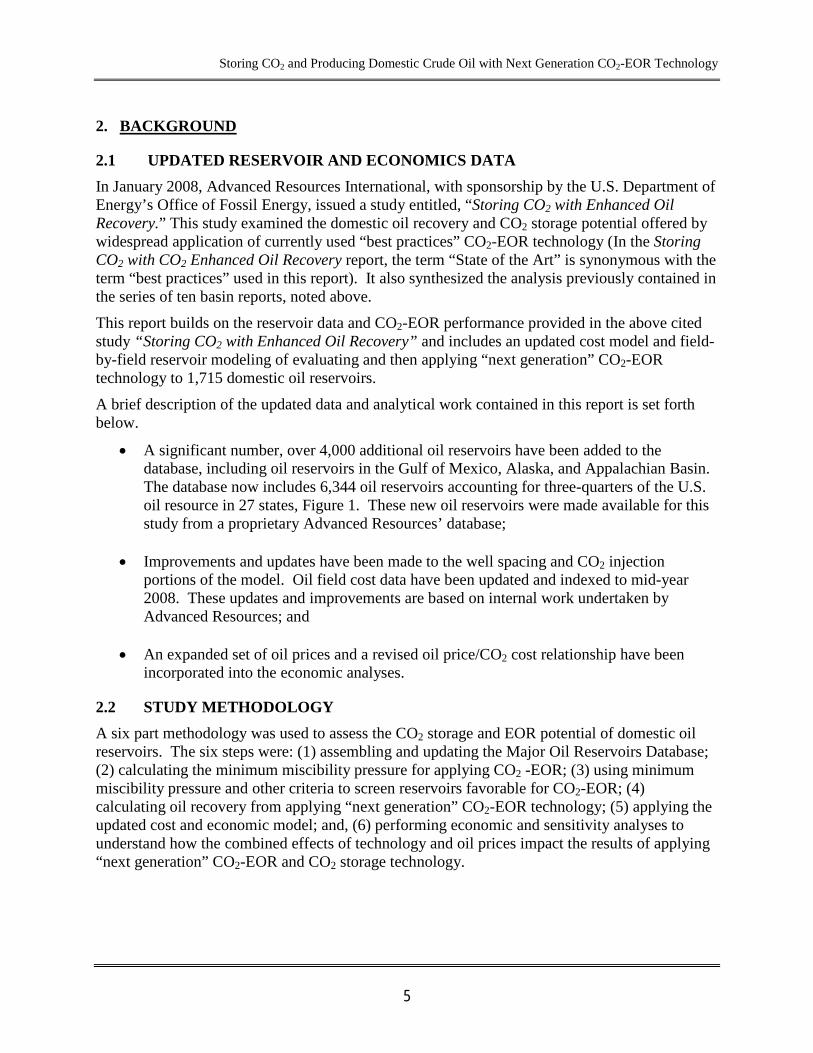
• A significant number, over 4,000 additional oil reservoirs have been added to the database, including oil reservoirs in the Gulf of Mexico, Alaska, and Appalachian Basin. The database now includes 6,344 oil reservoirs accounting for three-quarters of the U.S. oil resource in 27 states, Figure 1. These new oil reservoirs were made available for this study from a proprietary Advanced Resources’ database;
• Improvements and updates have been made to the well spacing and CO2 injection portions of the model. Oil field cost data have been updated and indexed to mid-year 2008. These updates and improvements are based on internal work undertaken by Advanced Resources; and
• An expanded set of oil prices and a revised oil price/CO2 cost relationship have been incorporated into the economic analyses.
2.2 STUDY METHODOLOGY A six part methodology was used to assess the CO2 storage and EOR potential of domestic oil reservoirs. The six steps were: (1) assembling and updating the Major Oil Reservoirs Database; (2) calculating the minimum miscibility pressure for applying CO2 -EOR; (3) using minimum miscibility pressure and other criteria to screen reservoirs favorable for CO2-EOR; (4) calculating oil recovery from applying “next generation” CO2-EOR technology; (5) applying the updated cost and economic model; and, (6) performing economic and sensitivity analyses to understand how the combined effects of technology and oil prices impact the results of applying “next generation” CO2-EOR and CO2 storage technology.

Storing CO2 and Producing Domestic Crude Oil with Next Generation CO2-EOR Technology
6
Figure 1 - U.S. Basins/Regions Studied For Future CO2 Storage and Enhanced Oil Recovery
The 27 states with shading are included in the eleven Advanced Resources International updated “ basin studies ” of CO 2 storage with enhanced oil recovery.
Storing CO2 and Producing Domestic Crude Oil with Next Generation CO2-EOR Technology
7
To calculate the incremental oil produced by CO2-EOR from oil reservoirs, the study utilized the PROPHET2 model. PROPHET2 is a stream tube miscible flood predictive model that was first developed by the Texaco Exploration and Production Technology Department under a DOE cost share program and has been further modified by Advanced Resources International.5
The PROPHET2 model was calibrated with an industry standard reservoir simulator, GEM
6
The GEM model was run at two distributions of reservoir permeability (an upward fining and an upward coarsening permeability structure) plus CO2 gravity override to establish oil recovery values against which the results from PROPHET2 would be compared. This work indicated that that oil recovery values from PROPHET2 were between the oil recoveries from the high and low cases of the GEM model, suggesting that PROPHET2 is neither over nor under optimistic in its calculations of oil recovery.
, to determine how permeability distributions within a multi-layer reservoir and gravity override, two computational functions absent in PROPHET2, might influence the calculation of oil recovery. The models were calibrated by comparing their results from trial runs on an example light oil reservoir.
Appendix A provides additional detail on the methodology used in this study.
2.3 REPORT OUTLINE The report begins with a summary presentation of the three topics central to analyzing the potential of integrated “next generation” CO2-EOR and CO2 storage technologies:
1. What is the size and nature of the domestic oil resource base;
2. How much of this resource base is recoverable with “next generation” CO2-EOR; and,
3. What portion of this technically recoverable oil resource is economic under alternative oil prices and CO2 costs?
The report then examines the CO2 storage capacity available in domestic oil fields and the market demand for captured CO2 emissions offered by the EOR industry.
A series of appendices provide supporting data and technical information for the analytical results discussed in the main report. Appendix A provides information on the study methodology. Appendix B provides detail on our cost and economics model. Appendix C provides a case study of gravity stable CO2-EOR flooding. Appendix D provides more detailed state-level results of our study.
5 “Post Waterflood CO2 Flood in a Light Oil, Fluvial Dominated Deltaic Reservoir” (DOE Contract No. DE-FC22-93BC14960). 6 Generalized Equation of State Model Compositional Reservoir Simulator” by Computer Modeling Group LTD.

Storing CO2 and Producing Domestic Crude Oil with Next Generation CO2-EOR Technology
8
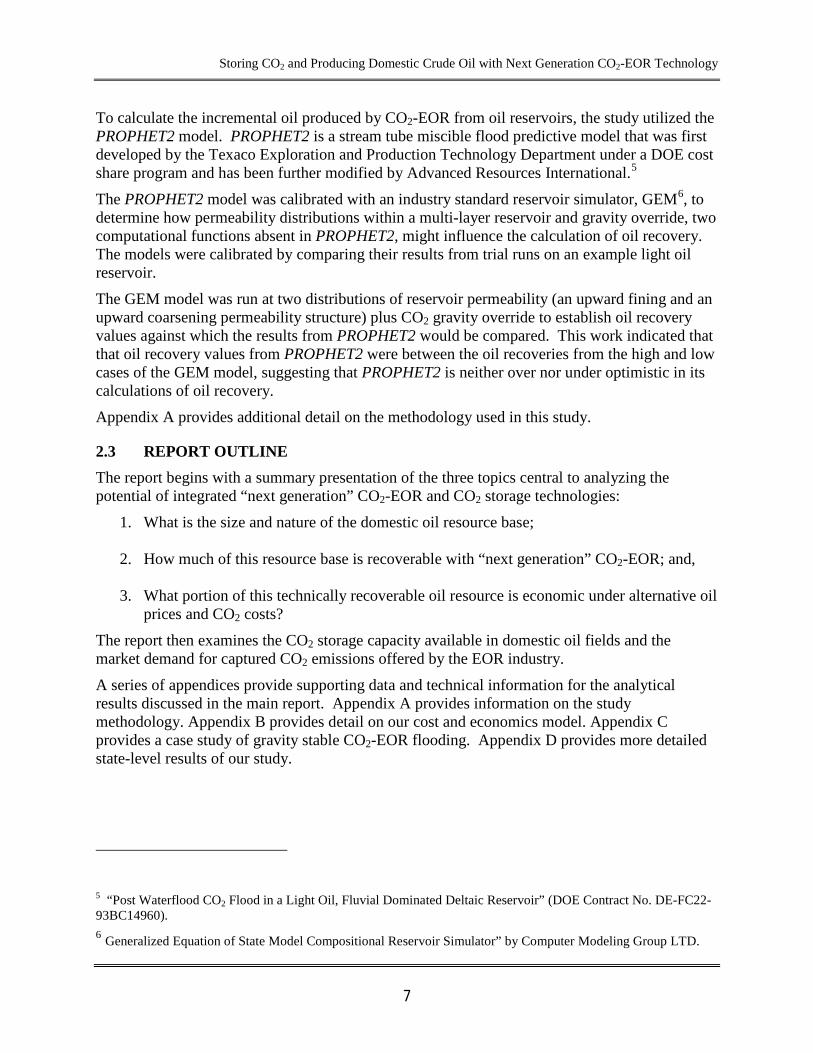
3. The U.S. has a large oil resource base, on the order of 597 billion barrels originally in-place. About one-third of this oil resource base, 204 billion barrels, has been recovered or placed into proved reserves with existing primary and secondary oil recovery technologies. This leaves behind a massive target of 393 billion barrels of remaining, “technically stranded”, oil, Figure 2.
THE DOMESTIC OIL RESOURCE BASE
7
Table 3 provides a tabulation of the national in-place, conventionally recoverable and “stranded” oil in the lower-48 onshore, offshore Gulf of Mexico (GOM) and Alaska. Much of the “stranded” oil resides in East and Central Texas (74 billion barrels), the Mid-Continent (66 billion barrels), and the Permian Basin of West Texas and New Mexico (62 billion barrels). California, Alaska, the Gulf Coast and the Rockies also have significant volumes of “stranded” oil. Appendix D provides additional details for the “basins” addressed by this study.
The Advanced Resources’ Major Oil Reservoirs Database of 6,344 distinct oil reservoirs contains 447 billion barrels of Original Oil in Place (OOIP) out of the national total of 597 billion barrels of OOIP, Table 4. The database values are scaled up to national levels using the state-by-state ratio of cumulative oil production in the Major Oil Reservoir Database and the state-by-state cumulative oil production data from state, EIA, and other sources. The database coverage for individual basins/areas ranges from 59% for the Mid-Continent to 100% for Alaska and a national coverage of 75%. As such, the Major Oil Reservoir Database provides a solid foundation for estimating the national oil recovery potential from CO2-EOR.
7 When less established domestic oil resources, such as undiscovered oil, tar sands, and oil trapped in residual oil zones are included, the “stranded” oil resource approaches 1,000 billion barrels. For further information on this topic see Chapter 3 (pages 183 and 184) of the National Petroleum Council report “Hard Truths, Facing the Hard Truths about Energy” July, 2007, http://www.npchardtruthsreport.org/
Storing CO2 and Producing Domestic Crude Oil with Next Generation CO2-EOR Technology
9
Figure 2 - The Domestic Oil Resource Base

Storing CO2 and Producing Domestic Crude Oil with Next Generation CO2-EOR Technology
10
Table 3 - National In-Place, Conventionally Recoverable and “Stranded” Crude Oil Resources
Basin/Area National Data
OOIP* (Billion Barrels)
Conventionally Recoverable ROIP
“Stranded”** (Billion Barrels) (Billion Barrels) % of
OOIP
1. Lower-48 500.3 161.0 32% 339.3
2. Offshore GOM 46.1 20.9 45% 25.2
3. Alaska 50.7 21.9 43% 28.8
Total 597.1 203.8 34% 393.3 *Original Oil In-Place **Remaining Oil In-Place
Source: Advanced Resources Int’l, 2009.
Please see Appendix D, Table D-3 for expanded version.
Table 4 - Comparison of Oil Resources of National and Major Oil Reservoirs Databases
Basin/Area National Data
OOIP* (Billion Barrels)
Major Oil Reservoirs Database
OOIP* (Billion Barrels)
Coverage
1. Lower-48 Onshore 500.3 350.2 70%
2. Offshore GOM 46.1 46.1 100%
3. Alaska 50.7 50.7 100%
Total 597.1 447.0 75% *Original Oil In-Place
Source: Advanced Resources Int’l, 2009. Data base figures are from Advanced Resources’ internal database of large domestic oil reservoirs.
Please see Appendix D, Table D-4 for expanded version.

Storing CO2 and Producing Domestic Crude Oil with Next Generation CO2-EOR Technology
11
Not all of the remaining domestic oil resource is technically amenable to CO2-EOR. Favorable reservoir properties for miscible CO2-EOR include sufficiently deep formations with lighter (higher gravity) oil. A portion of the shallower oil reservoirs with heavier (lower gravity) oil may be amenable to immiscible CO2-EOR.8
Table 5 provides a basin/area level tabulation of the 6,344 reservoirs in the Major Oil Reservoirs Database, showing that 1,715 reservoirs (containing 305 billion barrels of OOIP) screened as being amenable to miscible and immiscible CO2-EOR. More than half of the oil reservoirs in California, particularly the shallower heavy oil fields, screen as unfavorable for CO2-EOR while the great bulk (over 80%) of the oil reservoirs in the Permian Basin screen as favorable for CO2-EOR.
Table 5 - Major Oil Reservoirs Screened as Favorable for CO2-EOR
Basin/Area Major Oil Reservoirs Database
# of Total Reservoirs # Favorable for CO2-EOR
1. Lower-48 Onshore 1,809 1040
2. Offshore GOM 4,493 642
3. Alaska 42 33
Total 6,344 1,715 Please see Appendix D, Table D-5 for expanded version.
8 For readers unfamiliar with the distinction between miscible and immiscible EOR, a more detailed description is given in section 4.1
Storing CO2 and Producing Domestic Crude Oil with Next Generation CO2-EOR Technology
12
4.
4.1 USING CO2-EOR TO RECOVER “STRANDED” OIL
DETAILED DISCUSSION OF CO2-EOR
Large volumes of oil are left unrecovered (“stranded”) after completion of primary and secondary oil recovery methods. The reasons for these large volumes of “stranded” oil include: oil that is bypassed due to poor waterflood sweep efficiency; oil that is physically unconnected to a wellbore; and, most importantly, oil that is trapped by viscous, capillary and interfacial tension forces as residual oil in the pore space.
The main mechanism by which CO2-EOR can recover this trapped oil is by creating, with the assistance of pressure, miscibility between the residual oil and the injected CO2. Additional mechanisms such as viscosity reduction, oil swelling and improved reservoir contact further contribute to efficient oil recovery.
• Miscible CO2-EOR is a multiple contact process involving interactions between the injected CO2 and the reservoir’s oil. During this multiple contact process, CO2 vaporizes the lighter oil fractions into the injected CO2 phase and CO2 condenses into the reservoir’s oil phase. This leads to two reservoir fluids that become miscible (mixing in all parts), with favorable properties of low viscosity, enhanced mobility and low interfacial tension, thus remobilizing and dramatically reducing the post-waterflooding residual oil in the reservoir’s pore space. Figure 3 provides a one-dimensional schematic showing the fluid dynamics of the CO2 miscible process.
• Immiscible CO2-EOR occurs when insufficient reservoir pressure is available or the reservoir’s oil composition is less favorable (heavier). The main mechanisms involved in immiscible CO2 flooding are: (1) oil phase swelling, as the oil becomes saturated with CO2; (2) viscosity reduction of the swollen oil and CO2 mixture; (3) extraction of lighter hydrocarbon into the CO2 phase; and, (4) fluid drive plus pressure. This combination of mechanisms enables a portion of the reservoir’s remaining oil to be mobilized and produced. In general, immiscible CO2-EOR is much less efficient than miscible CO2-EOR in recovering the oil remaining in the reservoir.
Currently available CO2-EOR technologies, including both miscible and immiscible CO2 injection, are in commercial use today. However, today’s CO2-EOR technologies still underperform compared to their theoretical potential as established by laboratory testing, reservoir simulation and a handful of forward-looking, highly instrumented projects. As evidence for underperformance, field data shows that currently practiced CO2-EOR technology recovers only 5% to 15% of a reservoir’s OOIP as opposed to theoretically possible oil recoveries using “next generation” CO2-EOR technology of over 20% of OOIP.
The “next generation” CO2-EOR technology options include: (1) increasing the volume of CO2 injected into the oil reservoir to increase sweep efficiency; (2) optimizing well design and placement, including adding infill wells, to achieve increased contact between the injected CO2 and the oil reservoir; (3) improving the mobility ratio between the injected CO2/water and the residual oil; and, (4) extending the miscibility range, thus helping more reservoirs achieve higher oil recovery efficiency.

Storing CO2 and Producing Domestic Crude Oil with Next Generation CO2-EOR Technology
13
Figure 3 - One-Dimensional Schematic Showing the CO2 Miscible Process
If implemented, these practices could dramatically increase the efficiency of CO2-EOR-based oil recovery. They would also increase the amount of CO2 that could be stored in oil reservoirs. Reservoir analysis suggests that the combined application of “next generation” technologies could increase the oil recovery from selected oil reservoirs by about 50% relative to continued application of today’s “best practices” CO2-EOR technology.
The remainder of this section discusses the performance of today’s “best practices” CO2-EOR technology, where it is being performed in the U.S., and how “next generation” technology could increase the amount of oil recovered from domestic fields.
4.2 CURRENT CO2-EOR ACTIVITY AND PRODUCTION According to the 2008 EOR Survey published by the Oil and Gas Journal, approximately 250,000 barrels per day of incremental domestic oil is being produced by 105 CO2-EOR projects, distributed broadly across the U.S. Since 1986, when CO2-EOR was first used in commercial production, over 1.3 billion barrels of incremental oil have been recovered using this technology.
Figure 4 provides the location of the currently active 105 CO2-EOR projects (including the Weyburn project, in Canada) and illustrates their sources of CO2 supply. Figure 5 tracks the steady growth in CO2-EOR based oil production for the past 20 years, noting that although new activities are underway in the Gulf Coast and the Rockies, the great bulk of CO2-EOR is still being produced from the Permian Basin.
Pure CO 2
CO 2 Vaporizing Oil Components
CO 2 Condensing
Into Oil Original
Oil
Miscibility is Developed in This Region (CO 2 and Oil Form Single Phase)
Direction of Displacement

Storing CO2 and Producing Domestic Crude Oil with Next Generation CO2-EOR Technology
14
JAF01994.CDR
LaBargeGas PlantLaBarge
Gas Plant
Val VerdeGas PlantsVal Verde
Gas Plants
Enid FertilizerPlant
Enid FertilizerPlant
JacksonDome
JacksonDome
McElmo DomeSheep Mountain
Bravo Dome
McElmo DomeSheep Mountain
Bravo Dome
10
7
14
61
8
Dakota CoalGasification
Plant
Dakota CoalGasification
Plant
Antrim GasPlant
Antrim GasPlant
21
1
*Data on specific CO2-EOR floods can be found in the Oil & Gas Journal’s annual EOR Report, April 2008.
Number of CO2-EOR Projects*
Natural CO2 Source
Industrial CO2 Source
CO2 Pipeline
105
1
JAF028046.PPT Figure 4 - U.S. CO2-EOR Activity

Storing CO2 and Producing Domestic Crude Oil with Next Generation CO2-EOR Technology
15
0
50,000
100,000
150,000
200,000
250,000
300,000
1986 1988 1990 1992 1994 1996 1998 2000 2002 2004 2006 2008
Year
Enha
nced
Oil
Rec
over
y (b
arre
ls/d
ay)
GULF COAST/OTHERMID-CONTINENTROCKY MOUNTAINSPERMIAN BASIN
JAF2008008.XLS
Source: Advanced Resources Int’l. and Oil and Gas Journal, 2008. JAF02768.PPT
Figure 5 - Growth of CO2-EOR Production in the U.S
4.3 PERFORMANCE OF CURRENT CO2-EOR TECHNOLOGY Laboratory tests and reservoir modeling show that very high oil recovery efficiencies are theoretically possible using innovative applications of CO2 enhanced oil recovery (CO2-EOR). Under ideal conditions, gravity-stable laboratory core floods using high pressure CO2 have recovered essentially all of the residual oil. Similarly, reservoir simulation models, using innovative well placement and process designs that facilitate contact of the majority of the reservoir’s pore volume with CO2, also show that high oil recovery efficiencies are possible.
However, the actual field performance of CO2-EOR projects has not exhibited the high oil recovery efficiency shown in laboratory tests. Geologically complex reservoir settings combined with lack of reliable performance information or process control capability during the CO2 flood are some of the challenges facing optimum oil recovery using CO2-EOR.
4.3.1 The causes of less-than-optimum past-performance and modest oil recoveries by currently used CO2-EOR technologies include the following:
Barriers to Improved CO2-EOR Performance
1. Insufficient Injection of CO2. The great majority of past CO2 floods injected insufficient volumes of CO2 for optimum oil recovery. This was due in part to high CO2 costs relative to oil prices and the inability to control CO2 flow through the reservoir. Figure 6 shows
Storing CO2 and Producing Domestic Crude Oil with Next Generation CO2-EOR Technology
16
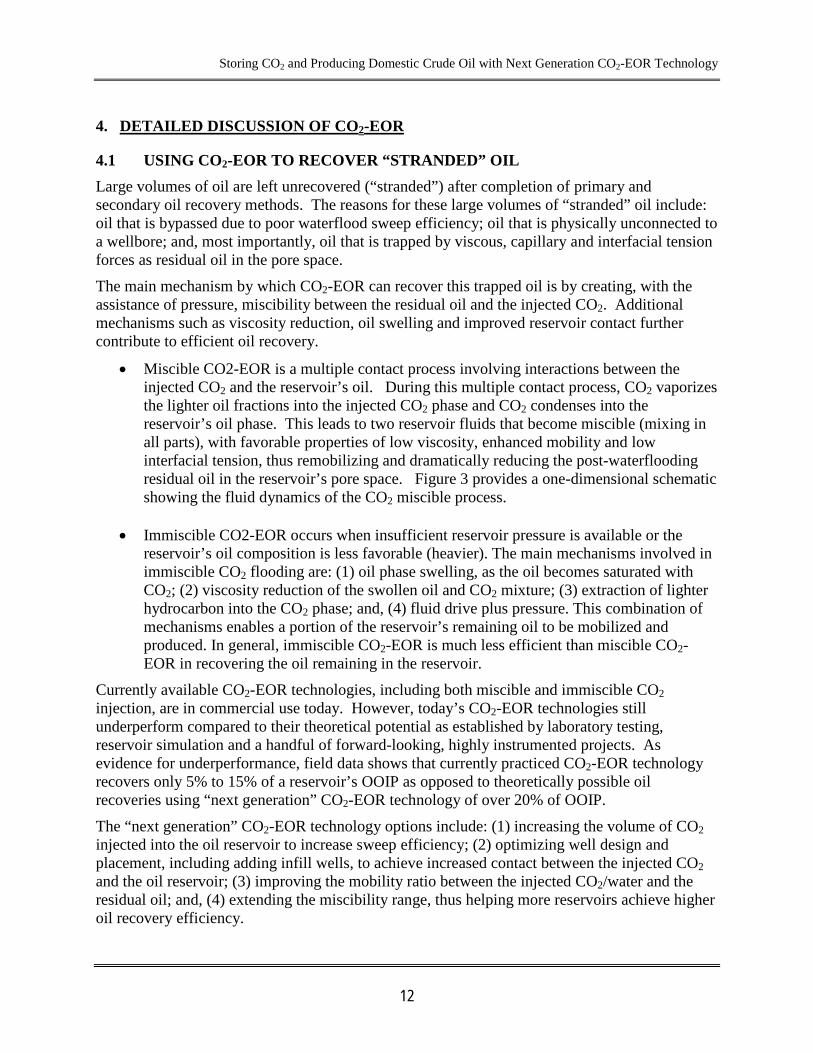
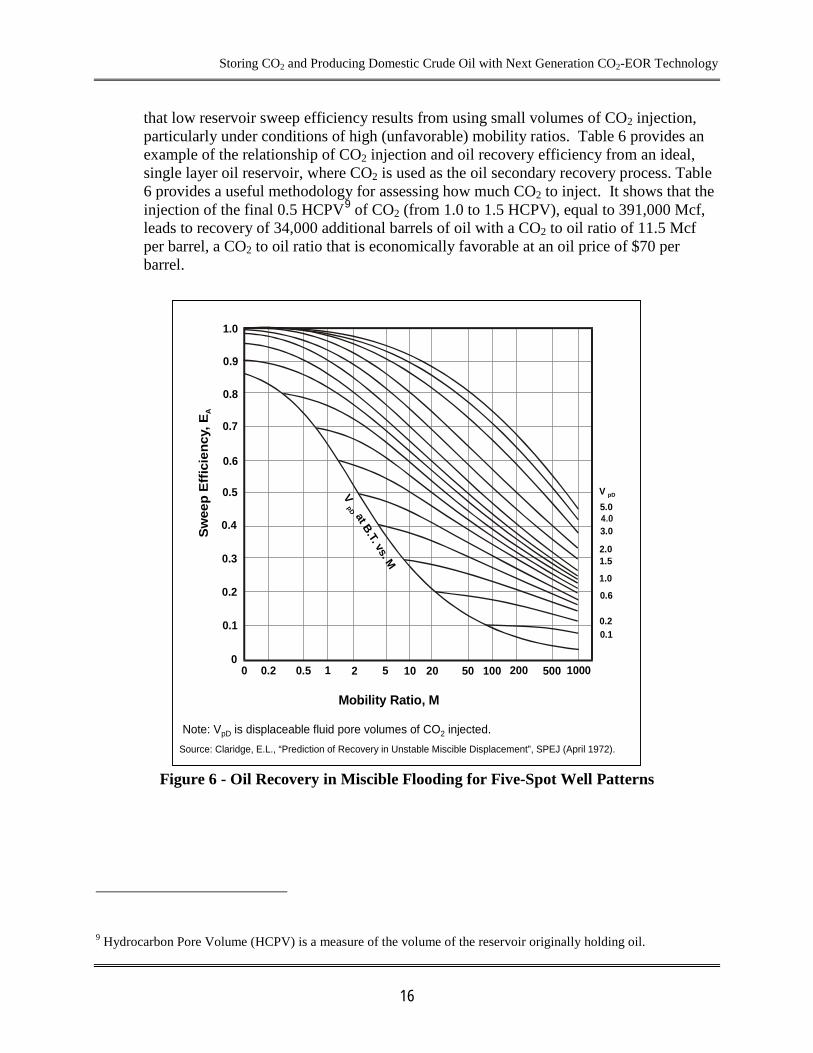
that low reservoir sweep efficiency results from using small volumes of CO2 injection, particularly under conditions of high (unfavorable) mobility ratios. Table 6 provides an example of the relationship of CO2 injection and oil recovery efficiency from an ideal, single layer oil reservoir, where CO2 is used as the oil secondary recovery process. Table 6 provides a useful methodology for assessing how much CO2 to inject. It shows that the injection of the final 0.5 HCPV9
of CO2 (from 1.0 to 1.5 HCPV), equal to 391,000 Mcf, leads to recovery of 34,000 additional barrels of oil with a CO2 to oil ratio of 11.5 Mcf per barrel, a CO2 to oil ratio that is economically favorable at an oil price of $70 per barrel.
Figure 6 - Oil Recovery in Miscible Flooding for Five-Spot Well Patterns
9 Hydrocarbon Pore Volume (HCPV) is a measure of the volume of the reservoir originally holding oil.
Source: Claridge, E.L., “Prediction of Recovery in Unstable Miscible Displacement”, SPEJ (April 1972).
Note: VpD is displaceable fluid pore volumes of CO2 injected.
1.0
0.9
0.8
0.7
0.6
0.5
0.4
0.3
0.2
0.1
00.20 0.5 1 2 105 5020 200100 1000500
5.0
2.0
3.0
1.0
V pD
0.10.2
1.5
0.6
Sw
eep
Eff
icie
ncy,
EA
Mobility Ratio, M
V at B.T. vs. M
pD

Storing CO2 and Producing Domestic Crude Oil with Next Generation CO2-EOR Technology
17
Table 6 - Example Secondary Oil Recovery Efficiency vs. HCPV of CO2 Injection*
Injected CO2 (HCPV)
Injected CO2 (Mcf)
Reservoir Sweep Efficiency (Fraction)
Oil Recovery (Barrels)
Oil Recovery Efficiency (% OOIP)
0.40 312,800 0.345 117,300 32.2
0.60 469,200 0.440 149,600 41.1
0.80 625,600 0.515 175,100 48.1
1.00 782,000 0.570 193,800 53.2
1.50 1,173,000 0.670 227,800 62.6 *Amount of oil produced by CO2 flood divided by original oil in-place assumed at 364 thousand barrels
Source: Adapted by Advanced Resources Int’l from “Enhanced Oil Recovery”, D.W. Green and G. P. Willhite, SPE, 1998.
2. Poor Sweep Efficiency. In many of the previous CO2 floods, the injected CO2 achieved only limited contact with the residual oil in the reservoir (poor sweep efficiency). This was due to a variety of causes, including: gravity override by the less dense CO2; viscous fingering of the CO2 through the reservoir’s oil; and channeling of the CO2 in highly heterogeneous reservoirs. Figure 7 shows how a high mobility ratio for the injected fluid can lead to viscous fingering and how addition of viscosity enhancers would help reduce this problem in a traditional waterflood.
3. Poor Displacement Efficiency. Analysis of past CO2 floods also shows that, in many cases, the CO2-EOR project mobilized only a modest portion of the residual oil (poor displacement efficiency) due to lack of effective miscibility between the injected CO2 and the reservoir’s oil, caused by unexpected pressure declines in portions of the reservoir and less than optimum injection and production well operating practices.
4. Lack of CO2 Contact With Remaining Oil Resources. An often overlooked but important cause of poor CO2-EOR performance is the inability to efficiently target injected CO2 to preferred (high residual oil) reservoir strata and then capture and produce the mobilized oil. Figure 8 shows how the lower permeability portion of the reservoir strata (Layer 1) is less efficiently swept by a waterflood, leaving behind much higher residual oil saturations in this layer of the oil reservoir. Injection of CO2 into this type of reservoir, without undertaking selective CO2 placement, would cause the CO2 to enter the higher permeability (100 md) Layer 2, bypassing the lower permeability, higher oil saturation Layer 1.
5. Inadequate “Management and Control”. Finally, a variety of other operating issues have contributed toward less-than-optimum performance, including the inability to

Storing CO2 and Producing Domestic Crude Oil with Next Generation CO2-EOR Technology
18
“manage and control” the CO2 flood for lack of real-time process and performance information from within the oil reservoir.
Figure 7 - Schematic of Macroscopic Displacement Efficiency Improvement with Polymer-
Augmented Waterflooding (Quarter of a Five-Spot Pattern)
Source: Adapted by Advanced Resources Int ’ l from “ Enhanced Oil Recovery ” , D.W. Green and G. P. Willhite, SPE, 1998.
Oil and Water
Water
Oil and Water
Water
Polymer In Water
Waterflood (High Mobility Ratio)
Viscosity Enhanced Flood (Improved Mobility Ratio)

Storing CO2 and Producing Domestic Crude Oil with Next Generation CO2-EOR Technology
19
Figure 8 - Relative Location of the Water Front in a Layered Reservoir
4.3.2 Considerable evolution has occurred in the design and implementation of CO2-EOR technology since it was first introduced. Notable changes include: (1) use of larger (up to 1 HCPV) volumes of CO2; (2) incorporation of tapered WAG (water alternating with gas) and other methods for mobility control; and (3) application of advanced well drilling and completion strategies to better contact previously bypassed oil. As a result, the oil recovery efficiencies of today’s better designed and operated CO2-EOR projects have steadily improved.
Evolution in CO2 Flooding Practices
• Figure 9 provides analytical support for using larger volumes of injected CO2.
• Figure 10, using information from Occidental Petroleum (Oxy Permian), provides a 17 year snapshot of the evolution of the “industry standard” for the most effective volume of CO2 injection (the optimum “slug size”).
• Figure 11, illustrates how rigorous monitoring and well remediation can be used to target injected CO2 to reservoir strata with high remaining oil saturation, helping reduce ineffective CO2 channeling.
The “next generation” technology goals analyzed in this report build on the successes of forward thinking firms that have begun to address the challenges for optimizing CO2-EOR performance.
0 100 200 300
1839 Days (Channeling in Layer 2)
478 Days (Breakthrough)
368 Days
Distance, ft
Layer 1 (20 md )*
Layer 2 (100 md ) Water
* Millidarcy ( md ) is a measure of permeability. Source: Adapted by Advanced Resources Int ’ l from “ Enhanced Oil Recovery ” , D.W. Green and G. P. Willhite , SPE, 1998.

Storing CO2 and Producing Domestic Crude Oil with Next Generation CO2-EOR Technology
20
The CO2-EOR WAG project at Means (San Andres Unit) was implemented as part of an integrated reservoir development plan and involve the drilling of 205 new producers and 158 new injectors.Initial objective was to inject 260 Bcf of CO2, equal to 55% HCPV, (0.4 HCPV purchased; 0.15 HCPV recycled) at a 2:1 WAG ratio. Latest objective is to inject 480 Bcf (~1 HCPV) of CO2. Increasing the volume of injected CO2 can also be achieved by increasing the rate of CO2 injection (not shown in this chart).
Actual field projects confirm that injection of higher volumes of CO2 lead to higher oil recovery.
Means (San Andres) @ 2:1 WAG Ratio
Source: SPE 24928 (1992)
20
15
10
5
0
25
403020 50100Years
Incr
emen
tal T
ertia
ry R
ecov
ery
-% O
OIP
0.8 HCPV
0.6 HCPV
0.4 HCPV
0.2 HCPV
JAF02772.PPT
Figure 9 - Science Behind Volume of CO2 Injection and Oil Recovery Efficiency: Actual Practice

Storing CO2 and Producing Domestic Crude Oil with Next Generation CO2-EOR Technology
21
Source: OXY Permian 2006
2001EDU 80% to 100% HCPV CO2 slug size increase approved
1996EDU 60% to 80% HCPV CO2 slug size increase approved
1994EDU 40% to 60% HCPV CO2 slug size increase approved
1992Non performing FIA patterns stopped (~20% HCPV CO2 slug size)
1989EDU WAG & start off CO2 injection in WAC, FIA, B8 FIA
1984Start of CO2 injection in EDU with 40% HCPV CO2 slug size
StartedEastern Denver Unit (Wasson Oil Field) CO2-EOR Project
Occidental Petroleum (Oxy Permian) is the industry leader for CO2-EOR, in terms of number of large projects, volume of CO2 used and volumes of oil production.
JAF02772.PPT
Figure 10 - Evolution of “Industry Standard” for Volume CO2 Injection (“Slug Size”)

Storing CO2 and Producing Domestic Crude Oil with Next Generation CO2-EOR Technology
22
Monitoring and well remediation can be used to target injected CO2 to reservoir strata with higher residual oil saturation.
0 20 40 60 80 1006,900
Dept
h
6,350
% Injected Before0 20 40 60 80 100
% Injected After
Well 27-6 Injection Profile
(Before) (After)
Source: “SACROC Unit CO2 Flood: Multidisciplinary Team Improves Reservoir Management andDecreases Operating Costs”, J.T. Hawkins, et al., SPE Reservoir Engineering, August 1996.
1839 Days(Channeling in Layer 2)
478 Days(BreakthroughIn Layer 2)
368 Days
Source: Adapted by Advanced Resources Int’l from “Enhanced Oil Recovery”, D.W. Green and G. P. Willhite, SPE, 1998.
Relative Location of the CO2/Water Front
0 100 200 300Distance, ft
Layer 1 (High Sor, Low k)Layer 2 (Low Sor, High k)Water
• Higher oil saturation portion of reservoir is often inefficiently swept.
• CO2 channeling can be reduced with well workoveror targeted well placement.
JAF02772.PPT
Figure 11 - Overcoming the Effects of Geologic Complexity on CO2-EOR Performance
Storing CO2 and Producing Domestic Crude Oil with Next Generation CO2-EOR Technology
23
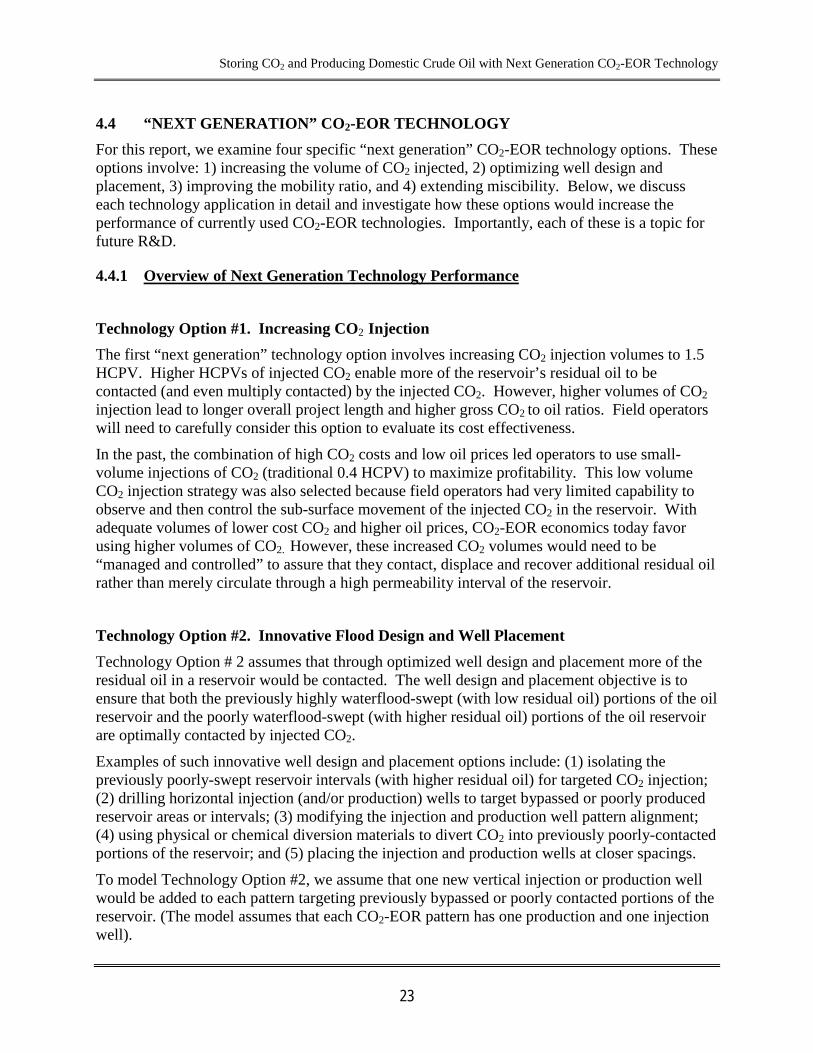
4.4 “NEXT GENERATION” CO2-EOR TECHNOLOGY For this report, we examine four specific “next generation” CO2-EOR technology options. These options involve: 1) increasing the volume of CO2 injected, 2) optimizing well design and placement, 3) improving the mobility ratio, and 4) extending miscibility. Below, we discuss each technology application in detail and investigate how these options would increase the performance of currently used CO2-EOR technologies. Importantly, each of these is a topic for future R&D.
4.4.1
Overview of Next Generation Technology Performance
Technology Option #1. Increasing CO2 Injection The first “next generation” technology option involves increasing CO2 injection volumes to 1.5 HCPV. Higher HCPVs of injected CO2 enable more of the reservoir’s residual oil to be contacted (and even multiply contacted) by the injected CO2. However, higher volumes of CO2 injection lead to longer overall project length and higher gross CO2 to oil ratios. Field operators will need to carefully consider this option to evaluate its cost effectiveness.
In the past, the combination of high CO2 costs and low oil prices led operators to use small-volume injections of CO2 (traditional 0.4 HCPV) to maximize profitability. This low volume CO2 injection strategy was also selected because field operators had very limited capability to observe and then control the sub-surface movement of the injected CO2 in the reservoir. With adequate volumes of lower cost CO2 and higher oil prices, CO2-EOR economics today favor using higher volumes of CO2. However, these increased CO2 volumes would need to be “managed and controlled” to assure that they contact, displace and recover additional residual oil rather than merely circulate through a high permeability interval of the reservoir.
Technology Option #2. Innovative Flood Design and Well Placement Technology Option # 2 assumes that through optimized well design and placement more of the residual oil in a reservoir would be contacted. The well design and placement objective is to ensure that both the previously highly waterflood-swept (with low residual oil) portions of the oil reservoir and the poorly waterflood-swept (with higher residual oil) portions of the oil reservoir are optimally contacted by injected CO2.
Examples of such innovative well design and placement options include: (1) isolating the previously poorly-swept reservoir intervals (with higher residual oil) for targeted CO2 injection; (2) drilling horizontal injection (and/or production) wells to target bypassed or poorly produced reservoir areas or intervals; (3) modifying the injection and production well pattern alignment; (4) using physical or chemical diversion materials to divert CO2 into previously poorly-contacted portions of the reservoir; and (5) placing the injection and production wells at closer spacings.
To model Technology Option #2, we assume that one new vertical injection or production well would be added to each pattern targeting previously bypassed or poorly contacted portions of the reservoir. (The model assumes that each CO2-EOR pattern has one production and one injection well).

Storing CO2 and Producing Domestic Crude Oil with Next Generation CO2-EOR Technology
24
Technology Option #3. Improving the Mobility Ratio Technology Option # 3 assumes that an increase in the viscosity of the injected water (as part of the CO2-WAG process) is achieved using polymers or other agents. (The viscosity of the CO2 itself was left unchanged, although increasing the viscosity of CO2 with CO2-philic agents, such as those being pursued in the joint DOE/University of Pittsburgh research program10, could theoretically further improve performance.) To model Technology Option # 3, we assume the viscosity of injected water is increased to 3cps11
, or three times the viscosity of water.
Technology Option #4. Extending Miscibility Technology Option # 4 assumes that “miscibility extenders” are added to the CO2-EOR process to reduce minimum miscibility pressure requirements by 500psi (pounds per square inch). Examples of miscibility enhancing agents would include: addition of Liquefied Petroleum Gasses (LPG) to the CO2, although this would lead to a more costly injection process; addition of H2S or other sulfur compounds, although this may lead to higher cost operations; and, use of other (to be developed) miscibility pressure or interfacial tension reduction agents. Successful application of Technology Option # 4 could allow 21 previously immiscible fields to become suitable for miscible CO2-EOR operations.
Technology Option # 5. Integrating Application of “Next Generation” Technology Options The maximum benefits, in terms of increased oil recovery, accrue when these four individual “next generation” technology options are applied jointly, and as part of a highly instrumented and process-controlled field operations strategy.
10 DOE Program Reference Number: DE-FC26-01BC15315. 11 A centipoise (cp) is the unit of measure for dynamic viscosity. Water has cp value of 1 at 20 degrees Celsius.

Storing CO2 and Producing Domestic Crude Oil with Next Generation CO2-EOR Technology
25
4.5 EXAMINING THE COSTS AND BENEFITS OF USING “NEXT GENERATION” EOR CO2 TECHNOLOGY Insights on the costs and benefits of conducting an integrated “next generation” CO2-EOR flood may be gained by examining the changes in oil production, capital investment, CO2 requirements and operating costs between using today’s “best practices” and using, in an integrated fashion, “next generation” CO2-EOR technologies. The example set forth is representative light oil field, Table 7 and Table 8.
Appendix B provides additional discussion of the “next generation” cost and economic model.
Table 7 - Economic Comparison of Alternative CO2-EOR Technologies – Example Light Oil Reservoir
Current Application of
“Best Practices” “Next Generation”
Technology* Oil Recovery (Million Barrels) 276 433
Oil Recovery (% OOIP) 17% 27%
Project Life (years) 22 32
CapEx ($/Bbl) $2.20 $3.00
CO2 Costs ($/Bbl)** $19.40 $17.00
OpEx ($/Bbl) $3.10 $5.20 *Includes extra costs for applying “next generation” CO2-EOR technology.
**Assumes long-term oil price of $70 per barrel, adjusted for gravity and location differentials, and $45/metric ton of CO2 .
Oil Recovery Oil recovery from the example light oil field (with 1,596 million barrels of original oil in-place) is estimated at 433 million barrels in 32 years under “next generation” CO2-EOR technology versus 276 million barrels in 22 years under “best practices” CO2-EOR technology.

Storing CO2 and Producing Domestic Crude Oil with Next Generation CO2-EOR Technology
26
Table 8 - Economic Comparison of Alternative CO2-EOR Technologies - Example Light Oil Reservoir*
Currently Used “Best Practices”
Application of “Next Generation” CO2-EOR
Technologies OIL RECOVERY (Million Barrels) 276 433
% OOIP 17% 27%
Project Life (years) 22 32
CAPITAL INVESTMENT (Million $)
Basic Cap Ex $615 $615
Additional Wells - $583
Larger CO2 Recycle Plant - $8
Process Control Measurements and Feedback - $99
Total $615 $1,305
CO2 COSTS (Million $)
Purchased CO2 $3,184 $3,799
Recycled CO2 $2,174 $3,546
Total $5,358 $7,345
OPERATING AND MAINTENANCE (Million $)
Basic OpEx $855 $855
Additional OpEx and Fluid Lifting - $970
Viscosity Enhancement and Mobility Control - $358
Real-Time Project Information and Management - $88
Total $855 $2,271 * Figures in millions of 2007 dollars, unless otherwise noted
Storing CO2 and Producing Domestic Crude Oil with Next Generation CO2-EOR Technology
27
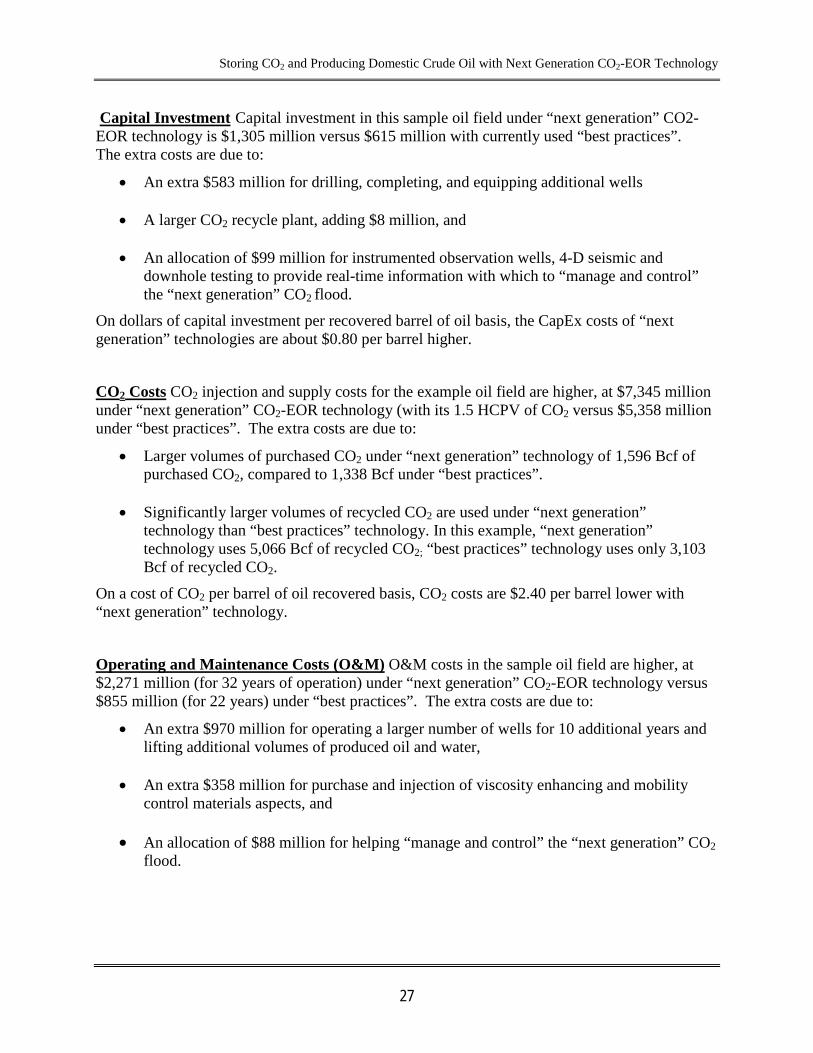
Capital Investment
• An extra $583 million for drilling, completing, and equipping additional wells
Capital investment in this sample oil field under “next generation” CO2-EOR technology is $1,305 million versus $615 million with currently used “best practices”. The extra costs are due to:
• A larger CO2 recycle plant, adding $8 million, and
• An allocation of $99 million for instrumented observation wells, 4-D seismic and
downhole testing to provide real-time information with which to “manage and control” the “next generation” CO2 flood.
On dollars of capital investment per recovered barrel of oil basis, the CapEx costs of “next generation” technologies are about $0.80 per barrel higher.
CO2 Costs
• Larger volumes of purchased CO2 under “next generation” technology of 1,596 Bcf of purchased CO2, compared to 1,338 Bcf under “best practices”.
CO2 injection and supply costs for the example oil field are higher, at $7,345 million under “next generation” CO2-EOR technology (with its 1.5 HCPV of CO2 versus $5,358 million under “best practices”. The extra costs are due to:
• Significantly larger volumes of recycled CO2 are used under “next generation”
technology than “best practices” technology. In this example, “next generation” technology uses 5,066 Bcf of recycled CO2; “best practices” technology uses only 3,103 Bcf of recycled CO2.
On a cost of CO2 per barrel of oil recovered basis, CO2 costs are $2.40 per barrel lower with “next generation” technology.
Operating and Maintenance Costs (O&M)
• An extra $970 million for operating a larger number of wells for 10 additional years and lifting additional volumes of produced oil and water,
O&M costs in the sample oil field are higher, at $2,271 million (for 32 years of operation) under “next generation” CO2-EOR technology versus $855 million (for 22 years) under “best practices”. The extra costs are due to:
• An extra $358 million for purchase and injection of viscosity enhancing and mobility
control materials aspects, and
• An allocation of $88 million for helping “manage and control” the “next generation” CO2 flood.

Storing CO2 and Producing Domestic Crude Oil with Next Generation CO2-EOR Technology
28
5.
Our reservoir-by-reservoir assessment of the 1,715 large oil reservoirs amenable to CO2-EOR (extrapolated to national totals) shows that a significant volume, 128 billion barrels, of domestic oil may be recoverable with the application of “next generation” CO2-EOR technologies, Table 9. Subtracting the 2.3 billion barrels of oil that has already been produced or placed into proved reserves by CO2-EOR (as of 2006), “next generation” CO2-EOR would add 126 billion barrels of technically recoverable oil to domestic supplies, Figure 12. For perspective, the current domestic proved crude oil reserves are 22 billion barrels, as of the end of 2007.
TECHNICALLY RECOVERABLE RESOURCES FROM “NEXT GENERATION” CO2-EOR OPERATIONS
The Permian Basin of West Texas and New Mexico, with its world class size, favorable geology and carbonate reservoirs, offers the largest volume of technically recoverable oil resource from CO2-EOR. In addition, significant potential exists in East and Central Texas, the Mid-Continent, the Gulf Coast and California.
Geologically complex oil reservoirs with large volumes of residual oil (due to low primary and secondary recovery sweep efficiencies) will be most benefitted by “next generation” technology. The more homogeneous sandstone reservoirs, such as those in the Gulf Coast which achieve high oil recovery efficiencies using current CO2-EOR practices, may not be favorable settings for “next generation” technology.
Table 9 - Technically Recoverable Resources from Applying “Next Generation” CO2-EOR:Totals from Extrapolating Advanced Resources’ Database to National Level
Basin/Area OOIP
(Billion Barrels)
OOIP Favorable for
CO2-EOR
(Billion Barrels)
Technically Recoverable
(Billion Barrels)
“Best Practices”
Technology
“Next Generation” Technology
1. Lower-48 Onshore 500.3 345.4 69 109.4
2. Offshore GOM 46.1 29.6 5.7 5.7
3. Alaska 50.7 42.5 8.6 12.7
Total 597.1 417.5 83.4 127.9
Please see Appendix D, Table D-9 for expanded version.

Storing CO2 and Producing Domestic Crude Oil with Next Generation CO2-EOR Technology
29
Figure 12 - Comparison of Technically Recoverable Resource between State of the Art and Next Generation CO2-EOR
Technologies
Remaining Unrecovered 267 Billion Barrels (45% of OOIP)
“ Next Generation ” 126 Billion Barrels
(21% of OOIP)
Conventional Recovery 204 Billion Barrels (34% of OOIP)
Technically Recoverable Resources Under “ Next Generation ” CO 2 - EOR Technology
Remaining Unrecovered 312 Billion Barrels (52% of OOIP)
“ Best Practices ” 81 Billion Barrels
(14% of OOIP)
Conventional Recovery 204 Billion Barrels (34% OOIP)
Technically Recoverable Resources Under “ Best Practices ” CO 2 - EOR Technology
OOIP = 597 Billion Barrels
Storing CO2 and Producing Domestic Crude Oil with Next Generation CO2-EOR Technology
30
6.
6.1 PERSPECTIVE ON CO2-EOR ECONOMICS
ECONOMICALLY RECOVERABLE RESOURCES
Given the significant front-end investment in wells, recycle equipment and purchase of CO2 and the time delay in reaching peak oil production, significant economic margins will be required to achieve economically favorable rates of return. Oil reservoirs with higher capital cost requirements and less favorable CO2 to oil ratios would not achieve sufficient return on investment, requiring credits for storing CO2 to make an integrated CO2-EOR and CO2 storage project economic.
6.2 ECONOMICALLY RECOVERABLE RESOURCES: BASE CASE The Base Case evaluates the “next generation” CO2-EOR potential using an oil price of $70 per barrel (constant, real) and a CO2 cost of $45 per metric ton ($2.38 per Mcf) (constant and real, delivered at pressure to the field). In the Base Case, 57.9 billion barrels of incremental oil become economically recoverable from applying “next generation” CO2-EOR technology, after subtracting the 2.3 billion barrels of oil already produced through existing CO2-EOR operations, Table 10.
The estimates of economically recoverable domestic oil from applying CO2-EOR have been calculated using a minimum financial hurdle rate of 15% (real, before tax). Higher financial hurdle requirements, appropriate for rapidly installing “next generation” CO2-EOR technology in new basins and geologic settings, would reduce the volumes of economically recoverable oil.
Storing CO2 and Producing Domestic Crude Oil with Next Generation CO2-EOR Technology
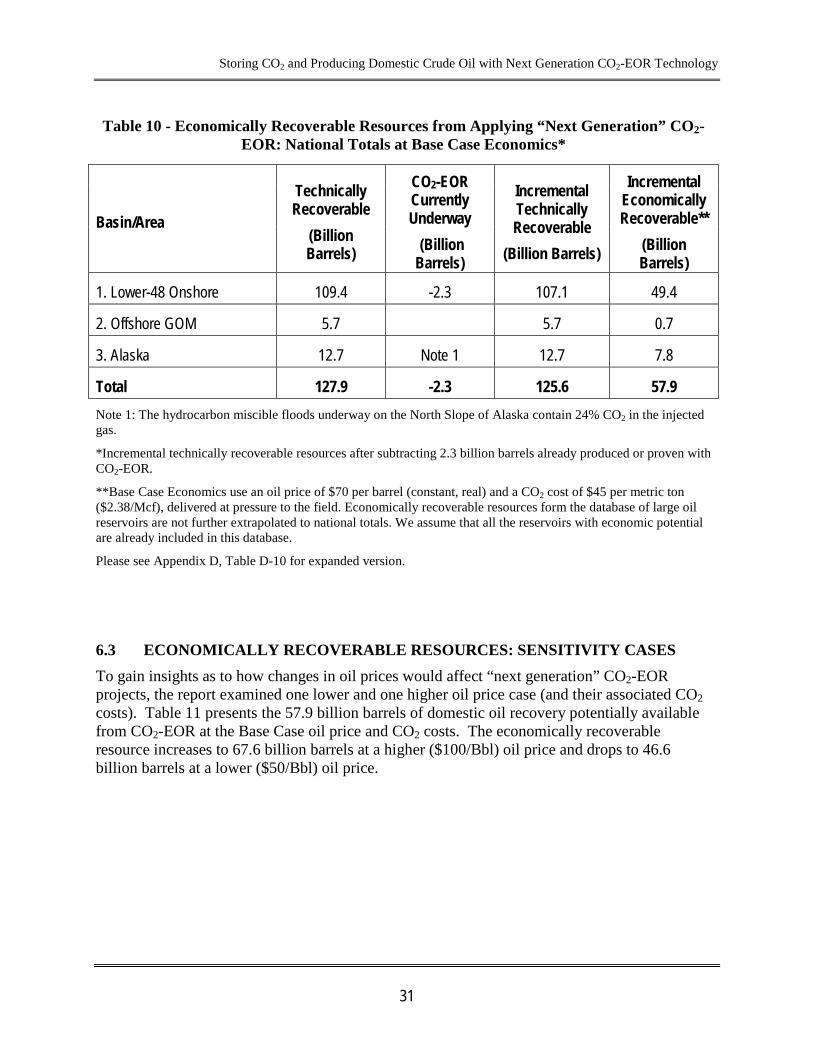
31
Table 10 - Economically Recoverable Resources from Applying “Next Generation” CO2-EOR: National Totals at Base Case Economics*
Basin/Area
Technically Recoverable
(Billion Barrels)
CO2-EOR Currently Underway
(Billion Barrels)
Incremental Technically Recoverable
(Billion Barrels)
Incremental Economically Recoverable**
(Billion Barrels)
1. Lower-48 Onshore 109.4 -2.3 107.1 49.4
2. Offshore GOM 5.7 5.7 0.7
3. Alaska 12.7 Note 1 12.7 7.8
Total 127.9 -2.3 125.6 57.9 Note 1: The hydrocarbon miscible floods underway on the North Slope of Alaska contain 24% CO2 in the injected gas.
*Incremental technically recoverable resources after subtracting 2.3 billion barrels already produced or proven with CO2-EOR.
**Base Case Economics use an oil price of $70 per barrel (constant, real) and a CO2 cost of $45 per metric ton ($2.38/Mcf), delivered at pressure to the field. Economically recoverable resources form the database of large oil reservoirs are not further extrapolated to national totals. We assume that all the reservoirs with economic potential are already included in this database.
Please see Appendix D, Table D-10 for expanded version.
6.3 ECONOMICALLY RECOVERABLE RESOURCES: SENSITIVITY CASES To gain insights as to how changes in oil prices would affect “next generation” CO2-EOR projects, the report examined one lower and one higher oil price case (and their associated CO2 costs). Table 11 presents the 57.9 billion barrels of domestic oil recovery potentially available from CO2-EOR at the Base Case oil price and CO2 costs. The economically recoverable resource increases to 67.6 billion barrels at a higher ($100/Bbl) oil price and drops to 46.6 billion barrels at a lower ($50/Bbl) oil price.

Storing CO2 and Producing Domestic Crude Oil with Next Generation CO2-EOR Technology
32
Table 11 - Economically Recoverable Resource from “Next Generation” CO2-EOR : National Totals at Alternative Economic Cases
Basin/Area
Base Case Lower Oil Price Case
Higher Oil Price Cases
($70/Bbl) ($50/Bbl) ($100/Bbl)
(Billion Barrels) (Billion Barrels) (Billion Barrels)
1. Lower-48 Onshore 49.4 43.1 54.9
2. Offshore GOM 0.7 0.5 2.4
3. Alaska 7.8 3.0 10.3
Total Demand 57.9 46.6 67.6
Please see Appendix D, Table D-11 for expanded version.

Storing CO2 and Producing Domestic Crude Oil with Next Generation CO2-EOR Technology
33
7. The previous chapters established that 126 billion barrels of additional domestic oil could be technically produced with “next generation” CO2-EOR technology. In addition, they established that 47 to 68 billion barrels could be economically produced with “next generation” technology. This chapter discusses first how much CO2 could be technically stored in domestic oil fields (storage capacity) and second how much CO2 would be required to be purchased (and stored) to produce the economically recoverable oil.
THE MARKET FOR STORING CO2 WITH EOR
7.1 THE CO2 INJECTION AND STORAGE PROCESS OF CO2-EOR The sequence for injecting and storing CO2 as part of CO2-EOR is as follows:
• Initially, purchased or captured CO2 emissions would be injected into the oil field along with water for mobility control.
• As oil and CO2 begins to be produced, the CO2 is separated from the oil and reinjected, continuing the life of the CO2-EOR project.
• Near the end of the CO2-EOR project, the operator may choose to close the field at pressure, storing essentially all of the purchased CO2, or may inject a large (1 to 2 HCPV) slug of water to recover any remaining mobile oil and CO2. This produced CO2 may then be used in another portion of the reservoir or sold to another oil field.
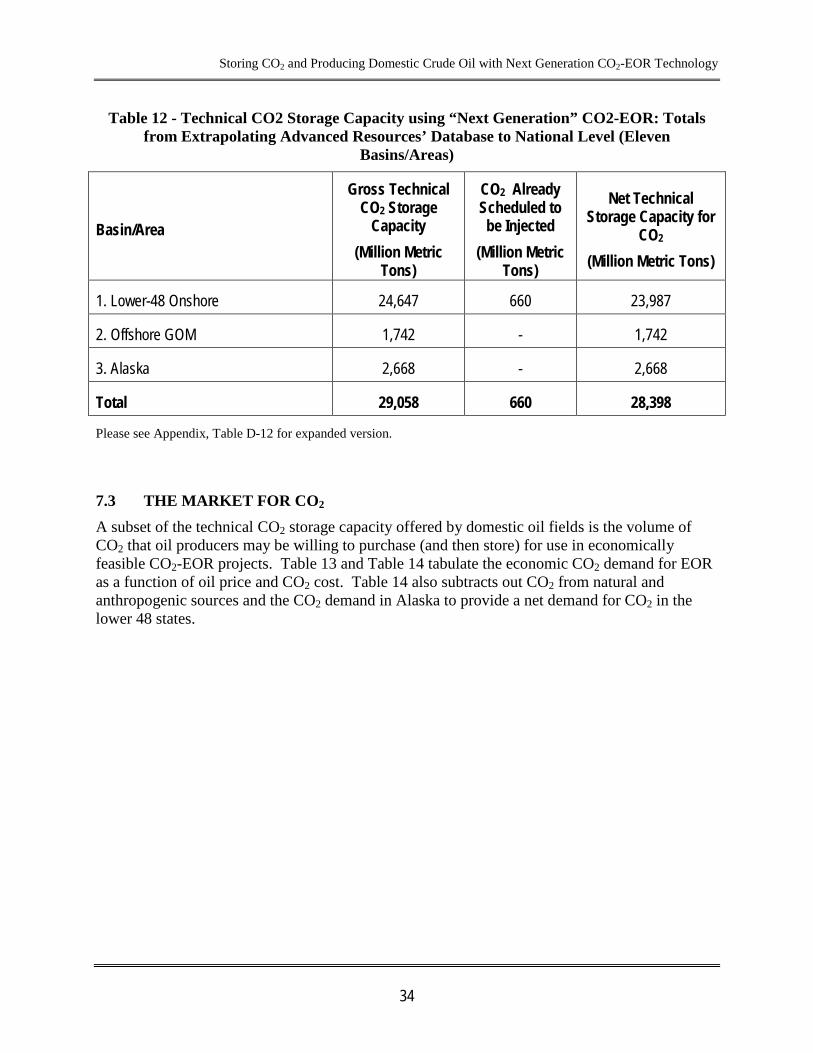
7.2 CO2 STORAGE CAPACITY The analysis shows that significant volumes of captured CO2 emissions could be injected and stored with “next generation” CO2 EOR, creating 28.4 billion metric tons of technical CO2 storage capacity, Table 12. This number is only a fraction of the 138 million metric tons mentioned in the NETL Carbon Sequestration Atlas12
12 “2008 Carbon Sequestration Atlas of the United States and Canada, Second Addition”, U.S. Dept. of Energy, Office of Fossil Energy, National Energy Technology Laboratory, 2008
as potentially available storage in oil and gas reservoirs. These numbers are not comparable as the CO2 stored in this report is determined analytically by a stream tube predictive model and represents the amount of CO2 sequestered in active pursuit of enhanced oil recovery. Storage only occurs in oil reservoirs which screen as being acceptable candidates for EOR. The maximum CO2 injected in this process is defined as part of the technology being modeled. In Contrast, the number in the Sequestration Atlas is the result of a calculation in which all producible oil and gas originally found in geologic formations is replaced with an equivalent volume of CO2.
http://www.netl.doe.gov/technologies/carbon_seq/refshelf/atlasII
Storing CO2 and Producing Domestic Crude Oil with Next Generation CO2-EOR Technology
34
Table 12 - Technical CO2 Storage Capacity using “Next Generation” CO2-EOR: Totals from Extrapolating Advanced Resources’ Database to National Level (Eleven
Basins/Areas)
Basin/Area
Gross Technical CO2 Storage
Capacity
(Million Metric Tons)
CO2 Already Scheduled to be Injected
(Million Metric Tons)
Net Technical Storage Capacity for
CO2
(Million Metric Tons)
1. Lower-48 Onshore 24,647 660 23,987
2. Offshore GOM 1,742 - 1,742
3. Alaska 2,668 - 2,668
Total 29,058 660 28,398
Please see Appendix, Table D-12 for expanded version.
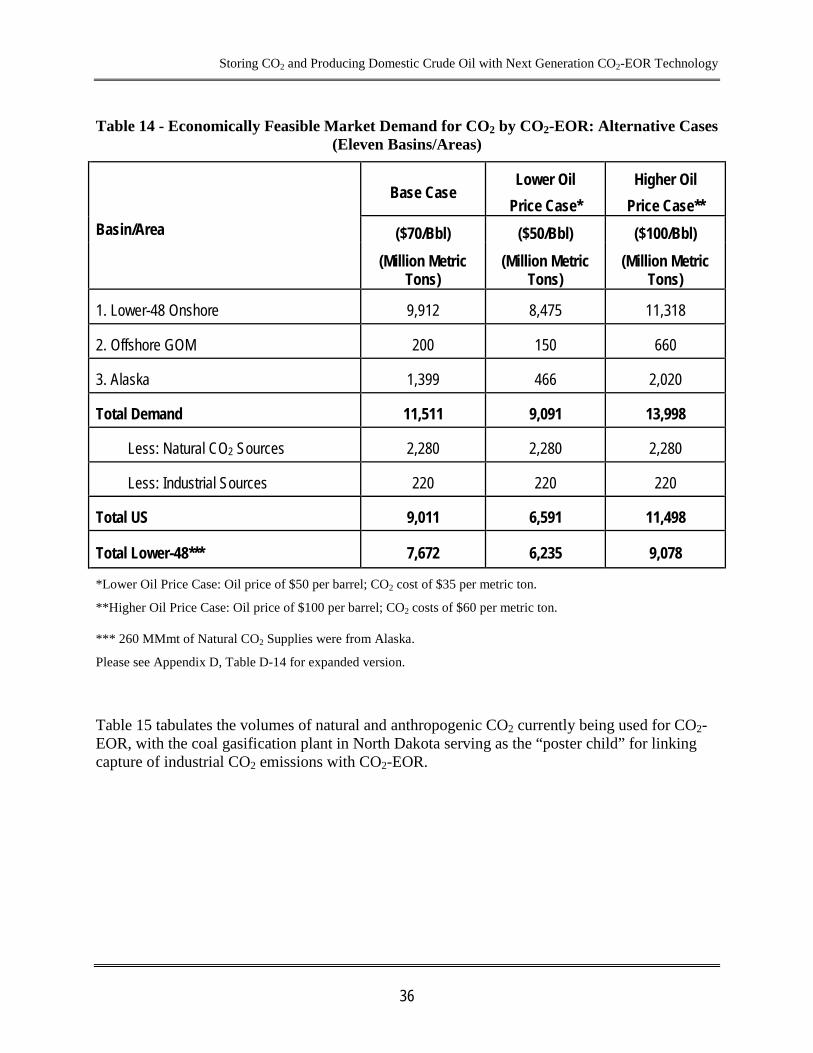
7.3 THE MARKET FOR CO2 A subset of the technical CO2 storage capacity offered by domestic oil fields is the volume of CO2 that oil producers may be willing to purchase (and then store) for use in economically feasible CO2-EOR projects. Table 13 and Table 14 tabulate the economic CO2 demand for EOR as a function of oil price and CO2 cost. Table 14 also subtracts out CO2 from natural and anthropogenic sources and the CO2 demand in Alaska to provide a net demand for CO2 in the lower 48 states.

Storing CO2 and Producing Domestic Crude Oil with Next Generation CO2-EOR Technology
35
Table 13 – Economically Feasible Market for CO2 for “Next Generation” CO2-EOR: Base case* (Eleven Basins/Areas)
Basin/Area
Gross Market for CO2
(Million Metric Tons)
CO2 Already or Scheduled to be Injected
(Million Metric Tons)
Net New Market for CO2
(Million Metric Tons)
“Best Practices”
“Next Generation”
“Best Practices”
“Next Generation”
1. Lower-48 Onshore 9,061 10,752 660 8,401 9,912
2. Offshore GOM 200 200 - 200 200
3. Alaska 440 1,399 - 440 1,399
Total 9,701 12,171 660 9,041 11,511
*Base Case: Oil price of $70 per barrel; CO2 cost of $45 per metric ton.
Please see Appendix D, Table D-13 for expanded version.
In the Base Case, net economic CO2 demand is approximately 9.0 billion metric tons, equal to the amount of CO2 that could be captured from 48 GWs of coal fired power plant capacity over 30 years13
The demand for CO2 from the EOR market can be an important source of revenue for the initial set of power plants that invest in CO2 capture.
. (A major portion of this CO2 demand is from lower-48 oil fields and equals 7.7 billion metric tons, Table 14.) As such, “next generation” technology creates a significantly larger demand for CO2 than created by “best practice” CO2-EOR technologies, where the net CO2 demand was 6.5 gigatons, equal to the emissions from 35 GWs of coal-fired power capacity (in the “best practices” case, Lower-48 oil field CO2 demand is 6.2 gigatons).
13 Assuming 85% capacity factor and 34% efficiency. A 1GW powerplant with these specifications would generate 223 billion kWh of electricity in thirty years (1GW * 85% * 8.76 (conversion between GW and billion kWh/year) * 30 years). With a CO2 intensity of .94 million tons CO2/kWh (thermodynamic equivalency based on efficiency of power plant and emissions profile of coal) and 90% capture, this power plant could supply 188 million tons of CO2 in 30 years.
Storing CO2 and Producing Domestic Crude Oil with Next Generation CO2-EOR Technology
36
Table 14 - Economically Feasible Market Demand for CO2 by CO2-EOR: Alternative Cases (Eleven Basins/Areas)
Basin/Area
Base Case Lower Oil
Price Case* Higher Oil
Price Case** ($70/Bbl) ($50/Bbl) ($100/Bbl)
(Million Metric Tons)
(Million Metric Tons)
(Million Metric Tons)
1. Lower-48 Onshore 9,912 8,475 11,318
2. Offshore GOM 200 150 660
3. Alaska 1,399 466 2,020
Total Demand 11,511 9,091 13,998
Less: Natural CO2 Sources 2,280 2,280 2,280
Less: Industrial Sources 220 220 220
Total US 9,011 6,591 11,498
Total Lower-48*** 7,672 6,235 9,078
*Lower Oil Price Case: Oil price of $50 per barrel; CO2 cost of $35 per metric ton.
**Higher Oil Price Case: Oil price of $100 per barrel; CO2 costs of $60 per metric ton.
*** 260 MMmt of Natural CO2 Supplies were from Alaska.
Please see Appendix D, Table D-14 for expanded version.
Table 15 tabulates the volumes of natural and anthropogenic CO2 currently being used for CO2-EOR, with the coal gasification plant in North Dakota serving as the “poster child” for linking capture of industrial CO2 emissions with CO2-EOR.

Storing CO2 and Producing Domestic Crude Oil with Next Generation CO2-EOR Technology
37
Table 15 - Existing CO2 Supplies – volumes of CO2 injected for EOR
State/ Province (storage location)
Source Type (location)
CO2 Supply MMcfd**
Natural Anthropogenic
Texas-Utah-New Mexico- Oklahoma
Geologic (Colorado-New Mexico) Gas Processing (Texas) 1,820 105
Colorado-Wyoming Gas Processing (Wyoming) - 230
Mississippi Geologic (Mississippi) 700 -
Michigan Ammonia Plant (Michigan) - 15
Oklahoma Fertilizer Plant (Oklahoma) - 30
Saskatchewan Coal Gasification (North Dakota) - 150
TOTAL 2,520 530 * Source: Advanced Resources, 2009
** MMcfd of CO2 can be converted to million metric tons per year by first multiplying by 365 (days per year) and then dividing by 18.9 * 103 (Mcf per metric ton).

Storing CO2 and Producing Domestic Crude Oil with Next Generation CO2-EOR Technology
A-1
APPENDIX A: STUDY METHODOLOGY
Storing CO2 and Producing Domestic Crude Oil with Next Generation CO2-EOR Technology
A-2
A.1 OVERVIEW
A six part methodology was used to assess the CO2 storage and EOR potential of domestic oil reservoirs. The six steps were: (1) assembling the Major Oil Reservoirs Database; (2) calculating the minimum miscibility pressure; (3) screening reservoirs for CO2-EOR; (4) calculating oil recovery; (5) assembling the cost and economic model; and, (6) performing economic and sensitivity analyses.
A.2 ASSEMBLING THE MAJOR OIL RESERVOIRS DATA BASE
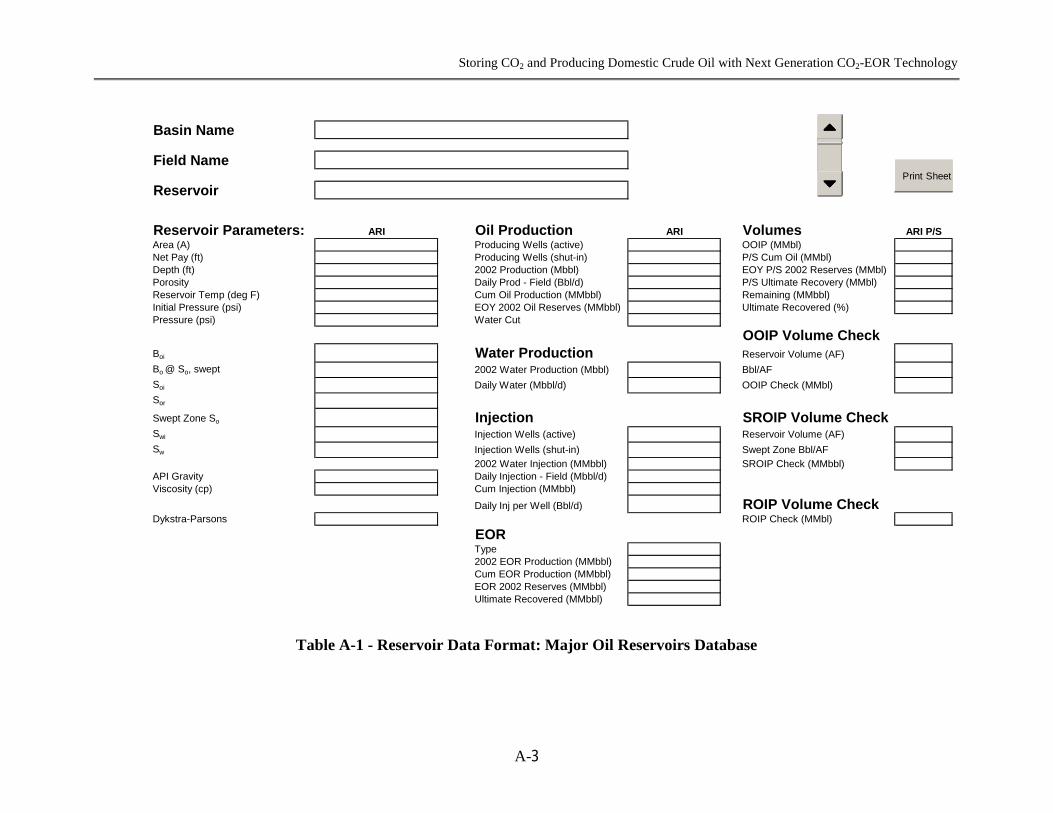
Table A-1 illustrates the oil reservoir data recording format developed by the study. The data format readily integrates with the input data required by the CO2-EOR screening and oil recovery models, discussed below. Overall, the Major Oil Reservoirs Database contains 2,012 reservoirs, accounting for 74% of the oil expected to be ultimately produced in the U.S. by primary and secondary oil recovery processes.
The study started with the database used in the previous set of “basins studies”. The study updated and augmented this database by incorporating the internally prepared Appalachian Basin Database and by making other improvements to this database.
Considerable effort was required to construct an up-to-date, volumetrically consistent database that contained all of the essential data, formats and interfaces to enable the study to: (1) develop an accurate estimate of the size of the original and remaining oil in-place; (2) reliably screen the reservoirs as to their amenability for miscible and immiscible CO2-EOR; and, (3) provide the CO2-PROPHET Model the essential input data for calculating CO2 injection requirements and oil recovery.
Storing CO2 and Producing Domestic Crude Oil with Next Generation CO2-EOR Technology
A-3
Basin Name
Field Name
Reservoir
Reservoir Parameters: ARI Oil Production ARI Volumes ARI P/SArea (A) Producing Wells (active) OOIP (MMbl)Net Pay (ft) Producing Wells (shut-in) P/S Cum Oil (MMbl)Depth (ft) 2002 Production (Mbbl) EOY P/S 2002 Reserves (MMbl)Porosity Daily Prod - Field (Bbl/d) P/S Ultimate Recovery (MMbl)Reservoir Temp (deg F) Cum Oil Production (MMbbl) Remaining (MMbbl)Initial Pressure (psi) EOY 2002 Oil Reserves (MMbbl) Ultimate Recovered (%)Pressure (psi) Water Cut
OOIP Volume CheckBoi Water Production Reservoir Volume (AF)Bo @ So, swept 2002 Water Production (Mbbl) Bbl/AFSoi Daily Water (Mbbl/d) OOIP Check (MMbl)Sor
Swept Zone So Injection SROIP Volume CheckSwi Injection Wells (active) Reservoir Volume (AF)Sw Injection Wells (shut-in) Swept Zone Bbl/AF
2002 Water Injection (MMbbl) SROIP Check (MMbbl)API Gravity Daily Injection - Field (Mbbl/d)Viscosity (cp) Cum Injection (MMbbl)
Daily Inj per Well (Bbl/d) ROIP Volume CheckDykstra-Parsons ROIP Check (MMbl)
EOR Type2002 EOR Production (MMbbl)Cum EOR Production (MMbbl)EOR 2002 Reserves (MMbbl)Ultimate Recovered (MMbbl)
Print SheetsPrint Sheets
Table A-1 - Reservoir Data Format: Major Oil Reservoirs Database

Storing CO2 and Producing Domestic Crude Oil with Next Generation CO2-EOR Technology
A-4
A.3 CALCULATING MINIMUM MISCIBILITY PRESSURE
To determine the minimum miscibility pressure (MMP) for any given reservoir, the study used the Cronquist correlation, Figure A-1. This formulation determines MMP based on reservoir temperature and the molecular weight (MW) of the pentanes and heavier fractions of the reservoir oil, without considering the mole percent of methane. (Most Gulf Coast oil reservoirs have produced the bulk of their methane during primary and secondary recovery.) The Cronquist correlation is set forth below:
The miscibility of a reservoir’s oil with injected CO2 is a function of pressure, temperature and the composition of the reservoir’s oil. The study’s approach to estimating whether a reservoir’s oil will be miscible with CO2, given fixed temperature and oil composition, was to determine whether the reservoir would hold sufficient pressure to attain miscibility. Where oil composition data was missing, a correlation was used for translating the reservoir’s oil gravity to oil composition.
MMP = 15.988*T (0.744206+0.0011038*MW C5+)
Where: T is Temperature in °F, and MW C5+ is the molecular weight of pentanes and heavier fractions in the reservoir’s oil.
The temperature of the reservoir was taken from the database or estimated from the thermal gradient in the basin. The molecular weight of the pentanes and heavier fraction of the oil was obtained from the database or was estimated from a correlative plot of MW C5+ and oil gravity, shown in Figure A-2.
The next step was calculating the minimum miscibility pressure (MMP) for a given reservoir and comparing it to the maximum allowable pressure. The maximum pressure was determined using a pressure gradient of 0.6 psi/foot. If the minimum miscibility pressure was below the maximum injection pressure, the reservoir was classified as a miscible flood candidate. Oil reservoirs that did not screen positively for miscible CO2-EOR were selected for consideration by immiscible CO2-EOR.

Storing CO2 and Producing Domestic Crude Oil with Next Generation CO2-EOR Technology
A-5
Mole Weight C5+
70 110 150 190 230 2700
1000
2000
3000
4000
5000
6000
Mis
cibi
lity
Pres
sure
, psi
Temperature, oF
340 300 280 260 240 220 200
180
Correlation for CO2 Minimum Pressure as a Function of Temperature(Mungan, N., Carbon Dioxide Flooding Fundamentals, 1981)
Mole Weight C5+
70 110 150 190 230 2700
1000
2000
3000
4000
5000
6000
Mis
cibi
lity
Pres
sure
, psi
Temperature, oF
340 300 280 260 240 220 200
180
Correlation for CO2 Minimum Pressure as a Function of Temperature(Mungan, N., Carbon Dioxide Flooding Fundamentals, 1981)
y = 4247.98641x-0.87022
R2 = 0.99763
0
100
200
300
400
500
0 20 40 60 80 100
Tank Oil Gravity, oAPI
Mol
ecul
ar W
T C
5+
y = 4247.98641x-0.87022
R2 = 0.99763
0
100
200
300
400
500
0 20 40 60 80 100
Tank Oil Gravity, oAPI
Mol
ecul
ar W
T C
5+
Figure A-1 - Estimating CO2 Minimum Miscibility Pressure
Figure A-2 - Correlation of MW C5+ to Tank Oil Gravity

Storing CO2 and Producing Domestic Crude Oil with Next Generation CO2-EOR Technology
A-6
A.4 SCREENING RESERVOIRS FOR CO2-EOR
The preliminary screening steps involved selecting the deeper oil reservoirs that had sufficiently high oil gravity. A minimum reservoir depth of 3,000 feet, at the mid-point of the reservoir, was used to ensure the reservoir could accommodate high pressure CO2 injection. A minimum oil gravity of 17.5 oAPI was used to ensure the reservoir’s oil had sufficient mobility, without requiring thermal injection.
The database was screened for reservoirs that would be applicable for CO2-EOR. Five prominent screening criteria were used to identify favorable reservoirs. These were: reservoir depth, oil gravity, reservoir pressure, reservoir temperature, and oil composition. These values were used to establish the minimum miscibility pressure for conducting miscible CO2-EOR and for selecting reservoirs that would be amenable to this oil recovery process. Reservoirs not meeting the miscibility pressure standard were considered for immiscible CO2-EOR.
A.5 CALCULATING OIL RECOVERY
• CO2-PROPHET generates streamlines for fluid flow between injection and production wells, and
The study utilized CO2-PROPHET to calculate incremental oil produced using CO2-EOR.
• The model performs oil displacement and recovery calculations along the established
streamlines. (A finite difference routine is used for oil displacement calculations.)
Even with these improvements, it is important to note the CO2-PROPHET is still primarily a “screening-type” model, and lacks some of the key features, such as gravity override and compositional changes to fluid phases, available in more sophisticated reservoir simulators.
A.6 ASSEMBLING THE COST MODEL
The cost model also accounts for normal well operation and maintenance (O&M), for lifting costs of the produced fluids, and for costs of capturing, separating and reinjecting the produced CO2. A variety of CO2 purchase and reinjection costs options are available to the model user.
A detailed, up-to-date CO2-EOR Cost Model was developed by the study. The model includes costs for: (1) drilling new wells or reworking existing wells; (2) providing surface equipment for new wells; (3) installing the CO2 recycle plant; (4) constructing a CO2 spur-line from the main CO2 trunkline to the oil field; and, (5) various miscellaneous costs.
A.7 CONSTRUCTING AN ECONOMICS MODEL The economic model used by the study is an industry standard cash flow model that can be run on either a pattern or a field-wide basis. The economic model accounts for royalties, severance and ad valorem taxes, as well as any oil gravity and market location discounts (or premiums) from the “marker” oil price. A variety of oil prices are available to the model user.

Storing CO2 and Producing Domestic Crude Oil with Next Generation CO2-EOR Technology
B-1
APPENDIX B: ECONOMICS OF “NEXT GENERATION” CO2-EOR TECHNOLOGY

Storing CO2 and Producing Domestic Crude Oil with Next Generation CO2-EOR Technology
B-2
B1. BASIC ECONOMIC MODEL. The economic model used in the analysis draws on the previously published economic models in the above mentioned “Storing CO2 with Enhanced Oil Recovery” report. This basic economic model was modified to incorporate the additional costs associated with applying “next generation” CO2-EOR technology in the field. The specific process and cost changes incorporated into the “next generation” CO2-EOR version of the economic model are set forth below.
• Oil and Water Production.
The oil production and CO2 injection rates from applying “next generation” CO2-EOR technology and the increase in the life of the CO2-EOR project were estimated using PROPHET2. This involved assembling the reservoir properties for each of the reservoirs and then placing them into the PROPHET2 stream-tube reservoir model to calculate CO2 injection and oil and water production versus time.
• CO2 Injection.
The capital investment costs for the CO2 recycle plant were scaled to reflect the higher peak recycled CO2 volumes in the “next generation” technology cases.
The costs of injecting CO2 were estimated using the same pricing formula assumed in the “Storing CO2 with Enhanced Oil recovery” report of $45/mt CO2 ($2.38/Mcf) @ $70/BBl Oil. The cost of recycled CO2 (per Mcf) is 1 percent of oil price ($/Bbl).
• Additional Costs for Applying “Next Generation” CO2-EOR Technology.
o Increased Volume of CO2 Injection. The costs for purchasing, recycling, and injecting 1.5 HCPV of CO2 are included in the “next generation” economic model.
Four additional modifications were made to the cost and economics model to account for the costs of applying each of the “next generation” CO2-EOR technologies, as set forth below:
o Innovative Flood Design and Well Placement. The “next generation” economic
model assumes that one additional new vertical production well would be added to each pattern. This well would produce from previously bypassed or poorly contacted portions of the reservoir. (The model assumes that each pattern already has or drills one production and one injection well.)
o Viscosity Enhancement. The economic model assumes that the water injection costs for the CO2-WAG process are increased by $0.25 per barrel of injected water to account for the addition of viscosity enhancers and other mobility control agents or actions.
o Flood Performance Diagnostics and Control. The economic model assumes that the “next generation” CO2-EOR project is supported by a fully staffed technical team (geologists, reservoir engineers, and economic analysts), uses a series of observation wells and downhole sensors to monitor the progress of the flood, and conducts periodic 4-D seismic plus pressure and residual oil saturation measurements to “optimize, manage, and control” the CO2 flood. The “next generation” economic model adds 10 percent to the initial capital investment and

Storing CO2 and Producing Domestic Crude Oil with Next Generation CO2-EOR Technology
B-3
10 percent to the annual operating costs of the CO2 flood to cover these extra costs.

Storing CO2 and Producing Domestic Crude Oil with Next Generation CO2-EOR Technology
C-1
APPENDIX C: CO2-EOR USING GRAVITY STABLE CO2 INJECTION AND OIL DISPLACEMENT

Storing CO2 and Producing Domestic Crude Oil with Next Generation CO2-EOR Technology
C-2
A large Gulf Coast oil reservoir with 329 million barrels (OOIP) in the main pay zone has been selected as the “case study” for this analysis. The gravity stable CO2-EOR flood design is shown in Figure C-1, below. The starting conditions of the sample Gulf Coast reservoir are as follows:
• The primary/secondary oil recovery in this oil reservoir is favorable at 148 million barrels, equal to 45% of OOIP. Even with this favorable oil recovery using conventional practices, 181 million barrels is left behind (“stranded”).
• In addition, another 100 million barrels of essentially immobile residual oil exists in the underlying 130 feet of the transition/residual oil zone (TZ/ROZ).
• Below the TZ/ROZ is an underlying saline reservoir with 195 feet of thickness, holding considerable CO2 storage capacity.
Based on the above, the theoretical CO2 storage capacity of this oil reservoir and structural closure is 2,710 Bcf (143 million metric tons). One purpose of the gravity stable design is to utilize as much of the safe and secure CO2 storage capacity as possible.
Assuming there is value to storing CO2 with gravity stable CO2-EOR and sequestration technology, much more CO2 can be stored relative to “next generation” technology and more oil becomes potentially recoverable:
• CO2 storage increases by 3 to 4 fold to 109 million tons with 76% of the theoretical storage capacity utilized.
• Oil recovery is increased by two fold, to 180 million barrels, containing 72 million tons of CO2 (when combusted). Importantly, 109 billion tons of CO2 is injected and stored during the EOR flood. As such. more CO2 is stored than contained in the produced oil, making the produced oil “green.”
Table C-1 - Case Study: Integration of “Next Generation” CO2 Storage with EOR
“Next Generation” “Second Generation” CO2-EOR &
Storage
CO2-EOR CO2-EOR Seq. Total
CO2 Storage (tonnes) 32 76 33 109
Storage Capacity Utilization 22% 53% 23% 76%
Oil Recovery (barrels) 92 180 - 180
% Carbon Neutral (“Green Oil”) 87% 106% - 151%

Storing CO2 and Producing Domestic Crude Oil with Next Generation CO2-EOR Technology
C-3
Figure C-1 - Illustration of Gravity Stable Integration of CO2 Storage and EOR

Storing CO2 and Producing Domestic Crude Oil with Next Generation CO2-EOR Technology
D-1
APPENDIX D: DETAILED REGION-LEVEL TABLES

Storing CO2 and Producing Domestic Crude Oil with Next Generation CO2-EOR Technology
D-2
Table D-3 - National In-Place, Conventionally Recoverable and “Stranded” Crude Oil Resources
Basin/Area OOIP
(Billion Barrels)
Conventionally Recoverable
ROIP “Stranded”
(Billion Barrels)
% of OOIP
(Billion Barrels)
1. Alaska 50.7 21.9 43% 28.8
2. California 83.3 26.0 31% 57.3
3. Gulf Coast (AL, FL, MS, LA) 44.4 16.9 38% 27.5
4. Mid-Continent (OK, AR, KS, NE) 89.6 24.0 27% 65.6
5. Illinois/Michigan 17.8 6.3 35% 11.5
6. Permian (W TX, NM) 95.4 33.7 35% 61.7
7. Rockies (CO,UT,WY) 33.6 11.0 33% 22.6
8. Texas, East/Central 109.0 35.4 32% 73.6
9. Williston (MT, ND, SD) 13.2 3.8 29% 9.4
10. Offshore GOM 46.1 20.9 45% 25.2
11. Appalachia (WV, OH, KY, PA) 14.0 3.9 28% 10.1
Total 597.1 203.8 34% 393.3

Storing CO2 and Producing Domestic Crude Oil with Next Generation CO2-EOR Technology
D-3
Table D-4 – Comparison of National and Database Domestic Oil Resource Base
Basin/Area National Data
OOIP*
(Billion Barrels)
Major Oil Reservoirs Database
OOIP*
(Billion Barrels)
Database Coverage
(%)
1. Alaska 50.7 50.7 100
2. California 83.3 75.2 90
3. Gulf Coast (AL, FL, MS, LA) 44.4 26.4 60
4. Mid-Continent (OK, AR, KS, NE) 89.6 53.1 59
5. Illinois/Michigan 17.8 12.0 67
6. Permian (W TX, NM) 95.4 72.4 76
7. Rockies (CO,UT,WY) 33.6 23.7 70
8. Texas, East/Central 109.0 67.4 62
9. Williston (MT, ND, SD) 13.2 9.4 71
10. Offshore GOM 46.1 46.1 100
11. Appalachia (WV, OH, KY, PA) 14.0 10.6 76
Total 597.1 447.0 75 *Original Oil In-Place
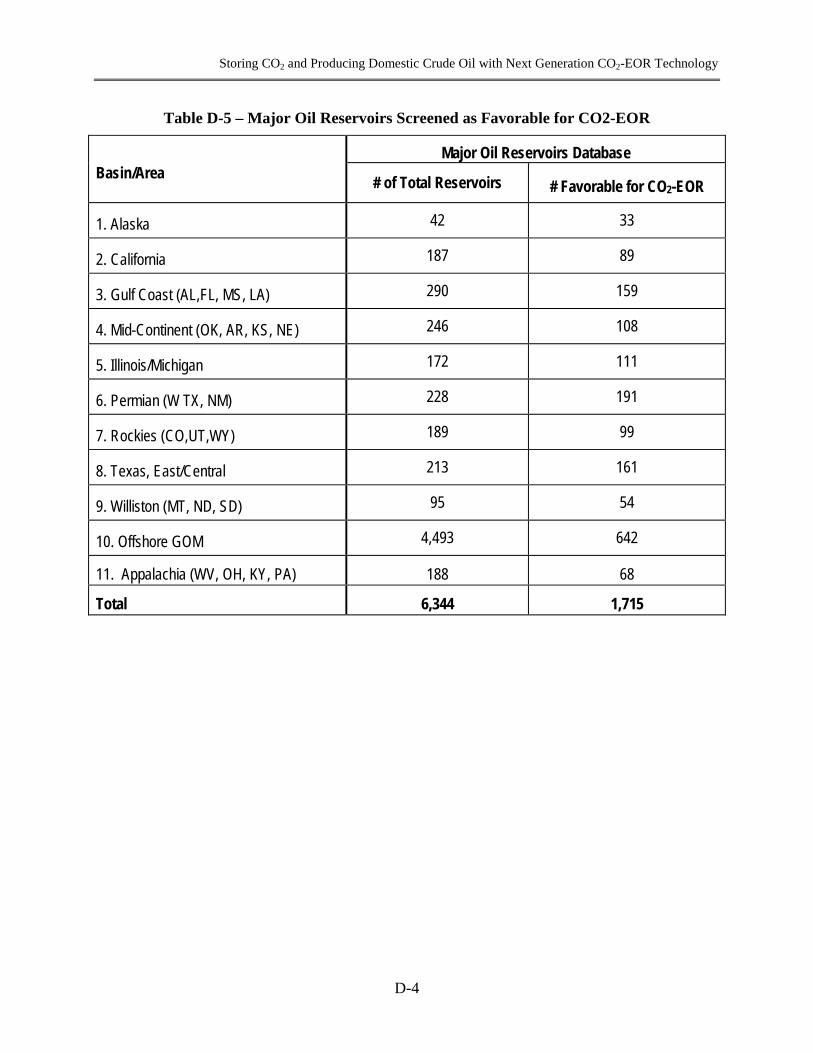
Storing CO2 and Producing Domestic Crude Oil with Next Generation CO2-EOR Technology
D-4
Table D-5 – Major Oil Reservoirs Screened as Favorable for CO2-EOR
Basin/Area Major Oil Reservoirs Database
# of Total Reservoirs # Favorable for CO2-EOR
1. Alaska 42 33
2. California 187 89
3. Gulf Coast (AL,FL, MS, LA) 290 159
4. Mid-Continent (OK, AR, KS, NE) 246 108
5. Illinois/Michigan 172 111
6. Permian (W TX, NM) 228 191
7. Rockies (CO,UT,WY) 189 99
8. Texas, East/Central 213 161
9. Williston (MT, ND, SD) 95 54
10. Offshore GOM 4,493 642
11. Appalachia (WV, OH, KY, PA) 188 68
Total 6,344 1,715
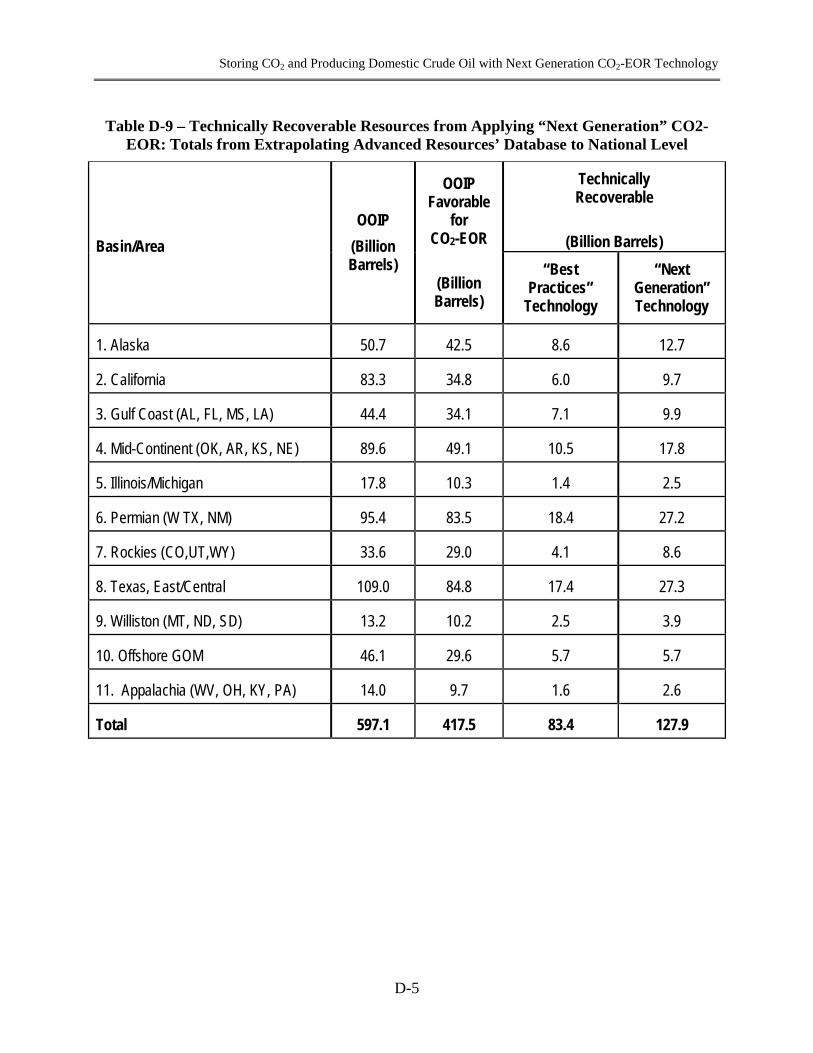
Storing CO2 and Producing Domestic Crude Oil with Next Generation CO2-EOR Technology
D-5
Table D-9 – Technically Recoverable Resources from Applying “Next Generation” CO2-EOR: Totals from Extrapolating Advanced Resources’ Database to National Level
Basin/Area OOIP
(Billion Barrels)
OOIP Favorable
for CO2-EOR
(Billion Barrels)
Technically Recoverable
(Billion Barrels)
“Best Practices”
Technology
“Next Generation” Technology
1. Alaska 50.7 42.5 8.6 12.7
2. California 83.3 34.8 6.0 9.7
3. Gulf Coast (AL, FL, MS, LA) 44.4 34.1 7.1 9.9
4. Mid-Continent (OK, AR, KS, NE) 89.6 49.1 10.5 17.8
5. Illinois/Michigan 17.8 10.3 1.4 2.5
6. Permian (W TX, NM) 95.4 83.5 18.4 27.2
7. Rockies (CO,UT,WY) 33.6 29.0 4.1 8.6
8. Texas, East/Central 109.0 84.8 17.4 27.3
9. Williston (MT, ND, SD) 13.2 10.2 2.5 3.9
10. Offshore GOM 46.1 29.6 5.7 5.7
11. Appalachia (WV, OH, KY, PA) 14.0 9.7 1.6 2.6
Total 597.1 417.5 83.4 127.9

Storing CO2 and Producing Domestic Crude Oil with Next Generation CO2-EOR Technology
D-6
Table D-10 – Economically Recoverable Resources from Applying “Next Generation” CO2-EOR: National Totals at Base Case Economics*
Basin/Area
Technically Recoverable
(Billion Barrels)
CO2-EOR Currently Underway (Billion Barrels)
Incremental Technically Recoverable
(Billion Barrels)
Incremental Economically Recoverable**
(Billion Barrels)
1. Alaska 12.7 Note 1 12.7 7.8
2. California 9.7 9.7 7.7
3. Gulf Coast (AL, FL, MS, LA) 9.9 9.9 2.5
4. Mid-Continent (OK, AR, KS, NE) 17.8 -0.1 17.7 9.1
5. Illinois/Michigan 2.5 .5 1.1
6. Permian (W TX, NM) 27.2 -1.9 25.3 12.1
7. Rockies (CO,UT,WY) 8.6 -0.3 8.3 4.3
8. Texas, East/Central 27.3 27.3 11.8
9. Williston (MT, ND, SD) 3.9 3.9 0.7
10. Offshore GOM 5.7 5.7 0.7
11. Appalachia (WV, OH, KY, PA) 2.6 2.6 0.1
Total 127.9 -2.3 125.6 57.9 Note 1: The hydrocarbon miscible floods underway on the North Slope of Alaska contain 24% CO2 in the injected gas.
*Incremental technically recoverable resources after subtracting 2.3 billion barrels already produced or proven with CO2-EOR.
**Base Case Economics use an oil price of $70 per barrel (constant, real) and a CO2 cost of $45 per metric ton ($2.38/Mcf), delivered at pressure to the field. Economically recoverable resources form the database of large oil reservoirs are not further extrapolated to national totals. We assume that all the reservoirs with economic potential are already included in this database.

Storing CO2 and Producing Domestic Crude Oil with Next Generation CO2-EOR Technology
D-7
Table D-11 – Economically Recoverable Resource from “Next Generation” CO2-EOR: National Totals at Alternative Economic Cases
Basin/Area
Base Case Lower Oil
Price Case Higher Oil
Price Cases
($70/Bbl) ($50/Bbl) ($100/Bbl)
(Billion Barrels) (Billion Barrels) (Billion Barrels)
1. Alaska 7.8 3.0 10.3
2. California 7.7 7.4 8.2
3. Gulf Coast (AL, FL, MS, LA) 2.5 1.7 3.1
4. Mid-Continent (OK, AR, KS, NE) 9.1 8.5 9.2
5. Illinois/Michigan 1.1 0.5 1.3
6. Permian (W TX, NM) 12.1 9.5 13.9
7. Rockies (CO,UT,WY) 4.3 3.6 4.8
8. Texas, East/Central 11.8 11.2 13.3
9. Williston (MT, ND, SD) 0.7 0.7 0.9
10. Offshore GOM 0.7 0.5 2.4
11. Appalachia (WV, OH, KY, PA) 0.1 0.1 0.3
Total Demand 57.9 46.6 67.6

Storing CO2 and Producing Domestic Crude Oil with Next Generation CO2-EOR Technology
D-8
Table D-12 – Technical CO2 Storage Capacity using “Next Generation” CO2-EOR: Totals from Extrapolating Advanced Resources’ Database to National Level (Eleven
Basins/Areas)
Basin/Area
Gross Technical CO2 Storage
Capacity (Million Metric
Tons)
CO2 Already or Scheduled to be Injected
(Million Metric Tons)
Net Technical Storage Capacity for
CO2
(Million Metric Tons)
1. Alaska 2,668 - 2,668
2. California 1,963 - 1,963
3. Gulf Coast (AL, FL, MS, LA) 2,665 - 2,665
4. Mid-Continent (OK, AR, KS, NE) 3,709 20 3,689
5. Illinois/Michigan 551 - 551
6. Permian (W TX, NM) 7,016 570 6,446
7. Rockies (CO,UT,WY) 1,768 70 1,698
8. Texas, East/Central 5,513 - 5,513
9. Williston (MT, ND, SD) 849 - 849
10. Offshore GOM 1,742 - 1,742
11. Appalachia (WV, OH, KY, PA) 614 - 614
Total 29,058 660 28,398

Storing CO2 and Producing Domestic Crude Oil with Next Generation CO2-EOR Technology
D-9
Table D-13 – Economically Feasible Market for CO2 for “Next Generation” CO2-EOR: Base Case* (Eleven Basins/Areas)
Basin/Area
Gross Market for CO2
(Million Metric Tons)
CO2 Already or Scheduled to be Injected
(Million Metric Tons)
Net New Market for CO2
(Million Metric Tons)
“Best Practices”
“Next Generation”
“Best Practices”
“Next Generation”
1. Alaska 440 1,399 - 440 1,400
2. California 1,355 1,427 - 1,355 1,427
3. Gulf Coast (AL, FL, MS, LA) 576 612 - 576 612
4. Mid-Continent (OK, AR, KS, NE) 1,337 1,802 20 1,317 1,782
5. Illinois/Michigan 194 245 - 194 245
6. Permian (W TX, NM) 2,939 3,358 570 2,369 2,788
7. Rockies (CO,UT,WY) 546 866 70 476 796
8. Texas, East/Central 1,975 2,090 - 1,975 2,090
9. Williston (MT, ND, SD) 124 148 - 124 148
10. Offshore GOM 200 200 - 200 200
11. Appalachia (WV, OH, KY, PA) 14 25 - 14 25
Total 9,701 12,171 660 9,041 11,511
*Base Case: Oil price of $70 per barrel; CO2 cost of $45 per metric ton.

Storing CO2 and Producing Domestic Crude Oil with Next Generation CO2-EOR Technology
D-10
Table D-14 – Economically Feasible Market Demand for CO2 by CO2-EOR: Alternative Cases (Eleven Basins/Areas)
Basin/Area
Base Case Lower Oil
Price Case* Higher Oil
Price Case**
($70/Bbl) ($50/Bbl) ($100/Bbl) (Million Metric
Tons) (Million Metric
Tons) (Million Metric
Tons)
1. Alaska 1,400 466 2,023
2. California 1,427 1,355 1,574
3. Gulf Coast (AL, FL, MS, LA) 612 404 789
4. Mid-Continent (OK, AR, KS, NE) 1,782 1,576 1,712
5. Illinois/Michigan 245 92 273
6. Permian (W TX, NM) 2,788 2,279 3,340
7. Rockies (CO,UT,WY) 796 689 905
8. Texas, East/Central 2,090 1,929 2,481
9. Williston (MT, ND, SD) 148 139 176
10. Offshore GOM 200 150 657
11. Appalachia (WV, OH, KY, PA) 25 13 66
Total Demand 11,511 9,091 13,998
Less: Natural CO2 Sources 2,280 2,280 2,280
Less: Industrial Sources 220 220 220
Total US 9,011 6,591 11,498
Total Lower 48*** 7,642 6,235 9,078
*Lower Oil Price Case: Oil price of $50 per barrel; CO2 cost of $35 per metric ton.
**High Oil Price Case: Oil price of $100 per barrel; CO2 costs of $60 per metric ton.
*** 260 MMmt of Natural CO2 Supplies were from Alaska.


