The largest debt super-cycle in modern history is ending and it threatens economic growth and financial markets. The 2008 Great Financial Crisis was an opportunity for the world to deleverage, but in the last 7 years global debt to GDP has climbed by over $57 trillion. The current global debt/GDP ratio is at an historic high of 286%. The global economic slowdown is the proximate cause for the end of the supercycle. My concern is that a negative feedback loop has begun where falling global incomes make the servicing and/or refinancing the debt more difficult.
28
The End of the Debt Supercycle Risks Another Crisis January 10, 2016 Brian Kelly On CNBC’sFast Money, Thursday January 7, 2016, I was asked what invest ors should do with stock portfolios given recent weakness. My answer was “go to cash”. Later I reiterated my view during an appearance on CNBC’s special programming “Markets in Turmoil”; when asked what percentage of a portfolio should be in cash I answered, “100%”. My words have set off a firestorm. It was not my intention to create controversy , we were having a debate on the state of the markets; I was asked a question and I gave my honest opinion. I unknowingly hit a collective nerve. The response via social media, phone calls, and email has been overwhelming. As a financial pundit that regularly appears on CNBC I am accustomed to my views being challenged and often de rided – dealing with social media “trolls” is an occupational hazard. However, something interesting occurred, the majority of the responses have been positive and only a small percentage have been derogatory. My detractors have called me irresponsible and reckless for expressing this view. At first I was shocked that some people thought recommending extreme caution was reckless and irresponsible, but then I noticed much of the vitriol came from those who earn a living by continually recommending full investment regardless of market and economic conditions. I understand that my view contradicts conventional wisdom and by doing so it threatens the livelihood of those paid to solicit new investors. Investors need to understand this too. 1
The End of the Debt Supercycle RisksAnother Crisis
January 10, 2016Brian Kelly
On CNBC’s Fast Money, Thursday January 7, 2016, I was asked what investors shoulddo with stock portfolios given recent weakness. My answer was “go to cash”. Later I
reiterated my view during an appearance on CNBC’s special programming “Markets in
Turmoil”; when asked what percentage of a portfolio should be in cash I answered,
“100%”.
My words have set off a firestorm.
It was not my intention to create controversy, we were having a debate on the state of the
markets; I was asked a question and I gave my honest opinion. I unknowingly hit a
collective nerve. The response via social media, phone calls, and email has beenoverwhelming. As a financial pundit that regularly appears on CNBC I am accustomed
to my views being challenged and often derided – dealing with social media “trolls” is an
occupational hazard.
However, something interesting occurred, the majority of the responses have been
positive and only a small percentage have been derogatory. My detractors have called me
irresponsible and reckless for expressing this view.
At first I was shocked that some people thought recommending extreme caution was
reckless and irresponsible, but then I noticed much of the vitriol came from those who
earn a living by continually recommending full investment regardless of market and
economic conditions.
I understand that my view contradicts conventional wisdom and by doing so it threatens
the livelihood of those paid to solicit new investors. Investors need to understand this
My friend and fellow Fast Money contributor, Dan Nathan, has written must read piece
on the incentives of pundits. The article can be found here
Morning Word 1/7/16: These Aren't the Pundits You're Looking For
Dan’s point, which I whole-heartedly agree with, is that investors should seek out all theinformation available, but should also be aware of the incentives of those who provide
the information.
To that end you should know my incentives.
I am a money manager who gets paid to make money by going long and short currencies,
commodities, stocks and bonds. If I don’t make money, I don’t get paid.
Throughout my career I have never been paid a salary, I have always been compensated
on the “eat what you kill” method. That is to say I have earned commissions, percentageof trading profits or partnership shares. I never set out to be paid this way, but over the
years I have come to embrace this pay structure as my incentives have been aligned with
my clients.
Additionally, because I am actively involved in the financial markets I am biased by my
views and the subsequent financial market positions that I use to express those views.
Privilege and Responsibility
I feel privileged to have the platform that I do on CNBC. It is because of this privilegethat I get to work with incredibly talented and dedicated people. In fact, in my 20+ years
on Wall Street the last 7 years working with CNBC producers, directors, technicians and
on-air talent have been the most personally fulfilling and intellectually stimulating of my
career.
This privilege comes with a responsibility - a responsibility to be cognizant of the fact
that words have power and words said on television often take on an increased level of
importance, for better or worse.
Since my words have inadvertently set off a firestorm, I feel a responsibility to further
detail my views. In the following pages I will lay out everything that has lead to my view
that now is the time to exercise extreme caution.
This document is not meant to be financial advice nor is it intended to be a sales pitch. I
am not selling anything. Frankly, at this point it is in my best interest to shut my mouth
and shrink back into the punditry shadows. If I am wrong I risk losing the credibility I
have built over a 20-year career. But my responsibility and conviction compels me to
present my view, for better or worse.
Let me be clear, I do not have a crystal ball or special powers that allow me to see into
the future. Anyone peddling financial advice that claims to have special insight into the
future is lying. What I do have is experience and over 20 years of studying financialmarkets. This experience has taught me that some things are more important to look at
than others. And In my view the most important economic factor for financial markets is
the expansion and contraction of money and debt. When money and debt contract the
economy shrinks and financial asset prices fall.
My research leads me to the conclusion that we could be on the verge the largest debt
contraction the word has ever experienced.
In the following pages I will present this research and my conclusion. I encourage you to
discuss this research and conclusion with your financial advisor and determine the bestcourse of action for your individual situation.
DEBT TO GDP R ATIO.......................................................................................................................8ECONOMIC PRINCIPLES...................................................................................................................8WHERE ARE WE NOW ...................................................................................................................? 9CURRENT DEBT TO GDP LEVEL................................................................................................... 11
.....................................................................THE GLOBAL SHADOW BANKING SYSTEM 12
THE $9.5 TRILLION GLOBAL CARRY TRADE................................................................................13THE R OLE OF THE US FEDERAL R ESERVE................................................................................... 14SECOND STAGE OF GLOBAL LIQUIDITY........................................................................................16US R ESIDENTS OWN 33% OF DOLLAR BONDS.............................................................................. 17SAME PROBLEM, DIFFERENT WARNING SIGNS............................................................................18
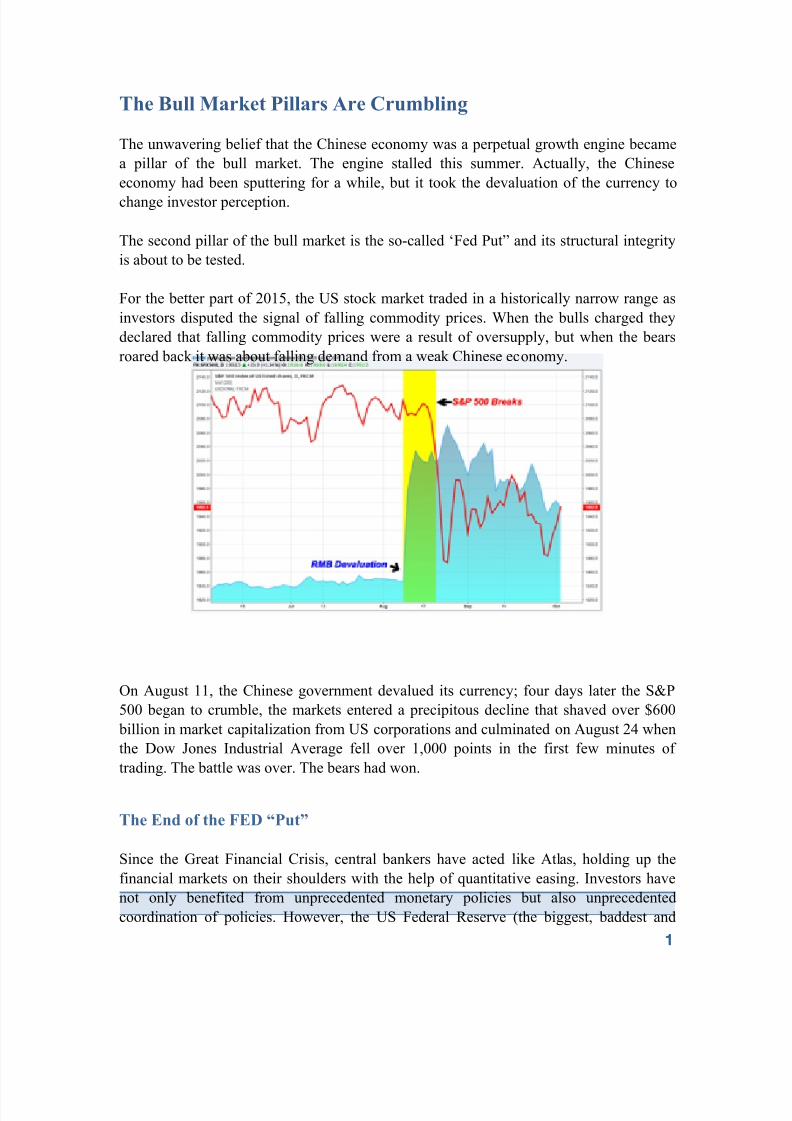
...........................................................THE BULL MARKET PILLARS ARE CRUMBLING 19THE END OF THE FED “PUT ........................................................................................................” 19R ECESSION WARNING SIGNS.........................................................................................................20BUT WHAT ABOUT THE LOW UNEMPLOYMENT R ATE ...............................................................? 24
..............................................................................THE END OF THE PERPETUAL BUYER 26
THE BABY BOOMERS PREPARE TO R ETIRE.................................................................................. 26
The Debt SupercycleAt the most basic level the economy expands and contracts based on how much money is
available to buy goods and services. Money can be defined in many ways and tomes
have been written on what constitutes money. For our purposes we will use the simplest
definition. Money is both “cash” and debt. “Cash” can be viewed as money in your bank
account, stock market portfolio, or under your mattress but the key component of ‘cash’
is that it does not have to be repaid. Debt is also money, but it must be paid back. There
may be money in your bank account that is from a home equity loan or a line credit – you
can still use this to buy goods and services but it must be paid back.
The ‘expiration date’ on debt is what creates economic expansions and contractions.
These economic expansions and contractions are commonly referred to as the business
cycle. The business cycle is really a short-term debt cycle that typically lasts less than 10
years. An easy way to think about it is to use personal experience; outside of one’s
mortgage most debt must be paid back within10 years. That home equity line that you
used for the vacation in Cancun acted just like cash but it needs to be paid back within 10
years. The cash you received from a car loan was money when it bought the new car, but
it still needs to be paid back (usually in less than 5 years). This ebb and flow of debt
acting like money is what creates economic expansions and contractions. This is the
short-term debt cycle.
There is a longer-term debt/economic cycle that plays out over a long period of time.
This debt buildup continues as long as each unit of debt accumulated results in more thanone-unit earned. This cycle tends to last for multiple decades and reflects the buildup of
debt over generations. This cycle is most often associated with a sovereign nation that
accumulates debt over decades and then suddenly finds itself in a situation where it can
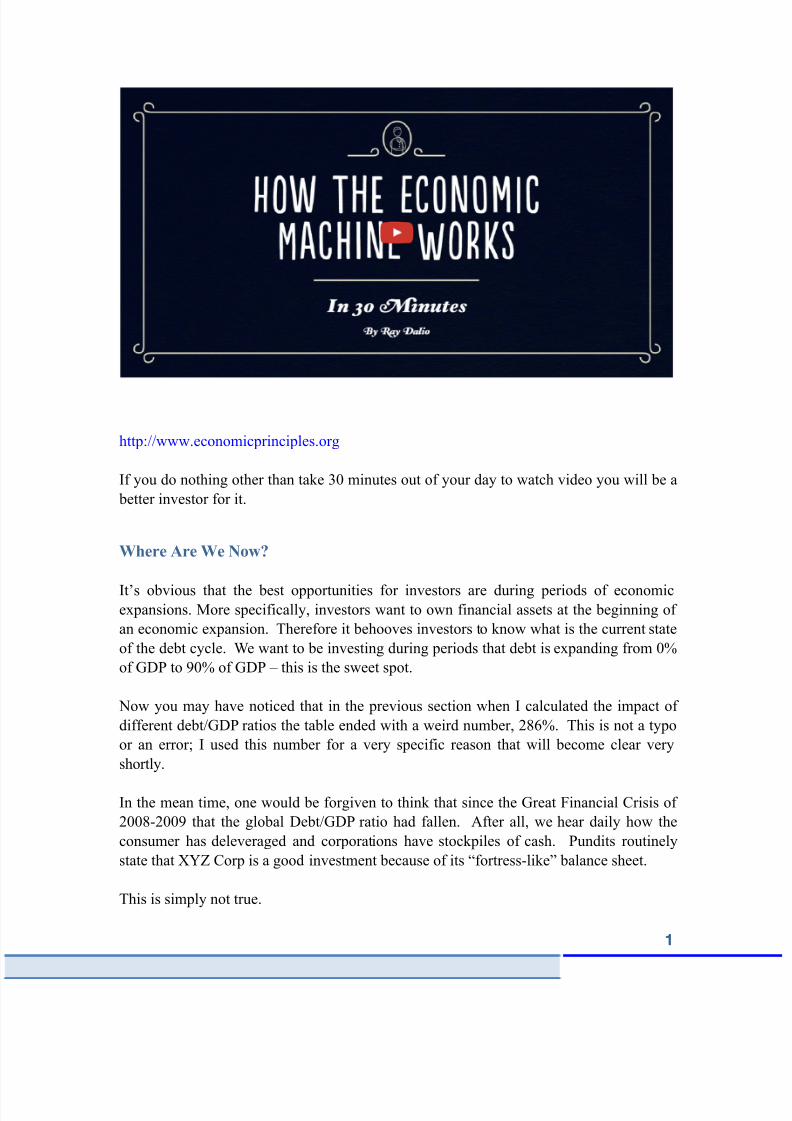
If you do nothing other than take 30 minutes out of your day to watch video you will be a
better investor for it.
Where Are We Now?
It’s obvious that the best opportunities for investors are during periods of economicexpansions. More specifically, investors want to own financial assets at the beginning of
an economic expansion. Therefore it behooves investors to know what is the current state
of the debt cycle. We want to be investing during periods that debt is expanding from 0%
of GDP to 90% of GDP – this is the sweet spot.
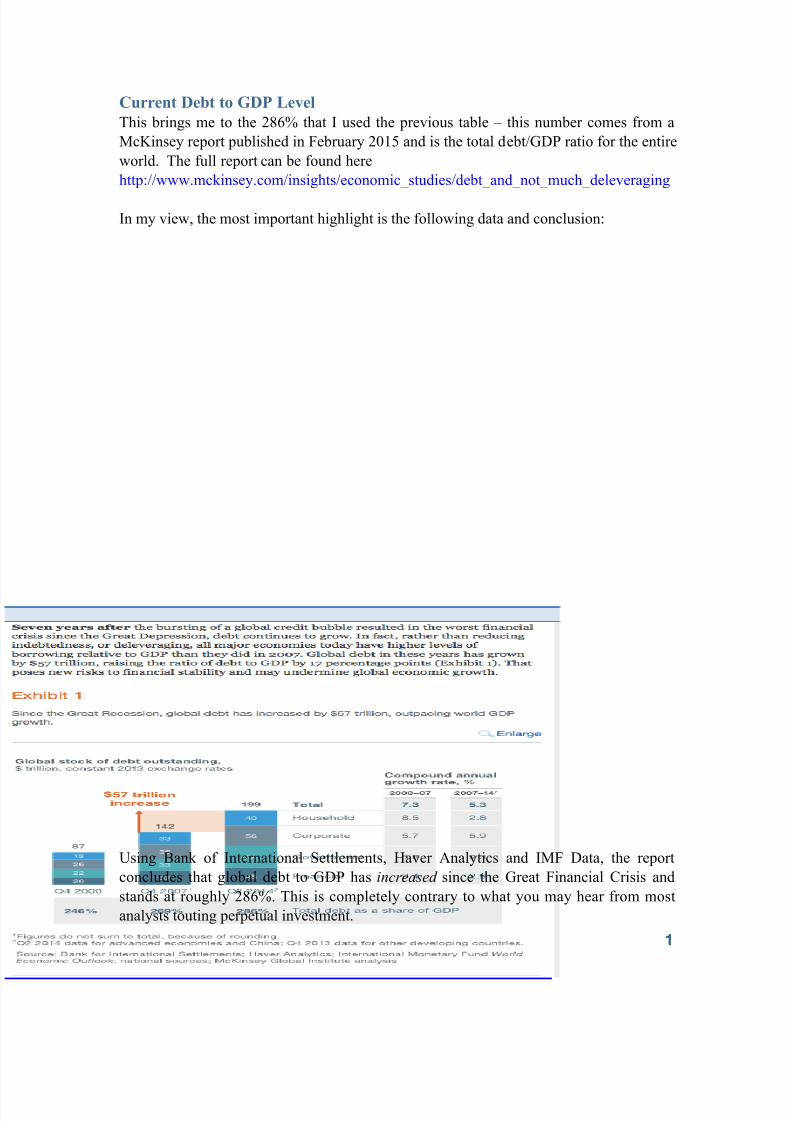
Now you may have noticed that in the previous section when I calculated the impact of
different debt/GDP ratios the table ended with a weird number, 286%. This is not a typo
or an error; I used this number for a very specific reason that will become clear very
shortly.
In the mean time, one would be forgiven to think that since the Great Financial Crisis of
2008-2009 that the global Debt/GDP ratio had fallen. After all, we hear daily how the
consumer has deleveraged and corporations have stockpiles of cash. Pundits routinely
state that XYZ Corp is a good investment because of its “fortress-like” balance sheet.
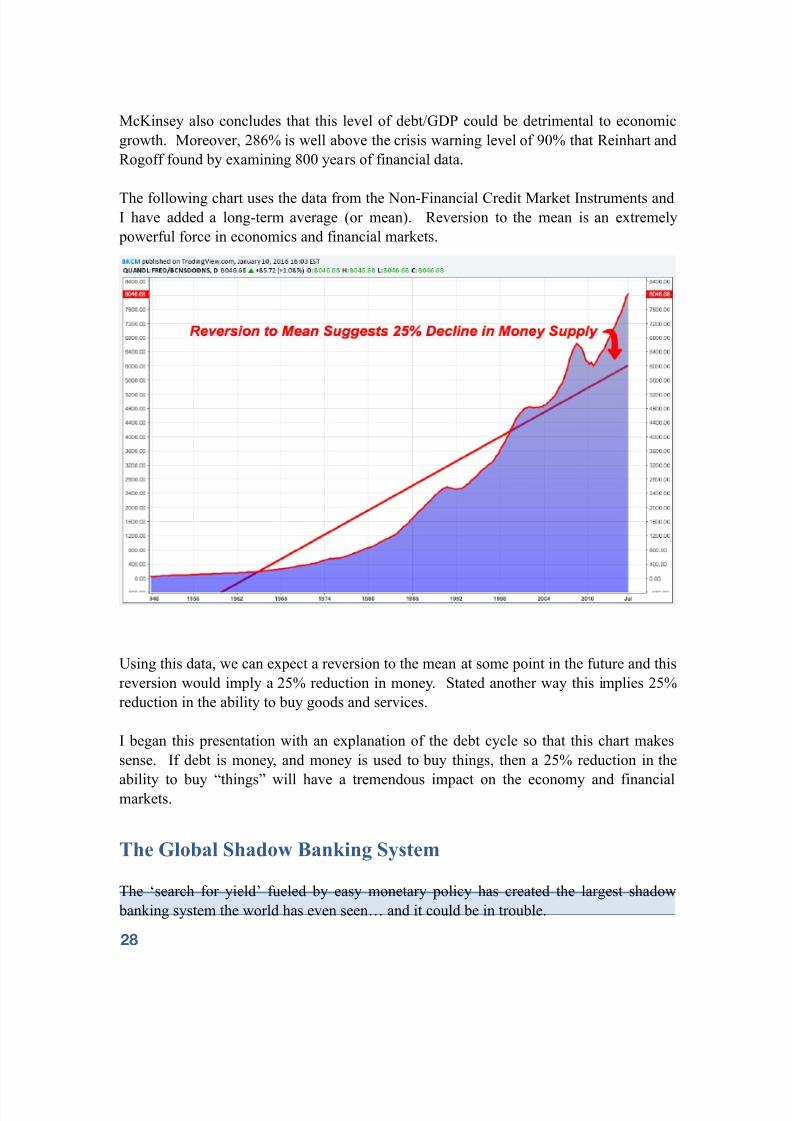
McKinsey also concludes that this level of debt/GDP could be detrimental to economic
growth. Moreover, 286% is well above the crisis warning level of 90% that Reinhart and
Rogoff found by examining 800 years of financial data.
The following chart uses the data from the Non-Financial Credit Market Instruments andI have added a long-term average (or mean). Reversion to the mean is an extremely
powerful force in economics and financial markets.
Using this data, we can expect a reversion to the mean at some point in the future and this
reversion would imply a 25% reduction in money. Stated another way this implies 25%
reduction in the ability to buy goods and services.
I began this presentation with an explanation of the debt cycle so that this chart makes
sense. If debt is money, and money is used to buy things, then a 25% reduction in the
ability to buy “things” will have a tremendous impact on the economy and financialmarkets.
The Global Shadow Banking System
The ‘search for yield’ fueled by easy monetary policy has created the largest shadow
banking system the world has even seen… and it could be in trouble.
According to the Bank for International Settlements (BIS), since 2010 the amount of US
Dollar denominated debt issued by foreign companies has grown by 50% from $6 trillion
to $9 trillion. The proximate cause of this debt buildup was the impact of US Federal
Reserve quantitative easing on bond yields –as the FED bought bonds, yields were
pushed lower and investors were forced to search globally for higher yielding financialinstruments. This demand for yield fueled a credit binge of unprecedented scale.
The epicenter of this pro-cyclical expansion of credit was the fast growing emerging
markets. Investors perceived that investing in countries like China, Brazil and Turkey was
worth the risk, especially if emerging market companies were offering higher yields.
Some of the credit extended to emerging market companies was used for real economic
projects, but a BIS report released on Thursday August 27, 2015 concludes that most of
the money was simply invested in higher yielding shadow banking instruments. This is
the so-called global carry trade.
The $9.5 Trillion Global Carry Trade
The global carry trade works like this: an emerging market company issues bonds
denominated in US dollars – critically the yield on these bonds is above the yield of US
corporate bonds but BELOW the yield on shadow banking instruments within the
emerging markets. The relatively higher yielding bonds attract investors searching for
yield; at the same time the emerging market company can invest the proceeds of the bond
The emerging market company earns the difference between its low yielding US dollar
bonds and its high yield emerging market investments. This is financial engineering by
another name.
The global carry trade works especially well under three conditions:
1. There is a large interest rate differential between the US and the emerging
country.
2. The emerging country’s currency is rising.
3. Currency volatility is very low.
All three of these conditions have been present since 2010 and have been fuel for this
massive build in debt. However the economic slowdown in China coupled with the US
Federal Reserve ending quantitative easing has resulted in a strong US dollar (weakemerging market currencies) and tremendous currency volatility – thereby significantly
reducing the attractiveness of the carry trade.
The credit expansion of the carry trade resulted in emerging market money supply growth
that was the basis for economic growth. In fact, it was the virtuous spiral of credit/money
growth fueling economic growth that produced investor demand for emerging market
bonds. Now, I fear, that process is beginning to reverse.
The Role of the US Federal Reserve
The primary driver of any bubble is the availability of cheap financing that is lent with
little due diligence. We need not look any further back than the US housing bubble to find
an example of a credit fueled bubble. In the aftermath of the tech bubble the US Federal
Reserve left interest rates too low for too long and created the housing bubble – it popped
when incomes could no longer support the debt payments.
To be sure, I am not standing on a soapbox making a political statement about central
banks; I am simply looking at data that suggests both during the early 2000’s and today
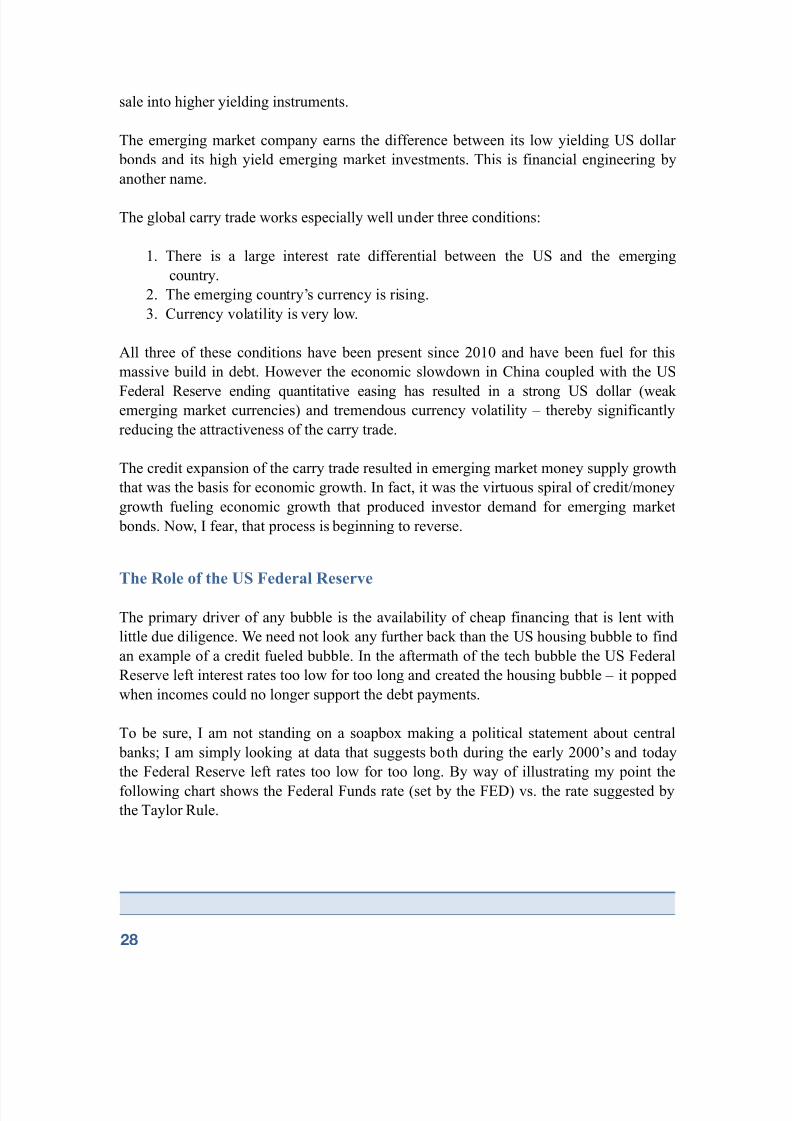
the Federal Reserve left rates too low for too long. By way of illustrating my point the
following chart shows the Federal Funds rate (set by the FED) vs. the rate suggested by
The Taylor Rule is an objective yardstick for the level that the FED should set of interest
rates given the economic backdrop. In this chart the blue line represents the Taylor Rule
and the actual rate set by the Fed (Fed Funds) is the red line.
Notice that beginning in 2003, when the US economy was emerging from recession the
Taylor Rule suggested the FED should be increasing rates – but the FED actuallyDECREASED rates. Moreover, when the economic backdrop began to slow in 2006 the
Taylor Rule suggested the FED should be lowering rates – but the FED was actually
RAISING rates.
If we look at the chart from 2009 to present, we can see that once again the Taylor Rule
suggested the FED should be increasing rates in 2010 and that they should now be
LOWERING those rates.
Once again the FED has left rates too low for too long and at the exact moment it should
be easing monetary policy it has tightened monetary policy.
A quick aside on the Taylor Rule – as with any economic indicator there are criticisms
and by using the Taylor Rule I am not necessarily endorsing it. However, what is
indisputable is that an objective rules based method of setting monetary policy indicates
that during the last two bubbles the FED has made a serious error.
While we all share the blame for over indebtedness, the FED played a central role in
creating the conditions fertile for a debt fueled housing bubble… and they have done it
again, but this time it is on a global scale.
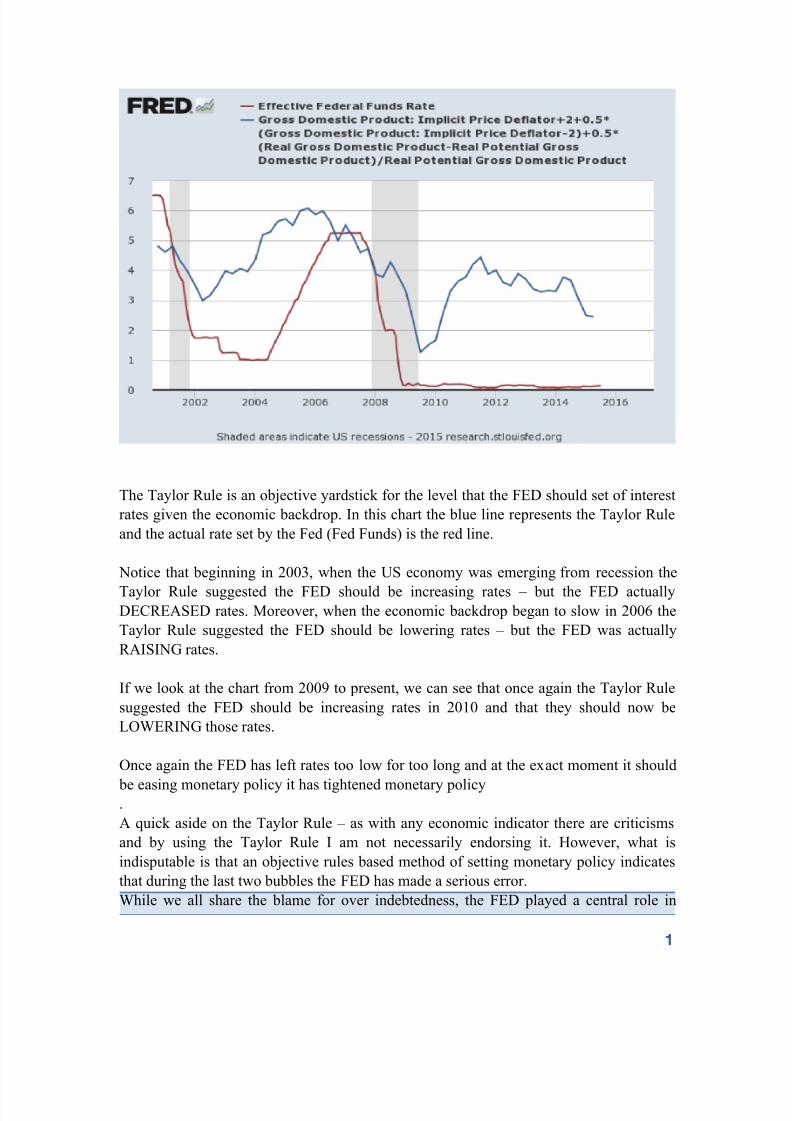
Second Stage of Global Liquidity
Economist Hyon Song Shin has dubbed the global credit bubble the “Second Stage of
Global Liquidity”. In a 2013 speech, Shin presented the following charts using BIS data
that show a marked acceleration of debt issuance by leading emerging market economies
since 2010.
This trend has been verified by the BIS itself in two reports that concluded the amount of
global debt has increase by 50% since 2010 from $6 trillion to $9 trillion.
The credit bubble that preceded the Great Financial Crisis featured global banks at the
center of the lending frenzy, but this time it’s different. Regulatory changes and capitalrequirements have essentially sidelined banks from this bubble, while asset managers
have assumed the lead role of shadow bank intermediary.
Let’s look again at the chart presented previously that shows the large buildup of debt
since the financial crisis – but this time don’t focus on the colored portion, focus on the
Raoul Pal of the Global Macro Investor and RealVision TV has done brilliant work on the
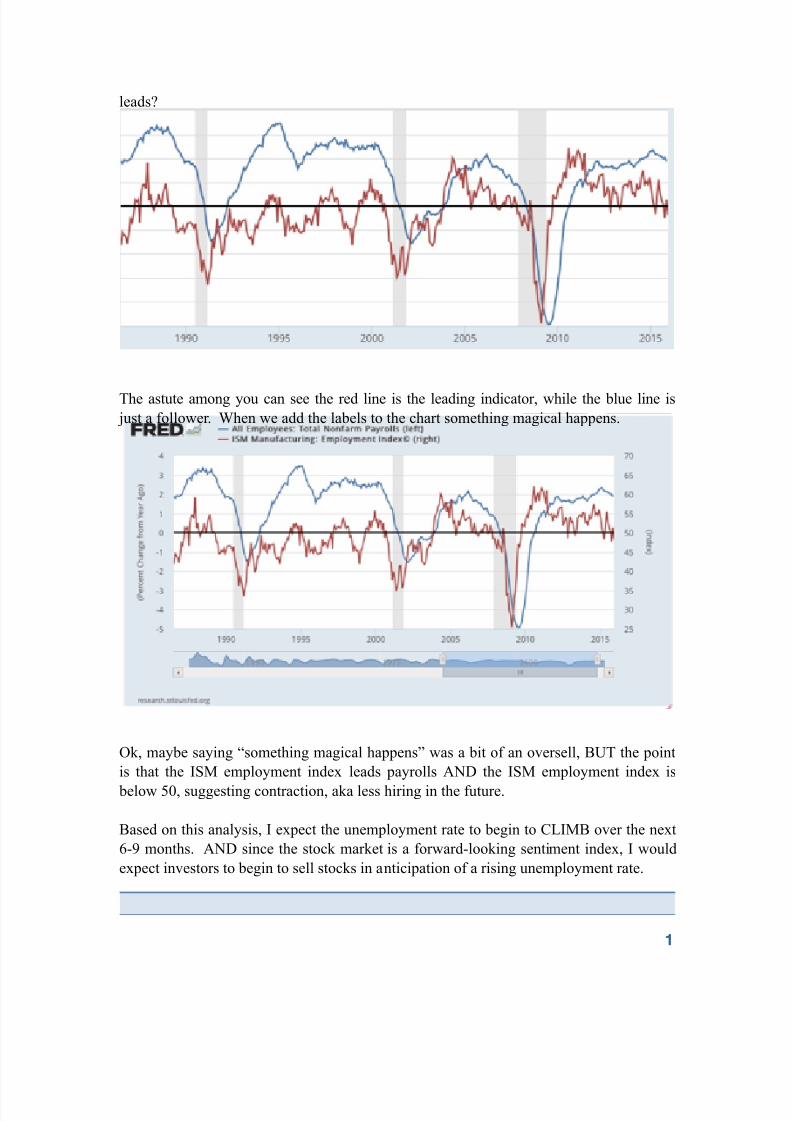
meaning of the ISM Index below 50. His work (and that of Citi’s Willem Buiter) suggests
that the ISM at its current level indicates a 65% probability of a recession.
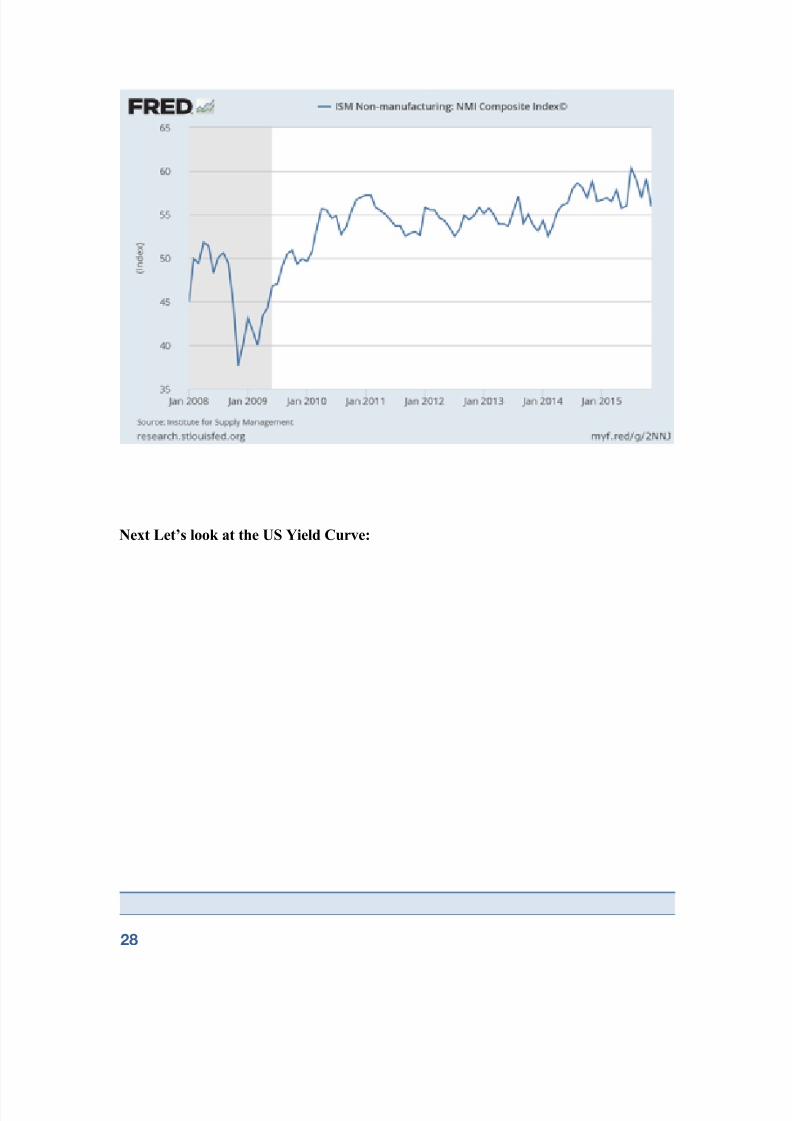
The good news is that ISM Non-Manufacturing has yet to drop below 50, butunfortunately the trend is lower. The following graph illustrates the rapid deterioration in


![BrianThomas - Kelly Lake [Read-Only]ilrdss.isws.illinois.edu/pubs/govconf2005/session1b/Brian Thomas.pdf · Kelly Lake wetland restoration ... • Drainage district of 1170 acres](https://static.documents.pub/doc/80x56/5f5d25f61f234f52aa463c31/brianthomas-kelly-lake-read-only-thomaspdf-kelly-lake-wetland-restoration.jpg)


