18
Storms activity and atmospheric circulation Galina V.Surkova, Alexandre V.Kislov
| Date post: | 17-Dec-2015 |
| Category: |
Documents |
| Upload: | patricia-oconnor |
| View: | 216 times |
| Download: | 0 times |

Storms activityand atmospheric circulation
Galina V.Surkova, Alexandre V.Kislov
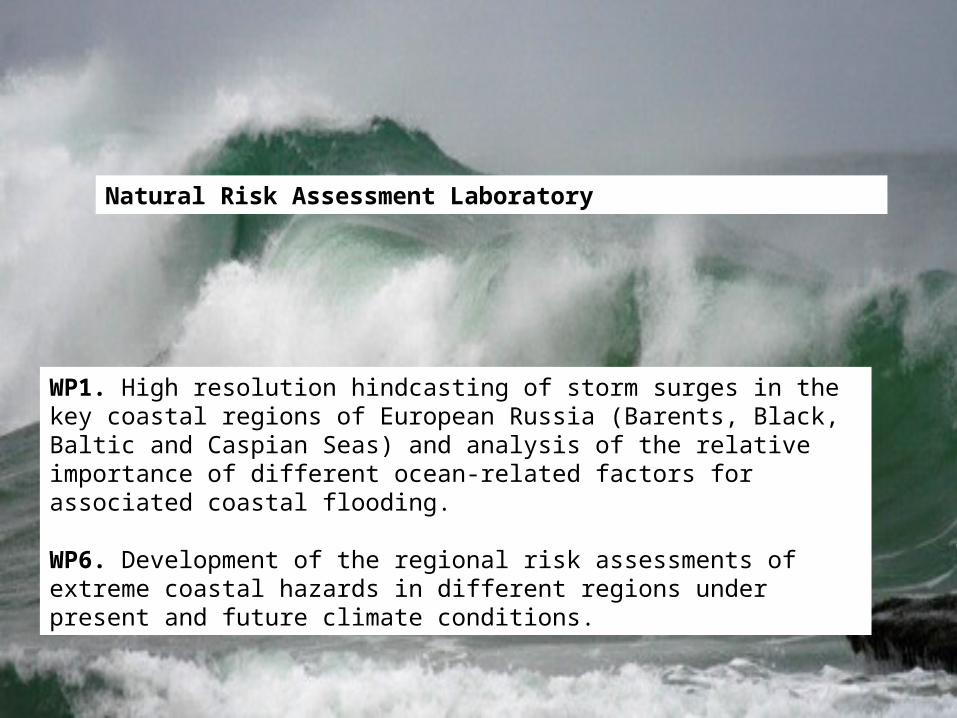
WP1. High resolution hindcasting of storm surges in the key coastal regions of European Russia (Barents, Black, Baltic and Caspian Seas) and analysis of the relative importance of different ocean-related factors for associated coastal flooding.
WP6. Development of the regional risk assessments of extreme coastal hazards in different regions under present and future climate conditions.
Natural Risk Assessment Laboratory

Automatic classification of atmospheric circulation types accompanied by storm surges
Recognition of these atmospheric circulation patterns in climate projections
Regional projections of the frequency and intensity of extreme events in the coastal zones in 21st century
Purpose of the work

2 6 2 8 3 0 3 2 3 4 3 6 3 8 4 0 4 2 4 4
4 2
4 4
4 6
4 8
I L I C H E V S KO d e s s a _ G M O
T I L I G U L O - B E R E Z A Y N K AO C H A K O V
G e n i c h e n s kK h o r l yS T E R E G U S H I YR A Z D O L N O E
C h e r n o m o r s k o y eY e v p a t o r i y a _ p o r t
A L U S H T A
S T R E L K O V O E
P h e o d o s i y a
M I S O V O EK e r c h _ A M S G + S c h o o lO P A S N O E
Y a l t aS e v a s t o p o l , M G SH E R S O N S S K I Y _ M A Y A KN I K I T S K I Y _ S A D
A n a p aG E L E N D Z I K
D J U B G AT U A P S E
S o c h i _ a g r oS O T C H IG A G R YP I C U N D A
G U D A U T AS U H U M YE S H E R AO C E M C I R I
P O T Y _ p a r k
B a t u m i _ M S GB A T U M Y
4 6 4 7 4 8 4 9 5 0 5 1 5 2 5 3 5 4 5 5 5 6
3 6
3 7
3 8
3 9
4 0
4 1
4 2
4 3
4 4
4 5
4 6
4 7
4 8
P E S N O YG O G O L S KZ A B U R U N E
O S T R O V _ K U L A L YF o r t - S h e v c h e n k o
A K T A U
B E K D A SK A R A - B A G A Z - G O L
G U V L I A J KK r a s n o v o d s k
C h e l e k e n - p o r t + A M S GO G U R C I N S K I Y - O S T R O V
G a s a n - K u l i
G A N J U S K I N OA s t r a k h a n
L I M A NK A S P I Y S K I YI S K U S S T V E N N I Y _ O S T R O V
T U L E N I Y - O S T R O V
M a k h a c h - K a l a _ G M O
I Z B E R G
H A C M A SS I A S A N
S U G A I TB A K UB a k u _ G M O
N E F T J N I EA R T E M A _ O S T R O V
J I L O Y _ O S T R O V
S V I N O Y _ O S T R O VA l y a t
N E F T E C A L A
L e n k o r a n _ A S
Meteorological observations
Reanalysis
ERA-Interim (0,75x0,75 lat x long, 4-daily)
NCEP-NCAR (slp 2,5x2,5; u,v 1,9x1,9; 4-daily)

Calendar of events
Casp
ian
sea
17 19
Observations on coastal meteorological stations
and 2) known sea storms
events
the most outstanding storm events
1) All events wind speed V>=15m/s

Beaufort scale
…7. High wind,moderate gale 13,9 – 17,1 m/s 8. Gale, fresh gale 17,2 – 20,7 m/s9. Strong gale (storm) 20,8 – 24,4 m/s 10. Storm 24,5 – 28,4 m/s11. Violent storm 28,5 – 32,6 m/s12. Hurricane >33 m/s - hurricane
Storm warning – 25 m/s
Sir Francis Beaufort (1774 – 1857)
But …
1 5 1 7 1 9 2 1 2 3 2 5 2 7 2 9 3 1 3 3 3 5m /s
0
0.2
0.4
0.6
0.8fr
eq
ue
ncy
1 5 1 7 1 9 2 1 2 3 2 5 2 7 2 9 3 1 3 3 3 5m /s
0
0.2
0.4
0.6
0.8
fre
qu
en
cy
Casp
ian sea
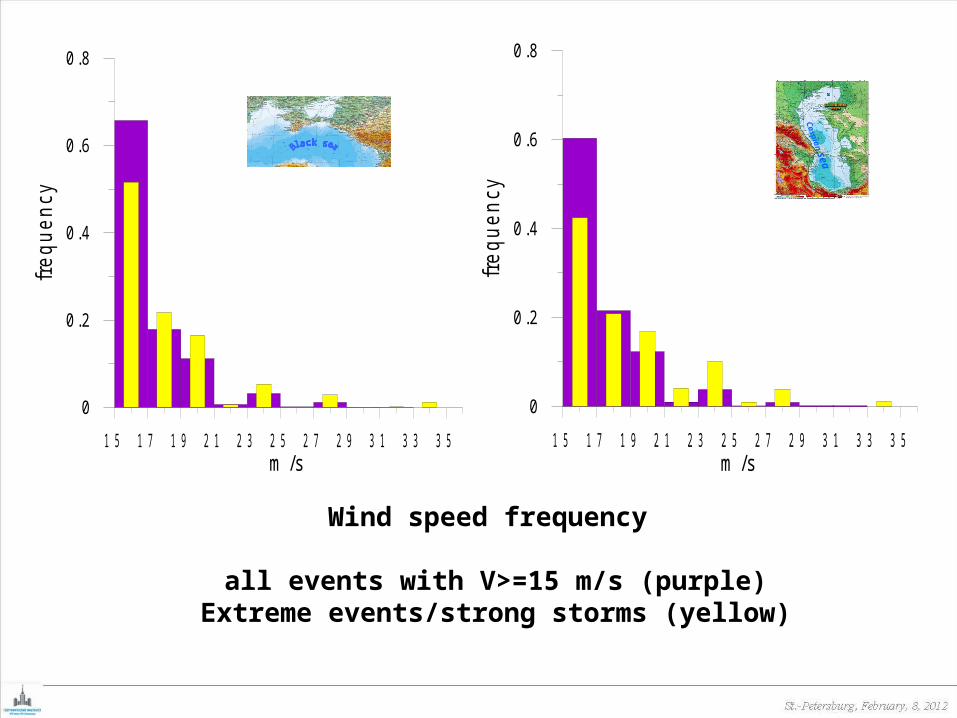
Wind speed frequency
all events with V>=15 m/s (purple)Extreme events/strong storms (yellow)
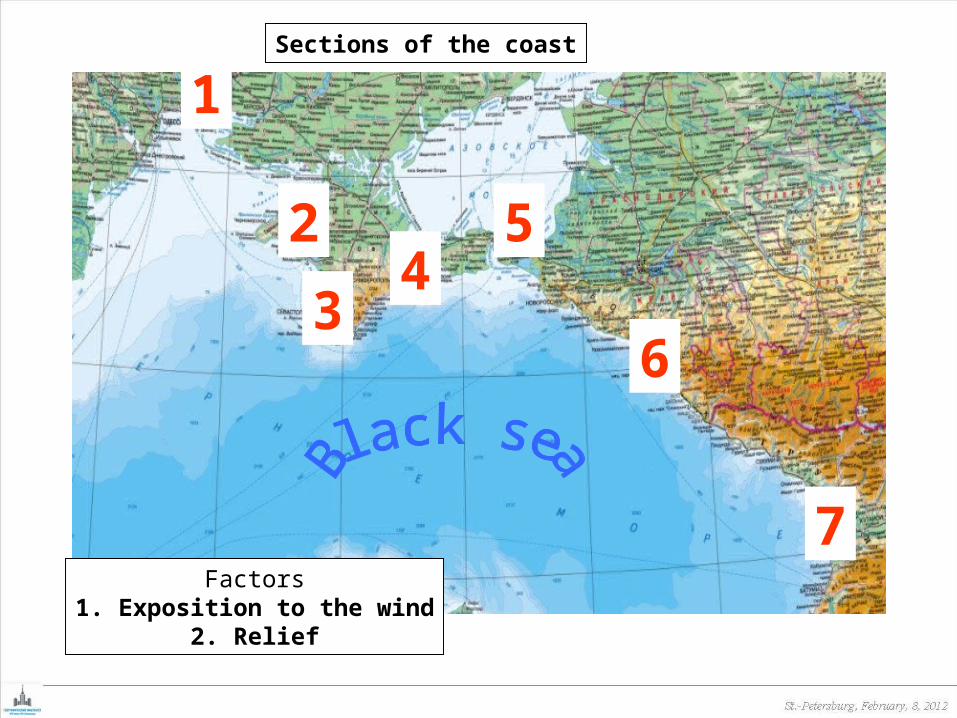
Sections of the coast
1
2
34
5
6
7Factors
1. Exposition to the wind2. Relief

Nov-March April-Oct
Monthly frequency, v>=15 m/s (1961-1990)
1
2
3
4
5
6
7

Nov-March April-Oct
Wind roses for v>=15 m/s (1961-1990)
All stations
1
2
3
4
5
6
7

Storms:
Total events, V>=15 m/s (1961-1990)
Month All events
5 days durationand more
1 30 24
2 26 17
3 30 15
11 31 15
12 27 17
Sum 144 88Number of all events with V>=15 m/s (1961-1990) - >950
western part of the sea
eastern part of the sea
total
Number of extreme storms - 17

and so on …

Before Circulation patterns for extreme storm events
Climate: Mean sea level pressure (1979-2000, Atlas ERA-40)
L
HH

Circulation patternsfor extreme storm events
I (14 events) II (5 events)
2 5 3 0 3 5 4 0 4 5
4 0
4 2
4 4
4 6
4 8
024681 01 21 41 61 82 0
R e f e r e n c e V e c t o r s
0 . 5 1 4 . 0
2011, October, 18 2011, February, 13
0 1 0 2 0 3 0 4 0 5 0 6 0 7 0 8 0 E3 0
4 0
5 0
6 0
7 0
8 0N
H
L
L
LH
1 0 2 0 3 0 4 0 5 0 E3 0
3 5
4 0
4 5
5 0
5 5
6 0
6 5
N
H
L
2 6 2 8 3 0 3 2 3 4 3 6 3 8 4 0 4 2 4 4
4 2
4 4
4 6
4 8
024681 01 21 41 61 82 0
R e f e r e n c e V e c t o r s
0 . 5 1 4 . 0

Monthly frequency, v>=15 m/s (1961-1990)Nov-March
April-Oct
Wind roses for v>=15 m/s (1961-1990)
Casp
ian sea

0 10 20 30 40 50 60 70 80 E30
40
50
60
70
80N
В
НН
0 1 0 2 0 3 0 4 0 5 0 6 0 7 0 8 0 E3 0
4 0
5 0
6 0
7 0
8 0N
ВВ
Н
Н
Н
1981, November 4
1952, November 11
4 6 4 8 5 0 5 2 5 4 E
3 4
3 6
3 8
4 0
4 2
4 4
4 6
N
0 5 1 0 1 5 2 0 2 5R e f e r e n c e V e c t o r s
0 . 5 1 4 . 0
4 6 4 8 5 0 5 2 5 4 E
3 4
3 6
3 8
4 0
4 2
4 4
4 6
N
0 5 1 0 1 5 2 0 2 5R e f e r e n c e V e c t o r s
0 . 5 1 4 . 0
1995, March 12
Typical circulation patternsfor extreme storm events
Casp
ian sea

Done by now
•Routine work with initial data •Classification of synoptic situation types accompanied by storm surges
In progress
•Automatic classification of atmospheric circulation types accompanied by storm surges•Regional projections of the frequency and intensity of extreme events in the coastal zones in 21st century

Thank you !


