136
2016 STRATEGIC PARTNERSHIPS INTEGRATED ANNUAL REPORT

2016 STRATEGICPARTNERSHIPS
INTEGRATED ANNUAL REPORT

Windhoek Lager recently won its 10th consecutive gold medal at the DLG awards.
* The international Deutsche Landwirtschafts Gesellschaft (DLG) Quality Evaluation rates beer brands that are brewed according to the Reinheitsgebot (“Purity Law”) of 1516 against quality specifi cations for taste, analytical and biological standards.
WINDHOEK LAGER
WINDHOEK DRAUGHT
WINDHOEK LIGHT
TAFEL LAGER
2016
2015
2014
2013
2012
2011
2010
2009 NP
2008 NP
2007
2006
DLG AWARDS*
Gold Silver Bronze NP not participating
Strategic Partnerships ❯❯ 1
TABLE OF CONTENTS
ABOUT THIS REPORT
2
CHAIRPERSON’S STATEMENT
4
KEY FACTS AND FIGURES
7
NBL PROFILE
8
GEOGRAPHICAL FOOTPRINT
10
NBL BRAND PROFILES
12
PARTNERING FOR THE FUTURE
17
NBL’S PARTNERSHIP MODEL
20
A NAMIBIAN INVESTMENT WITH LONG-TERM PROSPECTS
36
NBL TIMELINE
37
OPERATING ENVIRONMENT
39
MANAGING DIRECTOR’S REPORT
43
VALUE ADDED STATEMENT
51
GOOD CORPORATE GOVERNANCE
53
REMUNERATION REPORT
68
ANNUAL FINANCIAL STATEMENTS
71
DIRECTORATEANDADMINISTRATION
Inside back cover

Namibia Breweries Limited Integrated Annual Report 20162
About this report
Chairperson’s statement
NBL profile
Partnering forthe future
A Namibian investment
NBL timeline
ABOUT THIS REPORT
Namibia Breweries Limited (NBL) is a publicly owned company listed on the Namibian
Stock Exchange (NSX) since 1996. NBL continues to embark on its journey towards
medium and long term.
Secretaries, Ohlthaver & List Centre (Proprietary) Limited, on tel: +264 61 207 5111 or email: [email protected].
Reporting boundariesNBL forms part of the O&L Group of companies – Namibia’s largest privately held Group of companies, with revenues contributing about 4% to gross domestic product (GDP). The Group has business interests in food production, fishing, beverages, farming, retail trade, information technology, property leasing and development, marine engineering, steel retailing and the leisure and hospitality industry. O&L indirectly holds an effective 29.69% stake in NBL.
NBL’s joint venture with leading drinks company Diageo, and brewer Heineken, established in 2003, was restructured in December 2015. The diagram to the right shows the structure after the change.
Detail of further NBL subsidiaries is available on page 129 of the annual financial statements.
Financial and non-financial data in this report is limited to NBL and its subsidiaries, whereas non-financial reporting, including risks, opportunities and partnerships, considers all stakeholders. Stakeholders have been identified as those individuals or groups who can be affected by NBL’s business activities, outputs or outcomes, or who can significantly affect NBL’s ability to create value over time.
The report is aimed at NBL’s providers of financial capital, but considered a wide range of stakeholders and topics in the content development process. The report was furthermore guided by the Vision 2019 strategy developed by Ohlthaver & List (O&L or the O&L Group), and influenced by current Namibian challenges such as critical water supply constraints. The year’s most significant event was the restructuring of the joint venture agreement in South Africa. This is comprehensively covered throughout the report.
The integrated reporting approach and structure allows for comparability of financial and non-financial data. Materiality was applied to information gathered during data collection, as well as Board and management interviews.
The following frameworks and reporting requirements were considered
Corporate Governance Code for Namibia (NamCode)
Namibia Companies Act, 2004 (Act No. 28 of 2004)
Namibian Stock Exchange Listing Requirements
International Financial Reporting Standards
International Integrated Reporting Council’s <IR> Framework
Further information is available on the website: www.nambrew.com. To provide feedback or request copies of this report, contact our Company

Strategic Partnerships ❯❯ 3
Operating environment
Managing Director’s report
Value addedstatement
Good corporate governance
Remuneration report
Annual financial statements
AssuranceThe consolidated annual financial statements from page 72 to 130 were audited by Deloitte & Touche. As per the NamCode requirements, NBL follows a combined assurance model based on the three lines of defence, which includes internal controls and systems, supported by external verification. The latter included a SABS audit against the requirements of SANS 10330:2007 on 22 and 23 July 2015 and a SABS recertification against the requirements of ISO 9001:2008. Several internal audits were also conducted by Ernst & Young during the year.
Read more about our internal audit programme on page 65.
Forward-looking statementsThis integrated report contains statements about NBL that are or may be forward-looking statements. Examples of forward-looking statements include statements regarding a future financial position or future profits, cash flows, strategy, estimates of capital expenditures, acquisition strategy, or future capital expenditure levels, and other economic factors such as interest and exchange rates. These may generally be identified by the use of forward-
looking words or phrases such as ‘believe’, ‘aim’, ‘expect’, ‘anticipate’, ‘intend’, ‘foresee’, ‘forecast’, ‘likely’, ‘should’, ‘planned’, ‘may’, ‘estimated’ and ‘potential’, or similar words and phrases.
By their nature, forward-looking statements involve risks and uncertainties because they relate to events and depend on circumstances that may or may not occur in the future. NBL cautions that forward-looking statements are not guarantees of future performance.
Board approvalThe Board, assisted by the Audit Committee, is ultimately responsible for the integrity and completeness of this report. The Board has applied its collective mind to the preparation and presentation of the report and, accordingly, approved it on 6 September 2016.
Navigational iconsThe following icons are applied throughout the report to improve usability and show the integration between the relevant elements of the report.
This icon is used for referring to NBL’s website: www.nambrew.com.
This icon is used for cross referencing in the report.
NBL Investment Holdings(Proprietary) Limited
Ohlthaver & List Finance and Trading Corporation Limited
(OLFITRA)
Heineken South Africa (Proprietary) Limited
Public shareholders
Government Institutions Pension Fund
Namibia Breweries Limited
Heineken Namibia B.V.
59.37%
50.01%
25%
29.36%
49.99%
11.27%

About this report
Chairperson’s statement
NBL profile
Partnering forthe future
A Namibian investment
NBL timeline
Dear stakeholders
This integrated report looks back
Namibia Breweries Limited (NBL) in the
in our markets and country.
NBL remains a star performer among the O&L Group as is evident by international recognition for the quality of its brands, people practices and transformation initiatives. NBL was recognised as one of the leaders in the promotion of Employment Equity in Namibia and awarded the Overall Top Performer in the Workplace category by the Employment Equity Commission of Namibia. NBL was also crowned the overall winner of the category ‘Best Plant Information Management System Application’ at an international software conference held in South Africa during May 2016.
NBL delivered excellent financial results for the year with turnover increasing by an average of 12.3% over the past five years. Operating profit for the year was
EVOLVING OUR
PURPOSE
CHAIRPERSON’S STATEMENT
N$34 million higher than the previous year, which was N$507 million. Return on assets was 31.4% whereas the return on ordinary shareholders’ funds increased to 32.4% (2015: 26.2%). The Board believes the Company remains in a healthy position with good growth prospects.
Evolving our purpose through partnerships
The O&L Group has been on a journey to formulate and refine its purpose for more than six years. At the time of developing the Group’s vision, the global financial crisis, among other factors, made us realise that our purpose is more important than our pockets: we agreed that we want to create a sustainable future.
Our purpose, Creating a Future, Enhancing Life, means that everyone in the Group works differently to six years ago. People now understand their individual and personal purpose and how this aligns to what we want to achieve as a business. Our philosophy is to see our employees as our most important asset. As a result, our employees come to work to achieve something, rather than only to receive a salary.
Our purpose is at the root of our approach to partnerships. We create partnerships with people and institutions that can relate to our purpose and our values – and that can help us achieve Vision 2019.
Namibia Breweries Limited Integrated Annual Report 20164

Operating environment
Managing Director’s report
Value addedstatement
Good corporate governance
Remuneration report
Annual financial statements
Our targets for the Group’s Vision 2019 are to
reach a N$2 billion earnings before interest and tax (EBIT) target;
reduce our carbon footprint by 20%;
remain an Employer of Choice; and
create 4 000 additional job opportunities.
NBL has made impressive contributions to these Group targets during the year.
Read more about these in the Managing Director’s Report on page 43.
Partnership highlightsOur purpose-driven partnership approach fosters the Group’s relationship with Government. O&L subsidiaries engage with Government on their own and collectively through a range of departments and projects. On a personal level, I have played a strategic role in developing and building the Development Bank of Namibia, the National Planning Commission, the Namibian Broadcasting Corporation and other public and private institutions.
As a true Namibian corporate citizen NBL remains committed to Government’s vision of the “Growth at Home” strategy, the Harambee Prosperity Plan and ultimately Vision 2030. The launch of the new King Lager beer and commercialisation of the local barley industry is a worthy example of our commitment.
The strategic restructuring of NBL’s joint venture in South Africa was also a milestone for 2016. There
Sven ThiemeChairperson
NBL was recognised
Employment Equity
in Namibia and
Workplace category
by the Employment
Equity Commission
Operating profit
N$541 million( 6.7%)
Return on assets
31.4% ( 1.2%)
Return on ordinary shareholder funds
32.4% ( 23.7%)
Strategic Partnerships ❯❯ 5

Namibia Breweries Limited Integrated Annual Report 20166
is a shared commercial vision between NBL and Heineken for the future – starting in South Africa and with long-term opportunities in other markets.
Group commitmentsO&L remains the controlling shareholder of NBL, providing shared services, offering synergy and new growth opportunities. We will continue to identify and invest in business opportunities in Namibia and beyond that will grow shareholder value, both short and long term, in line with the Group’s Vision 2019.
We are committed to the development of human capital – leadership and individuals with purpose – for Namibia at large. During the past year we continued the Mwenyopaleka programme, which encourages employees to move away from a rule-driven employment relationship to a value-driven one based on long-term commitment.
With the current water crisis in Namibia, NBL continues to execute its water mitigation plan to reduce dependency on public water resources, thereby contributing to the sustainability of our economy. This includes investment into boreholes, volume migration to South Africa, a water reclamation and pre-treatment plant.
We are also continuously increasing our support to local procurement partners to further develop the Namibian economy and mitigate foreign exchange exposure.
Although NBL is actively diversifying into other beer and beverage offerings, we remain committed to upholding the Reinheitsgebot for our core products: using only three ingredients, namely malted barley, hops and water.
Our support of self-regulating measures to encourage responsible drinking and prevent alcohol harm remains an important focus area.
Read more about our responsible drinking initiatives on page 29.
Good corporate governanceGovernance remains structured and integrated to be compliant, effective and to provide the Senior Leadership Team with the support to execute our O&L Group strategy. To create a breakthrough culture we have to start from the top, by empowering people with purpose.
There were several resignations from the Board following the restructuring of the South African joint venture. Sijbe Hiemstra resigned on 12 November 2015 after just more than four years on the Board, and Nick Blazquez, Philip Jenkins, Martin Kromat and Jeff Milliken all resigned on 1 December 2015.
Nick was a Board member for almost 12 years, whereas the others joined us more recently. They each made unique and much appreciated contributions to NBL and helped fostered partnerships for the future. We wish them all the best.
Dividend for 2016The Board continues maintaining a balance between the interests of business, shareholders and other stakeholders. We have therefore adopted a progressive dividend policy which aims to maintain or grow the dividend each year. A full year dividend of 40 cents per ordinary share was declared for shareholders registered on 21 October 2016 and will be paid on 11 November 2016.
AppreciationI would like to thank all our employees for their contribution in the past year – every single one of you played a role in our results. This extends also to our suppliers, consumers and loyal customers, who form a critical part of our success story over many years.
Lastly, I would like to thank my fellow Board members, the O&L Group Executive and our Senior Leadership Team for their commitment to, ownership of and passion for NBL.
CHAIRPERSON’S STATEMENT (continued)
About this report
Chairperson’s statement
NBL profile
NBL timeline
Partnering forthe future
A Namibian investment
Operating environment
Managing Director’s Report
Value addedstatement
Good corporate governance
Remuneration report
Annual financial statements
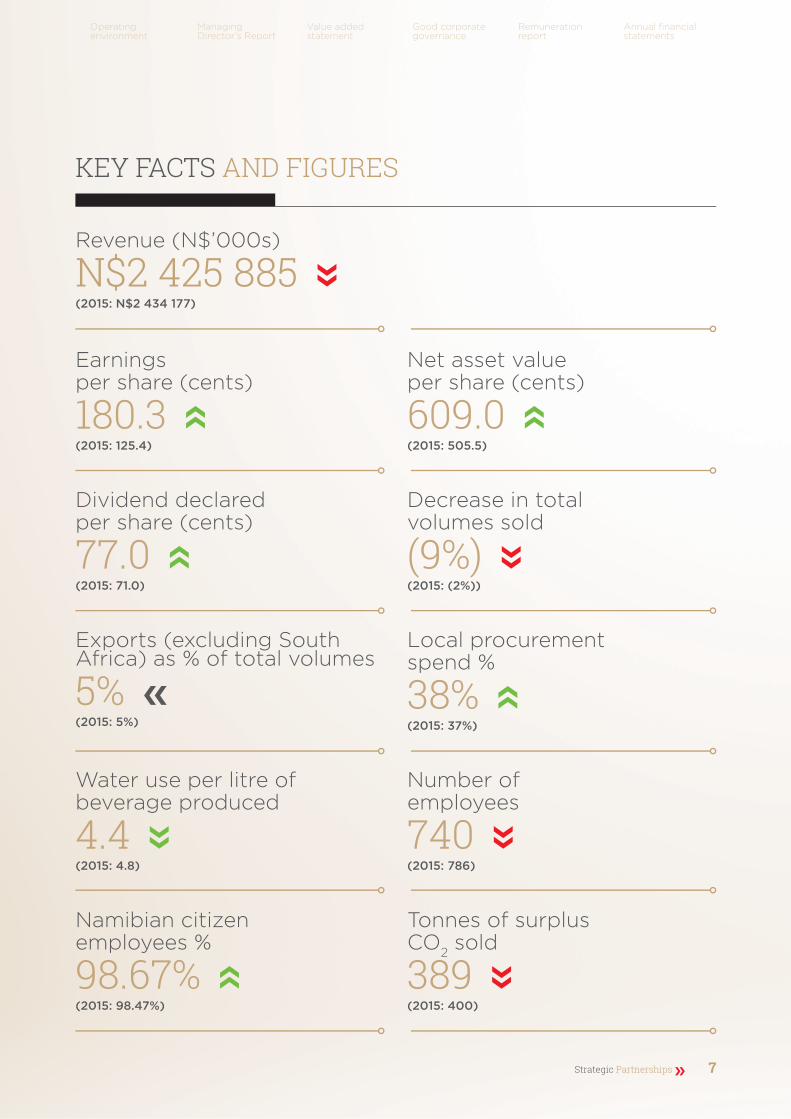
Revenue (N$’000s)
N$2 425 885 (2015: N$2 434 177)
Earnings per share (cents)
180.3 (2015: 125.4)
Dividend declared per share (cents)
77.0 (2015: 71.0)
Exports (excluding South Africa) as % of total volumes
5% (2015: 5%)
Water use per litre of beverage produced
4.4 (2015: 4.8)
Namibian citizen employees %
98.67% (2015: 98.47%)
Net asset value per share (cents)
609.0 (2015: 505.5)
Decrease in totalvolumes sold
(9%) (2015: (2%))
Local procurement spend %
38% (2015: 37%)
Number of employees
740 (2015: 786)
Tonnes of surplus CO2 sold
389 (2015: 400)
KEY FACTS AND FIGURES
Strategic Partnerships ❯❯ 7

NBL PROFILE
exported to 13 countries beyond Namibia
NBL leads the domestic beer market and has a significant share of the premium beer category in southern Africa. It is the only large-scale commercial brewery in Africa that brews in accordance with the German Reinheitsgebot (“Purity Law”) of 1516, which requires the exclusive use of three ingredients – malted barley, hops and water.
NBL creates value by producing non-alcoholic products, for all consumers, and alcoholic products for a wide range of adult consumer segments at a spread of price points. Its distribution network ensures availability and market research tests consumer relevance and satisfaction. NBL’s commitment to the Reinheitsgebot provides consumers with a guarantee of quality and safe, natural ingredients. Through responsible drinking initiatives, NBL creates awareness of potential social harm that can result from excessive use.
Volume contribution per category
Employee gender split
Namibian beer | 67.6%
South African beer | 20.7%
Export beer | 4.9%
Fruittree | 4.0%
Aquasplash | 1.0%
RTDs | 0.7%
Vigo | 0.6%
McKane | 0.5% Beer | 92.4%
Other | 7.6%
<25 | 4.6%
25-34 | 33.2%
35-44 | 37.3%
45-54 | 18.3%
55-56 | 6.6%
Male | 81%
Female | 19%
About this report
Chairperson’s statement
NBL profile
NBL timeline
Partnering forthe future
A Namibian investment
Namibia Breweries Limited Integrated Annual Report 20168

Number of employees
740 2015: 786 2014: 734
Employee turnover
6.51% 2015: 7.19% 2014: 5.20%
Non-Namibians as % of employees
1.33% 2015: 1.53% 2014: 1.86%
Lost time injury frequency rate
1 2015: 2 2014: No data available
Employee facts
Operating environment
Managing Director’s Report
Value addedstatement
Good corporate governance
Remuneration report
Annual financial statements
Strategic Partnerships ❯❯ 9
Namibia Breweries Limited Integrated Annual Report 201610
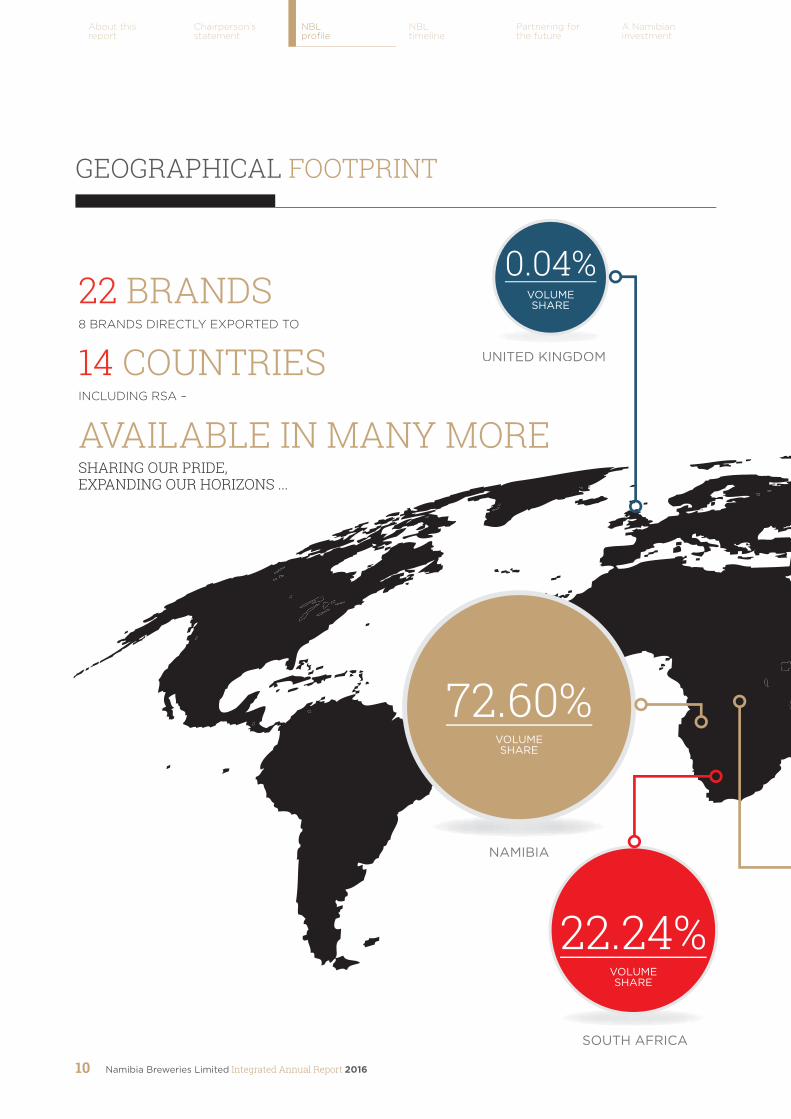
0.04%VOLUMESHARE
UNITED KINGDOM
NAMIBIA
SOUTH AFRICA
22.24%VOLUMESHARE
72.60%VOLUMESHARE
22 BRANDS 8 BRANDS DIRECTLY EXPORTED TO
14 COUNTRIESINCLUDING RSA –
AVAILABLE IN MANY MORESHARING OUR PRIDE, EXPANDING OUR HORIZONS ...
GEOGRAPHICAL FOOTPRINT
About this report
Chairperson’s statement
NBL profile
NBL timeline
Partnering forthe future
A Namibian investment
Strategic Partnerships ❯❯ 11
Operating environment
Managing Director’s report
Value addedstatement
Good corporate governance
Remuneration report
Annual financial statements
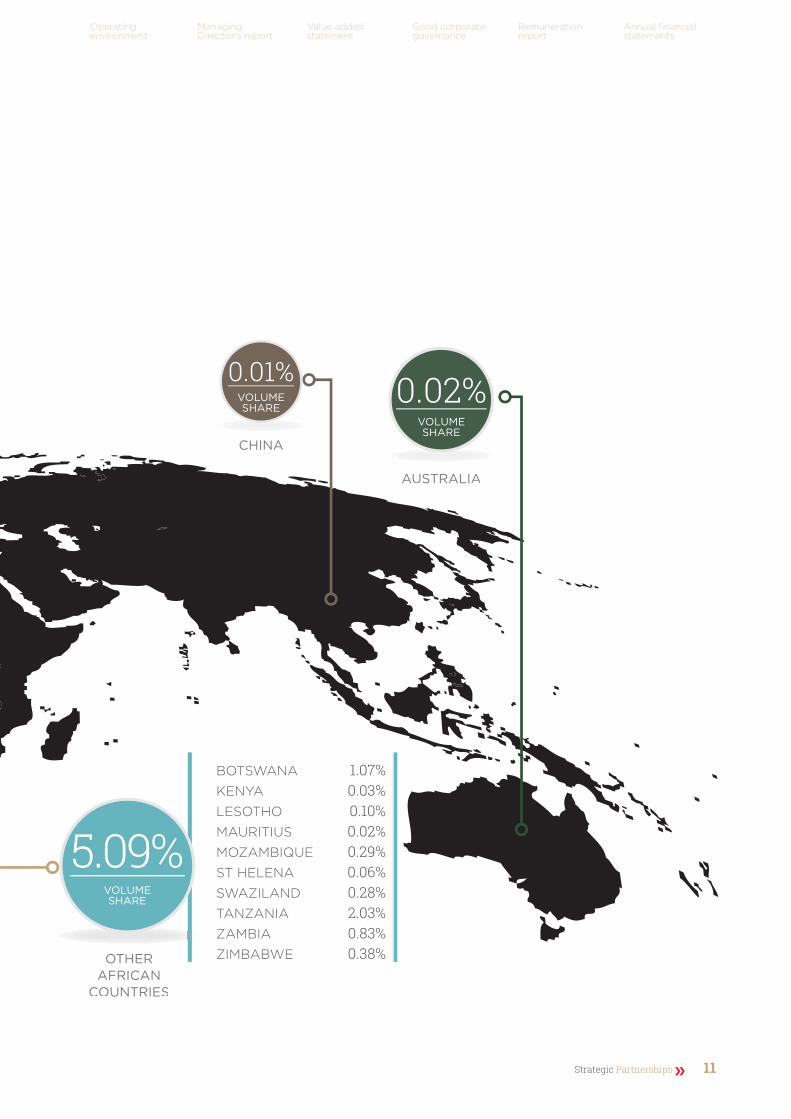
0.02%VOLUMESHARE
AUSTRALIA
0.01%VOLUMESHARE
CHINA
BOTSWANA 1.07%KENYA 0.03%LESOTHO 0.10%MAURITIUS 0.02%MOZAMBIQUE 0.29%ST HELENA 0.06%SWAZILAND 0.28%TANZANIA 2.03%ZAMBIA 0.83%ZIMBABWE 0.38%OTHER
AFRICAN COUNTRIES
5.09%VOLUMESHARE

NBL BRAND PROFILES
TAFEL LITE HANSA DRAUGHT URBOCK CLUB
SHANDY
Tafel Lite has a smooth, fresh crisp taste with a balanced malty mouth feel. Tafel Lite has 4% abv and 27% less glycaemic carbohydrates per 100-ml when compared to Tafel Lager.
Draught is often described as the freshest form of beer. This beer has a relatively low alcohol content of 4% per volume. This fresh product is brewed, using only malted barley hops and water in accordance with the Reinheitsgebot.
Urbock is brewed to perfection and distinguished by its rich dark Munich barley malt, giving it a rich malty flavour. Urbock is only brewed once per year and is therefore only available during May each year, in limited quantity. 7% abv.
Club Shandy is a quality blend of naturally brewed beer and the finest lemonade. It has a cool, crisp, refreshing taste and is low in alcohol. It makes a great thirst quencher! 2.5% abv.
330-ml NRB
330-ml slender can
20-L keg
30-L keg
50-L served in 250-ml and 500-ml offering
330-ml NRB
30-L keg
330-ml NRB
SPONSORSHIP/CAMPAIGNSNone
SPONSORSHIP/CAMPAIGNSSponsor of the Oktoberfest in Namibia.
It is also the beer of choice at various carnivals nationally.
SPONSORSHIP/CAMPAIGNSWindhoek Woordfees, Namibia Tourism Expo
SPONSORSHIP/CAMPAIGNSNone
Namibia Namibia Botswana, Namibia, South Africa Namibia
WINDHOEK LAGER
WINDHOEK DRAUGHT
WINDHOEK LIGHT
TAFEL LAGER
A premium, natural beer brewed according to the German Purity Law of 1516, using only the finest imported ingredients certified to contain no genetically modified organisms. This beer is mild in bitterness with a distinctive hops flavour, delivering an exquisite taste profile. 4% abv. Consistent Gold Medal winner at the DLG Awards since 2007
A premium quality, natural beer brewed using only the finest imported ingredients. Windhoek Draught is the most sessionable beer in the Windhoek range – ideal for any outdoors occasion. 4% abv.
Windhoek Light is a refreshing crisp natural light lager carefully brewed the Reinheitsgebot way using natural ingredients only: malted barley, hops and water. Low in alcohol and kilojoules without compromising on taste, it contains no preservatives or artificial ingredients. 2.45% abv.
Tafel Lager is carefully brewed in accordance with the German Purity Law of 1516 using only malted barley, hops and water. Tafel Lager is a fine quality smooth tasting natural lager beer with a wholesome flavour and aroma. The taste can be described as the ideal balance between refreshment, flavour and bitterness. 4% abv.
330-ml NRB
330-ml can
440-ml can
500-ml RB
750-ml RB
30-L keg
330-ml can
440-ml can
440-ml NRB
750-ml RB
50-L keg
330-ml NRB
330-ml can
330-ml can
330-ml NRB
440-ml can
750-ml RB
500-ml RB
SPONSORSHIP/CAMPAIGNSDidier Drogba (ended June 2016); Windhoek Jazz Festival, Ongwediva Trade Fair, Groen Namibië, Cheetah Conservation
SPONSORSHIP/CAMPAIGNSPackaging updates to pressure sensitive labels and embossed bottles ensuring brand relevance.
Various associations with sport and the outdoors (Currie Cup, Volleyball for All) and international music i.e. Boyz II Men
SPONSORSHIP/CAMPAIGNSFish River Ultra Marathon, Namib Quest, Windhoek Light Xtrail, Pick n Pay Cycling Classic, Ran-a-Ban
SPONSORSHIP/CAMPAIGNSThe brand recently went through a packaging renovation and broke the 1 million hl volume mark.
Proud sponsor of the national soccer team, the Tafel Lager Brave Warriors.
Australia, Botswana, China, Kenya, Lesotho, Mauritius, Mozambique, Namibia, South Africa, St Helena, Swaziland, Tanzania, United Kingdom, Zambia, Zimbabwe
Available in SADC through agreements with reputable agents
Australia, China
Australia, Botswana, Lesotho, Mauritius, Namibia, South Africa, Swaziland, Zambia, Zimbabwe,
Biggest beer brand in Namibia with a national footprint.
Renewed its presence in South Africa through the distribution network of Heineken.
About this report
Chairperson’s statement
NBL profile
NBL timeline
Partnering forthe future
A Namibian investment
Namibia Breweries Limited Integrated Annual Report 201612
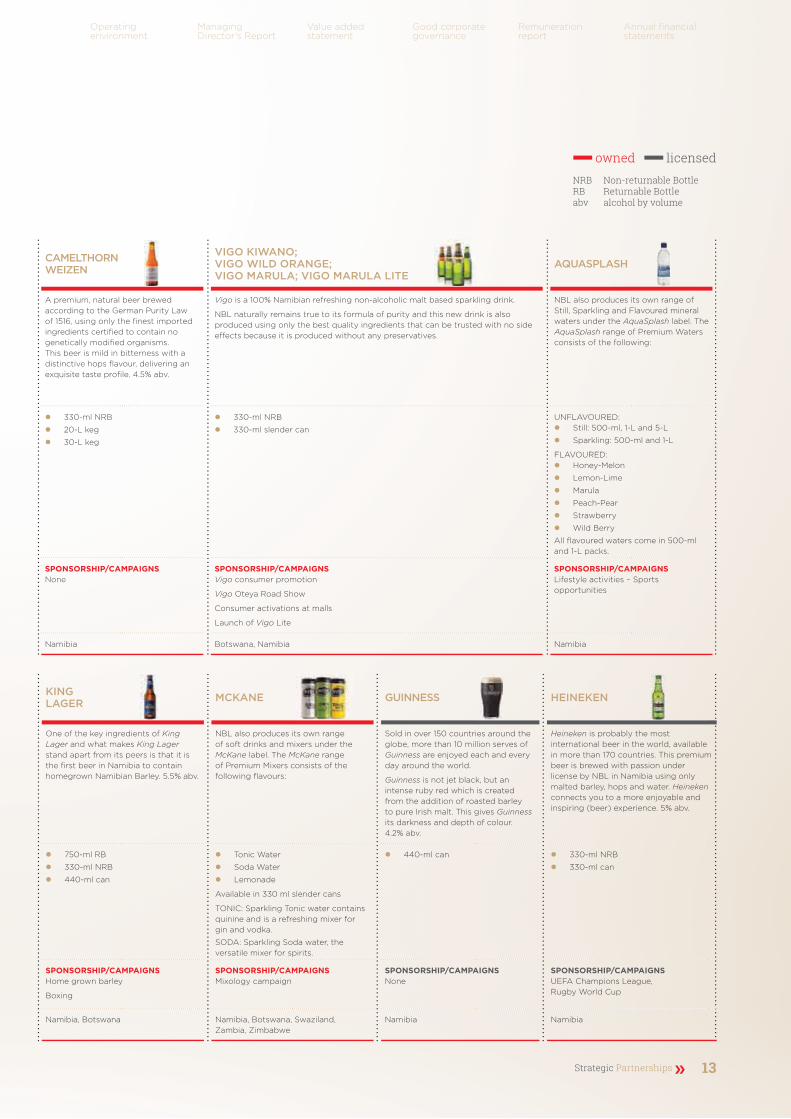
owned licensed
NRB Non-returnable BottleRB Returnable Bottle abv alcohol by volume
CAMELTHORN WEIZEN
VIGO KIWANO; VIGO WILD ORANGE; VIGO MARULA; VIGO MARULA LITE
AQUASPLASH
A premium, natural beer brewed according to the German Purity Law of 1516, using only the finest imported ingredients certified to contain no genetically modified organisms. This beer is mild in bitterness with a distinctive hops flavour, delivering an exquisite taste profile. 4.5% abv.
Vigo is a 100% Namibian refreshing non-alcoholic malt based sparkling drink.
NBL naturally remains true to its formula of purity and this new drink is also produced using only the best quality ingredients that can be trusted with no side effects because it is produced without any preservatives.
NBL also produces its own range of Still, Sparkling and Flavoured mineral waters under the AquaSplash label. The AquaSplash range of Premium Waters consists of the following:
330-ml NRB
20-L keg
30-L keg
330-ml NRB
330-ml slender can
UNFLAVOURED:Still: 500-ml, 1-L and 5-L
Sparkling: 500-ml and 1-L
FLAVOURED:Honey-Melon
Lemon-Lime
Marula
Peach-Pear
Strawberry
Wild Berry
All flavoured waters come in 500-ml and 1-L packs.
SPONSORSHIP/CAMPAIGNSNone
SPONSORSHIP/CAMPAIGNSVigo consumer promotion
Vigo Oteya Road Show
Consumer activations at malls
Launch of Vigo Lite
SPONSORSHIP/CAMPAIGNSLifestyle activities – Sports opportunities
Namibia Botswana, Namibia Namibia
KING LAGER MCKANE GUINNESS HEINEKEN
One of the key ingredients of King Lager and what makes King Lager stand apart from its peers is that it is the first beer in Namibia to contain homegrown Namibian Barley. 5.5% abv.
NBL also produces its own range of soft drinks and mixers under the McKane label. The McKane range of Premium Mixers consists of the following flavours:
Sold in over 150 countries around the globe, more than 10 million serves of Guinness are enjoyed each and every day around the world.
Guinness is not jet black, but an intense ruby red which is created from the addition of roasted barley to pure Irish malt. This gives Guinness its darkness and depth of colour. 4.2% abv.
Heineken is probably the most international beer in the world, available in more than 170 countries. This premium beer is brewed with passion under license by NBL in Namibia using only malted barley, hops and water. Heineken connects you to a more enjoyable and inspiring (beer) experience. 5% abv.
750-ml RB
330-ml NRB
440-ml can
Tonic Water
Soda Water
Lemonade
Available in 330 ml slender cans
TONIC: Sparkling Tonic water contains quinine and is a refreshing mixer for gin and vodka.
SODA: Sparkling Soda water, the versatile mixer for spirits.
440-ml can 330-ml NRB
330-ml can
SPONSORSHIP/CAMPAIGNSHome grown barley
Boxing
SPONSORSHIP/CAMPAIGNSMixology campaign
SPONSORSHIP/CAMPAIGNSNone
SPONSORSHIP/CAMPAIGNSUEFA Champions League, Rugby World Cup
Namibia, Botswana Namibia, Botswana, Swaziland, Zambia, Zimbabwe
Namibia Namibia
Operating environment
Managing Director’s Report
Value addedstatement
Good corporate governance
Remuneration report
Annual financial statements
Strategic Partnerships ❯❯ 13
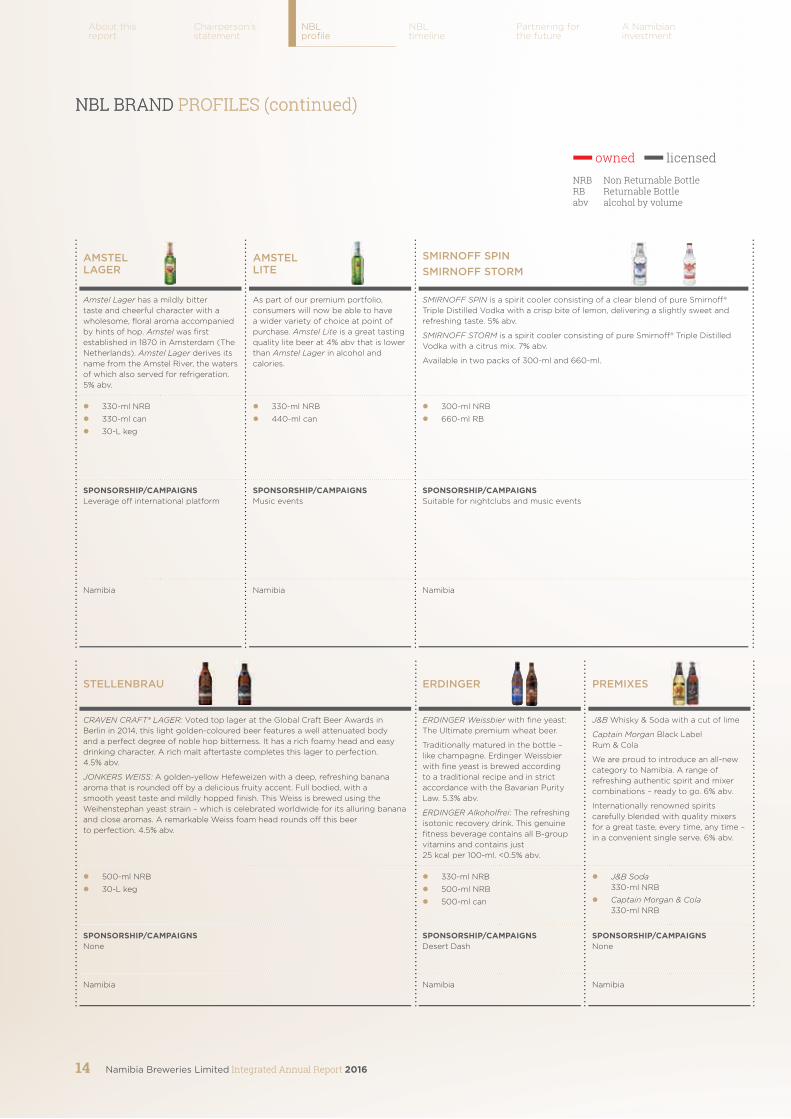
NBL BRAND PROFILES (continued)NBL BRAND PROFILES (continued)
AMSTEL LAGER
AMSTEL LITE
SMIRNOFF SPINSMIRNOFF STORM
Amstel Lager has a mildly bitter taste and cheerful character with a wholesome, floral aroma accompanied by hints of hop. Amstel was first established in 1870 in Amsterdam (The Netherlands). Amstel Lager derives its name from the Amstel River, the waters of which also served for refrigeration. 5% abv.
As part of our premium portfolio, consumers will now be able to have a wider variety of choice at point of purchase. Amstel Lite is a great tasting quality lite beer at 4% abv that is lower than Amstel Lager in alcohol and calories.
SMIRNOFF SPIN is a spirit cooler consisting of a clear blend of pure Smirnoff® Triple Distilled Vodka with a crisp bite of lemon, delivering a slightly sweet and refreshing taste. 5% abv.
SMIRNOFF STORM is a spirit cooler consisting of pure Smirnoff® Triple Distilled Vodka with a citrus mix. 7% abv.
Available in two packs of 300-ml and 660-ml.
330-ml NRB
330-ml can
30-L keg
330-ml NRB
440-ml can
300-ml NRB
660-ml RB
SPONSORSHIP/CAMPAIGNSLeverage off international platform
SPONSORSHIP/CAMPAIGNSMusic events
SPONSORSHIP/CAMPAIGNSSuitable for nightclubs and music events
Namibia Namibia Namibia
About this report
Chairperson’s statement
NBL profile
NBL timeline
Partnering forthe future
A Namibian investment
Namibia Breweries Limited Integrated Annual Report 201614
STELLENBRAU ERDINGER PREMIXES
CRAVEN CRAFT® LAGER: Voted top lager at the Global Craft Beer Awards in Berlin in 2014, this light golden-coloured beer features a well attenuated body and a perfect degree of noble hop bitterness. It has a rich foamy head and easy drinking character. A rich malt aftertaste completes this lager to perfection. 4.5% abv.
JONKERS WEISS: A golden-yellow Hefeweizen with a deep, refreshing banana aroma that is rounded off by a delicious fruity accent. Full bodied, with a smooth yeast taste and mildly hopped finish. This Weiss is brewed using the Weihenstephan yeast strain – which is celebrated worldwide for its alluring banana and close aromas. A remarkable Weiss foam head rounds off this beer to perfection. 4.5% abv.
ERDINGER Weissbier with fine yeast: The Ultimate premium wheat beer.
Traditionally matured in the bottle – like champagne. Erdinger Weissbier with fine yeast is brewed according to a traditional recipe and in strict accordance with the Bavarian Purity Law. 5.3% abv.
ERDINGER Alkoholfrei: The refreshing isotonic recovery drink. This genuine fitness beverage contains all B-group vitamins and contains just 25 kcal per 100-ml. <0.5% abv.
J&B Whisky & Soda with a cut of lime
Captain Morgan Black Label Rum & Cola
We are proud to introduce an all-new category to Namibia. A range of refreshing authentic spirit and mixer combinations – ready to go. 6% abv.
Internationally renowned spirits carefully blended with quality mixers for a great taste, every time, any time – in a convenient single serve. 6% abv.
500-ml NRB
30-L keg
330-ml NRB
500-ml NRB
500-ml can
J&B Soda 330-ml NRB
Captain Morgan & Cola 330-ml NRB
SPONSORSHIP/CAMPAIGNSNone
SPONSORSHIP/CAMPAIGNSDesert Dash
SPONSORSHIP/CAMPAIGNSNone
Namibia Namibia Namibia
owned licensed
NRB Non Returnable BottleRB Returnable Bottle abv alcohol by volume

Launched in October
2015The project to supply Namibian barley for King Lager is expected to create an additional
2 500job opportunities over a
10-year period
Some interesting facts about King Lager Namibia’s first beer brand containing home grown barley.
Operating environment
Managing Director’s Report
Value addedstatement
Good corporate governance
Remuneration report
Annual financial statements
Strategic Partnerships ❯❯ 15
Namibia Breweries Limited Integrated Annual Report 201616
About this report
Chairperson’s statement
NBL profile
Partnering forthe future
A Namibian investment
NBL timeline
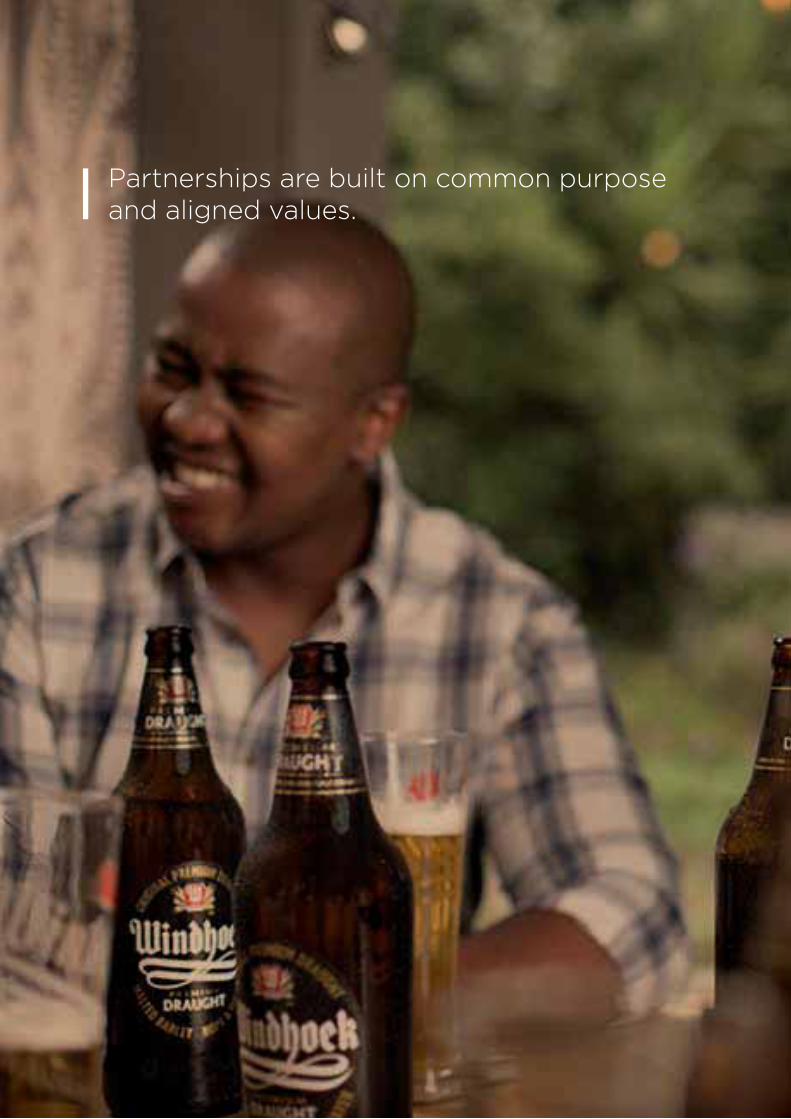
Partnerships are built on common purpose and aligned values.

Strategic Partnerships ❯❯ 17
Operating environment
Managing Director’s report
Value addedstatement
Good corporate governance
Remuneration report
Annual financial statements
Partnering for the future
20 NBL’s partnership model
32 Corporate social investment support
34 Outcomes-driven partnerships support strategy
36 A Namibian investment with long-term prospects
37 NBL timeline
Namibia Breweries Limited Integrated Annual Report 201618
About this report
Chairperson’s statement
NBL profile
Partnering forthe future
A Namibian investment
NBL timeline
PARTNERING FOR THE FUTURE
Partnerships are built on common purpose and aligned values. From its experience on partnerships, NBL believes that success is an outcome of mutual and shared objectives, two-way communication, complementary strengths and a good understanding of each other’s business.
A 12-year partnership between Diageo, Heineken and NBL (DHN Drinks (Proprietary) Limited (DHN)) was terminated during the current year. DHN in South Africa carried on the business of marketing, sale and distribution of international beer and cider brands
Read more about the transaction and future partnership with Heineken on page 23.
As partners, NBL and Heineken have been and will continue to consolidate efforts to capture further market share in South Africa based on a shared understanding of the beer business, brands and quality products – with a further opportunity to expand the combined portfolio with complementary beverages.
NBL’s strategic partnerships take several other forms:
1 as a partner of Government departments and bodies, for example with the Ministry of Agriculture, Water and Forestry on developing a local barley industry
2 with service providers such as Imperial Managed Logistics Namibia (Proprietary) Limited (IML) who acts as a primary distributor with a model that supports local and previously disadvantaged truck ownership
3 with farmers as newly established suppliers of Namibian barley for the recently launched King Lager beer
4 as an active participant in industry bodies such as the Namibia Chamber of Commerce and Industry (NCCI) and as a leader in the Self-Regulatory Alcohol Industry Forum (SAIF) – a body comprising alcohol manufacturers and distributors working together since 2007 to promote and advocate for the responsible use of alcohol
5 as a sponsor, for example of the annual Dr Hage Geingob Soccer Cup tournament where two local clubs compete against two visiting clubs, in an effort to expose our local players to international football
Strategic Partnerships ❯❯ 19
Operating environment
Managing Director’s report
Value addedstatement
Good corporate governance
Remuneration report
Annual financial statements
6 with community organisations such as the Recycle Namibia Forum to promote sustainability
7 with individuals such as Ivory Coast soccer player, Didier Drogba and Dr Helena Ndume, Namibia’s renowned eye specialist, who both acted as Windhoek Lager ambassadors and joined NBL in supporting and facilitating specialist eye treatment
8 with parent Group O&L, which provides strategic direction and centralised services such as risk management, SAP support, information technology management, human resources, corporate relations, Group employee engagement, group secretarial services, corporate finance, CSI and stakeholder engagement
Many partnerships support common and national goals such as job creation and economic empowerment. NBL has, for example, been partnering with smaller redistributors for many years, assisting them in formalising and growing their businesses through quarterly incentive schemes. In the informal market NBL also facilitates outlet licensing, and it supports shebeen owners with point of sale material and advertising. These initiatives work both ways – NBL increases its market footprint and awareness of its brands while traders grow their business and customers.
The infographic on the following pages reflects NBL’s key value network elements, and highlights where these
are based on partnerships. Each number indicates a partnership which
is described in more detail in the pages that follow.

Namibia Breweries Limited Integrated Annual Report 201620
About this report
Chairperson’s statement
NBL profile
Partnering forthe future
A Namibian investment
NBL timeline
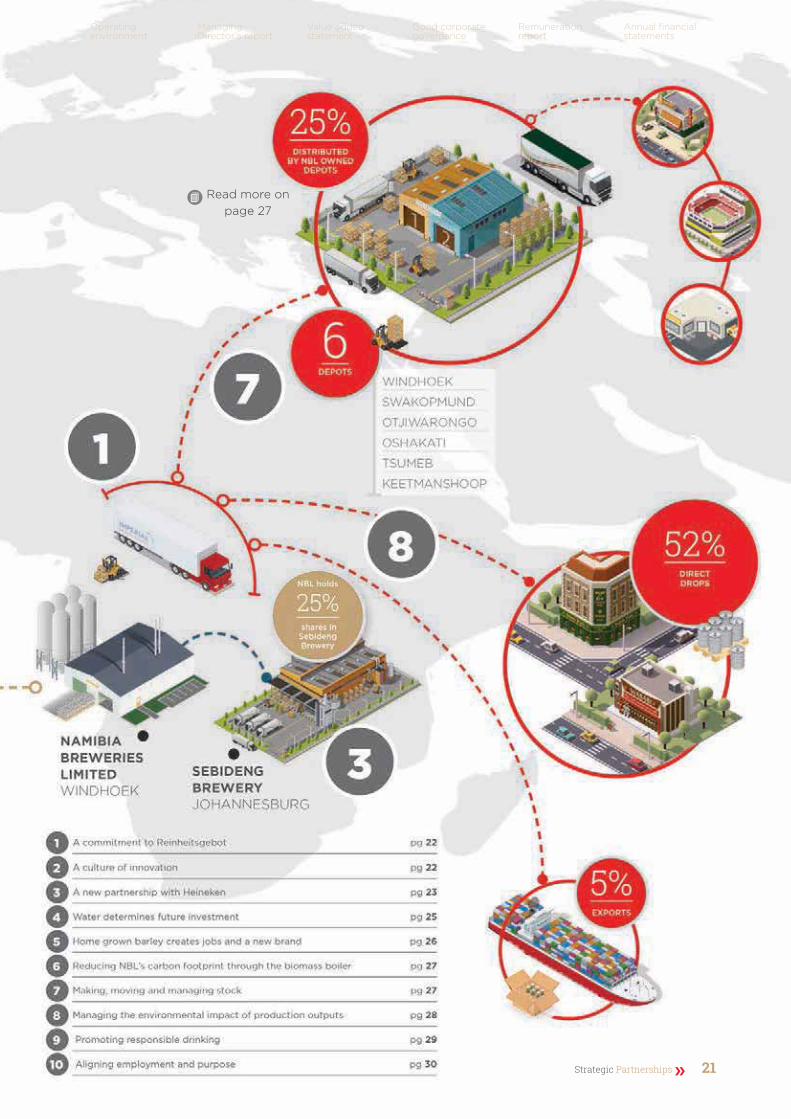
NBL’S PARTNERSHIP MODEL
Read more on page 26
Read more on page 27
Strategic Partnerships ❯❯ 21
Operating environment
Managing Director’s report
Value addedstatement
Good corporate governance
Remuneration report
Annual financial statements
Read more on page 27

Namibia Breweries Limited Integrated Annual Report 201622
About this report
Chairperson’s statement
NBL profile
Partnering forthe future
A Namibian investment
NBL timeline
1 A commitment to Reinheitsgebot
2016 was the 500-year celebration of the German Reinheitsgebot (“Purity Law”) across the world. The international beer tradition was introduced to Namibia together with the founding of the first breweries in South-West Africa (Namibia) by the German Pioneer Brewers around 1900. The Reinheitsgebot was discontinued for some years due to the unavailability of raw material and quality challenges, but was reintroduced in Namibia around 1983.
The Reinheitsgebot requires that brewers use only three natural ingredients: water, barley and hops. The law was originally introduced to protect consumers from beer that often contained additives that could be toxic or poisonous, such as mushrooms, stinging nettle and henbane.
It was also introduced in part to prevent price competition with bakers for wheat and rye. The restriction of grains to barley ensured the availability of affordable bread, as wheat and rye were reserved for use by bakers.
For NBL the Reinheitsgebot is a deliberate choice and commitment to deliver quality products on a consistent basis. It is the only brewery in Sub-Saharan Africa that adheres to the Reinheitsgebot, thereby maintaining a strong partnership with stakeholders in Europe. It also fits well with the NBL value: We do the Right Things Right.
To ensure continued compliance with the Reinheitsgebot, NBL’s brewing process is evaluated by an internationally qualified beer expert twice a year. NBL beers also participate in the DLG Quality Evaluation which is only applicable to Reinheitsgebot beers.
Read about NBL’s brand awards history inside the front cover.
In the absence of local malting facilities, NBL imports 100% of its malted barley and hops requirements from suppliers in Europe where regular quality testing of raw materials is done by accredited laboratories before being shipped. NBL’s master brewers have also been trained in Germany to ensure adherence to the spirit, and technical requirements, of the Reinheitsgebot.
NBL initiated a host of events to celebrate the birthday of the Reinheitsgebot, which commenced on 23 April 2016. These included a special pop-up museum, food and beer pairings at customer outlets, consumer promotions and beer festivals.
2 A culture of innovation
The ability to innovate is one of the drivers of economic growth for Namibia and a key element of NBL’s culture. It is also at the core of NBL’s partnership with its customers and consumers. The Group’s vision and purpose statement emphasises the ability of creating a future and enhancing life, supported by the strategic objective of Everyone Purposefully Producing Breakthrough Everywhere.
New products, packaging and launches are also measured against the aim of Amazing Experiences, Enduring impact.
NBL’s previous consumer segmentation model was done in 2005. Following the recently published results of the 2011 census, a review and overhaul of the NBL consumer profiles were initiated. Whereas the previous profiles were predominantly based on demographics, motivational factors were included in the new version. This offers insights into shifting trends and provides options for further subdivision of segments, which drives and motivates innovation decisions and investment.
During the year NBL entered into a partnership with Stellenbrau, a Stellenbosch-based craft brewer, thereby strengthening NBL’s association with a craft-style beer positioning. The partnership includes a co-packing and production arrangement which allows NBL to expand its portfolio into this new segment.
The innovation highlight for the year was the launch of King Lager in October 2015. King Lager is Namibia’s first beer brand containing home grown barley. The name ‘King’ was inspired by the quality and attributes of Namibians and symbolises respect, royalty, dignity and class.
Read more about home grown barley on page 26.
NBL PARTNERSHIP MODEL (continued)
Strategic Partnerships ❯❯ 23
Operating environment
Managing Director’s report
Value addedstatement
Good corporate governance
Remuneration report
Annual financial statements
New editions to bolster the non-alcoholic portfolio
Vigo, the premium malt-based cooler, introduced Vigo Lite to offer choices to consumers looking for a less sweet variant and also meet the ever growing trend towards healthier options.
McKane Lemonade was introduced to meet consumer requests for more options and, more specifically, for mixer friendly liquids.
Innovation activity in the beer category included:
Heineken’s brand, Amstel Lite, officially launched in Namibia in July 2015, as part of NBL’s portfolio.
Windhoek Lager renovated its packaging to support and further drive its premium positioning. The upgrade includes contemporary single serve packs, a new bottle shape for Windhoek Lager and Windhoek Light, as well as new clear plastic labels and a can for Windhoek Light.
New packaging was introduced for Tafel Lager to reinforce the national pride that Namibians have for their ‘home grown’ product. It also supports the brand’s market leader status by ensuring Tafel Lager remains at the forefront of beer packaging in the mainstream segment in Namibia. Tafel Lager has to defend its market share and NBL’s earnings ambitions by remaining relevant to consumers.
In line with worldwide health trends and the growth of the Lite beer category, NBL has launched Tafel Lite which has 27% less carbohydrates than Tafel Lager.
3 A new partnership with Heineken
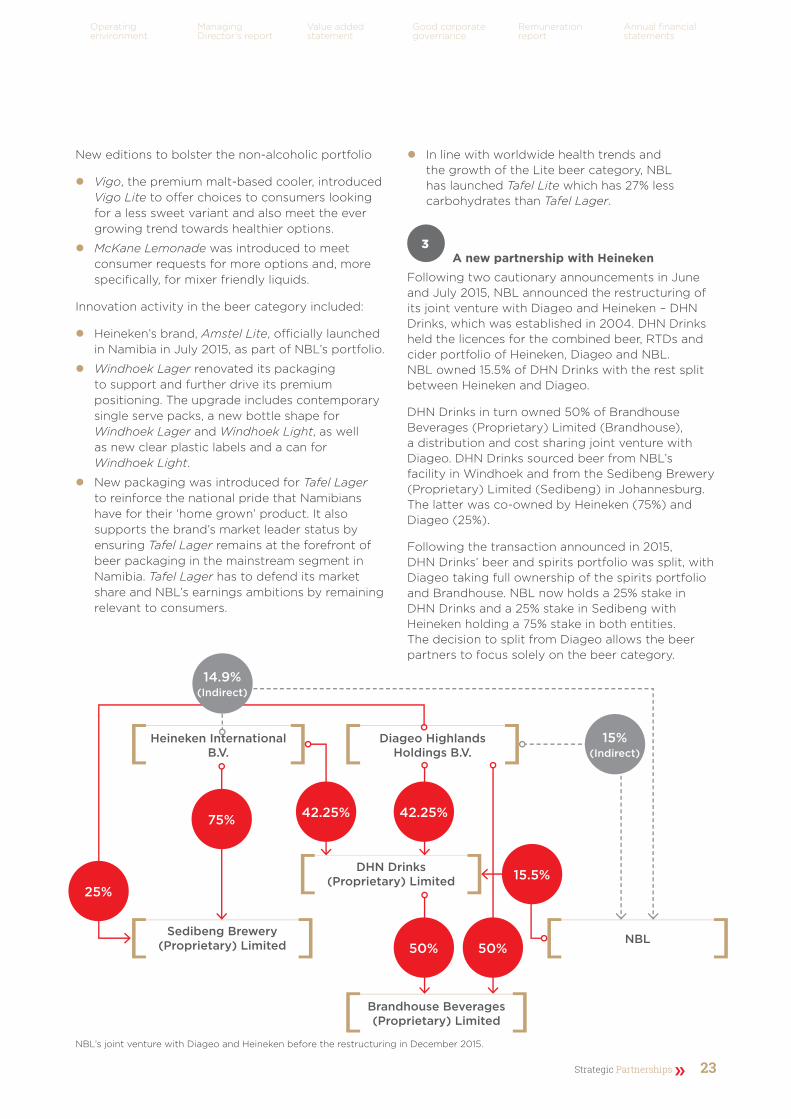
Following two cautionary announcements in June and July 2015, NBL announced the restructuring of its joint venture with Diageo and Heineken – DHN Drinks, which was established in 2004. DHN Drinks held the licences for the combined beer, RTDs and cider portfolio of Heineken, Diageo and NBL. NBL owned 15.5% of DHN Drinks with the rest split between Heineken and Diageo.
DHN Drinks in turn owned 50% of Brandhouse Beverages (Proprietary) Limited (Brandhouse), a distribution and cost sharing joint venture with Diageo. DHN Drinks sourced beer from NBL’s facility in Windhoek and from the Sedibeng Brewery (Proprietary) Limited (Sedibeng) in Johannesburg. The latter was co-owned by Heineken (75%) and Diageo (25%).
Following the transaction announced in 2015, DHN Drinks’ beer and spirits portfolio was split, with Diageo taking full ownership of the spirits portfolio and Brandhouse. NBL now holds a 25% stake in DHN Drinks and a 25% stake in Sedibeng with Heineken holding a 75% stake in both entities. The decision to split from Diageo allows the beer partners to focus solely on the beer category.
Heineken International B.V.
DHN Drinks (Proprietary) Limited
NBLSedibeng Brewery
(Proprietary) Limited
Brandhouse Beverages (Proprietary) Limited
Diageo Highlands Holdings B.V.
75%
15%(Indirect)
25%
14.9%(Indirect)
42.25% 42.25%
50% 50%
15.5%
NBL’s joint venture with Diageo and Heineken before the restructuring in December 2015.
Namibia Breweries Limited Integrated Annual Report 201624
About this report
Chairperson’s statement
NBL profile
Partnering forthe future
A Namibian investment
NBL timeline
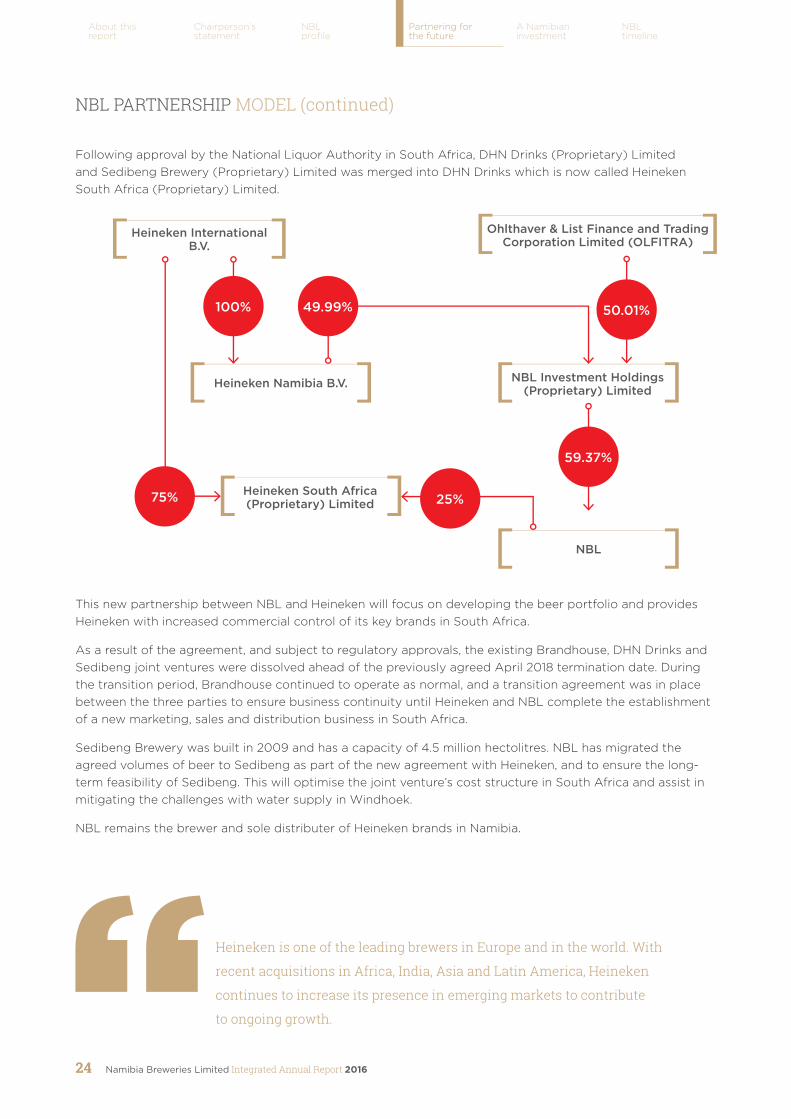
Following approval by the National Liquor Authority in South Africa, DHN Drinks (Proprietary) Limited and Sedibeng Brewery (Proprietary) Limited was merged into DHN Drinks which is now called Heineken South Africa (Proprietary) Limited.
This new partnership between NBL and Heineken will focus on developing the beer portfolio and provides Heineken with increased commercial control of its key brands in South Africa.
As a result of the agreement, and subject to regulatory approvals, the existing Brandhouse, DHN Drinks and Sedibeng joint ventures were dissolved ahead of the previously agreed April 2018 termination date. During the transition period, Brandhouse continued to operate as normal, and a transition agreement was in place between the three parties to ensure business continuity until Heineken and NBL complete the establishment of a new marketing, sales and distribution business in South Africa.
Sedibeng Brewery was built in 2009 and has a capacity of 4.5 million hectolitres. NBL has migrated the agreed volumes of beer to Sedibeng as part of the new agreement with Heineken, and to ensure the long-term feasibility of Sedibeng. This will optimise the joint venture’s cost structure in South Africa and assist in mitigating the challenges with water supply in Windhoek.
NBL remains the brewer and sole distributer of Heineken brands in Namibia.
Heineken International B.V.
Heineken Namibia B.V. NBL Investment Holdings (Proprietary) Limited
Ohlthaver & List Finance and Trading Corporation Limited (OLFITRA)
Heineken South Africa (Proprietary) Limited
NBL
59.37%
50.01%100% 49.99%
75% 25%
NBL PARTNERSHIP MODEL (continued)
Heineken is one of the leading brewers in Europe and in the world. With
recent acquisitions in Africa, India, Asia and Latin America, Heineken
continues to increase its presence in emerging markets to contribute
to ongoing growth.

Strategic Partnerships ❯❯ 25
Operating environment
Managing Director’s report
Value addedstatement
Good corporate governance
Remuneration report
Annual financial statements
4 Water determines future investment
NBL is the biggest industrial consumer of water in Windhoek. With a sustained regional drought across southern Africa, the central region of Namibia (which includes Windhoek) has been one of the worst hit areas. In May 2016, NamWater, as the national bulk supplier of water to the City of Windhoek, announced an increase from 30% to 40% in required water savings, based on the predicted average annual demand.
NBL started engaging with NamWater and the City of Windhoek at the beginning of the financial year to address the weakening supply scenario.
As an intermediate solution, NBL obtained licences to drill two boreholes on its premises from the city’s Department of Water Affairs. These proved to be well vested with underground water, and the drilling of two more boreholes is in process. These boreholes are not linked to the aquifer supplying the city with water.
Longer-term sustainable supply will depend on plans to connect the centre of Namibia to other sources of water, which will reduce the dependency on rainfall and dams. Rising demand for water is driven by an increasing population, urbanisation and industrialisation. Supply options include
desalination or, in the case of NBL, the migration of production to other areas, including Sedibeng in South Africa. As part of the new agreement with Heineken, a set volume of production has already been contracted for migration. However, if this has to increase, and volumes at the Windhoek brewery fall below a certain level, it becomes challenging to maintain yeast activity, which put the sustainability of production at risk.
NBL is continuously engaging with strategic partners such as Government and the City of Windhoek to find and support solutions, and has indicated its willingness to co-invest.
NBL’s water saving initiatives include reclamation in the brewing and packaging plants, which is set to reduce water consumption by 25%. Water reduction of 40 – 50% has been achieved in the production process over the last four years which, together with the expected reclamation saving, will bring the litres of water used to produce a litre of beverage to approximately 3.5 litres.
Currently, 4.4 litres of water is used to produce one litre of beer. The 3.4 litres beyond the actual water for the product do not go to waste – the majority is reclaimed and transferred into the city’s effluent system, where it gets recycled.
4.8
Litres of water used per litre of beverage produced
2012
4.3 4.4
2013 2015 2016
5.0
4.8
4.6
4.4
4.2
4.0
3.8
4.5
2014
4.9
Namibia Breweries Limited Integrated Annual Report 201626
About this report
Chairperson’s statement
NBL profile
Partnering forthe future
A Namibian investment
NBL timeline
In the past six months a water pre-treatment plant was installed. Collectively, these initiatives have achieved 28% self-sufficiency at year end.
Using water to produce beer during a drought, which limits water availability for livestock and human consumption, requires trade-offs that take into account all stakeholders. NBL is committed to responsible strategic decisions involving the water crisis, as these potentially have far-reaching impacts for the local economy.
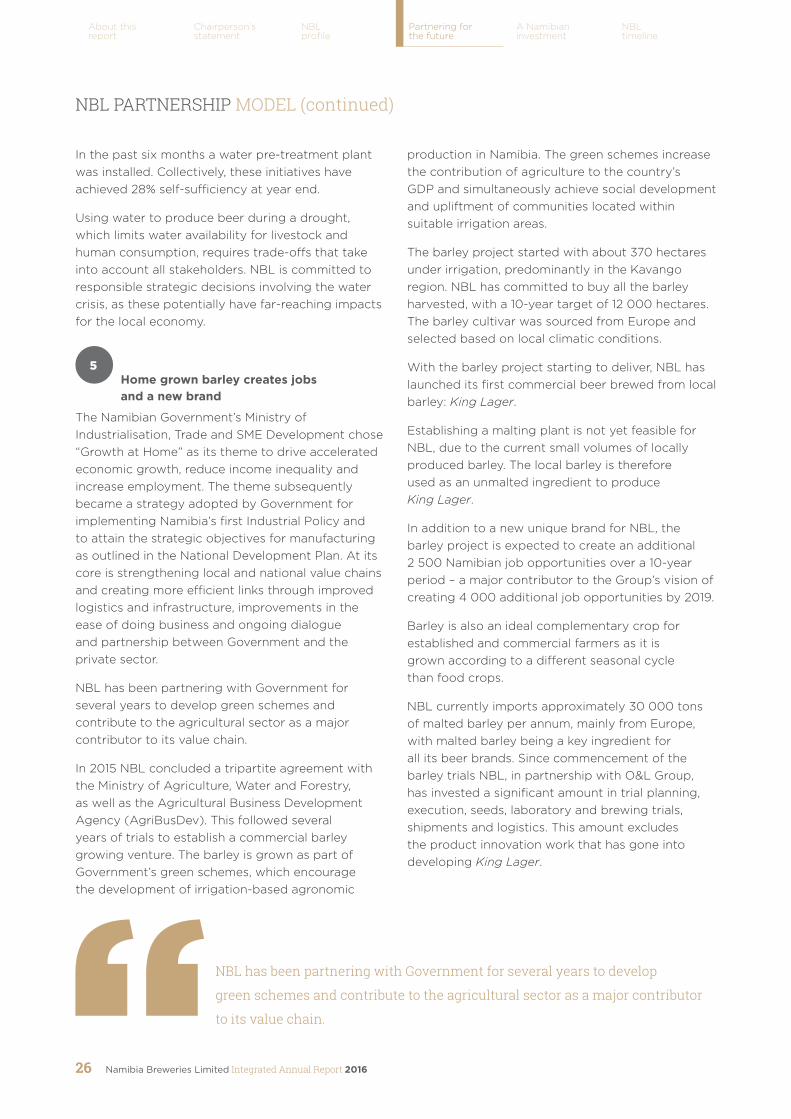
5 Home grown barley creates jobs
and a new brand
The Namibian Government’s Ministry of Industrialisation, Trade and SME Development chose “Growth at Home” as its theme to drive accelerated economic growth, reduce income inequality and increase employment. The theme subsequently became a strategy adopted by Government for implementing Namibia’s first Industrial Policy and to attain the strategic objectives for manufacturing as outlined in the National Development Plan. At its core is strengthening local and national value chains and creating more efficient links through improved logistics and infrastructure, improvements in the ease of doing business and ongoing dialogue and partnership between Government and the private sector.
NBL has been partnering with Government for several years to develop green schemes and contribute to the agricultural sector as a major contributor to its value chain.
In 2015 NBL concluded a tripartite agreement with the Ministry of Agriculture, Water and Forestry, as well as the Agricultural Business Development Agency (AgriBusDev). This followed several years of trials to establish a commercial barley growing venture. The barley is grown as part of Government’s green schemes, which encourage the development of irrigation-based agronomic
production in Namibia. The green schemes increase the contribution of agriculture to the country’s GDP and simultaneously achieve social development and upliftment of communities located within suitable irrigation areas.
The barley project started with about 370 hectares under irrigation, predominantly in the Kavango region. NBL has committed to buy all the barley harvested, with a 10-year target of 12 000 hectares. The barley cultivar was sourced from Europe and selected based on local climatic conditions.
With the barley project starting to deliver, NBL has launched its first commercial beer brewed from local barley: King Lager.
Establishing a malting plant is not yet feasible for NBL, due to the current small volumes of locally produced barley. The local barley is therefore used as an unmalted ingredient to produce King Lager.
In addition to a new unique brand for NBL, the barley project is expected to create an additional 2 500 Namibian job opportunities over a 10-year period – a major contributor to the Group’s vision of creating 4 000 additional job opportunities by 2019.
Barley is also an ideal complementary crop for established and commercial farmers as it is grown according to a different seasonal cycle than food crops.
NBL currently imports approximately 30 000 tons of malted barley per annum, mainly from Europe, with malted barley being a key ingredient for all its beer brands. Since commencement of the barley trials NBL, in partnership with O&L Group, has invested a significant amount in trial planning, execution, seeds, laboratory and brewing trials, shipments and logistics. This amount excludes the product innovation work that has gone into developing King Lager.
NBL PARTNERSHIP MODEL (continued)
NBL has been partnering with Government for several years to develop
green schemes and contribute to the agricultural sector as a major contributor
to its value chain.

Strategic Partnerships ❯❯ 27
Operating environment
Managing Director’s report
Value addedstatement
Good corporate governance
Remuneration report
Annual financial statements
6 Reducing NBL’s carbon footprint through
the biomass boiler
NBL commenced with the testing phase of the biomass boiler in the last weeks of June 2016 – a year after initiating the project. The boiler, which was imported from Austria, is set to replace 80% of the 3 600 tons of heavy furnace oil NBL annually uses.
The N$53.4 million investment will result in a reduction of 8 000 tonnes of emissions per year, 28% of NBL’s total emissions. This contributes to the O&L Group target of reducing its carbon footprint by 20% by 2019.
The boiler uses wood chips sourced via O&L partner subsidiary Organic Energy Solutions, which applies world class technology to produce chips. Approval was obtained from the Ministry of Agriculture, Water and Forestry to harvest pervasive invader bush, thereby clearing land for alternative use and improving the carrying capacity of farms.
The project, which is founded on NBL’s commitment to renewable energy, was costed based on assumptions related to variables such as the exchange rate, international oil prices and interest rates, which have since shifted significantly. This results in a longer repayment period, but still offers significant cost and environmental savings on an annual basis.
The NBL biomass boiler is the biggest wood boiler in the country and will be able to meet 80% of the brewery’s heat demand. The previous oil-fired boiler will only be activated for periods of peak demand.
7 Making, moving and managing stock
NBL is predominantly dependent on imported raw material for the production and packaging of its beverages. Packaging material, which includes bottles, cans, cartons and shrink foil is imported from South Africa, whereas raw ingredients are imported from Europe (mainly Germany and Holland).
Strategic and long-standing relationships with European suppliers ensure sustainable supply, even during constrained availability, as proven during Europe’s poor harvest last year. The procurement of a major portion of ingredients are based on long-term contracts – some running three to four years into the future – to ensure the required volumes and quality. When the exchange rate impact is excluded, pricing on these contracts remained constant over the past year.
NBL is actively exploring options to develop local supply, such as the barley and crates from local suppliers. Options to develop local packaging suppliers for crates and crown corks are underway.
Distribution partnerships
NBL owns six depots in Namibia from where it supplies the formal and informal market, with the rest being direct drop shipments to a variety of other customers. All primary transport is outsourced to strategic partner Imperial Managed Logistics Namibia (Proprietary) Limited (IML), whereas secondary distribution (between depots and customers) is done by NBL trucks and employees.
Secondary distribution customers typically include supermarkets, liquor stores, shebeens, pubs and other hospitality outlets. By owning this section of the logistics chain, NBL retains the direct customer
The NBL biomass boiler is the biggest wood boiler in the country and
will be able to meet 80% of the brewery’s heat demand.
Namibia Breweries Limited Integrated Annual Report 201628
About this report
Chairperson’s statement
NBL profile
Partnering forthe future
A Namibian investment
NBL timeline
relationship and interaction. This also enables NBL to offer allowances that incentivise customers to use hand offloading which, in turn, creates job opportunities.
Exports are handled through a combination of sea freight and trucks – the Company continuously evaluates its route to market options to ensure cost-efficiency.
IML is a Namibian company and does not own any trucks – this is outsourced to small transport companies of which more than 50% have previously disadvantaged owners. More than 80% of loads in Namibia are handled by previously disadvantaged owners.
The partnership with IML allows NBL to better manage the peak season, which sometime entails the distribution of double the normal volumes. IML also schedules according to a transport management system that ensures optimum return loads, especially from South Africa.
Continuous improvement
The return of empty 500-ml and 750-ml returnable bottles forms part of transport logistics. During 2016 a 16% improvement efficiency was achieved by implementing a new truck stacking mechanism for pallets containing empty, returnable bottles. The new stacking resulted in faster turnaround time, thereby reducing the return to factory cycle, which has a positive impact on working capital.
Since February 2015 NBL also has an agreement with competitor SABMilller Namibia to partner on returnable bottles in Namibia – weekly exchanges of each other’s returnable bottles take place.
The SAP warehouse management system will be implemented in the next year, to include all stock, bins, loading, picking and other related activities. This will assist in optimising planning, which include a growing number of new stock keeping units.
Read more about new products in the section on innovation on page 22.
To address the challenge of increasing units, increased floor space was created with the implementation of a racking programme at three facilities. Continuous improvement and excellent service are the outcomes of highly committed employees at all NBL depots, who deliver on the strategic objective to Producing Breakthrough Everywhere.
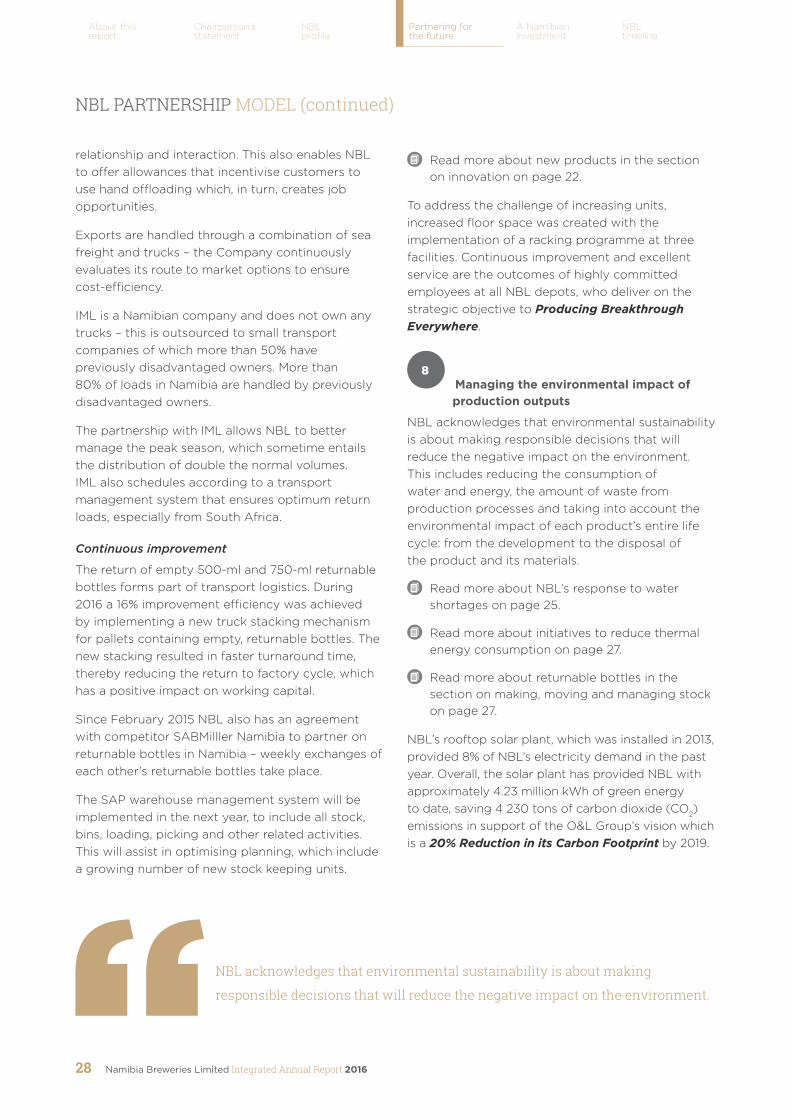
8 Managing the environmental impact of
production outputs
NBL acknowledges that environmental sustainability is about making responsible decisions that will reduce the negative impact on the environment. This includes reducing the consumption of water and energy, the amount of waste from production processes and taking into account the environmental impact of each product’s entire life cycle: from the development to the disposal of the product and its materials.
Read more about NBL’s response to water shortages on page 25.
Read more about initiatives to reduce thermal energy consumption on page 27.
Read more about returnable bottles in the section on making, moving and managing stock on page 27.
NBL’s rooftop solar plant, which was installed in 2013, provided 8% of NBL’s electricity demand in the past year. Overall, the solar plant has provided NBL with approximately 4.23 million kWh of green energy to date, saving 4 230 tons of carbon dioxide (CO2) emissions in support of the O&L Group’s vision which is a 20% Reduction in its Carbon Footprint by 2019.
NBL PARTNERSHIP MODEL (continued)
NBL acknowledges that environmental sustainability is about making
responsible decisions that will reduce the negative impact on the environment.
Strategic Partnerships ❯❯ 29
Operating environment
Managing Director’s report
Value addedstatement
Good corporate governance
Remuneration report
Annual financial statements
Beer, among other fermented alcoholic products, produces CO2 as its main by-product. On its own, the CO2 from beer fermentation is considered “carbon neutral”, as it originates from CO2 sequestered on a continuous basis by growing barley, rather than from a fossil fuel. Instead of releasing it to atmosphere, a brewery can recover, purify and re-use this CO2, sequestering it as the “fizz” in beverages.
The CO2 recovery plant allows NBL to be independent – it has not purchased CO2 since the plant was commissioned in December 2013. NBL also produces soft drinks and RTD products which require CO2. NBL is able to produce these beverages without importing CO2 from South Africa, where CO2 is mostly produced through burning fossil fuels.
NBL has sold 389 tons of excess CO2 to external customers this year (400 tons in 2015).
A further opportunity to reduce NBL’s environmental impact is by investing in an alternative solar energy cooling system.
Other waste products from the brewing process include solid waste, wastewater and emissions. Alternative uses for yeast waste is currently being explored.
Outputs further include waste in the form of packaging material once products have been consumed. A significant portion of production is packaged in returnable bottles and therefore part of an extensive collection process, waste in this regard is minimised. NBL nevertheless supports campaigns to create public awareness of good environmental practices, including clean-up campaigns such as Project Shine. The work done in the Erongo community over the past few years – to educate learners and community groups while providing them with an opportunity to earn money
through voluntary cleaning work – has now expanded to further coastal areas. NBL provides support to partners who share the same environmental objectives: municipalities, mines and community groups.
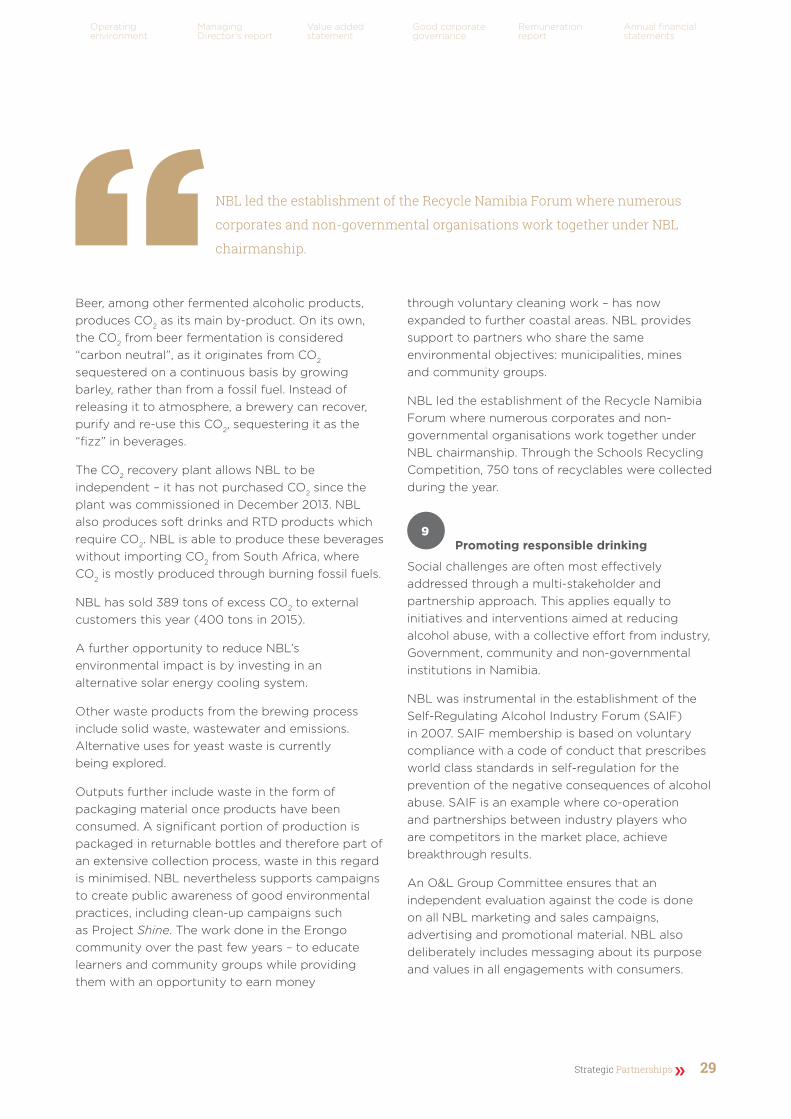
NBL led the establishment of the Recycle Namibia Forum where numerous corporates and non-governmental organisations work together under NBL chairmanship. Through the Schools Recycling Competition, 750 tons of recyclables were collected during the year.
9 Promoting responsible drinking
Social challenges are often most effectively addressed through a multi-stakeholder and partnership approach. This applies equally to initiatives and interventions aimed at reducing alcohol abuse, with a collective effort from industry, Government, community and non-governmental institutions in Namibia.
NBL was instrumental in the establishment of the Self-Regulating Alcohol Industry Forum (SAIF) in 2007. SAIF membership is based on voluntary compliance with a code of conduct that prescribes world class standards in self-regulation for the prevention of the negative consequences of alcohol abuse. SAIF is an example where co-operation and partnerships between industry players who are competitors in the market place, achieve breakthrough results.
An O&L Group Committee ensures that an independent evaluation against the code is done on all NBL marketing and sales campaigns, advertising and promotional material. NBL also deliberately includes messaging about its purpose and values in all engagements with consumers.
NBL led the establishment of the Recycle Namibia Forum where numerous
corporates and non-governmental organisations work together under NBL
chairmanship.

Namibia Breweries Limited Integrated Annual Report 201630
About this report
Chairperson’s statement
NBL profile
Partnering forthe future
A Namibian investment
NBL timeline
With road safety being a national concern, NBL continues focusing on drinking and driving. This includes awareness, prevention and co-operation with law enforcement. Partnerships involve the Namibian police, the Motor Vehicle Accident Fund, National Road Safety Council of Namibia, the Roads Authority and other stakeholders such as the Private Sector Road Safety Forum.
NBL continued with the DRINKiQ® initiative – a concept initially developed by its former strategic partner, Diageo – as a way to provide people with information to make informed decisions about alcohol consumption. By the end of the financial year, a total of 1 251 people were trained on the programme in Namibia, with recent focus on Karasburg, Lüderitz, Keetmanshoop and Walvis Bay.
The DRINKiQ programme provides participants with information to answer questions such as
What do we know about alcohol?
What does a standard drink look like?
How long does the body take to sober up, and how long before the alcohol completely leaves the body?
What are the mental, psychological and physical risks involved when abusing alcohol?
The second year of NBL’s Stay Cool, Enjoy Responsibility campaign continued in its efforts to instil a sense of accountability among consumers, well beyond alcohol related harm. The campaign is incorporated into roadblocks, billboards, trailers and special festive season events.
Through the expansion of its brand and product offering into categories such as soft drinks and water, NBL is making sure that consumers have a choice of non-alcoholic options while remaining loyal to NBL.
10 Aligning employment and purpose
NBL’s vision, to be the most progressive and inspiring company, is closely linked to the employment experience of its 740 employees. NBL is committed to providing exceptional employment experiences by promoting a progressive and inspiring workplace culture which ensures employees are valued and have opportunities to grow.
NBL contributed to O&L Group awards, which recognised its strategic partnerships with employees
O&L was awarded first place in the Deloitte Best Company To Work For survey in the large business category for the South African Development Community for three consecutive years, and received the same award for Namibia for four consecutive years up to 2014.
NBL was also recognised as a leader in the promotion of employment equity in Namibia and awarded Overall Top Performer in the Workplace category at the annual Employment Equity Commission Awards in November 2015.
Human capital policies and systems are centralised in the O&L Group, but employee programmes and engagements are adapted for each company according to their needs. NBL’s 740 employees are spread over the country – from the head office and manufacturing plant in Windhoek to six depots and a distribution centre.
In the past year NBL improved its communication processes across the business with the emphasis on highlighting excellent employee experiences and achievements. This is driven by line managers who own, build and drive engagement in their departments. An employee engagement plan was rolled out to create a platform for different
NBL PARTNERSHIP MODEL (continued)
Through the expansion of its brand and product offering into categories such as
soft drinks and water, NBL is making sure that consumers have a choice of non-
alcoholic options while remaining loyal to NBL.
Strategic Partnerships ❯❯ 31
Operating environment
Managing Director’s report
Value addedstatement
Good corporate governance
Remuneration report
Annual financial statements
departments to engage with each other, thereby creating alignment, understanding each other’s worlds and thus driving behaviour that furthers the attainment of targets.
During the year the Managing Director personally spearheaded a cultural initiative to assist management and employees to understand their individual purpose and how this aligns to the Group purpose. The Group also runs a Value Star programme which identifies specific people who display behaviours associated with the Group’s values, with an annual award ceremony and incentives. A monthly NBL Value Star is chosen with one overall winner selected from the 12 NBL employees. The annual winner joins the other subsidiary winners for an incentive trip.
The performance management process is also under review, and in the process of changing from a biannual evaluation to more regular feedback sessions. Similarly, the learning and development strategy is being adapted to consist of a proposed blended approach with 70% on-the-job training, 20% social learning and coaching and 10% formal teaching.
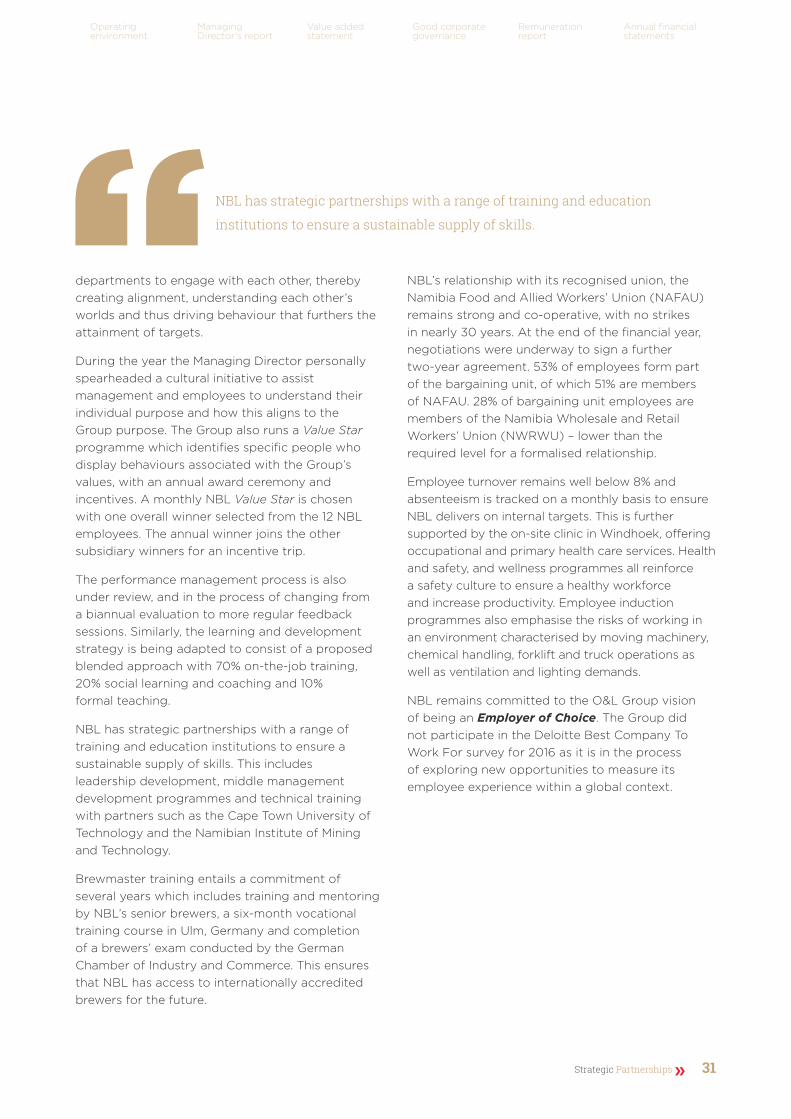
NBL has strategic partnerships with a range of training and education institutions to ensure a sustainable supply of skills. This includes leadership development, middle management development programmes and technical training with partners such as the Cape Town University of Technology and the Namibian Institute of Mining and Technology.
Brewmaster training entails a commitment of several years which includes training and mentoring by NBL’s senior brewers, a six-month vocational training course in Ulm, Germany and completion of a brewers’ exam conducted by the German Chamber of Industry and Commerce. This ensures that NBL has access to internationally accredited brewers for the future.
NBL’s relationship with its recognised union, the Namibia Food and Allied Workers’ Union (NAFAU) remains strong and co-operative, with no strikes in nearly 30 years. At the end of the financial year, negotiations were underway to sign a further two-year agreement. 53% of employees form part of the bargaining unit, of which 51% are members of NAFAU. 28% of bargaining unit employees are members of the Namibia Wholesale and Retail Workers’ Union (NWRWU) – lower than the required level for a formalised relationship.
Employee turnover remains well below 8% and absenteeism is tracked on a monthly basis to ensure NBL delivers on internal targets. This is further supported by the on-site clinic in Windhoek, offering occupational and primary health care services. Health and safety, and wellness programmes all reinforce a safety culture to ensure a healthy workforce and increase productivity. Employee induction programmes also emphasise the risks of working in an environment characterised by moving machinery, chemical handling, forklift and truck operations as well as ventilation and lighting demands.
NBL remains committed to the O&L Group vision of being an Employer of Choice. The Group did not participate in the Deloitte Best Company To Work For survey for 2016 as it is in the process of exploring new opportunities to measure its employee experience within a global context.
NBL has strategic partnerships with a range of training and education
institutions to ensure a sustainable supply of skills.
Corporate social investment support
Creating a Future, Enhancing Life
the strategic outcomes: Sustaining Growth, to be Ever-Expanding,
Securing the Future and Bringing Sustainability Everywhere,
Impacting the World.
NBL is in the process of reviewing its CSI strategy to ensure closer alignment with its strategic objectives. The O&L corporate affairs team is responsible for CSI in the Group, but NBL participates in determining projects relevant for its business, in this case for example in driving responsible drinking.
All CSI projects have a partnership approach and consider the long-term impact of the Group’s investment and involvement. CSI projects therefore have the additional benefits of enhancing relationships with key stakeholders.
Core projects include the following.
NBL PARTNERSHIP MODEL (continued)
About this report
Chairperson’s statement
NBL profile
Partnering forthe future
A Namibian investment
NBL timeline
Namibia Breweries Limited Integrated Annual Report 201632

Operating environment
Managing Director’s Report
Value addedstatement
Good corporate governance
Remuneration report
Annual financial statements
Condom distribution project
This public-private partnership between NBL, the Ministry of Health and Social Services and the German Government’s Gesellschaft für Internationale Zusammenarbeit support Namibia’s fight against the spread of HIV/AIDS. Through NBL’s distribution network, 3.2 million Smile condoms were delivered. It is estimated (by applying the John Stover measure) that approximately 6 400 new HIV infections were prevented as a result of this initiative.
Blow the horn on rhino poaching
NBL launched a campaign in support of the fight against rhino poaching. Namibia is home to free roaming rhino and the largest population of Black Rhino in Africa – one of the main drivers of tourism to the country. Tourism in turn contributes significantly to employment and economic growth. With a reward of N$1 million - and in partnership with the Ministry of Environment and Tourism, the Namibian Police and Intelligence Support Against Poaching - NBL aims to incentivise the general public to provide tip-offs leading to the arrest and prosecution of Rhino poachers.
Other initiatives include
NBL’s premium beer brand, Windhoek Lager showcased Namibia’s unique and internationally appreciated wildlife in partnership with wildlife conservation organisation N/a’ankusê.
NBL also announced the imminent release of a new television series for the Namibian Broadcasting Corporation title ‘WildJobsNamibia’. Shot entirely on location in Namibia, this was the second most viewed programme on KykNet in 2015.
NBL supports the Ministry of International Relations and Co-operation to celebrate Namibia’s Independence each year.
The Vigo brand supports schools caring for physically and mentally challenged children.
Read more about responsible drinking initiatives on page 29.
Strategic Partnerships ❯❯ 33

Outcomes-driven partnerships support strategyNBL’s strategic partnerships are selected based on common goals and values, which are directed by the Group’s strategic framework. As these constitute the foundations of partnerships, the outcome of partnership initiatives is aimed at delivering on the Group’s long-term strategic objectives. The strategic framework is set out below:
Purpose
Creating a Future, Enhancing Life
Vision
To be the most Progressive
and Inspiring Company
O&L Group Vision for 2019:
1 to reach a N$2 billion EBIT target
2to reduce the Group’s carbon footprint by 20%
3 to remain an Employer of Choice
4to create 4 000 additional job opportunities
NBL has been part of the development of and commitment to the O&L Vision 2019 process. The Group’s purpose is driven through three strategic focus areas, and the values direct their implementation. The NBL Senior Leadership Team has taken full ownership of the strategic framework, and report monthly on progress against the four vision metrics.
Extensive work has been done over the past few years to ensure that employees’ individual purposes connect to the Group purpose, thereby ensuring sustainable alignment and commitment.
Values
1 Let’s Talk
2 Let’s do it
3 Hooked on Results
4 We Grow People
5 We All Serve
6 Naturally Today for Tomorrow
7 We do the Right Things Right
NBL PARTNERSHIP MODEL (continued)
About this report
Chairperson’s statement
NBL profile
Partnering forthe future
A Namibian investment
NBL timeline
Namibia Breweries Limited Integrated Annual Report 201634

Strategic focus areas
Read more about progress in all areas mentioned above in the section on strategic partnerships from page 17 and the Managing Director’s Report from page 43.
Strategic outcomes
Everyone is deeply connected to purpose, lives the values and is
proud of what they do
Everyone is successful, thriving and making things happen in breakthrough mode
Everyone is valued, recognised and appreciated for the difference
they make
Everyone purposefully
producing breakthrough everywhere
Continued strong track record as an Employer of Choice
NBL awarded as Overall Top Performer in the Workplace category by the Employment Equity Commission of Namibia
NBL financial performance and growth
Value Star recognition programme continued
1
2
3
Progress in 2016
Strategic outcomes
Consistent experiences, amazing relationships, lasting impact
Purity inspired, reliable quality, impacting the whole
Always there, simple and easy, the natural choice
Amazing experiences,
enduring impact
Development and launch of new brands and renovated packaging
Consumer participation in brand promotions and events
Successful celebration of the Reinheitsgebot
Impact of responsible alcohol initiatives
1
2
3
Progress in 2016
Strategic outcomes
Excellence in everything, executed with care
Sustaining growth, ever-expanding, securing the future
Bringing sustainability everywhere, impacting the world
Inspired by integrity, creating trust and confidence
Sustainable execution in everything
Improved production and logistics efficiencies
Continued performance and returns for shareholders
Water supply scenarios and sustainable savings
Effective governance structures
Strategic partnerships with stakeholders
1
2
3
4
Progress in 2016
Strategic Partnerships ❯❯ 35
Operating environment
Managing Director’s Report
Value addedstatement
Good corporate governance
Remuneration report
Annual financial statements

Namibia Breweries Limited Integrated Annual Report 201636
About this report
Chairperson’s statement
NBL profile
Partnering forthe future
A Namibian investment
NBL timeline
NBL is the only home grown Namibian brewery, listed on the NSX for 20 years, with a portfolio of alcoholic and non-alcoholic brands representing the craft, premium, international premium and mainstream beverage categories.
The quality of NBL brands are consistently recognised internationally – Windhoek Lager recently won its 10th consecutive gold medal at the DLG awards.
King Lager was conceptualised to encourage the development of a local barley industry and therefore uses unmalted barley as an ingredient.
NBL’s Tafel Lager sales exceeded 1 million hectolitres for the first time in this financial year.
As from April 2016 NBL achieved a 30% water consumption reduction in line with the City of Windhoek’s requirements and in contribution to the responsible use of water due to the prevailing drought conditions. These savings are sustainable and embedded in all future operations.
Despite current economic challenges, NBL has been able to retain its price position without any negative impact on volumes.
Despite its dominant market position in Namibia, NBL has avoided complacency, continuously launching new products, new packaging and achieving sustainable efficiencies in its operations.
The South African market remains NBL’s most attractive growth opportunity, which will be exploited through the newly structured relationship with Heineken.
NBL has a stable shareholder base and strategic support through its ownership structure and position within the O&L Group. O&L effectively holds 29.69% and Heineken 29.68% in NBL.
Dividends to shareholders increased by an average of 48.1% over the past five years and the net asset value per share by 38.6%.
NBL is one of only a handful of breweries in the southern hemisphere that are self-sufficient with regards to CO2 in all aspects of production – and sells surplus CO2 to external customers.
A NAMIBIAN INVESTMENT WITH LONG-TERM PROSPECTS
200 000
180 000
160 000
140 000
120 000
100 000
80 000
60 000
40 000
20 000
800
790
780
770760
750
740
730
720710
700690
20162015201420132012
52
58
65
71
77
Dividend per share (cents) Number of employees Capital investment (N$’000)

Strategic Partnerships ❯❯ 37
Operating environment
Managing Director’s report
Value addedstatement
Good corporate governance
Remuneration report
Annual financial statements
NBL TIMELINE
NBL EXPORTED ITS FIRST BEER INTO SOUTH AFRICA 30 YEARS AGO.
NBL LISTED ON THE NSX 20 YEARS AGO.
1920On 20 October 1920, two German businessmen, Hermann Ohlthaver and Carl List, consolidated four breweries (Kronen Brauerei, Omaruru Brewery, Klein Windhoek Brewery and Felsenkeller Brewery) in what was then South-West Africa and formed South West Breweries Limited (SWB).
1965Karl Werner, the son of original founder Carl List, takes full ownership of SWB.
1981SWB’s success forced it to expand its production capacity and construction started on a new state-of- the-art brewery.
1985Windhoek Lager Beer is offered in cans for the first time.
1990In 1990, when Namibia gained independence, SWB changed its name to Namibia Breweries Limited, which is still its name today. The country’s independence also played a large role in opening further international markets for the brand.
2003NBL formed a strategic partnership with Diageo and brewer Heineken, which is locally facilitated by Brandhouse Beverages (Proprietary) Limited. The joint endeavours commitment was reinforced with the formation of DHN Drinks (Proprietary) Limited in 2008.
2013NBL installed a megawatt hybrid electricity system, which is the largest rooftop solar project to date in Africa.
2016A biomass boiler is installed in Windhoek.
NBL achieves a 30% water savings target.
1940During the 1940’s the impact of World War II made it difficult to procure the best ingredients. Brewing was suspended rather than offering an inferior product.
1968The breweries acquired the Hansa Braurei in Swakopmund, making SWB the only national brewery in South-West Africa.
1984Windhoek Light is officially launched in South Africa.
1986The new brewery is completed and Windhoek Lager Beer is allowed to be transported into South Africa for the first time.
1996NBL became a public-owned company in May 1996 when it listed on the Namibian Stock Exchange. The controlling shareholder in NBL is the O&L Group, a major Namibian conglomerate.
2008Formation of DHN Drinks (Proprietary) Limited. DHN was responsible for the marketing, sale and distribution of the international beer and cider brands.
2015King Lager was launched as Namibia’s first beer brand that contains home grown barley.
NBL restructured its joint venture in South Africa by increasing its stake in DHN Drinks to 25%. It also acquired a 25% stake in the Sedibeng brewery in Johannesburg.
NBL acquired its first water brand, AquaSplash, from Namibia Diaries.
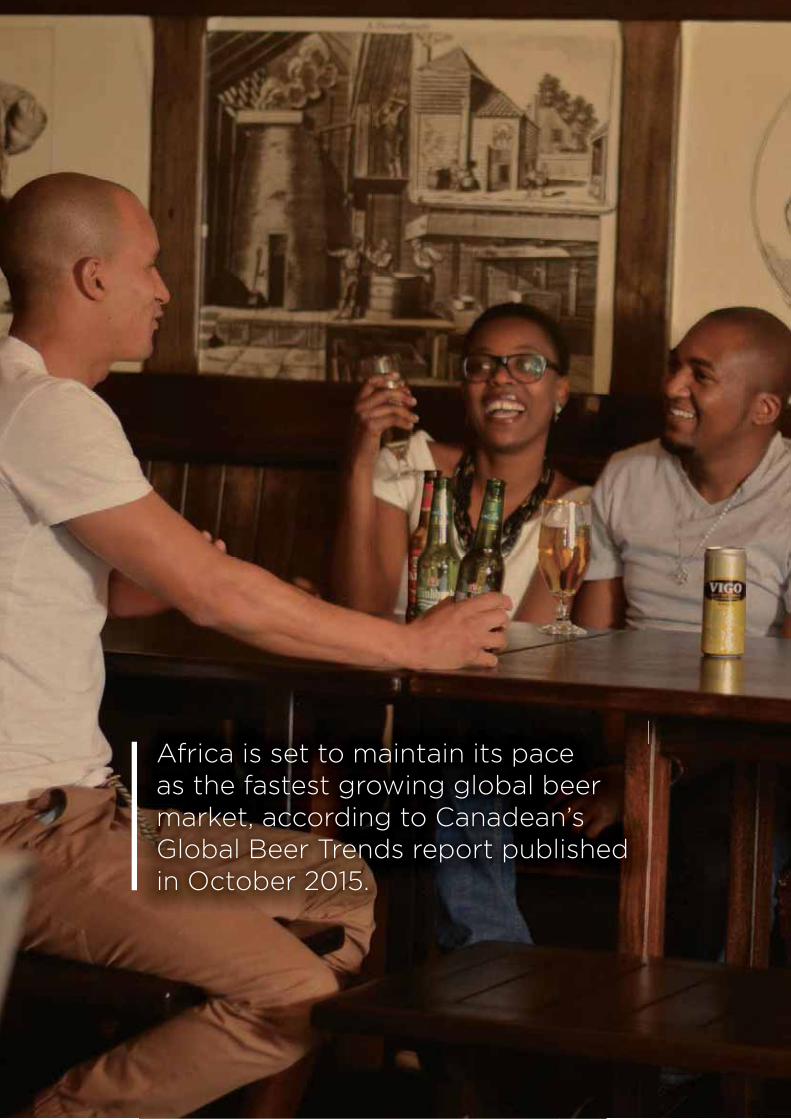
Namibia Breweries Limited Integrated Annual Report 201638
About this report
Chairperson’s statement
NBL profile
Partnering forthe future
A Namibian investment
NBL timeline
Africa is set to maintain its pace as the fastest growing global beer market, according to Canadean’s Global Beer Trends report published in October 2015.

Strategic Partnerships ❯❯ 39
Operating environment
Managing Director’s report
Value addedstatement
Good corporate governance
Remuneration report
Annual financial statements
Operating environment
40 Namibia overview
40 South Africa overview
41 Beer consumption trends

Namibia Breweries Limited Integrated Annual Report 201640
About this report
Chairperson’s statement
NBL profile
Partnering forthe future
A Namibian investment
NBL timeline
Sub-Saharan Africa offers a mixed set of opportunities and challenges, with overall economic activity weakening. According to the International Monetary Fund the region’s growth prospects are decelerating to 3%, well below the average 5% – 7% of the past decade. This has been driven primarily by a decline in commodity demand, which resulted in downward price pressure. Lower oil exports, the Ebola epidemic, widespread droughts, exchange rate volatility and political instability remain high on macro-economic agendas.
In several countries growth is supported by on-going infrastructure investment efforts and strong private consumption.
Namibia overviewNamibia’s expected GDP growth rate of 4.3% for 2016 is limited by factors such as its economic interdependency with South Africa, water restrictions and droughts, the increasing cost of electricity and municipal services, a weakening exchange rate, rising interest rates and increased competition.
Social challenges include the unavailability of skills and business experience, which contributes to continuing high levels of unemployment and poverty.
OPERATING ENVIRONMENT
“THE GLOBAL BREWERS HAVE OUTPERFORMED THE MSCI GLOBAL INDEX BY C. 300% IN THE PAST 10 YEARS, DRIVEN IN NO SMALL PART BY THE LARGE AMOUNT OF REVENUE AND COST SYNERGIES (FROM CONSOLIDATION) THAT HAVE ACCRUED TO
SHAREHOLDERS OVER TIME.” – CORONATION COROSPONDENT, JANUARY 2016
The last Namibian census was conducted in 2011 with data released in 2013 and 2014. According to the census, half of Namibia’s 2.1 million adult population is aged below 24 years. The median age is 21 years, which is considered ‘young’ by international standards.
According to the Namibia Liquor Act, 1998 (Act No. 6 of 1998), sales of liquor to any person under the age of 18 years are not permitted.
South Africa overviewSouth Africa is expected to achieve a low GDP growth rate of 0.2% in 2016. Political uncertainty has led to low investor confidence and the threat of a downgrade of the country’s sovereign credit rating to junk status.
Widespread droughts impact food prices, and along with the volatility of the Rand, constitute a key driver of inflation as interest rates rise. Consumers are under severe pressure and social unrest is increasing as the country nears municipal elections in August 2016.
The South African Rand exchange rate (to which the Namibia Dollar is linked) deteriorated over the financial year, and remains volatile. The graph that follows shows the trend against the Euro over the year.
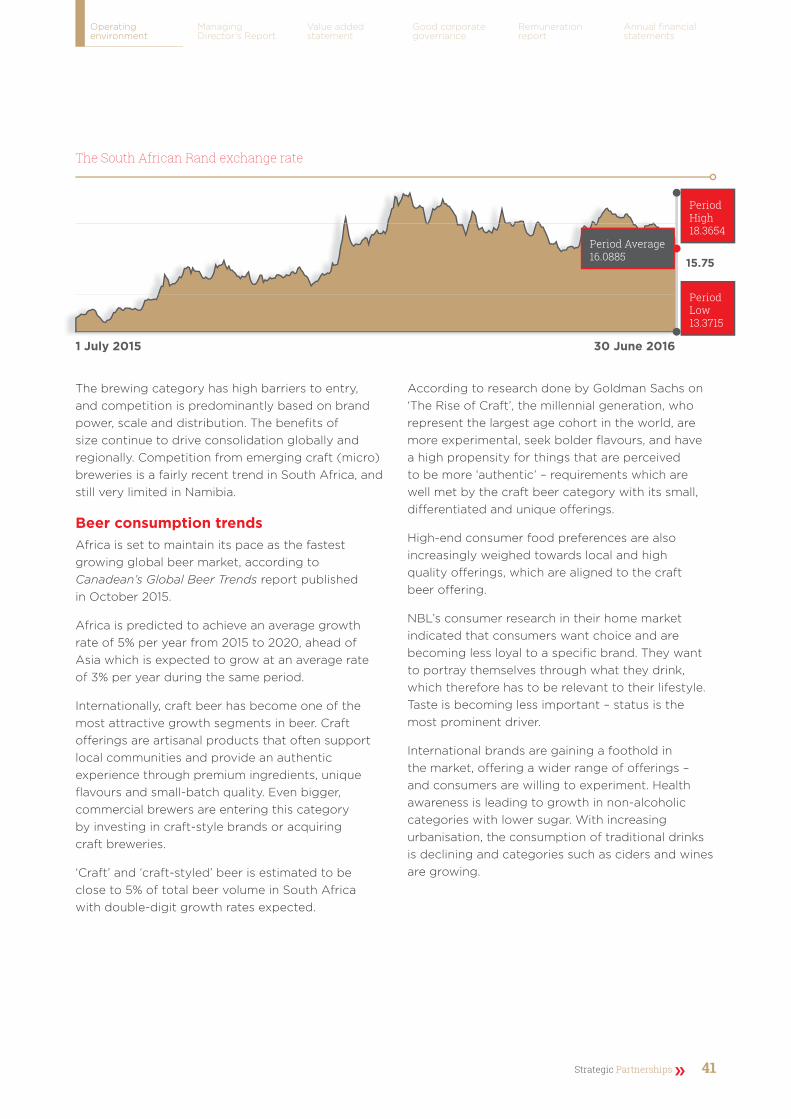
Strategic Partnerships ❯❯ 41
Operating environment
Managing Director’s Report
Value addedstatement
Good corporate governance
Remuneration report
Annual financial statements
The brewing category has high barriers to entry, and competition is predominantly based on brand power, scale and distribution. The benefits of size continue to drive consolidation globally and regionally. Competition from emerging craft (micro) breweries is a fairly recent trend in South Africa, and still very limited in Namibia.
Beer consumption trendsAfrica is set to maintain its pace as the fastest growing global beer market, according to Canadean’s Global Beer Trends report published in October 2015.
Africa is predicted to achieve an average growth rate of 5% per year from 2015 to 2020, ahead of Asia which is expected to grow at an average rate of 3% per year during the same period.
Internationally, craft beer has become one of the most attractive growth segments in beer. Craft offerings are artisanal products that often support local communities and provide an authentic experience through premium ingredients, unique flavours and small-batch quality. Even bigger, commercial brewers are entering this category by investing in craft-style brands or acquiring craft breweries.
‘Craft’ and ‘craft-styled’ beer is estimated to be close to 5% of total beer volume in South Africa with double-digit growth rates expected.
According to research done by Goldman Sachs on ‘The Rise of Craft’, the millennial generation, who represent the largest age cohort in the world, are more experimental, seek bolder flavours, and have a high propensity for things that are perceived to be more ‘authentic’ – requirements which are well met by the craft beer category with its small, differentiated and unique offerings.
High-end consumer food preferences are also increasingly weighed towards local and high quality offerings, which are aligned to the craft beer offering.
NBL’s consumer research in their home market indicated that consumers want choice and are becoming less loyal to a specific brand. They want to portray themselves through what they drink, which therefore has to be relevant to their lifestyle. Taste is becoming less important – status is the most prominent driver.
International brands are gaining a foothold in the market, offering a wider range of offerings – and consumers are willing to experiment. Health awareness is leading to growth in non-alcoholic categories with lower sugar. With increasing urbanisation, the consumption of traditional drinks is declining and categories such as ciders and wines are growing.
15.75
1 July 2015 30 June 2016
Period Average 16.0885
Period Low13.3715
Period High 18.3654
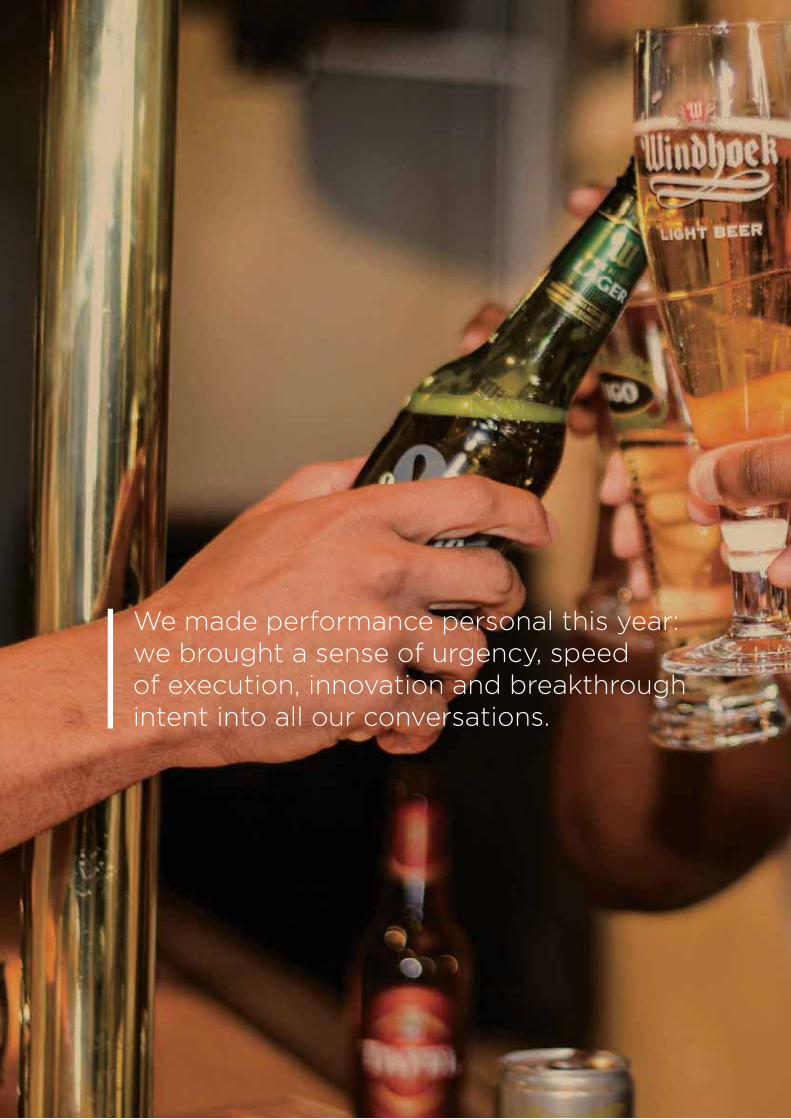
Namibia Breweries Limited Integrated Annual Report 201642
About this report
Chairperson’s statement
NBL profile
Partnering forthe future
A Namibian investment
NBL timeline
We made performance personal this year: we brought a sense of urgency, speed of execution, innovation and breakthrough intent into all our conversations.
Strategic Partnerships ❯❯ 43
Operating environment
Managing Director’s report
Value addedstatement
Good corporate governance
Remuneration report
Annual financial statements
Managing Director’s Report
44 Overview
44 Performance summary
45 Salient features
46 Financial results
48 Marketing and brand performance
48 Strategic risks and opportunities
49 Improved efficiency achieved
50 Future capital investment and water scenarios
50 Outlook
51 Value added statement

About this report
Chairperson’s statement
NBL profile
Partnering forthe future
A Namibian investment
NBL timeline
Overview
PARTNERING
FOR GROWTH
MANAGING DIRECTOR’S REPORT
Our performance was the direct result of employees taking ownership and bringing our purpose to life: Creating a Future, Enhancing Life. As each employee finds their individual purpose and their connection to the Group purpose, we see exponential contributions to the business and to Namibia in total. We made performance personal this year: we brought a sense of urgency, speed of execution, innovation and breakthrough intent into all our conversations.
The exchange rate shock of the past two years, combined with direct competition in our home market, took the business out of its comfort zone and created a virtual crisis. This brought us to breakthrough leadership, which has made a significant impact on how we do business – with excellent results.
Performance summaryRevenues decreased by 0.3% for the year. Namibia beer volumes increased by 8%, driven predominantly by Tafel Lager sales which, for the first time, achieved more than 1 million hectolitres in 12 months (a significant contribution to total Namibian beer volumes). Beer volumes shipped to South Africa decreased by 43% due to volumes migrated to Sedibeng as part of the new Heineken agreement.
Export beer volumes (excluding South Africa) decreased by 5%. NBL’s sales strategy in export markets is differentiated according to the market’s denomination as a focus or trading market. Focus markets include Tanzania, Mozambique, Zambia and Botswana: markets with high growth potential and therefore earmarked for in-market presence and investment. Tanzania doubled volumes year-on-year for the third consecutive year and continues outperforming expectations. Botswana managed to halt an initial decline in volumes through pack renovation and competitive pricing. Mozambique disappointed and Zambia remains challenging due to currency devaluation.
Namibia Breweries Limited Integrated Annual Report 201644

Operating environment
Managing Director’s report
Value addedstatement
Good corporate governance
Remuneration report
Annual financial statements
We are building sustainable structures, driving execution and building direct relationships through our in-country employees in these focus markets. In the past year there were new Windhoek Draught pack sizes launched in Mozambique and Botswana while Vigo is a strategic focus in Zambia and Botswana.
In the long term we aim to create economies of scale in these regional markets to be able to manufacture in-market, thereby reducing transport and other costs, which are negatively impacting our ability to achieve competitive prices. At the moment the fact that NBL does not have returnable volumes also counts against us from a volume and cost perspective.
Trading markets include, for example, the United Kingdom, Germany and Australia where expat communities and tourism exposure to Namibia are driving demand. Volumes in trading markets remained flat but we are committed to drive these as part of our growth strategy.
Hendrik van der WesthuizenManaging Director
We are building
and building direct
relationships through
employees in these
Revenue
N$2.4 billion ( 0.3%)
Tafel Lager
> 1 million hectolitres in 12 months
Salient features
Namibian beer volumes +8% (2015: +8%)
Operating profit for the period +6.7% (2015: +12.2%)
Basic earnings per ordinary share +43.8% (2015: +26.0%)
Headline earnings per ordinary share 185.7 cents (2015: 187.1 cents)
Full dividend per ordinary share 77 cents (2015: 71.0 cents)
Strategic Partnerships ❯❯ 45

Namibia Breweries Limited Integrated Annual Report 201646
Financial results
Consolidated statements of comprehensive income
30 June 2016
N$’000s
30 June 2015
N$’000s
Turnover 2 425 885 2 434 177
Operating expenses (1 885 211) (1 927 663)
Operating profit 540 674 506 514
Finance costs (39 412) (8 847)
Finance income 18 315 22 000
Equity loss from joint venture (ongoing operations) (38 917) (124 593)
Equity loss from associate (ongoing operations) (61 759) –
Equity income from associate (deferred tax asset write-back) 89 212 –
Profit before income tax 508 113 395 074
Income tax expense (135 643) (136 092)
Profit attributable to ordinary shareholders 372 470 258 982
Consolidated statements of financial position
Property, plant and equipment 983 365 871 133
Investment in joint venture – 28 325
Investment in associate 610 526 –
Non-current assets held for sale – 4 500
Other non-current assets 25 530 16 762
Current assets 850 796 816 429
Total assets 2 470 217 1 737 149
Issued capital 1 024 1 024
Foreign currency translation reserve 249 (3)
Retained income 1 256 521 1 043 078
Ordinary shareholders’ equity 1 257 794 1 044 099
Interest-bearing loans and borrowings (non-current) 479 739 13 821
Other non-current liabilities 212 949 207 274
Current liabilities 519 735 471 955
Total equity and liabilities 2 470 217 1 737 149
MANAGING DIRECTOR’S REPORT (continued)
MALT, WHICH IS IMPORTED FROM EUROPE, IS NBL’S SINGLE BIGGEST COST ELEMENT.
About this report
Chairperson’s statement
NBL profile
Partnering forthe future
A Namibian investment
NBL timeline

Strategic Partnerships ❯❯ 47
Turnover decreased by 0.3% to N$2 425 million (2015: N$2 434 million) mainly due to a decrease in volumes migrated to Sedibeng.
NBL’s operating profit (before equity losses) increased by 6.7%. The Group’s cost base benefited from favourable price variances for raw materials and packaging materials which supported the growth in operating profit.
One of NBL’s cost realities is the fact that all machinery and the related repairs and maintenance services are imported, and therefore subject to the exchange rate. We continuously expand our technical expertise to do as much internal line maintenance as possible.
Malt, which is imported from Europe, is NBL’s single biggest cost element.
38% of commodities was sourced locally, exceeding the target of more than 30% by 2019. We also continue to reduce packaging material losses, which was 1.51% compared to 1.95% in 2015.
During the year, the production of 320 000 hectolitres of beer was migrated to Sedibeng, which affected unit cost performance in Namibia.
Profit after tax increased by 43.8%, mainly due to the deferred tax write back in the current year. In 2013, the Group recognised a full write-down of its portion (15.5%) of the deferred tax asset in Heineken South Africa (Proprietary) Limited (formerly known as DHN Drinks (Proprietary) Limited, amounting to N$188.1 million. During the current year, after the restructuring, the Directors consider, that at year end, a portion of the N$1.6 billion assessed loss in Heineken South Africa (Proprietary) Limited is recoverable and have therefore included an amount of N$89.2 million, being its share of the deferred tax asset included in the Heineken South Africa (Proprietary) Limited accounts.
Our performance was the
direct result of employees
taking ownership and
bringing our purpose to
life: Creating a Future,
Enhancing Life.
DHN Drinks has been a loss-making entity for the past 9 years, attributed to a fiercely competitive environment in South Africa and higher cost of goods sold per unit. NBL earned royalties from the joint venture. A total of N$49.7 million and N$38.9 million was earned in royalties from DHN Drinks and Heineken South Africa respectively in the current year.
Profit attributable to shareholders of N$372 million was delivered – an increase of 43.8% on the prior year.
Operating environment
Managing Director’s Report
Value addedstatement
Good corporate governance
Remuneration report
Annual financial statements
320 000
240 000
160 000
80 000
Hec
tolit
res
0201620152014

Namibia Breweries Limited Integrated Annual Report 201648
About this report
Chairperson’s statement
NBL profile
Partnering forthe future
A Namibian investment
NBL timeline
NBL’s net debt to equity ratio increased to 26% (2015: -14 %) following the restructuring of the South African operations.
On 1 December 2015 the Group acquired 25% of the issued share capital of Sedibeng and an additional 9.5% of the issued share capital of DHN Drinks from Diageo Holdings B.V. DHN Drinks was responsible for the sale, marketing and distribution of international beer and RTD brands whereas Sedibeng carried on the business of manufacturing these brands and providing these exclusively to DHN Drinks for distribution in the relevant markets. The total investment amounted to N$611 million, which impacted total loans and borrowings, gearing and interest cover. A total of N$500 million was raised from interest-bearing borrowings, which was partly used to fund the restructuring of the South African joint venture (N$200 million) and partly for operational costs (N$300 million).
Net cash flows from operating activities decreased to N$357 million (2015: N$466 million) due to reduced revenue and increases in working capital requirements. Net cash outflow from investing activities increased – mainly due to the purchase of shares in the associate and increased capital expenditure. Net cash flow from financing activities increased to N$347 million (2015: N$4 million) mainly due to the N$500 million loans raised during the year.
Read more about financial risks in the annual financial statements on page 113.
Marketing and brand performanceOur customers and consumers remained at the heart of our marketing and innovation agenda. This means that all decisions were based on our strategic intent to deliver consistent experiences with lasting impact. As a result, our portfolio is expanding into new non-alcoholic categories, providing more options for people who ask for healthy and authentic choices.
Our marketing strategy has two pillars
Growing our share of beverage
Delivering growth through scalable innovation
A highlight for the past year was the launch of King Lager as a combined business and social development initiative. The new beer expands NBL’s portfolio while driving the development of local barley growing, which creates jobs and results
in economic empowerment within the agricultural sector. It is also a good example of how strategic partnerships between business and Government can deliver on common goals.
We also launched McKane Lemonade and Amstel Lite and increased trading in the mainstream water category with AquaSplash, which NBL acquired from O&L subsidiary, Namibia Diaries in 2015.
NBL has strengthened its strategy to position itself in the craft beer market.
In Namibia, our marketing and sales initiatives are directed by creating great consumer brand experiences, for example McKane’s campaign to crown the first Namibian master of mixology. We continue leveraging the power of digital to entrench our connections with consumers and work hard at being our suppliers’ most trusted business partner of choice.
As always, we consider every product launch, promotion and campaign against the requirements of the SAIF’s code of conduct to ensure responsible consumption.
Read more about our responsible drinking initiatives on page 29.
Strategic risks and opportunitiesStrategic risks currently include
Continued foreign currency fluctuation, which poses exchange rate risks – we are exploring markets which provide exchange hedging, reduce operating expenses and continue developing local supply.
Political and social instability in the region negatively affecting investor confidence – we engage with Government and investors to ensure that there is a solid understanding of our strategy and growth opportunities.
Regional water shortages due to climate change and ageing infrastructure – we have developed water supply scenarios for NBL with different trade-offs and decisions based on the outcomes of our discussions underway with local and national authorities.
Loss of beverage market share due to changing brand loyalty and consumer trends – we track market and consumer insights in combination with business planning analyses to develop proactive responses and options.
MANAGING DIRECTOR’S REPORT (continued)
Strategic Partnerships ❯❯ 49
Operating environment
Managing Director’s Report
Value addedstatement
Good corporate governance
Remuneration report
Annual financial statements
Inability to retain and attract skills in Namibia, combined with limited availability – we are reviewing our remuneration model, including reward and recognition best practice options.
The South African beer market remains NBL’s biggest growth opportunity in the short term. South Africa is one of the biggest beer markets in the region, with beer volume growth projected to be approximately 1.5% per annum, from its current 30 million hectolitres, to potentially reaching 35 million hectolitres by 2024. The new arrangement with Heineken South Africa (Proprietary) Limited is focused on growing our beer portfolio in Namibia and South Africa, and includes our Windhoek products as well as the Heineken and Amstel portfolio.
Read more about strategic partnerships on page 17.
Improved efficiency achievedNBL implemented Total Productive Manufacturing (TPM) as a programme to eliminate waste and improve product quality. It is based on a teamwork approach and entrenches a culture of continuous improvement.
TPM is especially relevant with capital intensive companies where there is a need to keep the plant running efficiently, hence significant focus is placed on maintenance. Another focus area is a rigorous loss and waste analysis to drive dedicated profit improvement projects and to create day-to-day problem solving structures.
NBL achieved a 16% improvement in efficiency through a new truck stacking mechanism for pallets containing empty, returnable bottles. This means that we achieve a faster turnaround time, thereby reducing the return to factory cycle, which has a positive impact on working capital.
Several new product and packaging launches contributed to a significant increase in the number of stock keeping units to be managed. We have addressed this challenge by increasing our available floor space with the implementation of a racking programme at three facilities.
It remains a challenge to manage return logistics from South Africa to ensure round trip efficiency
– we do this by aligning raw material imports from South Africa with beer volumes exported to South Africa. The costing ratio from South Africa to Namibia remains much higher than the opposite trip due to supply and demand dynamics.
This year all stock age management and budgeting activities have been transferred to SAP. The new stock ageing model enables us to ensure freshness of our products as we track profiles per stock keeping unit. For the next year we will be implementing the electronic warehouse management system (EWMS).
Packaging line efficiency also improved significantly following the implementation of an automated, computerised line monitoring system, which operates via a centralised platform, allowing up-to-date information on more than 100 individual machines. We are able to analyse root causes faster and have been able to reduce stoppages. The packaging plant further benefited from the installation of a new data management system, which includes dashboard reporting on productivity and the consumption of water, electricity and other utilities.
Environmental impact reduced
The water-balancing tool that we identified as a priority in the 2015 report has been implemented, together with initiatives to enable water reclamation. The tool enables us to track water usage throughout the system, identify quality levels and then reclaim water through a reverse osmosis filtering process. In packaging we are now reclaiming all water used in crate washing. The water-balancing tool further alerts us to any un-scoped water usage or loss in the system through an alarm linked to water meters. We can then intervene and reduce loss immediately.
The fully automated biomass boiler is now running. The boiler is set to supply 80% of NBL’s heat requirements and benefits from Namibian invader bush with very high calorific value. This provides a highly efficient source of wood, compared to similar boilers in Europe where the wood has much higher water content. NBL now uses 2.2 – 2.5 kg of wood to replace 1 kg of heavy furnace oil.
Read more about the biomass boiler on page 27.
Namibia Breweries Limited Integrated Annual Report 201650
About this report
Chairperson’s statement
NBL profile
Partnering forthe future
A Namibian investment
NBL timeline
Future improvements will focus on alternative uses of waste and improved efficiency in cooling, especially after fermentation. Water will remain a priority for all aspects of production and future investments.
The table below reflects NBL’s environmental performance indicators against benchmarks according to financial years:
Environmental parameters 2014 2015 2016 Benchmark
Water consumption (hl* per hl of product)
4.9 4.8 4.4 5.0 (industry average)
Total electrical energy consumption (kWh** per hl of product)
9.0 9.2 9.5 N/A^
Thermal energy consumption (MJ*** per hl of product)
65.2 64.0 70.2 77.0 (global standard)
* hl = hectolitre (equal to 100 litres)** kWh = one kilowatt hour (equal to 3.6 mega joules)*** MJ = one mega joule (equal to one million joules)^ No comparable data available due to difference in technology, seasonality and volume throughput
Future capital investment and water scenariosAn imminent decision to invest in a new packaging line is now subject to the strategic and long-term availability of water. At the Windhoek brewery, NBL has sunk two boreholes and further options being explored to ensure independence from the City of Windhoek’s water supply. A further option will be an increase in volumes migrated to Sedibeng, with a worst case scenario being the transfer of all production to the Johannesburg site (with potential water risks anticipated in that area as well).
OutlookIn the Namibian and export markets we will continue to strengthen our current portfolio of brands as well as drive future growth through exciting and new-to-world innovations in line with consumer needs and trends. The Namibian market is fairly saturated but increasingly dynamic due to changing consumer trends. Fortunately, NBL remains a preferred supplier with a strong distribution network, which will serve us well as we diversify into other beverage categories.
For exports, we continue to optimise our routes to market, with sea freight and alternative ports as key options.
In the South African market, we will leverage and maximise scale efficiencies and capabilities of the new Heineken partnership. We foresee that our South African operations will become profitable within the short term.
We expect some recovery in the exchange rate over the short to medium term. Water is expected to remain the biggest challenge, and can even result in a recession. We are cognisant of NBL’s potential contributions and strategic choices as these all affect a wider stakeholder community – for example as an employer and a significant procurer of goods and services in Namibia. Our entire value chain is at risk due to the water situation.
Read more about our response to water supply on page 25.
MANAGING DIRECTOR’S REPORT (continued)
Creating a Future, Enhancing Life will remain our core vision to cultivate
innovation, growth and breakthrough results.

Strategic Partnerships ❯❯ 51
Notes
30 June 2016
N$’000s
30 June 2015
N$’000s
WEALTH CREATEDRevenue 2 425 885 2 434 177Paid to suppliers for materials and services (1 885 211) (1 927 663)VALUE ADDED (540 674) 506 514Income from investments 18 315 22 000TOTAL WEALTH CREATED 558 989 528 514
WEALTH DISTRIBUTIONSalaries, wages and other employment costs 1 289 544 268 714Providers of capitalDividends to shareholders 159 027 146 636Finance costs on borrowings 39 412 8 847Central and local governments 2 132 034 135 869Reinvested in Group to maintain and develop operations
Amortisation 4 526 3 745Depreciation 119 676 112 817Retained earnings 213 443 112 346Deferred taxation 6 009 2 057
TOTAL WEALTH DISTRIBUTED 963 671 791 031
NOTES TO THE VALUE ADDED STATEMENT1. Salaries, wages and other employment costs Salaries, wages, overtime payments, commissions, bonuses
and allowances 244 428 226 415Total contributions to medical aid and pension fund 45 116 42 299
289 544 268 714
2. Central and local governments Normal corporate taxation 129 634 134 035 Rates and taxes paid on properties 2 400 1 834
132 034 135 8693. Additional amounts collected on behalf of central and local governments Customs and excise duties including import surcharges 580 555 605 367 Value added tax collected on revenue 110 638 73 927 PAYE deducted from remuneration paid 43 537 32 983 Withholding taxes 4 935 7 531
739 665 719 808Number of employees 740 786
VALUE ADDED STATEMENT
Operating environment
Managing Director’s Report
Value addedstatement
Good corporate governance
Remuneration report
Annual financial statements
Namibia Breweries Limited Integrated Annual Report 201652
About this report
Chairperson’s statement
NBL profile
Partnering forthe future
A Namibian investment
NBL timeline
The NSX requires NBL to comply with the Corporate Governance Code for Namibia (NamCode) which is based on the principles of South Africa’s 2009 King Report on Corporate Governance’s (King III) recommendations as well as Namibian legislation.
Strategic Partnerships ❯❯ 53
Operating environment
Managing Director’s report
Value addedstatement
Good corporate governance
Remuneration report
Annual financial statements
Good corporate governance
54 Board profiles
58 Senior Leadership Team
60 Introduction
60 Compliance
60 The Board
62 Board Committees
65 Internal controls
66 Stakeholder communications, ethics and the Tip-Offs Anonymous hotline
68 Remuneration report
68 Remuneration principles and governance
68 Directors’ emoluments
69 Remuneration components

Namibia Breweries Limited Integrated Annual Report 201654
Board profiles
GOOD CORPORATE GOVERNANCE
Hendrik van der Westhuizen (42)
Qualifications: BSc in Operations Management from the Production Management Institute of South Africa, Post Graduate Degree in Association in Management (AIM) from University of Cape Town and a Management and Senior Management Diploma from the University of Stellenbosch
Wessie has been with the O&L Group since 2003. In 2006 he was appointed to the board of Hangana Seafood (Proprietary) Limited and became its Managing Director in 2009. He played an integral role in successfully placing Hangana Seafood (Proprietary) Limited on the road of sustained profitability and has over 19 years of experience in the Food and Beverage Industry.
He was appointed to the Board as Managing Director on 2 April 2012.
Executive Directors
Sven Thieme (48)
Qualifications: CA(Nam)
Sven is the Executive Chairperson of the O&L Group. He joined O&L in 1998, after working for four years as a Chartered Accountant in Luxembourg. He was also the architect of several joint ventures entered into by O&L, including the deal between Heineken, Diageo and Namibia Breweries.
He was appointed to the Board in March 2002 and elected Chairperson on 11 July 2002.
Graeme Mouton (39)
Qualifications: CA(Nam)
Graeme joined O&L Group in 2005 as Finance Manager at the O&L Centre. In 2007, Graeme was seconded to Guinness Ghana Breweries Limited in Accra, a Diageo subsidiary, as a Management Accountant for 19 months. Prior to his current role, he held the position of Finance Director at Model Pick n Pay Namibia.
He was appointed to the Board on 17 September 2013.
About this report
Chairperson’s statement
NBL profile
Partnering forthe future
A Namibian investment
NBL timeline
The NBL Board of Directors is committed
to corporate governance and has put
processes in place to ensure that NBL
continuously strives to achieve Namibian
and international best practice.
Non-executive Directors

Strategic Partnerships ❯❯ 55
Operating environment
Managing Director’s Report
Value addedstatement
Good corporate governance
Remuneration report
Annual financial statements
Ernst Ender (73)
Qualifications and experience: Two-year postgraduate commercial traineeship with AC Toepfer
Ernst was appointed as Executive Director in 1983, having joined the Group in 1975. He took responsibility for the Company’s marketing and sales function until 2002, when he became responsible for the development of the export markets. Ernst retired in 2008 but remains on the NBL Board as Non-executive Director. He was also appointed as a Non-executive Director to the O&L Board in June 2008.
He was appointed to the Board on 1 February 1983.
Günther Hanke (60)
Qualifications: BCom (Accounting) with completed articles, Senior management certificate from the University of Stellenbosch Business School, CFA(SA)
Günther joined the O&L Group of Companies in March 2004 as Group Financial Director responsible for formulating and executing strategy as part of the Executive Team. He has held various senior executive positions over the past 25 years. He is currently the Chairman of Dimension Data Namibia and is a Director of various O&L companies with the Group.
He was appointed to the Board on 1 October 2015.
Hans-Bruno Gerdes (64)
Qualifications: BProc degree from the University of Cape Town
Hans-Bruno is the Managing partner of the attorneys firm Engling, Stritter & Partners and an associate of the Institute of Chartered Secretaries. He practices as a commercial/corporate attorney, holds numerous directorships and is actively involved in the organised legal profession. He serves as Chairperson of the Audit Committee.
He was appointed to the Board on 28 July 2000 and to the Audit Committee on 28 November 2001.
Non-executive Directors

Namibia Breweries Limited Integrated Annual Report 201656
Peter Grüttemeyer (62)
Qualifications: CA(Nam)
Peter joined the O&L Group in October 2003 as Chief Executive Officer where he is responsible for formulating and executing strategy. He is a qualified Chartered Accountant and prior to joining O&L he held the position of partner-in-charge of the Deloitte Namibia practice.
He was appointed to the Board on 3 June 2004 and to the Audit Committee on 2 December 2010.
Carl-Ludwig List (67)
Qualifications: Banking (Germany)
Carl-Ludwig matriculated in Cape Town and completed his banking education in Germany in 1971 after attending the University of Stellenbosch. He served the O&L Group from 1972 to 1992.
He was appointed to the Board on 28 June 1979.
Lieven van der Borght (54)
Qualifications: LLM and MBA from the Catholic University of Leuven, Belgium
With many years of experience within the Heineken Group and other reputable international corporates, Lieven holds the position of Heineken Regional Commercial Director Africa and Middle East. He served as a Non-executive Director of Heineken Sirocco Dubai and Heineken South Africa (Proprietary) Limited.
He is an alternate Director to R Pirmez and was appointed to the Board on 2 December 2010.
Non-executive Directors (continued)
GOOD CORPORATE GOVERNANCE (continued)
About this report
Chairperson’s statement
NBL profile
Partnering forthe future
A Namibian investment
NBL timeline

Strategic Partnerships ❯❯ 57
Didier Leleu (49)
Qualifications: Masters in Finance/Economics from the Paris Business School (HEC)
Didier held the post of Finance Director for Heineken France from 2003 until his appointment in 2012 as Senior Heineken Director Regional Finance Africa Middle East. He sits on the boards of various joint ventures and participations on behalf of the Heineken Group.
He was appointed to the Board on 2 April 2012 and to the Audit Committee on 26 March 2013.
Laura McLeod-Katjirua (56)
Qualifications: GradDip DVST and Management, Diploma in Basic Education
Governor Mcleod-Katjirua has a long history of serving the people of Namibia. She has been active in the promotion of gender equality and education in Namibia. She is currently the Appointed Governor of Omaheke Region where she continues to support various initiatives that support the development and well-being of Namibians.
She was appointed to the Board on 2 April 2012.
Roland Pirmez (56)
Qualifications: Engineering degree in Agriculture and Master’s degree in Brewing – Université Catholique de Louvain
Roland was appointed President of Heineken Africa, Middle East and Eastern Europe in 2015. From 2013 until 2015 he was President of Asia, Pacific and CEO APB. Roland joined Heineken in 1995. From 1995 to 1998, he was Managing Director of Heineken Angola. In 1998 he was appointed General Manager of Thai Asia, Pacific Brewery Co Limited, Thailand and in 2002, he became Chief Executive Officer of Heineken in Russia.
He was appointed to the Board on 8 September 2015.
Operating environment
Managing Director’s Report
Value addedstatement
Good corporate governance
Remuneration report
Annual financial statements

Senior Leadership Team
From left to right | Anton Goosen | Rosemary Shippiki | John Fitzgerald | Graeme Mouton |
GOOD CORPORATE GOVERNANCE (continued)
About this report
Chairperson’s statement
NBL profile
Partnering forthe future
A Namibian investment
NBL timeline
Namibia Breweries Limited Integrated Annual Report 201658
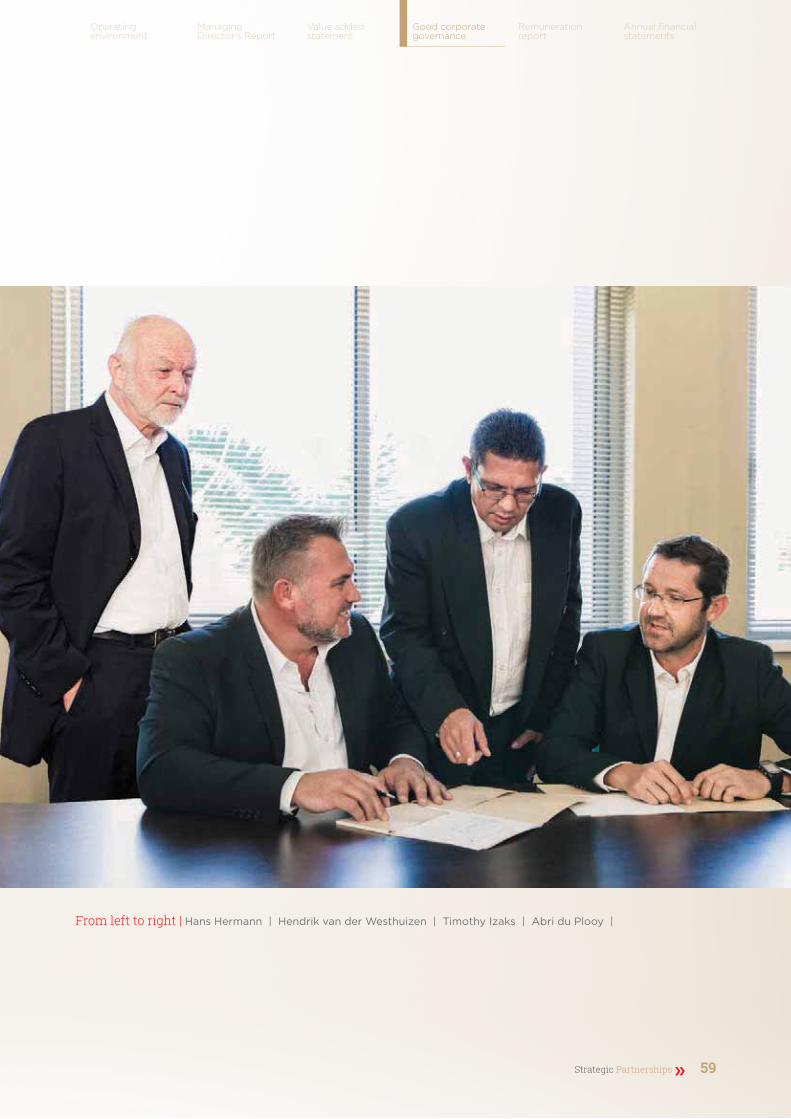
From left to right | Hans Hermann | Hendrik van der Westhuizen | Timothy Izaks | Abri du Plooy |
Operating environment
Managing Director’s Report
Value addedstatement
Good corporate governance
Remuneration report
Annual financial statements
Strategic Partnerships ❯❯ 59

Namibia Breweries Limited Integrated Annual Report 201660
Introduction
ComplianceNBL is subject to all applicable Namibian legislation as well as the Listing Requirements of the Namibian Stock Exchange (NSX). The NSX requires NBL to comply with the Corporate Governance Code for Namibia (NamCode) which is based on the principles of South Africa’s 2009 King Report on Corporate Governance’s (King III) recommendations as well as Namibian legislation. The NBL Board believes that, while best recommended practice is being applied, further enhancements will be made over time in line with its objective to continuously improve corporate governance.
The Board All members of the Board have a fiduciary responsibility to represent the best interests of NBL and all its stakeholders. NBL’s Board of Directors’ key purpose is to ensure the Company’s prosperity by collectively directing its affairs, while meeting the appropriate interests of its shareholders and other stakeholders. In addition to business and financial issues, the Board deals with challenges and opportunities relating to corporate governance, corporate social responsibility and corporate ethics.
The Board currently consists of two Executive Directors and eight Non-executive Directors, with two alternate Directors.
Read more about the Directors in their profiles on pages 54 to 57.
Name Status Independent Gender NationalityYears of tenure and appointment date
NB Blazquez2 Non-executive, shareholder representative
No Male British 12 (2 September 2004)
E Ender Non-executive No Male Namibian 33 (1 February 1983)
H-B Gerdes Non-executive Yes Male Namibian 16 (28 July 2000)
P Grüttemeyer Non-executive, shareholder representative
No Male Namibian 12 (3 June 2004)
G Hanke Non-executive, shareholder representative (alternate to S Thieme)
No Male Namibian 1 (1 October 2015)
GOOD CORPORATE GOVERNANCE (continued)
About this report
Chairperson’s statement
NBL profile
Partnering forthe future
A Namibian investment
NBL timeline

Strategic Partnerships ❯❯ 61
Name Status Independent Gender NationalityYears of tenure and appointment date
S Hiemstra1 Non-executive, shareholder representative
No Male Dutch 5 (31 August 2011)
PJ Jenkins2 Non-executive, shareholder representative (alternate to N Blazquez)
No Male British 2 (3 December 2013)
M Kromat2 Non-executive, shareholder representative (alternate to J Milliken)
No Male South African
4 (30 November 2011)
DFM Leleu Non-executive, shareholder representative
No Male French 4 (2 April 2012)
C-L List Non-executive, shareholder representative
No Male Namibian 37 (28 June 1979)
L McLeod-Katjirua Non-executive Yes Female Namibian 4 (2 April 2012)
J Milliken2 Non-executive, shareholder representative
No Male British 3 (17 September 2013)
G Mouton Executive (Finance Director)
No Male Namibian 3 (17 September 2013)
R Pirmez Non-executive, shareholder representative
No Male Belgian 1 (8 September 2015)
S Thieme Chairperson No Male Namibian 14 (14 March 2002)
L van der Borght Non-executive, shareholder representative (alternate to R Pirmez)
No Male Belgian 5 (2 December 2010)
H van der Westhuizen
Executive (Managing Director)
No Male Namibian 4 (2 April 2012)
1 Resigned 12 November 20152 Resigned 1 December 2015
Operating environment
Managing Director’s Report
Value addedstatement
Good corporate governance
Remuneration report
Annual financial statements
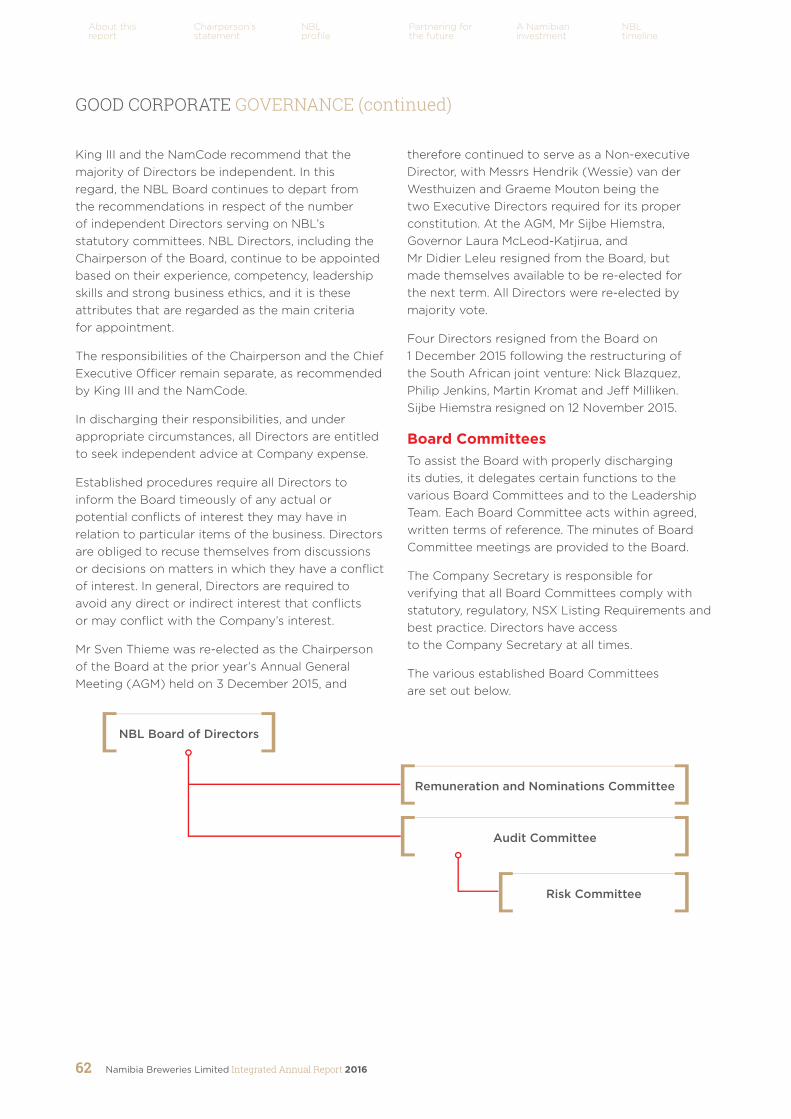
Namibia Breweries Limited Integrated Annual Report 201662
King III and the NamCode recommend that the majority of Directors be independent. In this regard, the NBL Board continues to depart from the recommendations in respect of the number of independent Directors serving on NBL’s statutory committees. NBL Directors, including the Chairperson of the Board, continue to be appointed based on their experience, competency, leadership skills and strong business ethics, and it is these attributes that are regarded as the main criteria for appointment.
The responsibilities of the Chairperson and the Chief Executive Officer remain separate, as recommended by King III and the NamCode.
In discharging their responsibilities, and under appropriate circumstances, all Directors are entitled to seek independent advice at Company expense.
Established procedures require all Directors to inform the Board timeously of any actual or potential conflicts of interest they may have in relation to particular items of the business. Directors are obliged to recuse themselves from discussions or decisions on matters in which they have a conflict of interest. In general, Directors are required to avoid any direct or indirect interest that conflicts or may conflict with the Company’s interest.
Mr Sven Thieme was re-elected as the Chairperson of the Board at the prior year’s Annual General Meeting (AGM) held on 3 December 2015, and
therefore continued to serve as a Non-executive Director, with Messrs Hendrik (Wessie) van der Westhuizen and Graeme Mouton being the two Executive Directors required for its proper constitution. At the AGM, Mr Sijbe Hiemstra, Governor Laura McLeod-Katjirua, and Mr Didier Leleu resigned from the Board, but made themselves available to be re-elected for the next term. All Directors were re-elected by majority vote.
Four Directors resigned from the Board on 1 December 2015 following the restructuring of the South African joint venture: Nick Blazquez, Philip Jenkins, Martin Kromat and Jeff Milliken. Sijbe Hiemstra resigned on 12 November 2015.
Board CommitteesTo assist the Board with properly discharging its duties, it delegates certain functions to the various Board Committees and to the Leadership Team. Each Board Committee acts within agreed, written terms of reference. The minutes of Board Committee meetings are provided to the Board.
The Company Secretary is responsible for verifying that all Board Committees comply with statutory, regulatory, NSX Listing Requirements and best practice. Directors have access to the Company Secretary at all times.
The various established Board Committees are set out below.
GOOD CORPORATE GOVERNANCE (continued)
NBL Board of Directors
Remuneration and Nominations Committee
Audit Committee
Risk Committee
About this report
Chairperson’s statement
NBL profile
Partnering forthe future
A Namibian investment
NBL timeline
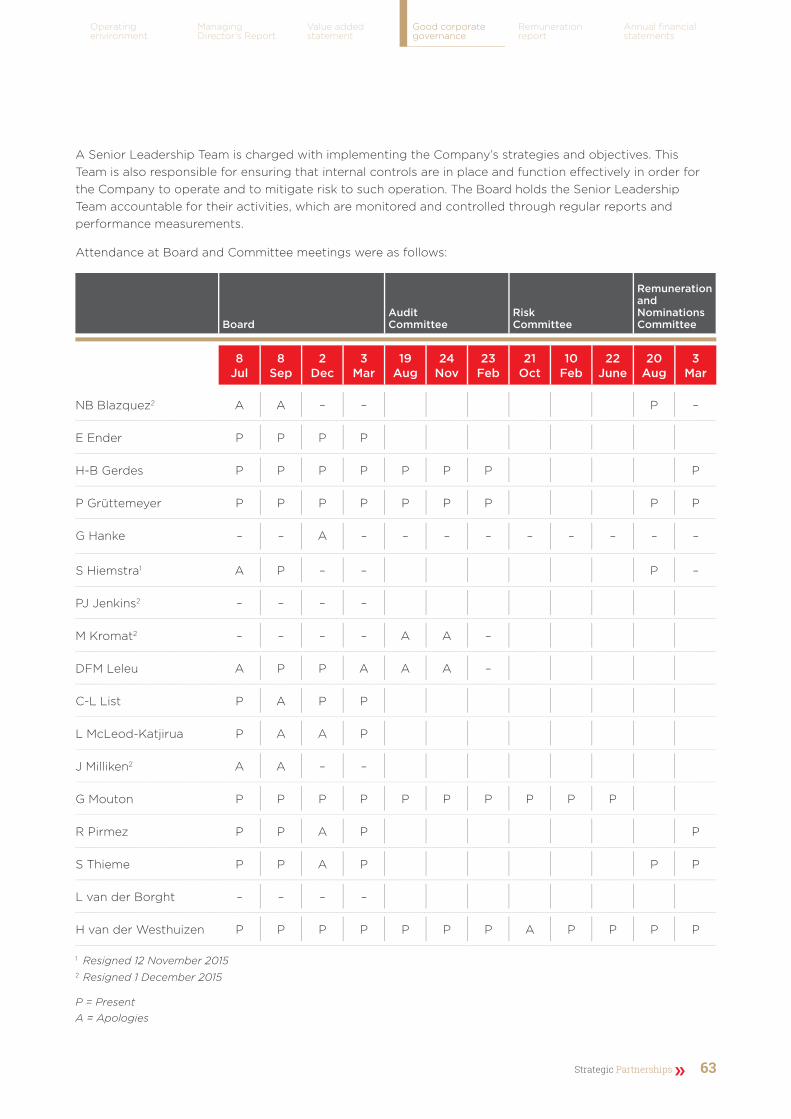
Strategic Partnerships ❯❯ 63
A Senior Leadership Team is charged with implementing the Company’s strategies and objectives. This Team is also responsible for ensuring that internal controls are in place and function effectively in order for the Company to operate and to mitigate risk to such operation. The Board holds the Senior Leadership Team accountable for their activities, which are monitored and controlled through regular reports and performance measurements.
Attendance at Board and Committee meetings were as follows:
BoardAudit Committee
Risk Committee
Remuneration and Nominations Committee
8 Jul
8 Sep
2 Dec
3 Mar
19 Aug
24 Nov
23 Feb
21 Oct
10 Feb
22 June
20 Aug
3 Mar
NB Blazquez2 A A – – P –
E Ender P P P P
H-B Gerdes P P P P P P P P
P Grüttemeyer P P P P P P P P P
G Hanke – – A – – – – – – – – –
S Hiemstra1 A P – – P –
PJ Jenkins2 – – – –
M Kromat2 – – – – A A –
DFM Leleu A P P A A A –
C-L List P A P P
L McLeod-Katjirua P A A P
J Milliken2 A A – –
G Mouton P P P P P P P P P P
R Pirmez P P A P P
S Thieme P P A P P P
L van der Borght – – – –
H van der Westhuizen P P P P P P P A P P P P
1 Resigned 12 November 20152 Resigned 1 December 2015
P = PresentA = Apologies
Operating environment
Managing Director’s Report
Value addedstatement
Good corporate governance
Remuneration report
Annual financial statements

Namibia Breweries Limited Integrated Annual Report 201664
Audit Committee
The Audit Committee comprises three Directors
H-B Gerdes (Chairperson);
P Grüttemeyer (O&L representative); and
E van Lokven (Heineken representative)
The NBL Audit Committee continues to depart from the recommendations in respect of the number of independent Directors serving on the Committee. The Audit Committee members, including the Chairperson, are appointed based on their experience, competency, leadership skills and strong business ethics, and it is these attributes that are regarded as the main criteria for appointment.
The Committee’s terms and reference, as set out in an Audit Committee Charter, and approved by the Board, is to review the Company’s financial statements, the appropriateness of the Company’s accounting and disclosure policies, compliance with International Financial Reporting Standards, and the effectiveness of internal controls.
The Committee considered and recommended an internal audit charter for approval by the Board.
The Company’s external and internal auditors, Finance Director, Managing Director and the O&L Group’s Chief Executive Officer attend Audit Committee meetings by invitation. The Committee invites other members of the NBL Senior Leadership Team as required. The auditors, both internal and external, attended all Audit Committee meetings during the year under review.
The Audit Committee roles include
monitoring the integrity of financial statements and making recommendations to the Board;
ensuring integrated reporting takes place;
reviewing and monitoring the internal audit plan;
reviewing internal and external audit reports and monitoring that corrective actions are performed,
providing a communication channel between the Board, the internal and external auditors and other assurance providers;
assisting the Board, in conjunction with the Risk Committee, to monitor the effectiveness of the risk management process, including fraud and corruption, information technology-related items, and compliance with risk standards adopted by the O&L Group;
reviewing NBL’s policies and practices concerning business conduct and ethics, including whistleblowing reports received via the Tip-Offs Anonymous hotline; and
assisting the Board to discharge its responsibility to:
safeguard NBL’s assets;
operate adequate and effective systems of internal control, financial risk management and governance;
review financial information and shareholder reporting;
monitor compliance with laws and regulations; and
provide oversight of the external and internal audit functions and appointments.
The Board is satisfied that the Committee complied with its legal, regulatory or other responsibilities.
Remuneration and Nominations Committee
The Committee comprises the following Directors:
R Pirmez (Chairperson and Heineken representative);
P Grüttemeyer (O&L representative); and
B Mukuahima (O&L representative).
The Remuneration and Nominations Committee’s main responsibilities, as set out in its Board-approved terms of reference, include monitoring the appropriateness of the Company’s Remuneration Policy and ensuring a formal and transparent process exist in respect of appointing new Directors to the Board. In fulfilling this function, the Committee is required to:
Assess the necessary and desirable competencies of prospective Board members based on merit and objective criteria. In doing so, candidates from a wide range of backgrounds are to be considered, in keeping with the dynamics and diversity of the country.
Review Board nominations from shareholders and to provide recommendations to the Board in respect of such nominations.
Ensure that, on appointment to the Board, Non-executive Directors receive a formal letter of appointment setting out clearly what is expected of them in terms of their time commitment, Committee service (if any), and involvement outside Board meetings.
GOOD CORPORATE GOVERNANCE (continued)
About this report
Chairperson’s statement
NBL profile
Partnering forthe future
A Namibian investment
NBL timeline

Strategic Partnerships ❯❯ 65
Define and implement procedures for the annual statement of disclosure of any conflict of interest and the annual statement of compliance.
Give full consideration to succession planning in the course of its work, taking into account the challenges and opportunities facing the Company and, therefore, what skills and expertise are needed on the Board in the future.
Keep under review the structure, size and composition (including the skills, knowledge and experience) of the Board, and make recommendations to the Board with regard to any changes, subject to the provisions of the Company’s Articles of Association and the Namibia Companies Act, 2004 (No. 28 of 2004).
Consider and, if appropriate, make recommendations to the Board regarding
the tenure of Non-executive Directors on the Board; and
the reappointment of any Non-executive Director at the conclusion of his or her specified term of office.
Approve and, if in the interest of the Company, ensure that all employment agreements between the Company and the Directors are limited to three or five-year periods, if applicable, provided such agreements are renewable.
Action any other duties or responsibilities expressly delegated to the Committee by the Board.
Read more about remuneration in the report on page 68.
Risk Committee
The Risk Committee has an independent and advisory role with accountability to the Audit Committee. The purpose of the Risk Committee is to assist the Board of Directors to fulfil its responsibilities relating to
the governance of risk;
the assessment and review of credit, market, fiduciary, liquidity, reputational, operational, fraud, strategic, technology, data-security, and business-continuity risks; and
monitoring the overall risk profile
The Directors who serve on the Risk Committee are ultimately responsible for the Company’s risk management system. The system is designed to manage risk rather than to eliminate it. On a
monthly basis, risks are identified, assessed and discussed within the different business functions. These risks are closely managed, monitored and mitigated. Reports on the top key risks, along with their respective mitigation plans, are delivered at each Board meeting as well as at Audit Committee meetings and monthly business review meetings. The minutes of this Committee are made available to and discussed at Audit Committee meetings as well.
The Risk Committee comprises
H van der Westhuizen (Chairperson);
G Mouton;
NBL Senior Leadership Team; and
O&L Group Risk Manager.
No undue, unexpected or unusual risks were taken in the past year and no material losses were experienced as a result of such risks. The Board is satisfied with the effectiveness of the Company’s risk management processes.
Internal controlsNBL’s internal controls are designed and operated to support the identification, evaluation and management of risks affecting the Company, as well as the business environment in which it operates. Internal control systems are in place to provide the Senior Management Team and the Board with reasonable assurance as to the integrity and reliability of the financial statements.
Continuous management reviews, a review of internal financial controls, and a review of external parties providing internal audits, test whether the business complies with internal control procedures and policies. Experienced and qualified employees are appointed as control champions throughout the business functions to review and evaluate financial as well as technical controls.
Any deficiencies are recorded, monitored regularly, and reported to the Senior Leadership Team. This has proven to be a very successful approach to critically evaluating and improving internal control policies and procedures. The internal audit function was outsourced to the auditing firm Ernst & Young. The internal audit programme is founded on a three-year risk-based approach. The internal audit plan is approved by the Audit Committee and regularly reviewed by the Risk and Compliance Department.
Operating environment
Managing Director’s Report
Value addedstatement
Good corporate governance
Remuneration report
Annual financial statements
Namibia Breweries Limited Integrated Annual Report 201666
About this report
Chairperson’s statement
NBL profile
Partnering forthe future
A Namibian investment
NBL timeline
During the reporting year, the following internal audits were performed:
Inventory Management
Payroll Management
Production
Withholding Taxes
Fixed Assets Accounting
Medium risk findings were reported and resolved. All findings and recommendations are recorded on an audit tracker and closely monitored by the Senior Leadership Team.
The Risk and Compliance Department is responsible for ensuring that corrective actions are taken and recommendations implemented.
Ernst & Young also performs internal follow-up audits and reports independently to the Audit Committee and then to the Senior Management Team on the findings and recommendations it identifies. Both the internal and external auditors have unlimited access to the Chairperson of the Audit Committee.
There is a strong drive within NBL to uphold the highest technical and operational standards. Fire and safety policies and procedures are regularly reviewed and tested so that they continue to be compliant. Each manager within his/her function is evaluated constantly on the health and safety ratings achieved during these audits. By strictly following this programme, NBL has managed to improve its health and safety standards for employees, contractors, suppliers and other providers of service to NBL.
Unfortunately, an employee of a contractor experienced a fatal fall during repairs and maintenance at the brewery in May 2016. Management reviewed the tender process for external contractors to ensure inclusion of an appropriate Health and Safety Plan. Management further re-emphasised the importance of health and safety to all external contractors, employees and visitors alike.
For the past six financial years, an annual insurance audit has been performed by Alexander Forbes Insurers. The main plant is audited on an annual basis, while depots are audited on a rotational basis. During the reporting year, the NBL main plant,
Oshakati and Swakopmund depots were audited. NBL received a 3 Star rating (81%) by Alexander Forbes Insurance in respect of its overall compliance with local and international insurance standards.
Stakeholder communications, ethics and the Tip-Offs Anonymous hotlineNBL’s Board is aware of the importance of communicating the Company’s activities to all stakeholders in a balanced and comprehensive manner. Each key stakeholder group therefore has a business owner who is the individual in NBL primarily accountable for managing the relationship and regularly engaging with the stakeholder or stakeholder group concerned.
Shareholder communications take the form of analyst presentations where NBL announces its interim and final financial results. The Company also publishes and reports on details of its performance (including its interim and final financial results) in two local daily newspapers. Other Company notices and publications occur, on its website, where its most recent financial and historical information is available, including its annual reports.
The Audit Committee is responsible for embedding a culture of high ethical standards. The Committee periodically reviews the Company’s Code of Ethics and the Company’s programme to monitor compliance therewith. Employees have several means available to them to raise their concerns and make recommendations or obtain feedback from the Senior Leadership Team. One such avenue is the workplace forum within the different functions, which is held on a weekly or fortnightly basis. At these forums, employees have the opportunity to discuss matters of concern to them. If an employee is not comfortable with airing their views at these forums, they can contact the Tip-Offs Anonymous hotline. The hotline is administrated by independent service provider, Deloitte & Touche. During the past year, 17 tips were reported to hotline (total O&L Group) and six of these were followed by an internal NBL investigation.
NBL invites all shareholders to attend its AGM and also facilitates participation by way of focused proxy solicitation.
GOOD CORPORATE GOVERNANCE (continued)
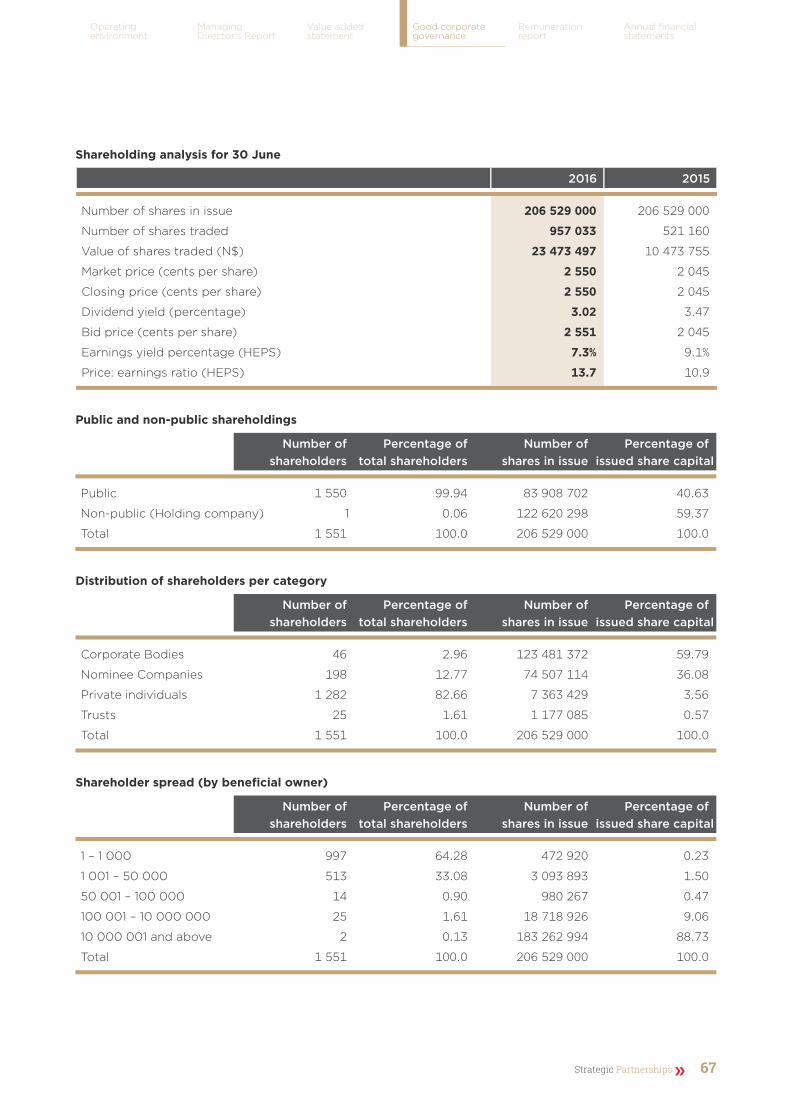
Strategic Partnerships ❯❯ 67
Operating environment
Managing Director’s Report
Value addedstatement
Good corporate governance
Remuneration report
Annual financial statements
Shareholding analysis for 30 June
2016 2015
Number of shares in issue 206 529 000 206 529 000
Number of shares traded 957 033 521 160
Value of shares traded (N$) 23 473 497 10 473 755
Market price (cents per share) 2 550 2 045
Closing price (cents per share) 2 550 2 045
Dividend yield (percentage) 3.02 3.47
Bid price (cents per share) 2 551 2 045
Earnings yield percentage (HEPS) 7.3% 9.1%
Price: earnings ratio (HEPS) 13.7 10.9
Public and non-public shareholdings
Number ofshareholders
Percentage of total shareholders
Number of shares in issue
Percentage of issued share capital
Public 1 550 99.94 83 908 702 40.63
Non-public (Holding company) 1 0.06 122 620 298 59.37
Total 1 551 100.0 206 529 000 100.0
Distribution of shareholders per category
Number ofshareholders
Percentage of total shareholders
Number of shares in issue
Percentage of issued share capital
Corporate Bodies 46 2.96 123 481 372 59.79
Nominee Companies 198 12.77 74 507 114 36.08
Private individuals 1 282 82.66 7 363 429 3.56
Trusts 25 1.61 1 177 085 0.57
Total 1 551 100.0 206 529 000 100.0
Shareholder spread (by beneficial owner)
Number ofshareholders
Percentage of total shareholders
Number of shares in issue
Percentage of issued share capital
1 – 1 000 997 64.28 472 920 0.23
1 001 – 50 000 513 33.08 3 093 893 1.50
50 001 – 100 000 14 0.90 980 267 0.47
100 001 – 10 000 000 25 1.61 18 718 926 9.06
10 000 001 and above 2 0.13 183 262 994 88.73
Total 1 551 100.0 206 529 000 100.0

Namibia Breweries Limited Integrated Annual Report 201668
About this report
Chairperson’s statement
NBL profile
Partnering forthe future
A Namibian investment
NBL timeline
NBL’s remuneration approach aims to support the implementation of and delivery on the Group’s Vision 2019 strategy and goals by enabling it to attract, acquire, retain and appropriately reward employees.
NBL has a Remuneration Policy that applies to its Executives. The Policy is reviewed periodically to take account of changing circumstances in the market, the industry and the economy. Following concerns raised by some shareholders at the last AGM, the Remuneration Committee committed to the following improvements:
Reviewing the disclosure in terms of the Executive Directors’ packages by defining “other benefits”
Reviewing the disclosure on the actual performance factors and targets set for Executive Directors as well as their performance against these targets
The Committee considered and decided against the implementation of a long-term incentive scheme as the current short-term incentive scheme, which is based on key performance indicators and financial performance, have proven effective as it is linked to NBL’s long term targets.
Remuneration principles and governanceThe main principles of the Company’s Remuneration Policy for Executives are to
provide total remuneration which is competitive in structure and quantum with comparator companies’ practices within the Southern African Development Community Region;
achieve clear alignment between total remuneration on the one hand, and delivered business and personal performance on the other;
link variable elements of remuneration to the achievement of challenging performance criteria that are consistent with the best interest of the Company;
provide an appropriate balance of fixed and variable remuneration; and
provide internal equity among Executives and facilitate the movement of Executives within the O&L Group.
The Remuneration and Nominations Committee is mandated to oversee all matters pertaining to remuneration and report back to the Board with findings and recommendations. Its responsibilities include monitoring the Company’s remuneration policy, including policies relating to
parameters used in determining senior leadership remuneration scales;
Executive remuneration, including remuneration packages for Senior Management;
the structure of the remuneration of Executive Directors, Non-executive Directors, the Chairperson and, where applicable, Board Committee members;
the design of Executive incentives, inclusive of the Board criteria on which performance-related elements are based with regard to the trading period, if applicable; and
senior employee recruitment, retention and termination.
The Committee has to ensure that there is a formal, transparent and objective method to support recommendations to shareholders regarding Director remuneration packages, including pension benefits. It also has to ensure that the fees paid to Non-executive Directors are a fair reflection of the contribution they make to the Company. This requires that the Committee advise on and monitor a suitable performance-related formula, inclusive of the Board criteria on which performance related elements are based. The Committee separates the review and recommendation of Non-executive fees from the review and recommendation of Executive remuneration, each with its own motivation and basis for the recommendation.
Directors’ emolumentsThe Director’s emoluments are available on page 130.
REMUNERATION REPORT
Strategic Partnerships ❯❯ 69
Operating environment
Managing Director’s Report
Value addedstatement
Good corporate governance
Remuneration report
Annual financial statements
Remuneration components
Base Salary
The fixed element of remuneration is referred to as base salary. Its purpose is to provide a competitive level of remuneration for each grade of manager. The base salary is set to be competitive at the median level, with reference to market practice in companies that are comparable in terms of size, market sector, business complexity and international scope.
Base salaries are reviewed annually and adjusted as necessary at the beginning of the financial year, taking into account external market trends, and business and personal performance.
Benefits
Benefits provide security for employees and their families and include membership of a retirement fund and a medical aid scheme to which contributions are made. The retirement fund is a defined contribution fund. Other benefits include – where appropriate – a company car, housing, cellphone and beer allowances.
Short-term Incentive Scheme
Executive Directors and the rest of the Senior Leadership Team participate in an annual Short- term Incentive Scheme. The Scheme is a cash bonus plan designed to support the overall Remuneration Policy by
motivating participants to focus on achieving financial year performance goals which contribute to sustainable shareholder value; and
providing significant bonus differentials based on performance against predetermined Company financial targets, as well as strategic and divisional or personal performance objectives.
Executive Directors and members of the Senior Leadership Team may earn a bonus of up to 41.67% of their total annual package. The Senior Leadership Team’s functional targets are based on their respective critical success factors, and include both financial and non-financial targets. Financial targets comprise 50% of the Scheme’s bonus potential, while strategic and divisional/ personal targets, including leadership competency assessments, make up the remaining 50%.
The Remuneration and Nominations Committee reviews the performance of Executive Directors and the Senior Leadership Team every year. The Committee also approves individual performance against relevant targets and objectives once a year.
NBL INVITES ALL SHAREHOLDERS TO ATTEND ITS AGM AND ALSO FACILITATES PARTICIPATION BY WAY OF
FOCUSED PROXY SOLICITATION.
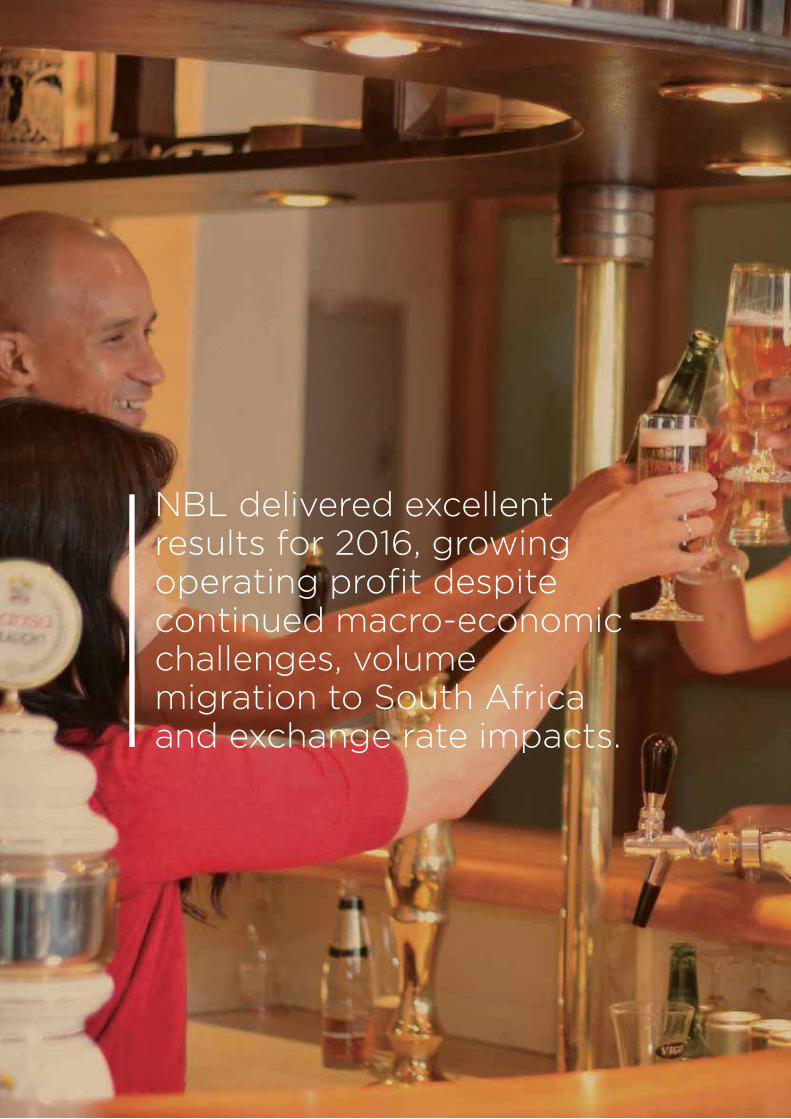
NBL delivered excellent results for 2016, growing operating profit despite continued macro-economic challenges, volume migration to South Africa and exchange rate impacts.

Strategic Partnerships ❯❯ 71
Operating environment
Managing Director’s report
Value addedstatement
Good corporate governance
Remuneration report
Annual financial statements
statements72 Group salient features73 Value added statement74 Five-year summary of results75 Summary of statistics76 Definitions77 Ordinary share ownership78 Financial review79 Approval of financial statements80 Independent auditor’s report81 Report of the Directors82 Statement of financial position83 Statement of comprehensive
income84 Statement of changes in equity85 Statement of cash flows
86 Notes to the annual financial statements
124 Annexure A: Secured interest-bearing borrowings
126 Annexure B: Property, plant and equipment
128 Annexure B: Intangible assets
129 Annexure C: Interest in subsidiaries
130 Annexure D: Directors’ emoluments
131 Notice to shareholders131 Shareholders’ diary132 Proxy form

Namibia Breweries Limited Integrated Annual Report 201672
About this report
Chairperson’s statement
NBL profile
Partnering forthe future
A Namibian investment
NBL timeline
30 June 2016N$’000s
30 June 2015N$’000s
%Change
Revenue 2 425 885 2 434 177 (0.3)
Profit attributable to ordinary shareholders 372 470 258 982 43.8
Earnings per ordinary share (cents) 180.3 125.4 43.8
Headline earnings per ordinary share (cents) 185.7 187.1 (0.7)
Dividends declared per ordinary share (cents) 77.0 71.0 8.5
Net asset value per ordinary share (cents) 609.0 505.5 20.5
Return on ordinary shareholders’ funds (%) 32.4 26.2 23.7
GROUP SALIENT FEATURES
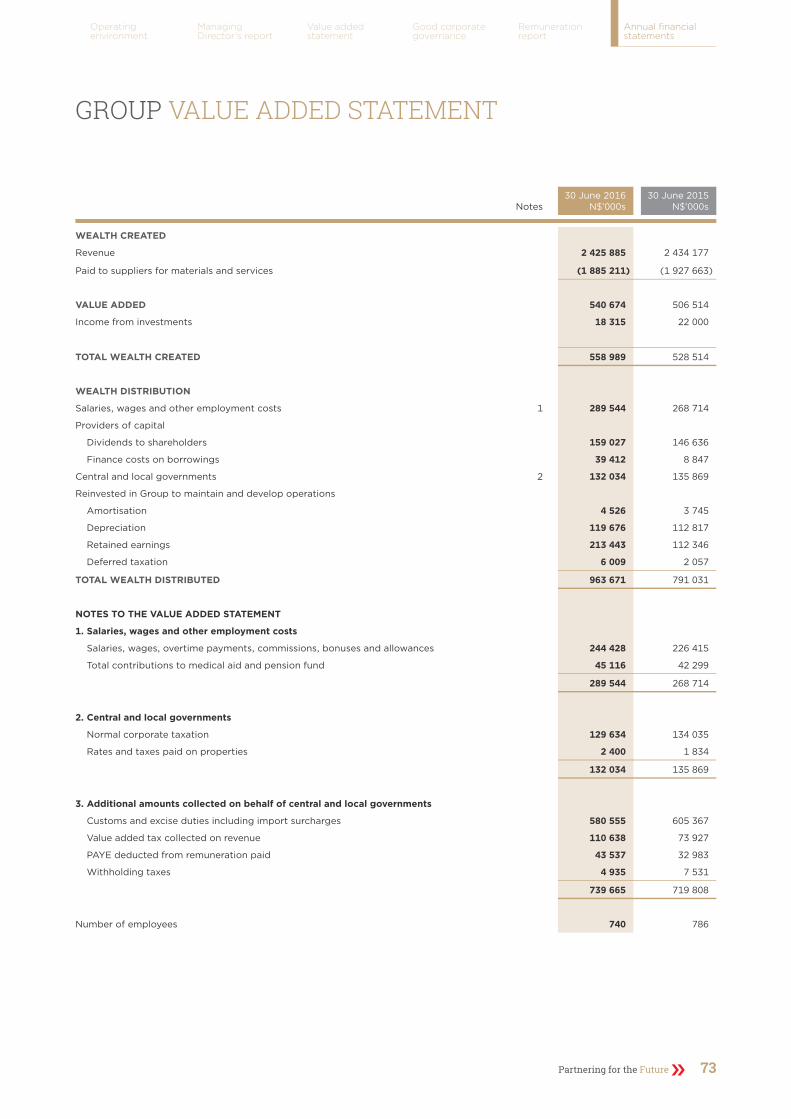
Partnering for the Future 73
Operating environment
Managing Director’s report
Value addedstatement
Good corporate governance
Remuneration report
Annual financial statements
Notes 30 June 2016
N$’000s 30 June 2015
N$’000s
WEALTH CREATED
Revenue 2 425 885 2 434 177
Paid to suppliers for materials and services (1 885 211) (1 927 663)
VALUE ADDED 540 674 506 514
Income from investments 18 315 22 000
TOTAL WEALTH CREATED 558 989 528 514
WEALTH DISTRIBUTION
Salaries, wages and other employment costs 1 289 544 268 714
Providers of capital
Dividends to shareholders 159 027 146 636
Finance costs on borrowings 39 412 8 847
Central and local governments 2 132 034 135 869
Reinvested in Group to maintain and develop operations
Amortisation 4 526 3 745
Depreciation 119 676 112 817
Retained earnings 213 443 112 346
Deferred taxation 6 009 2 057
TOTAL WEALTH DISTRIBUTED 963 671 791 031
NOTES TO THE VALUE ADDED STATEMENT
1. Salaries, wages and other employment costs
Salaries, wages, overtime payments, commissions, bonuses and allowances 244 428 226 415
Total contributions to medical aid and pension fund 45 116 42 299
289 544 268 714
2. Central and local governments
Normal corporate taxation 129 634 134 035
Rates and taxes paid on properties 2 400 1 834
132 034 135 869
3. Additional amounts collected on behalf of central and local governments
Customs and excise duties including import surcharges 580 555 605 367
Value added tax collected on revenue 110 638 73 927
PAYE deducted from remuneration paid 43 537 32 983
Withholding taxes 4 935 7 531
739 665 719 808
Number of employees 740 786
GROUP VALUE ADDED STATEMENT

Namibia Breweries Limited Integrated Annual Report 201674
About this report
Chairperson’s statement
NBL profile
Partnering forthe future
A Namibian investment
NBL timeline
N$’000s12 Months
30 June 201612 Months
30 June 201512 Months
30 June 201412 Months
30 June 201312 Months
30 June 2012
CONSOLIDATED STATEMENTS OF FINANCIAL POSITION
Property, plant and equipment 983 365 871 133 874 932 827 683 799 762
Investment in joint venture – 28 325 – 13 635 118 071
Investment in associate 610 526 – – – –
Non-current assets held for sale – 4 500 5 925 – –
Other non-current assets 25 530 16 762 11 508 12 258 6 450
Current assets 850 796 816 429 648 834 860 598 748 238
2 470 217 1 737 149 1 541 199 1 714 174 1 672 521
Issued capital 1 024 1 024 1 024 1 024 1 024
Foreign currency translation reserve 249 (3) (126) – –
Retained income 1 256 521 1 043 078 930 732 859 447 906 289
Ordinary shareholders’ equity 1 257 794 1 044 099 931 630 860 471 907 313
Interest-bearing loans and borrowings (non-current) 479 739 13 821 8 786 9 231 265 693
Other non-current liabilities 212 949 207 274 203 634 171 702 143 458
Current liabilities 519 735 471 955 397 149 672 770 356 057
2 470 217 1 737 149 1 541 199 1 714 174 1 672 521
CONSOLIDATED STATEMENTS OF COMPREHENSIVE INCOME
Revenue 2 425 885 2 434 177 2 316 932 2 383 384 2 160 067
Operating expenses (1 885 211) (1 927 663) (1 865 601) (1 883 295) (1 731 052)
Operating profit 540 674 506 514 451 331 500 089 429 015
Finance costs (39 412) (8 847) (14 932) (23 648) (23 233)
Finance income 18 315 22 000 12 338 20 392 22 346
Equity loss from joint venture (ongoing operations) (38 917) (124 593) (120 341) (109 002) (92 147)
Equity loss from associate (ongoing operations) (61 759) – – – –
Equity loss from joint venture (deferred tax asset write down) – – – (188 089) –
Income from associate (deferred tax asset write-back) 89 212 – – – –
Profit before income tax 508 113 395 074 328 396 199 742 335 981
Income tax expense (135 643) (136 092) (122 867) (126 797) (114 027)
Profit attributable to ordinary shareholders 372 470 258 982 205 529 72 945 221 954
CONSOLIDATED STATEMENTS OF CASH FLOWS
Cash generated by operations 654 065 736 481 502 637 706 776 363 084
Dividends paid (159 027) (146 636) (134 244) (119 787) (106 345)
Taxation paid (137 764) (123 516) (102 521) (105 696) (109 442)
Net cash flow from operating activities 357 274 466 329 265 872 481 293 147 297
Net cash flow applied to investing activities (770 111) (253 872) (258 937) (287 402) (204 537)
Net cash flow from financing activities 347 061 (4 179) (218 795) (17 989) 57 488
Net (decrease)/increase in cash and cash equivalents (65 776) 208 278 (211 860) 175 902 248
FIVE-YEAR SUMMARY OF RESULTS
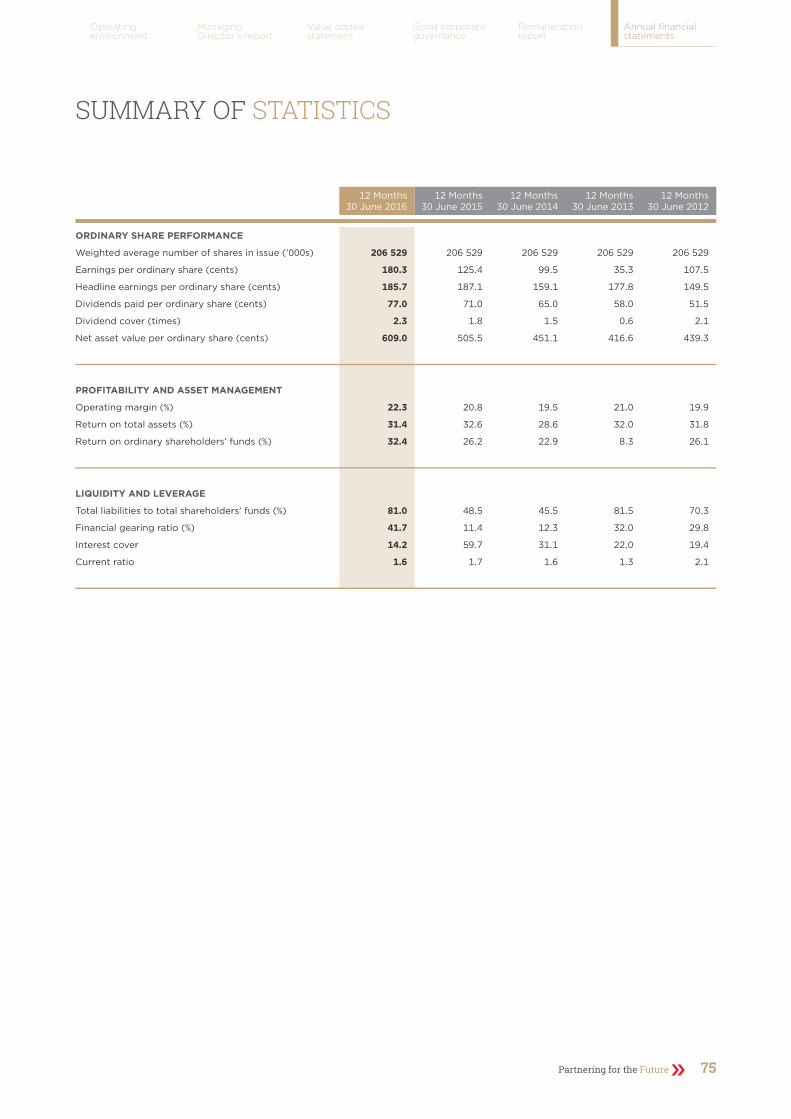
Partnering for the Future 75
Operating environment
Managing Director’s report
Value addedstatement
Good corporate governance
Remuneration report
Annual financial statements
SUMMARY OF STATISTICS
12 Months30 June 2016
12 Months30 June 2015
12 Months30 June 2014
12 Months30 June 2013
12 Months30 June 2012
ORDINARY SHARE PERFORMANCE
Weighted average number of shares in issue (’000s) 206 529 206 529 206 529 206 529 206 529
Earnings per ordinary share (cents) 180.3 125.4 99.5 35.3 107.5
Headline earnings per ordinary share (cents) 185.7 187.1 159.1 177.8 149.5
Dividends paid per ordinary share (cents) 77.0 71.0 65.0 58.0 51.5
Dividend cover (times) 2.3 1.8 1.5 0.6 2.1
Net asset value per ordinary share (cents) 609.0 505.5 451.1 416.6 439.3
PROFITABILITY AND ASSET MANAGEMENT
Operating margin (%) 22.3 20.8 19.5 21.0 19.9
Return on total assets (%) 31.4 32.6 28.6 32.0 31.8
Return on ordinary shareholders’ funds (%) 32.4 26.2 22.9 8.3 26.1
LIQUIDITY AND LEVERAGE
Total liabilities to total shareholders’ funds (%) 81.0 48.5 45.5 81.5 70.3
Financial gearing ratio (%) 41.7 11.4 12.3 32.0 29.8
Interest cover 14.2 59.7 31.1 22.0 19.4
Current ratio 1.6 1.7 1.6 1.3 2.1

Namibia Breweries Limited Integrated Annual Report 201676
About this report
Chairperson’s statement
NBL profile
Partnering forthe future
A Namibian investment
NBL timeline
DEFINITIONS
Dividend cover
Profit attributable to ordinary shareholders divided by dividends paid in the year.
Net asset value per share
Ordinary shareholders’ equity divided by the total number of ordinary shares in issue.
Operating margin
Operating profit expressed as a percentage of revenue.
Total assets
Property, plant and equipment, current and non-current assets.
Return on total assets
Operating profit plus finance income expressed as a percentage of average total assets (excluding investment in Joint Venture).
Return on ordinary shareholders’ funds
Profit attributable to ordinary shareholders expressed as a percentage of average ordinary shareholders’ equity.
Total liabilities
Interest-bearing loans and borrowings, other current and non-current liabilities. Deferred taxation and income is excluded.
Financial gearing ratio (%)
Interest-bearing loans and borrowings expressed as a percentage of ordinary shareholders’ equity.
Interest cover
Operating profit plus finance income divided by finance costs.
Current ratio
Current assets divided by current liabilities.

Partnering for the Future 77
Operating environment
Managing Director’s report
Value addedstatement
Good corporate governance
Remuneration report
Annual financial statements
Number of Shareholders %
Number of Shares %
HOLDINGS
1 – 1 000 997 64.28 472 920 0.23
1 001 – 50 000 513 33.08 3 093 893 1.50
50 001 – 100 000 14 0.90 980 267 0.47
100 001 – 10 000 000 25 1.61 18 718 926 9.06
10 000 001 and above 2 0.13 183 262 994 88.74
1 551 100.00 206 529 000 100.00
CATEGORY
Corporate bodies 46 2.96 123 481 372 59.78
Nominee companies 198 12.77 74 507 114 36.08
Private individuals 1 282 82.66 7 363 429 3.57
Trusts 25 1.61 1 177 085 0.57
1 551 100.00 206 529 000 100.00
SHAREHOLDER SPREAD
The spread of shares held by non-public and public shareholders was as follows:
at 30 June 2016
%
at 30 June 2015
%
Non-public shareholders
– holding company 59.4 52.6
– Directors and their associates, and trustees of the Company’s share purchase trust. 0.1 0.1
Public shareholders 40.5 47.3
100.0 100.0
MAJOR INDIVIDUAL HOLDINGS
With the exception of nominee holdings, the register of members does not reflect individual beneficial shareholdings at 30 June 2016 in excess of 1% of the total issued capital of the Company.
ORDINARY SHARE OWNERSHIP

Namibia Breweries Limited Integrated Annual Report 201678
About this report
Chairperson’s statement
NBL profile
Partnering forthe future
A Namibian investment
NBL timeline
FINANCIAL REVIEW
ACCOUNTING POLICIESNBL’s accounting policies comply with International Financial Reporting Standards and are consistent with those of the previous reporting year.
REVENUE Consolidated revenue decreased by 0.3% from N$2 434 million to N$2 426 million for the year ended 30 June 2016. The decrease in revenue is primarily driven by the migration of volumes to South Africa, offset by the performance in the local market.
OPERATING PROFITThe Group’s operating profit for the year ended 30 June 2016 showed an increase of 6.7% over the previous reporting period. This translates into an operating margin of 22% compared with 21% reported for the previous financial year.
TAXATIONThe corporate tax rate reduced from 33% to 32% during the year under review. The taxation charge for the year ended 30 June 2016 was N$135.6 million, while the previous reporting period reflected a slightly higher charge of N$136.1 million. The accumulated tax losses of the Group’s wholly owned South African subsidiary have not been recognised, due to uncertainty regarding future taxable income.
PROFIT AFTER TAX AND EARNINGS PER SHAREProfit attributable to shareholders increased from N$259 million in the previous financial year to N$372 million in the current year. This represents an increase of 43.8%, resulting in the earnings per share for the year ended 30 June 2016 increasing to 180.3 cents (2015: 125.4 cents).
FINANCIAL POSITIONThe net debt to equity ratio increased from -14% in the previous financial year to 26% in the year under review, following the restructuring of the South African joint venture. The increase in the gearing ratio, creates an opportunity for the financing of the Group’s expected investments in the 2017 financial year.
NAMIBIAN MARKETThe Namibian market continues to remain a significant contributor to total revenues and earnings, with Tafel Lager spear-heading the overall beer growth. Tafel Lager achieved more than 1 million hectolitres in 12 months for the very first time. Sales in the ready-to-drink category decreased compared with the prior year, however, the soft drink category maintained its double-digit growth.
SOUTH AFRICAOn 1 December 2015, the joint venture agreement for the South African joint venture, DHN Drinks (Proprietary) Limited, was terminated by mutual consent. A new agreement was entered into with Heineken International B.V. The operating loss from the equity accounted investments decreased during the period under review when compared with the prior year. Included in current year income, is an amount of N$89.2 million, being Namibia Breweries Limited’s share of the deferred tax asset included in the Heineken South Africa (Proprietary) Limited accounts. Taking royalties and production margins into account, we continued to make positive returns from the operations of our South African business. Further details on the restructuring of the South African joint venture are included in notes 7 and 8 to the consolidated financial statements.
EXPORTS (EXCLUDING SOUTH AFRICA)Total beer volumes sold to export markets declined by 5% in comparison with the prior reporting year. Tanzania continued its double-digit growth and outperformed expectations. Botswana’s performance remained stable, while Mozambique disappointed and Zambia remains challenging due to currency devaluation.
CASH FLOWSNet cash flow from operating activities decreased from N$466 million in the previous financial year to N$357 million in 2016. The decrease in cash flow was mainly due to less sales to South Africa. Net cash outflow from investing activities increased from N$254 million in the previous year to N$770 million in the 2016 financial year, due to the purchase of shares in the associate and an increase in capital expenditure. Net cash flow from financing activities increased from a net outflow of N$4 million in the previous financial year to a net inflow of N$347 million in the current year. The increase was mainly due to the medium-term loans raised during the current year. (See Annexure A to this Integrated Annual Report).

Partnering for the Future 79
Operating environment
Managing Director’s report
Value addedstatement
Good corporate governance
Remuneration report
Annual financial statements
APPROVAL OF FINANCIAL STATEMENTS
DIRECTORS’ RESPONSIBILITY STATEMENTThe Company’s Directors are responsible for the preparation and fair presentation of the consolidated and separate financial statements, comprising the statements of financial position as at 30 June 2016, and the statements of comprehensive income, the statements of changes in equity, and statement of cash flows for the year then ended, as well as the notes to the financial statements, which include a summary of significant accounting policies and other explanatory notes, in accordance with International Financial Reporting Standards and in terms of Namibia’s Companies Act, as set out in pages 81 to 130.
The Directors’ responsibility includes designing, implementing and maintaining internal control relevant to the preparation and fair presentation of these financial statements that are free from material misstatement, whether due to fraud or error; selecting and applying appropriate accounting policies; and making accounting estimates that are reasonable in the circumstances. The Directors’ responsibility also includes maintaining adequate accounting records and an effective system of risk management.
After due assessment of the Group and Company’s ability to continue as a going concern, the Directors believe there is no reason for the business not to continue as such going concern in the financial year ahead.
The external auditor is responsible for reporting on whether the consolidated and separate annual financial statements are fairly presented in accordance with International Financial Reporting Standards and the Companies Act. Their unmodified report is available on page 80.
APPROVAL OF CONSOLIDATED AND SEPARATE FINANCIAL STATEMENTSThe consolidated and separate financial statements of the Group and Company, as indicated above, were approved by the Board of Directors on 6 September 2016 and signed on their behalf by
S Thieme H van der WesthuizenChairman Managing Director
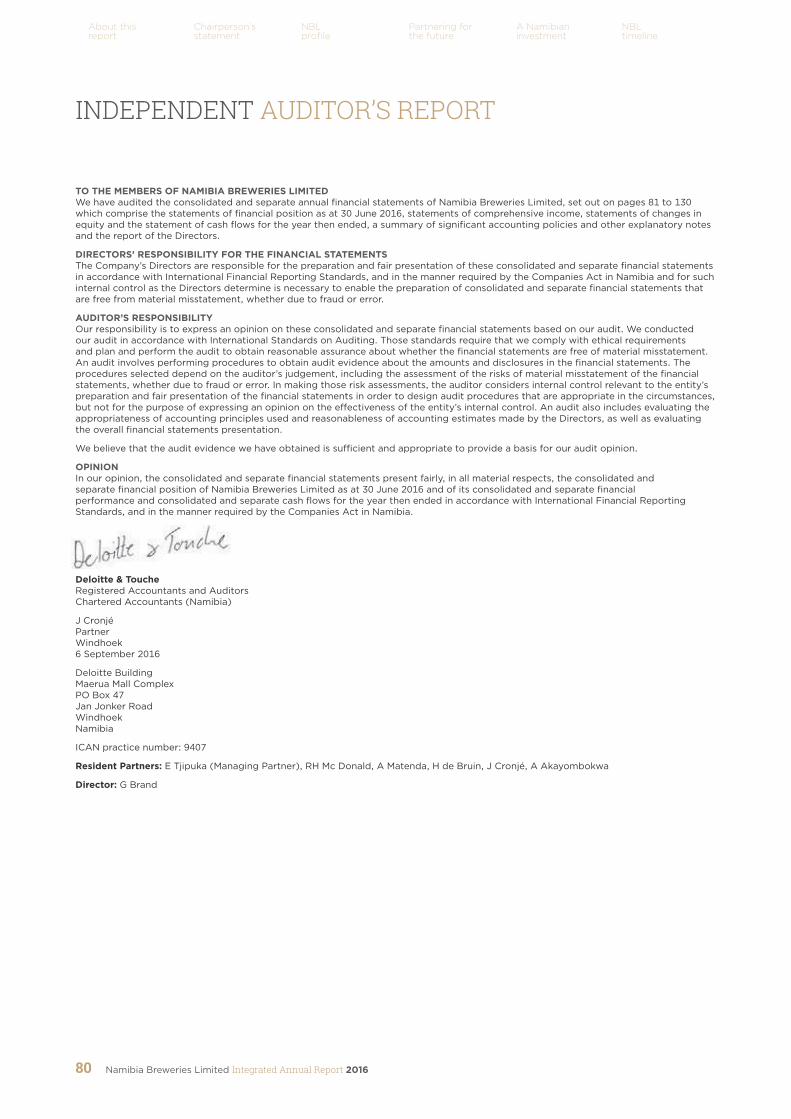
Namibia Breweries Limited Integrated Annual Report 201680
About this report
Chairperson’s statement
NBL profile
Partnering forthe future
A Namibian investment
NBL timeline
INDEPENDENT AUDITOR’S REPORT
TO THE MEMBERS OF NAMIBIA BREWERIES LIMITEDWe have audited the consolidated and separate annual financial statements of Namibia Breweries Limited, set out on pages 81 to 130 which comprise the statements of financial position as at 30 June 2016, statements of comprehensive income, statements of changes in equity and the statement of cash flows for the year then ended, a summary of significant accounting policies and other explanatory notes and the report of the Directors.
DIRECTORS’ RESPONSIBILITY FOR THE FINANCIAL STATEMENTSThe Company’s Directors are responsible for the preparation and fair presentation of these consolidated and separate financial statements in accordance with International Financial Reporting Standards, and in the manner required by the Companies Act in Namibia and for such internal control as the Directors determine is necessary to enable the preparation of consolidated and separate financial statements that are free from material misstatement, whether due to fraud or error.
AUDITOR’S RESPONSIBILITYOur responsibility is to express an opinion on these consolidated and separate financial statements based on our audit. We conducted our audit in accordance with International Standards on Auditing. Those standards require that we comply with ethical requirements and plan and perform the audit to obtain reasonable assurance about whether the financial statements are free of material misstatement. An audit involves performing procedures to obtain audit evidence about the amounts and disclosures in the financial statements. The procedures selected depend on the auditor’s judgement, including the assessment of the risks of material misstatement of the financial statements, whether due to fraud or error. In making those risk assessments, the auditor considers internal control relevant to the entity’s preparation and fair presentation of the financial statements in order to design audit procedures that are appropriate in the circumstances, but not for the purpose of expressing an opinion on the effectiveness of the entity’s internal control. An audit also includes evaluating the appropriateness of accounting principles used and reasonableness of accounting estimates made by the Directors, as well as evaluating the overall financial statements presentation.
We believe that the audit evidence we have obtained is sufficient and appropriate to provide a basis for our audit opinion.
OPINIONIn our opinion, the consolidated and separate financial statements present fairly, in all material respects, the consolidated and separate financial position of Namibia Breweries Limited as at 30 June 2016 and of its consolidated and separate financial performance and consolidated and separate cash flows for the year then ended in accordance with International Financial Reporting Standards, and in the manner required by the Companies Act in Namibia.
Deloitte & ToucheRegistered Accountants and AuditorsChartered Accountants (Namibia)
J CronjéPartnerWindhoek6 September 2016
Deloitte BuildingMaerua Mall ComplexPO Box 47Jan Jonker RoadWindhoekNamibia
ICAN practice number: 9407
Resident Partners: E Tjipuka (Managing Partner), RH Mc Donald, A Matenda, H de Bruin, J Cronjé, A Akayombokwa
Director: G Brand

Partnering for the Future 81
Operating environment
Managing Director’s report
Value addedstatement
Good corporate governance
Remuneration report
Annual financial statements
REPORT OF THE DIRECTORS
Founded in 1920, NBL is principally engaged in the brewing and distribution of beer and is also active in the manufacturing of soft drinks.
ACCOUNTING POLICIESNBL’s accounting policies comply with International Financial Reporting Standards and are consistent with those of the previous financial year.
FINANCIAL RESULTSThe Group’s operating profit for the year ended 30 June 2016 increased by 6.7% compared to the previous financial year. This translates into an operating margin of 22%.
DIVIDENDS PAIDDetails of the ordinary dividends declared, paid and payable in respect of the 2015/16 financial year are reflected in note 27 to the financial statements. Total dividend paid for the year amounted to 77 cents per share.
DIVIDEND DECLARATIONIn addition to the interim dividend of 40 cents per ordinary share paid in May 2016, the Board of Directors declared a final dividend of 40 cents per ordinary share, at its meeting of 6 September 2016. Payment will be effected to the shareholders of ordinary shares in the books of the Company registered at the close of business on 21 October 2016 and will be paid on 11 November 2016.
CAPITAL EXPENDITURECapital expenditure for the reporting year amounted to N$237.1 million (2015: N$115.1 million).
ISSUED CAPITALFull details of the authorised and issued capital of the Company as at 30 June 2016 are set out in note 14 to the financial statements. The 92 471 000 unissued shares of the Company are under the control of the Directors in terms of a members’ resolution dated 3 December 2015. In terms of the Companies Act, this authority expires at the forthcoming Annual General Meeting, at which point the members will accordingly be asked to extend this said authority until the Annual General Meeting to be held on 18 November 2016.
DIRECTORATE AND SECRETARYThe names of the Directors as well as the name and address of the Company Secretaries appear under Directorate and Administration.
SUBSIDIARIESDetails of the Company’s subsidiaries are set out in Annexure C of this report.
HOLDING COMPANYThe Company’s holding company is NBL Investment Holdings (Proprietary) Limited, of which the shareholding is held by Ohlthaver & List Finance and Trading Corporation Limited and Heineken International B.V. (“Heineken”). The Company’s ultimate holding company is the List Trust Company (Proprietary) Limited.
EVENTS SUBSEQUENT TO REPORTING DATEThe Directors are not aware of any other significant events subsequent to the reporting date to be accounted for or disclosed in the annual financial statements which significantly affect the financial position of the Group or the results of its operations.
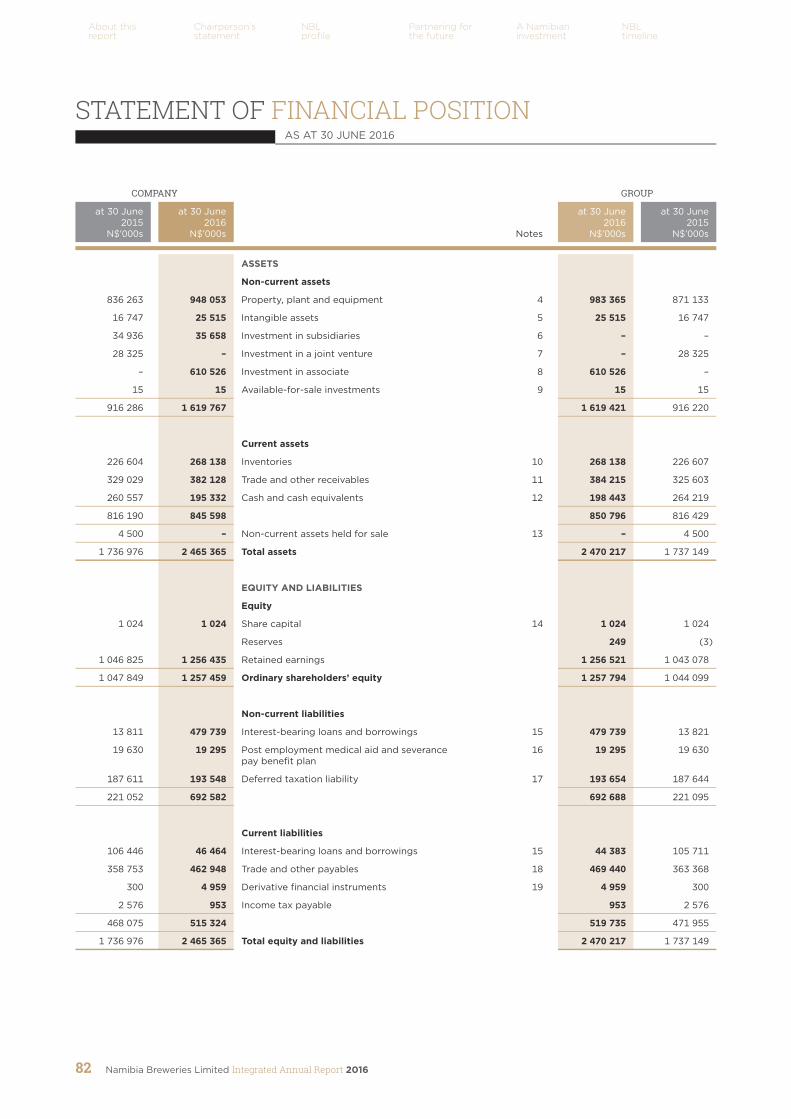
Namibia Breweries Limited Integrated Annual Report 201682
About this report
Chairperson’s statement
NBL profile
Partnering forthe future
A Namibian investment
NBL timeline
COMPANY GROUP
at 30 June 2015
N$’000s
at 30 June 2016
N$’000s Notes
at 30 June 2016
N$’000s
at 30 June 2015
N$’000s
ASSETS
Non-current assets
836 263 948 053 Property, plant and equipment 4 983 365 871 133
16 747 25 515 Intangible assets 5 25 515 16 747
34 936 35 658 Investment in subsidiaries 6 – –
28 325 – Investment in a joint venture 7 – 28 325
– 610 526 Investment in associate 8 610 526 –
15 15 Available-for-sale investments 9 15 15
916 286 1 619 767 1 619 421 916 220
Current assets
226 604 268 138 Inventories 10 268 138 226 607
329 029 382 128 Trade and other receivables 11 384 215 325 603
260 557 195 332 Cash and cash equivalents 12 198 443 264 219
816 190 845 598 850 796 816 429
4 500 – Non-current assets held for sale 13 – 4 500
1 736 976 2 465 365 Total assets 2 470 217 1 737 149
EQUITY AND LIABILITIES
Equity
1 024 1 024 Share capital 14 1 024 1 024
Reserves 249 (3)
1 046 825 1 256 435 Retained earnings 1 256 521 1 043 078
1 047 849 1 257 459 Ordinary shareholders’ equity 1 257 794 1 044 099
Non-current liabilities
13 811 479 739 Interest-bearing loans and borrowings 15 479 739 13 821
19 630 19 295 Post employment medical aid and severance pay benefit plan
16 19 295 19 630
187 611 193 548 Deferred taxation liability 17 193 654 187 644
221 052 692 582 692 688 221 095
Current liabilities
106 446 46 464 Interest-bearing loans and borrowings 15 44 383 105 711
358 753 462 948 Trade and other payables 18 469 440 363 368
300 4 959 Derivative financial instruments 19 4 959 300
2 576 953 Income tax payable 953 2 576
468 075 515 324 519 735 471 955
1 736 976 2 465 365 Total equity and liabilities 2 470 217 1 737 149
STATEMENT OF FINANCIAL POSITIONAS AT 30 JUNE 2016

Partnering for the Future 83
Operating environment
Managing Director’s report
Value addedstatement
Good corporate governance
Remuneration report
Annual financial statements
COMPANY GROUP
for the year ended
30 June 2015
N$’000s
for the year ended
30 June 2016
N$’000s Notes
for the year ended
30 June 2016
N$’000s
for the year ended
30 June 2015
N$’000s
2 425 233 2 403 839 Revenue 20 2 425 885 2 434 177
(1 915 723) (1 867 248) Operating expenses 21 (1 885 211) (1 927 663)
509 510 536 591 Operating profit 22 540 674 506 514
(8 807) (39 406) Finance costs 23 (39 412) (8 847)
21 896 18 249 Finance income 24 18 315 22 000
(124 593) (11 464) Impairment of equity-accounted investment 7, 8 – –
– – Equity loss from joint venture (ongoing operations) 7 (38 917) (124 593)
– – Equity loss from associate (ongoing operations) 8 (61 759) –
– – Equity income from associate (deferred tax asset write-back) 8 89 212 –
398 006 503 970 Profit before income tax 508 113 395 074
(136 087) (135 333) Income tax expense 25 (135 643) (136 092)
261 919 368 637 Profit for the year 372 470 258 982
Other comprehensive income
Items that may be reclassified subsequently to profit or loss
– – Foreign currency translation reserve (FCTR) 252 123
– –Other comprehensive income for the year net of taxation 252 123
261 919 368 637 Total comprehensive income for the year attributable to equity holders of the parent 372 722 259 105
126.8 178.5 Basic earnings per ordinary share (cents) 26.1 180.3 125.4
– – Headline earnings per ordinary share (cents) 26.2 185.7 187.1
STATEMENT OF COMPREHENSIVE INCOMEAS AT 30 JUNE 2016
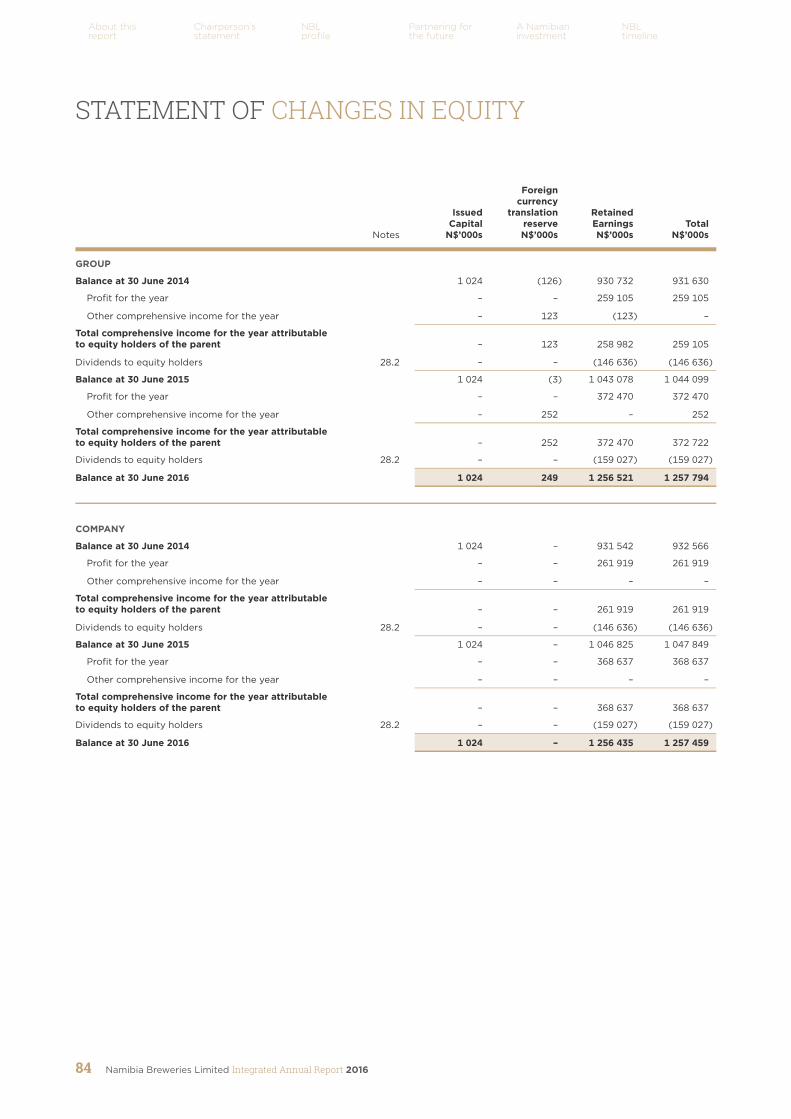
Namibia Breweries Limited Integrated Annual Report 201684
About this report
Chairperson’s statement
NBL profile
Partnering forthe future
A Namibian investment
NBL timeline
STATEMENT OF CHANGES IN EQUITY
Notes
IssuedCapital
N$’000s
Foreign currency
translation reserveN$’000s
RetainedEarningsN$’000s
TotalN$’000s
GROUP
Balance at 30 June 2014 1 024 (126) 930 732 931 630
Profit for the year – – 259 105 259 105
Other comprehensive income for the year – 123 (123) –
Total comprehensive income for the year attributable to equity holders of the parent – 123 258 982 259 105
Dividends to equity holders 28.2 – – (146 636) (146 636)
Balance at 30 June 2015 1 024 (3) 1 043 078 1 044 099
Profit for the year – – 372 470 372 470
Other comprehensive income for the year – 252 – 252
Total comprehensive income for the year attributable to equity holders of the parent – 252 372 470 372 722
Dividends to equity holders 28.2 – – (159 027) (159 027)
Balance at 30 June 2016 1 024 249 1 256 521 1 257 794
COMPANY
Balance at 30 June 2014 1 024 – 931 542 932 566
Profit for the year – – 261 919 261 919
Other comprehensive income for the year – – – –
Total comprehensive income for the year attributable to equity holders of the parent – – 261 919 261 919
Dividends to equity holders 28.2 – – (146 636) (146 636)
Balance at 30 June 2015 1 024 – 1 046 825 1 047 849
Profit for the year – – 368 637 368 637
Other comprehensive income for the year – – – –
Total comprehensive income for the year attributable to equity holders of the parent – – 368 637 368 637
Dividends to equity holders 28.2 – – (159 027) (159 027)
Balance at 30 June 2016 1 024 – 1 256 435 1 257 459
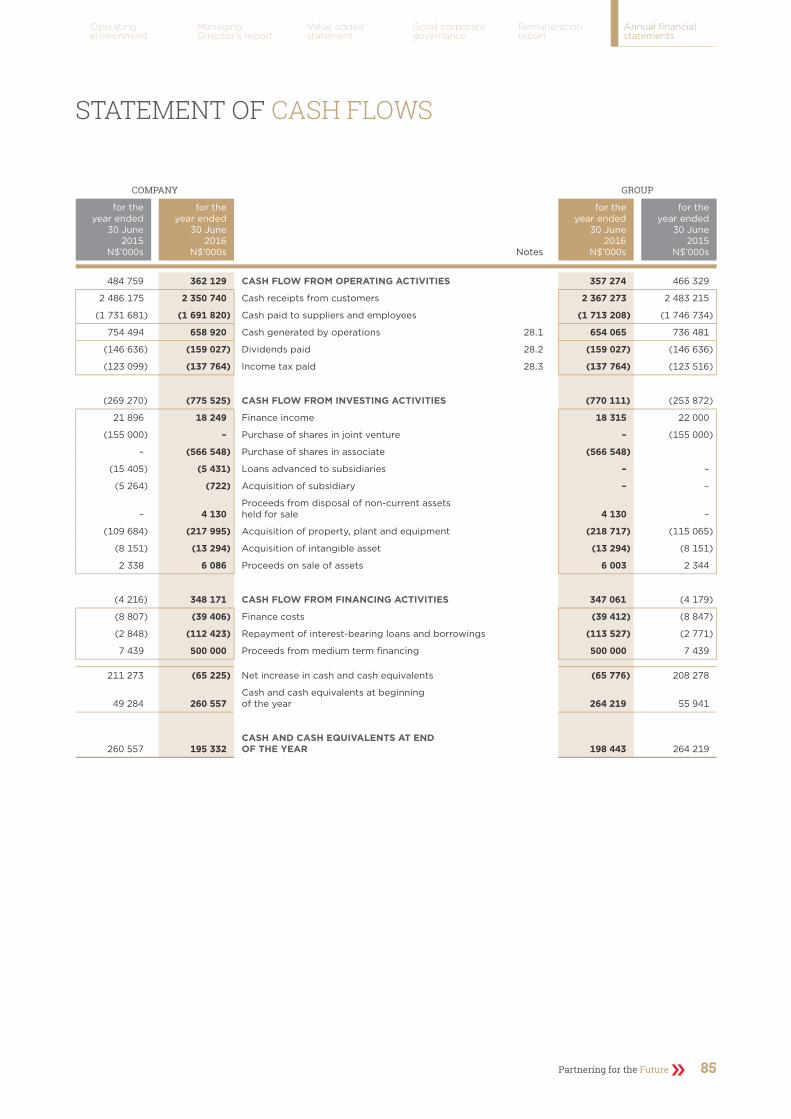
Partnering for the Future 85
Operating environment
Managing Director’s report
Value addedstatement
Good corporate governance
Remuneration report
Annual financial statements
STATEMENT OF CASH FLOWS
COMPANY
Notes
GROUP
for the year ended
30 June 2015
N$’000s
for the year ended
30 June 2016
N$’000s
for the year ended
30 June 2016
N$’000s
for the year ended
30 June 2015
N$’000s
484 759 362 129 CASH FLOW FROM OPERATING ACTIVITIES 357 274 466 329
2 486 175 2 350 740 Cash receipts from customers 2 367 273 2 483 215
(1 731 681) (1 691 820) Cash paid to suppliers and employees (1 713 208) (1 746 734)
754 494 658 920 Cash generated by operations 28.1 654 065 736 481
(146 636) (159 027) Dividends paid 28.2 (159 027) (146 636)
(123 099) (137 764) Income tax paid 28.3 (137 764) (123 516)
(269 270) (775 525) CASH FLOW FROM INVESTING ACTIVITIES (770 111) (253 872)
21 896 18 249 Finance income 18 315 22 000
(155 000) – Purchase of shares in joint venture – (155 000)
– (566 548) Purchase of shares in associate (566 548)
(15 405) (5 431) Loans advanced to subsidiaries – –
(5 264) (722) Acquisition of subsidiary – –
– 4 130 Proceeds from disposal of non-current assets held for sale 4 130 –
(109 684) (217 995) Acquisition of property, plant and equipment (218 717) (115 065)
(8 151) (13 294) Acquisition of intangible asset (13 294) (8 151)
2 338 6 086 Proceeds on sale of assets 6 003 2 344
(4 216) 348 171 CASH FLOW FROM FINANCING ACTIVITIES 347 061 (4 179)
(8 807) (39 406) Finance costs (39 412) (8 847)
(2 848) (112 423) Repayment of interest-bearing loans and borrowings (113 527) (2 771)
7 439 500 000 Proceeds from medium term financing 500 000 7 439
211 273 (65 225) Net increase in cash and cash equivalents (65 776) 208 278
49 284 260 557 Cash and cash equivalents at beginning of the year 264 219 55 941
260 557 195 332 CASH AND CASH EQUIVALENTS AT END OF THE YEAR 198 443 264 219

Namibia Breweries Limited Integrated Annual Report 201686
About this report
Chairperson’s statement
NBL profile
Partnering forthe future
A Namibian investment
NBL timeline
1. REPORTING ENTITYNamibia Breweries Limited (the “Company”) is a company domiciled in Namibia. The consolidated financial statements of the Company as at and for the year ended 30 June 2016 comprise the Company and its subsidiaries and the Group’s interest in associates (together referred to as the “Group” and individually as “Group entities”).
2. BASIS OF PREPARATION(a) Statement of compliance
The Company and Group financial statements have been prepared in accordance with International Financial Reporting Standards (IFRS) and the requirements of the Namibian Companies Act. The financial statements were approved by the Board of Directors on 6 September 2016. The accounting policies below apply to both consolidated and separate financial statements.
(b) Basis of measurementThe Company and Group financial statements are prepared on the historical cost basis, modified for the fair value treatment of financial instruments.
(c) Functional and presentation currencyThese financial statements are presented in Namibia Dollars (NAD), which is the Company’s and Group’s functional and presentation currency. Each entity in the Group determines its own functional currency and items included in the financial statements of each entity are measured using that functional currency. All information presented in NAD has been rounded to the nearest thousand.
(d) Use of estimates and judgementsThe preparation of financial statements in conformity with IFRS requires management to make judgements, estimates and assumptions that affect the application of policies and reported amounts of assets and liabilities, income and expenses. The estimates and associated assumptions are based on historical experience and various other factors that are believed to be reasonable under the circumstances, the results of which form the basis of making the judgements about carrying values of assets and liabilities that are not readily apparent from other sources. Actual results may differ from these estimates.
Estimates and underlying assumptions are reviewed on an ongoing basis. Revisions to accounting estimates are recognised in the period in which the estimate is revised if the revision affects only that period, or in the period of the revision and future periods if the revision affects both current and future periods. In particular, information about significant areas of estimation uncertainty and critical judgements in applying accounting policies that have the most significant effect on the amounts recognised in the financial statements is included below:
Deferred tax assetsDeferred tax assets are recognised for all unused tax losses to the extent that it is probable that taxable profit will be available against which the losses can be utilised. Significant management judgement is required to determine the amount of deferred tax assets that can be recognised, based on the likely timing and level of future taxable profits together with future tax planning strategies. The carrying amount of recognised and unrecognised tax losses are disclosed in note 17 and 25 and management’s judgement with regards to the recoverability of deferred tax asset in its associate in note 8.
Property, plant, equipment and intangible assetsThe Group and Company depreciates and amortises items of property, plant, equipment and intangible assets down to residual value over the useful life of the assets. Management makes and applies assumptions about the expected useful life and residual value of these assets in determining the annual depreciation charge. Further details are given in the accounting policy note on depreciation. In particular management have assumed a depreciation rate of 20% (2015: 20%) on returnable containers, this being management’s best estimate of breakage rate and useful life. The majority of returnable containers are with customers and the estimate of cost along with the corresponding returnable deposit liability is based on management’s judgement. Any change to these assumptions could have a significant impact on both the asset and corresponding liability.
Recoverability of investment in AssociateThe Company’s investment in the associate is carried at cost less impairment. The Directors have evaluated the value of the investment and have considered this to approximate the Company’s investment less equity accounted losses at year end. The Directors have considered the recoverability of the deferred tax asset in the associate and is of the view that, as a result of the reorganisation described in note 8, an amount of N$356.8 million of deferred tax assets, with N$89.2 million being the Group’s share, is recoverable. Should circumstances change this judgement may also change with consequential impact to the financial statements. See note 8 for further details on these assumptions.
3. SIGNIFICANT ACCOUNTING POLICIESThe accounting policies set out below have been applied consistently to all periods presented in the Company’s and Group’s financial statements.
(a) Basis of consolidation(i) Subsidiaries
Subsidiaries are those entities over whose financial and operating policies the Group has the power to exercise control, so as to obtain benefits from their activities. In assessing control potential voting rights that presently are exercisable are taken into account. The financial statements of subsidiaries are included in the consolidated financial statements from the date that control commences until the date that control ceases. The financial statements of the subsidiaries are prepared for the same reporting year as the parent company, using consistent accounting policies. Investment in subsidiaries are shown at cost in the Company’s financial statements.
(ii) AssociatesThe Group’s interest in associates are accounted for using the equity method of accounting. Under the equity method, the interest in an associate is carried in the statement of financial position at cost plus post acquisition changes in the Group’s net share of the assets. The statement of comprehensive income reflects the share of the results of the operations of the associate. Profits and losses resulting from transactions between the Group and the associate are eliminated to the extent of the interest in the associate.
FOR THE YEAR ENDED 30 JUNE 2016
NOTES TO THE ANNUAL FINANCIAL STATEMENTS

Partnering for the Future 87
Operating environment
Managing Director’s report
Value addedstatement
Good corporate governance
Remuneration report
Annual financial statements
(iii) Transactions eliminated on consolidationIntra-group balances and transactions and any unrealised income and expenses arising from intra-group transactions, are eliminated in preparing the consolidated financial statements. Unrealised gains from transactions with equity accounted investees are eliminated against the investment to the extent of the Group’s interest in the investee. Unrealised losses are eliminated in the same way as unrealised gains, but only to the extent there is no evidence of impairment.
(b) Foreign currencyTransactions denominated in foreign currencies are initially recorded at the functional currency rate ruling at the transaction date. Monetary assets and liabilities denominated in foreign currencies are re-translated at the functional currency rate of exchange ruling at the reporting date. All differences are taken to profit or loss. Non-monetary items that are measured in terms of historical cost in a foreign currency are translated using the exchange rate at the date of the transaction.
(c) Property, plant and equipment(i) Recognition and measurement
Items of property, plant and equipment are measured at cost less accumulated depreciation and accumulated impairment losses. Cost includes expenditure that is directly attributable to the acquisition of the asset. The cost of self-constructed assets includes the cost of material and direct labour and other costs directly attributable to bringing the asset to a working condition for its intended use. When parts of an item of property, plant and equipment have different useful lives, they are accounted for as separate items (major components) of property, plant and equipment. Gains and losses on disposal of an item of property, plant and equipment are determined by comparing the proceeds from disposal with the carrying amount of property, plant and equipment and are recognised in profit or loss.
(ii) Subsequent costsSubsequent expenditure relating to an item of property, plant and equipment is capitalised when it is probable that future economic benefits from the use of the asset will be increased and its cost can be reliably measured. All other subsequent expenditure is recognised as an expense in the period in which it is incurred.
(iii) DepreciationDepreciation is recognised in profit or loss on a straight-line basis over the estimated useful lives of each of the items of property, plant and equipment. Leased assets are depreciated over the shorter of the lease term and their useful life’s unless it is reasonably certain that the Group and Company will obtain ownership by the end of the lease term. The depreciation rates for the current and comparative periods are as follows:
2016 2015
Freehold buildings 2 – 12% 2 – 12%
Leasehold land and buildings 4% 4%
Plant and machinery 4 – 20% 4 – 20%
Vehicles 20% 20%
Furniture and equipment 10% 10%
Returnable containers 20% 20%
The asset’s residual values, useful lives and methods of depreciation are reviewed, and adjusted if appropriate, at each financial year-end. Land is not depreciated. The carrying values are reviewed for impairment when events or changes in circumstances indicate that the carrying value may not be recoverable.
An item of property, plant and equipment is derecognised on disposal or when no future economic benefits are expected from its use or disposal. Any gain or loss arising on derecognition of the asset is included in profit or loss in the year the asset is derecognised. Depreciation is not provided on assets during the time of construction.
(d) Intangible assets(i) Research and development
Expenditure on research activities, undertaken with the prospect of gaining new scientific or technical knowledge and understanding, and expenditure on internally generated goodwill and brands is recognised in profit or loss as an expense as incurred. Expenditure on development activities, whereby research findings are applied to a plan or design for the production of new or substantially improved products and processes, is capitalised if the product or process is technically feasible, costs can be reliably measured, future economic benefits are feasible and the Group or Company intends to and has sufficient resources to complete development and to use or sell the asset. The expenditure capitalised includes the cost of materials, direct labour and an appropriate proportion of overheads. Other development expenditure is recognised in profit or loss as an expense as incurred. Capitalised development expenditure is measured at cost less accumulated amortisation and impairment losses.
(ii) Other intangible assetsOther intangible assets acquired by the Group or Company, which have finite useful lives, are measured at cost less accumulated amortisation and impairment losses.

Namibia Breweries Limited Integrated Annual Report 201688
About this report
Chairperson’s statement
NBL profile
Partnering forthe future
A Namibian investment
NBL timeline
(iii) Subsequent expenditureSubsequent development expenditure on capitalised intangible assets is capitalised only when it increases the future economic benefit embodied in the specific assets to which it relates. All other subsequent expenditure is expensed as incurred.
(iv) AmortisationThe useful lives of intangible assets are assessed to be either finite or infinite. Intangible assets with finite lives are amortised on a straight line basis over the estimated useful economic life and assessed for impairment whenever there is an indication that the intangible asset may be impaired. Intangible assets with indefinite useful lives are tested for impairment annually and are not amortised. If the carrying amount exceeds the recoverable amount, an impairment loss will be recognised. Amortisation and impairment charges on intangible assets are charged to profit or loss. If an intangible asset with an indefinite life has changed to a finite life the change is made on a prospective basis.
(e) Leased assetsThe determination of whether an arrangement is, or contains a lease is based on the substance of the arrangement and requires an assessment of whether the fulfilment of the arrangement is dependent on the use of a specific asset or assets and the arrangement conveys a right to use the asset. Leases are classified as finance leases where substantially all the risks and rewards associated with ownership of an asset are transferred to the Group or Company. Operating leases are those leases which do not fall within the scope of the above definition. Payments made under leases are recognised in profit or loss on a straight line basis over the term of the lease.
(f) Non-current assets held for saleNon-current assets (or disposal groups) are classified as held for sale if their carrying amount will be recovered through a sale transaction rather than through continuing use. This condition is regarded as met only when the sale is highly probable and the asset is available for immediate sale in its present condition. Management must be committed to the sale, which should be expected to qualify for recognition as a completed sale within one year from the date of classification. Non-current assets held for sale are measured at the lower of their carrying amount and fair value less costs to sell. A non-current asset is not depreciated while it is classified as held for sale.
(g) InventoriesInventories are carried at the lower of cost and net realisable value. The cost of inventories comprises all costs of purchase, conversion and other costs incurred in bringing the inventories to their present location and condition, and is determined as follows:
Raw materials, merchandise and consumable stores:• Purchase cost on the weighted average basis.
Finished goods and work in progress:• Cost of direct materials and labour and a proportion of manufacturing overheads based on normal operating capacity but
excluding borrowing costs. Obsolete, redundant and slow moving inventories are identified on a regular basis and are written down to their estimated net realisable values. Net realisable value is the estimated selling price in the ordinary course of the business, less estimated costs of completion and the estimated costs necessary to make the sale.
(h) Impairment(i) Financial assets
A financial asset not carried at fair value through profit or loss, is assessed at each reporting date to determine whether there is any objective evidence that it is impaired. A financial asset is considered to be impaired if objective evidence indicates that one or more events have had a negative effect on the estimated future cash flows of the assets that can be estimated reliably. An impairment loss in respect of a financial asset measured at amortised cost is calculated as the difference between the carrying amount, and the present value of the estimated future cash flows discounted at the asset’s original effective interest rate. An impairment loss in respect of an available for-sale financial asset is calculated by reference to its fair value. All impairment losses are recognised in profit or loss. Any cumulative loss in respect of an available-for-sale financial asset recognised previously in equity is transferred to profit or loss. An impairment loss is reversed if the reversal can be related objectively to an event occurring after the impairment loss was recognised. Impairment loss reversals are recognised in profit or loss except for impairment reversals of available-for-sale equity securities which are recognised in other comprehensive income.
(ii) Non-financial assetsThe carrying amounts of the Company’s and the Group’s non-financial assets, other than inventories and deferred tax assets, are reviewed at each reporting date to determine whether there is any indication of impairment. If any such indication exists, then the asset’s recoverable amount is estimated. The recoverable amount of an asset or cash-generating unit is the greater of its value-in-use and its fair value less costs to sell. In assessing value-in-use, the estimated future cash flows are discounted to their present value using a pre-tax discount rate that reflects current market assessments of the time value of money and the risks specific to the asset.
An impairment loss is recognised if the carrying amount of an asset or its cash-generating unit exceeds its estimated recoverable amount. Impairment losses are recognised in profit or loss. An impairment loss is reversed if there has been a change in the estimates used to determine the recoverable amount. An impairment loss is reversed only to the extent that the asset’s carrying amount does not exceed the carrying amount that would have been determined, net of depreciation or amortisation, if no impairment loss had been recognised.
FOR THE YEAR ENDED 30 JUNE 2016
NOTES TO THE ANNUAL FINANCIAL STATEMENTS

Partnering for the Future 89
Operating environment
Managing Director’s report
Value addedstatement
Good corporate governance
Remuneration report
Annual financial statements
(i) Financial instruments(i) Non-derivative financial instruments
Non-derivative financial instruments comprise trade and other receivables, cash and cash equivalents, interest-bearing borrowings, trade and other payables. Non-derivative financial instruments are recognised initially at fair value plus, for instruments not at fair value through profit and loss, any directly attributable transaction costs. Subsequent to initial recognition, non-derivative financial instruments are measured as described below. Accounting for finance income and costs is discussed in note 3(m) and 3(l). All regular way purchases and sales of financial assets are recognised on the trade date i.e. the date that the Company and Group commits to purchase the asset.
(ii) Financial assets or liabilities at fair value through profit or lossIncluded in this category are derivative financial instruments. Financial assets or liabilities classified as at fair value through profit or loss, are subsequent to initial recognition, measured at fair value with changes in fair value recognised in profit or loss.
(iii) Loans and receivablesIncluded in this category are the loans to the share purchase trust as well as to holding company and fellow subsidiaries. Loans and receivables are non-derivative financial assets with fixed or determinable payments that are not quoted in an active market. Such assets are carried at amortised cost using the effective interest method. Amortised cost is computed as the amount initially recognised minus principle repayments, plus or minus the cumulative amortisation using the effective interest method of any difference between the initially recognised amount and the maturity amount. This calculation includes all fees and points paid or received between parties to the contract that are an integral part of the effective interest rate, transaction costs and all other premiums and discounts. Gains and losses are recognised in profit or loss when the loans and receivables are derecognised or impaired, as well as through the amortisation process.
(iv) Trade and other receivablesTrade receivables, which generally have 30 – 60 day terms, are subsequent to initial recognition, recognised at amortised cost, less impairment losses.
(v) Cash and cash equivalentsFor the purpose of the statement of cash flows, cash and cash equivalents comprise cash on hand, deposits held on call with banks, net of bank overdrafts, all of which are available for use by the Company and Group unless otherwise stated.
(vi) Interest-bearing loans and borrowingsIncluded in this category are long and medium-term financing and short-term borrowings. Non-derivative financial liabilities are recognised at amortised cost, using the effective interest method. Interest-bearing bank loans and overdrafts are recorded at the value of proceeds received, net of direct issue costs. Finance charges are accounted for on an accrual basis and are added to the carrying amount of the instrument to the extent that they are not settled in the period in which they arise.
vii) Derecognition of financial assets and liabilitiesFinancial assets – A financial asset is derecognised where the rights to receive cash flows from the asset have expired. Financial liabilities – A financial liability is derecognised when the obligation under the liability is discharged or cancelled or expires.
(viii) Non-interest-bearing financial liabilitiesNon-interest-bearing financial liabilities are recognised at amortised cost.
(j) ProvisionsProvisions are recognised when the Company or Group has a present legal or constructive obligation, as a result of past events, for which it is probable that an outflow of economic benefits will be required to settle the obligation, and a reliable estimate can be made for the amount of the obligation. Provisions are determined by discounting the expected future cash flows at a pre-tax rate that reflects the current market assessments of the time value of money and the risks specific to the liability. A provision for restructuring is recognised when the Company and Group has approved a detailed and formal restructuring plan, and the restructuring has either commenced or has been announced publicly. Future operating losses are not provided for.
(k) RevenueRevenue comprises royalty and rental income and the sales of beer, soft drinks and by-products, less indirect taxes, excise duty and discounts. Revenue is recognised to the extent that it is probable that the economic benefits will flow to the Company or Group and the revenue can be reliably measured. The following specific recognition criteria must also be met before revenue is recognised:
(i) Sale of GoodsRevenue is recognised when the significant risks and rewards of ownership of the goods have passed to the buyer, recovery of the consideration is probable, the associated costs can be estimated reliably, there is no continuing management involvement with the goods, and the amount of revenue can be measured reliably.
(ii) Rental incomeRental income is recognised on a straight-line basis over the term of the lease.
(iii) Royalty incomeRoyalty income is recognised on an accrual basis in accordance with the substance of the relevant agreement.
(l) Finance incomeFinance income comprises interest income on funds. Interest income is recognised in the year as it accrues in profit or loss, using the effective interest method.
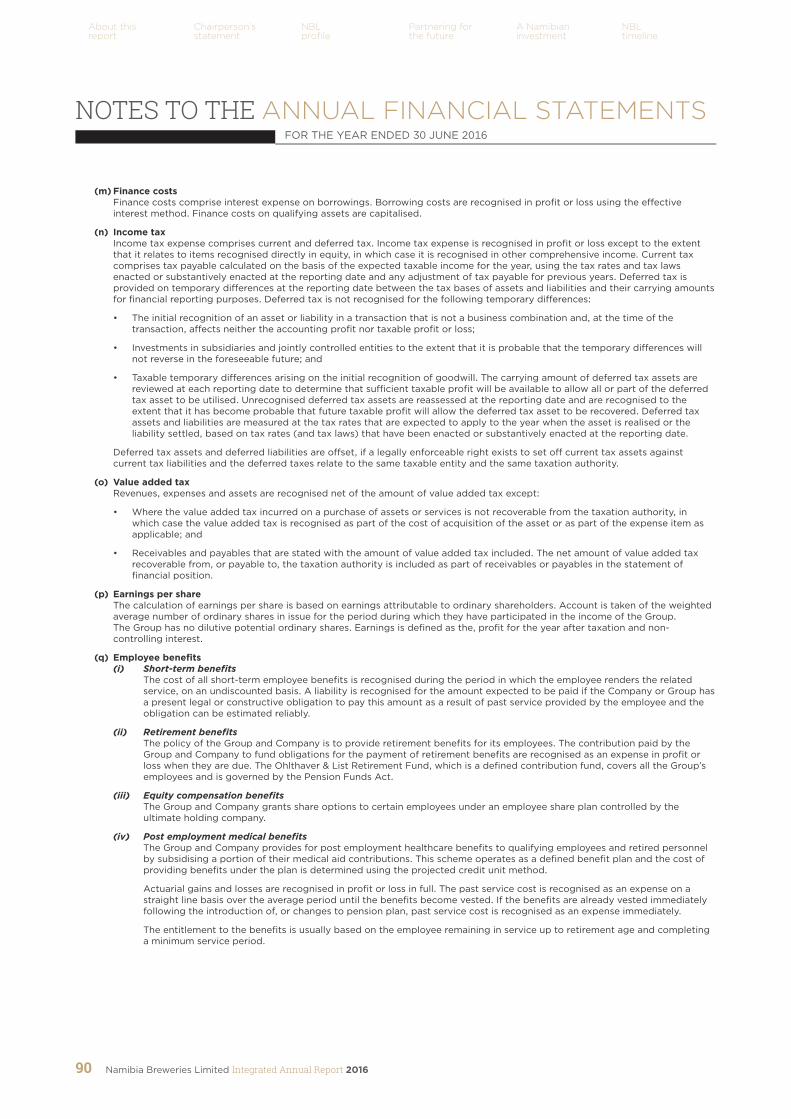
Namibia Breweries Limited Integrated Annual Report 201690
About this report
Chairperson’s statement
NBL profile
Partnering forthe future
A Namibian investment
NBL timeline
(m) Finance costsFinance costs comprise interest expense on borrowings. Borrowing costs are recognised in profit or loss using the effective interest method. Finance costs on qualifying assets are capitalised.
(n) Income taxIncome tax expense comprises current and deferred tax. Income tax expense is recognised in profit or loss except to the extent that it relates to items recognised directly in equity, in which case it is recognised in other comprehensive income. Current tax comprises tax payable calculated on the basis of the expected taxable income for the year, using the tax rates and tax laws enacted or substantively enacted at the reporting date and any adjustment of tax payable for previous years. Deferred tax is provided on temporary differences at the reporting date between the tax bases of assets and liabilities and their carrying amounts for financial reporting purposes. Deferred tax is not recognised for the following temporary differences:
• The initial recognition of an asset or liability in a transaction that is not a business combination and, at the time of the transaction, affects neither the accounting profit nor taxable profit or loss;
• Investments in subsidiaries and jointly controlled entities to the extent that it is probable that the temporary differences will not reverse in the foreseeable future; and
• Taxable temporary differences arising on the initial recognition of goodwill. The carrying amount of deferred tax assets are reviewed at each reporting date to determine that sufficient taxable profit will be available to allow all or part of the deferred tax asset to be utilised. Unrecognised deferred tax assets are reassessed at the reporting date and are recognised to the extent that it has become probable that future taxable profit will allow the deferred tax asset to be recovered. Deferred tax assets and liabilities are measured at the tax rates that are expected to apply to the year when the asset is realised or the liability settled, based on tax rates (and tax laws) that have been enacted or substantively enacted at the reporting date.
Deferred tax assets and deferred liabilities are offset, if a legally enforceable right exists to set off current tax assets against current tax liabilities and the deferred taxes relate to the same taxable entity and the same taxation authority.
(o) Value added taxRevenues, expenses and assets are recognised net of the amount of value added tax except:
• Where the value added tax incurred on a purchase of assets or services is not recoverable from the taxation authority, in which case the value added tax is recognised as part of the cost of acquisition of the asset or as part of the expense item as applicable; and
• Receivables and payables that are stated with the amount of value added tax included. The net amount of value added tax recoverable from, or payable to, the taxation authority is included as part of receivables or payables in the statement of financial position.
(p) Earnings per shareThe calculation of earnings per share is based on earnings attributable to ordinary shareholders. Account is taken of the weighted average number of ordinary shares in issue for the period during which they have participated in the income of the Group. The Group has no dilutive potential ordinary shares. Earnings is defined as the, profit for the year after taxation and non-controlling interest.
(q) Employee benefits(i) Short-term benefits
The cost of all short-term employee benefits is recognised during the period in which the employee renders the related service, on an undiscounted basis. A liability is recognised for the amount expected to be paid if the Company or Group has a present legal or constructive obligation to pay this amount as a result of past service provided by the employee and the obligation can be estimated reliably.
(ii) Retirement benefitsThe policy of the Group and Company is to provide retirement benefits for its employees. The contribution paid by the Group and Company to fund obligations for the payment of retirement benefits are recognised as an expense in profit or loss when they are due. The Ohlthaver & List Retirement Fund, which is a defined contribution fund, covers all the Group’s employees and is governed by the Pension Funds Act.
(iii) Equity compensation benefitsThe Group and Company grants share options to certain employees under an employee share plan controlled by the ultimate holding company.
(iv) Post employment medical benefitsThe Group and Company provides for post employment healthcare benefits to qualifying employees and retired personnel by subsidising a portion of their medical aid contributions. This scheme operates as a defined benefit plan and the cost of providing benefits under the plan is determined using the projected credit unit method.
Actuarial gains and losses are recognised in profit or loss in full. The past service cost is recognised as an expense on a straight line basis over the average period until the benefits become vested. If the benefits are already vested immediately following the introduction of, or changes to pension plan, past service cost is recognised as an expense immediately.
The entitlement to the benefits is usually based on the employee remaining in service up to retirement age and completing a minimum service period.
FOR THE YEAR ENDED 30 JUNE 2016
NOTES TO THE ANNUAL FINANCIAL STATEMENTS

Partnering for the Future 91
Operating environment
Managing Director’s report
Value addedstatement
Good corporate governance
Remuneration report
Annual financial statements
(v) Severance benefit obligationIn accordance with the Namibia Labour Act, 2007 (Act No. 11 of 2007), severance benefits are payable to an employee, if the employee is dismissed, dies while employed or resigns/retires on reaching the age of 65 years. The obligation for severance benefits to current employees is actuarially determined in respect of all Group employees and is provided for in full. The cost of providing benefits is determined using the projected unit- credit method, with actuarial valuations being carried out at the end of each reporting period. The movement for the year is recognised in profit or loss in the year in which it occurs.
(r) Operating segment An operating segment is a component of the Group that engages in business activities from which it may earn revenues and incur expenses. An operating segment is also a component of the Group whose operating results are reviewed regularly by the entity’s Chief Operating Decision Maker to make decisions about resources to be allocated to the segment and assess its performance and for which discrete financial information is available. In accordance with IFRS 8 – Operating Segments, the operating segments used to present segment information were identified on the basis of the internal reports used by management to allocate resources to the segments and assess their performance. The Executive Directors (Managing Director and Finance Director) are the Group’s ‘Chief Operating Decision Maker’ within the meaning of IFRS 8.
The operating segments have been identified and classified in a manner that reflects the nature of the products offered by the Group.
Operating segments whose total revenue, absolute profit or loss for the period or total assets are 10% or more of total Group revenue, profit or loss or total assets, are reported separately.
The measure of profit or loss used by the Chief Operating Decision Maker is EBIT (Earnings Before Interest and Taxes), which includes revenue and expenses directly relating to a business segment but excludes net finance charges and taxation, which cannot be allocated to any specific segment.
(s) New and amended IFRS and IAS The Group and Company has not adopted the following new and amended IFRS and IAS during the year.

Namibia Breweries Limited Integrated Annual Report 201692
About this report
Chairperson’s statement
NBL profile
Partnering forthe future
A Namibian investment
NBL timeline
FOR THE YEAR ENDED 30 JUNE 2016
NOTES TO THE ANNUAL FINANCIAL STATEMENTS
ADOPTION OF NEW AND REVISED STANDARDS
Recent amendments
The following table contains effective dates of IFRS and recently revised International Accounting Standards (IAS), which have not been early adopted by the Company and that might affect future financial periods:
New/Revised International Financial Reporting Standards
Effective for annual periods beginning
on or after
IFRS 5 Non-current assets Held for Sale and Discontinued Operations
Clarity that a change in the manner of disposal of a non-current asset or disposal group held for sale does not result in a change of classification as held for sale does not change. 1 January 2016
IFRS 7 Financial Instruments: Disclosures 1 January 2016
IFRS 9 Financial Instruments
Reissue to include requirements for the classification and measurement of financial liabilities and incorporate existing recognition requirements 1 January 2018
IFRS 10 Consolidated Financial Statements
Amendments for investment entities 1 January 2016
IFRS 11 Joint Arrangements
Guidance on how to account for the acquisition of an interest in a joint operation that constitutes a business 1 January 2016
IFRS 15 Revenue from Contracts from Customers
Changes to revenue recognition criteria and additional disclosure requirements 1 January 2018
IAS 1 Presentation of Financial Statements
Encouragement to entities to apply professional judgement in determining what information to disclose in their financial statements 1 January 2016
IAS 16 Financial Instruments: Presentation
Amendments relating to the offsetting of financial assets and financial liabilities 1 January 2016
IAS 19 Defined Benefit Plans: Employee Contributions
– Clarity of the requirements of to determine the discount rate in a regional market sharing the same currency. 1 January 2016
IAS 27 Consolidated and Separate Financial Statements
– Amendments to allow entities to use the equity method to account for investments in subsidiaries, joint ventures and associates in their separate financial statements 1 January 2016
IAS 28 Investments in Associates and Joint Ventures 1 January 2016
IAS 34 Interim Financial Reporting 1 January 2016
IAS 38 Intangible Assets
Clarity on the principles and the basis for the calculation of depreciation and amortisation 1 January 2016
IFRS 12 Disclosure of Interests in Other Entities
Amendments for investment entities 1 January 2016
The Directors are assessing the impact of adopting these standards but does not currently expect the adoption of any of these standards to have a significant impact on these accounts.

Partnering for the Future 93
Operating environment
Managing Director’s report
Value addedstatement
Good corporate governance
Remuneration report
Annual financial statements
COMPANY GROUP
2015 N$’000s
2016 N$’000s
2016 N$’000s
2015 N$’000s
4. PROPERTY, PLANT AND EQUIPMENT
At cost
150 362 153 605 Freehold land and buildings 188 434 184 470
3 892 3 892 Leasehold land and buildings 6 050 6 050
993 926 1 046 706 Plant and machinery 1 406 735 994 071
73 992 96 465 Vehicles 96 618 74 261
50 053 62 784 Furniture and equipment 62 926 50 252
193 026 278 361 Returnable containers 278 361 207 923
11 042 60 425 Assets under construction 60 425 11 042
1 476 293 1 702 238 1 739 549 1 528 069
Accumulated depreciation and impairment losses
29 246 30 325 Freehold land and buildings 30 325 29 246
3 138 3 581 Leasehold land and buildings 5 351 4 753
438 027 500 383 Plant and machinery 500 395 438 150
44 151 51 602 Vehicles 51 750 44 319
35 167 40 242 Furniture and equipment 40 311 35 269
90 301 128 052 Returnable containers 128 052 105 199
640 030 754 185 756 184 656 936
Carrying value
121 116 123 280 Freehold land and buildings 158 109 155 224
754 311 Leasehold land and buildings 699 1 297
555 899 546 323 Plant and machinery 546 340 555 921
29 841 44 863 Vehicles 44 868 29 942
14 886 22 542 Furniture and equipment 22 615 14 983
102 725 150 309 Returnable containers 150 309 102 724
11 042 60 425 Assets under construction 60 425 11 042
836 263 948 053 983 365 871 133
Movement of property, plant and equipment has been detailed in Annexure B.
LEASED ASSETS
Included above are leased vehicles under a number of finance lease agreements, details of which are set out below:
Vehicles
26 106 37 918 At cost 37 918 26 106
(12 371) (15 437) Accumulated depreciation (15 437) (12 371)
13 735 22 481 Carrying value 22 481 13 735
The leased assets are encumbered in terms of finance lease agreements (see note 15 and 30).
Land and Buildings
The Group’s land and buildings are not encumbered. Details of the Group’s land and leasehold land and buildings are maintained at the registered office of the Company.

Namibia Breweries Limited Integrated Annual Report 201694
About this report
Chairperson’s statement
NBL profile
Partnering forthe future
A Namibian investment
NBL timeline
COMPANY GROUP
2015 N$’000s
2016 N$’000s
2016 N$’000s
2015 N$’000s
5. INTANGIBLE ASSETS
At cost
10 971 17 592 Automation processes 17 592 10 971
9 000 9 000 Trademarks 9 000 9 000
11 960 18 633 Software licences 18 633 11 960
31 931 45 225 45 225 31 931
Accumulated amortisation
7 700 9 648 Automation processes 9 648 7 700
– – Trademarks – –
7 484 10 062 Software licences 10 062 7 484
15 184 19 710 19 710 15 184
Carrying value
3 271 7 944 Automation processes 7 944 3 271
9 000 9 000 Trademarks 9 000 9 000
4 476 8 571 Software licences 8 571 4 476
16 747 25 515 25 515 16 747
Movement of intangible asset has been detailed in Annexure B.
6. INVESTMENT IN SUBSIDIARIES (ANNEXURE C)
35 096 35 818 Shares at cost
(995) (2 246) Loan from subsidiary
34 101 33 572
– – Loan to subsidiaries
34 101 33 572
(835) (2 086) Current
34 936 35 658 Non-current
34 101 33 572 Net investment in subsidiaries
Aggregated losses of subsidiaries amounted to N$59.3 million (2015: N$54.7 million). Losses incurred by subsidiaries for the year amounted to N$4.6 million (2015: N$17.8 million).
The loans are interest free and have no fixed repayment terms.
7. INVESTMENT IN A JOINT VENTURE
784 007 – Shares at cost – 784 007
(829 307) – Impairment of investment – –
73 625 – Loans to joint venture – 73 625
– – Accumulated equity accounted losses – (829 307)
28 325 – Carrying amount of the investment – 28 325
Disclosed as
– Current – –
28 325 – Non-current – 28 325
28 325 – – 28 325
FOR THE YEAR ENDED 30 JUNE 2016
NOTES TO THE ANNUAL FINANCIAL STATEMENTS

Partnering for the Future 95
Operating environment
Managing Director’s report
Value addedstatement
Good corporate governance
Remuneration report
Annual financial statements
COMPANY GROUP
2015 N$’000s
2016 N$’000s
2016 N$’000s
2015 N$’000s
7. INVESTMENT IN A JOINT VENTURE (continued)
On 1 December 2015, the joint venture agreement between NBL, Diageo and Heineken was terminated by mutual consent. This agreement was replaced by a new agreement between NBL and Heineken. Refer to note 8 for details on the new agreement between NBL and Heineken.
The summarised financial information of material joint ventures at 30 June and for the years then ended is as follows:
Summarised statement of financial position
Current assets – 784 295
Non-current assets – 356 849
– 1 141 144
Current liabilities – 1 073 345
Non-current liabilities – –
– 1 073 345
No balances in the statement of financial position, as all balances are reflected in the investment in associate. Amounts reflected in the statement of comprehensive income are up to the date of reorganisation.
Summarised statement of comprehensive income
Revenue 2 159 405 4 743 766
Net interest expense (20 689) (100 726)
Other income and expenses (2 389 796) (5 424 531)
Loss before income tax (251 080) (781 491)
Income tax expense –
Profit/(loss) from continuing operations (251 080) (781 491)
Total comprehensive income (251 080) (781 491)
Royalties received from joint venture 49 686 79 067
Reconciliation of movements
– 28 325 Opening balance 28 325 – –
139 500 – Equity investment – 139 500
13 418 – Loans advanced – 13 418
(124 593) (38 917) Loss recognised (38 917) (124 593)
– (73 625) Transfer of loan to associate (73 625) –
– – Transfer of loss to associate 84 217 –
– 84 217 Transfer of investment to associate – –
28 325 – – 28 325
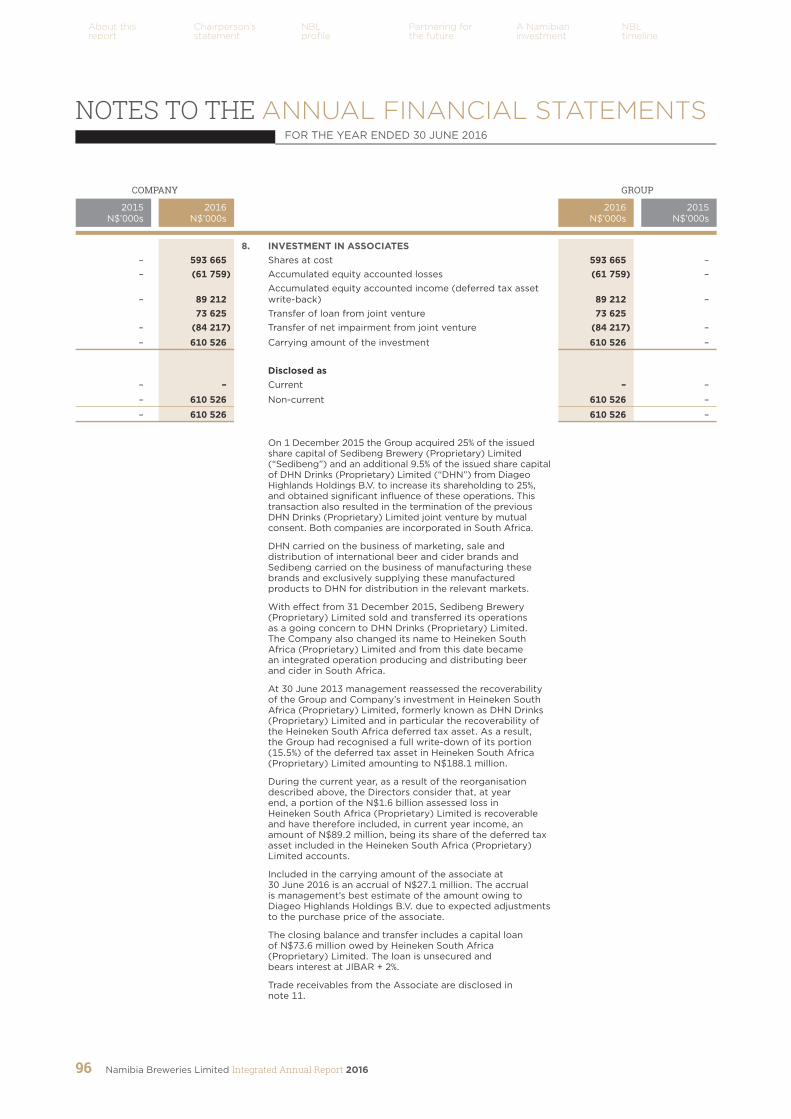
Namibia Breweries Limited Integrated Annual Report 201696
About this report
Chairperson’s statement
NBL profile
Partnering forthe future
A Namibian investment
NBL timeline
COMPANY GROUP
2015 N$’000s
2016 N$’000s
2016 N$’000s
2015 N$’000s
8. INVESTMENT IN ASSOCIATES – 593 665 Shares at cost 593 665 – – (61 759) Accumulated equity accounted losses (61 759) –
– 89 212 Accumulated equity accounted income (deferred tax asset write-back) 89 212 –
73 625 Transfer of loan from joint venture 73 625 – (84 217) Transfer of net impairment from joint venture (84 217) –
– 610 526 Carrying amount of the investment 610 526 –
Disclosed as – – Current – –
– 610 526 Non-current 610 526 –
– 610 526 610 526 –
On 1 December 2015 the Group acquired 25% of the issued share capital of Sedibeng Brewery (Proprietary) Limited (“Sedibeng”) and an additional 9.5% of the issued share capital of DHN Drinks (Proprietary) Limited (“DHN”) from Diageo Highlands Holdings B.V. to increase its shareholding to 25%, and obtained significant influence of these operations. This transaction also resulted in the termination of the previous DHN Drinks (Proprietary) Limited joint venture by mutual consent. Both companies are incorporated in South Africa.
DHN carried on the business of marketing, sale and distribution of international beer and cider brands and Sedibeng carried on the business of manufacturing these brands and exclusively supplying these manufactured products to DHN for distribution in the relevant markets.
With effect from 31 December 2015, Sedibeng Brewery (Proprietary) Limited sold and transferred its operations as a going concern to DHN Drinks (Proprietary) Limited. The Company also changed its name to Heineken South Africa (Proprietary) Limited and from this date became an integrated operation producing and distributing beer and cider in South Africa.
At 30 June 2013 management reassessed the recoverability of the Group and Company’s investment in Heineken South Africa (Proprietary) Limited, formerly known as DHN Drinks (Proprietary) Limited and in particular the recoverability of the Heineken South Africa deferred tax asset. As a result, the Group had recognised a full write-down of its portion (15.5%) of the deferred tax asset in Heineken South Africa (Proprietary) Limited amounting to N$188.1 million.
During the current year, as a result of the reorganisation described above, the Directors consider that, at year end, a portion of the N$1.6 billion assessed loss in Heineken South Africa (Proprietary) Limited is recoverable and have therefore included, in current year income, an amount of N$89.2 million, being its share of the deferred tax asset included in the Heineken South Africa (Proprietary) Limited accounts.
Included in the carrying amount of the associate at 30 June 2016 is an accrual of N$27.1 million. The accrual is management’s best estimate of the amount owing to Diageo Highlands Holdings B.V. due to expected adjustments to the purchase price of the associate.
The closing balance and transfer includes a capital loan of N$73.6 million owed by Heineken South Africa (Proprietary) Limited. The loan is unsecured and bears interest at JIBAR + 2%.
Trade receivables from the Associate are disclosed in note 11.
FOR THE YEAR ENDED 30 JUNE 2016
NOTES TO THE ANNUAL FINANCIAL STATEMENTS

Partnering for the Future 97
Operating environment
Managing Director’s report
Value addedstatement
Good corporate governance
Remuneration report
Annual financial statements
COMPANY GROUP
2015 N$’000s
2016 N$’000s
2016 N$’000s
2015 N$’000s
8. INVESTMENT IN ASSOCIATES (continued)
The summarised financial information of material associates at 30 June and for the years then ended is as follows:
Summarised statement of financial position
Current assets 1 721 294 –
Non-current assets 4 250 252 –
5 971 546 –
Current liabilities 937 468 –
Non-current liabilities 2 917 406 –
3 854 874 –
Summarised statement of comprehensive income
Revenue 2 815 648 –
Other income and expenses (3 028 971) –
Loss before income tax (213 323) –
Income tax expense (33 712) –
Profit (loss) from continuing operations (247 035) –
Total comprehensive loss (247 035) –
Equity loss from associate (61 759) –
Equity income from associate (deferred tax asset write-back) 89 212 –
27 453 –
Royalties received from associate 38 929 –
Results are included from the date of commencement of the new arrangement.
9. AVAILABLE-FOR-SALE INVESTMENTS
Unlisted investments
15 15 L&T Ventures (Proprietary) Limited 15 15
15 15 Directors’ valuation of unlisted investments 15 15
10. INVENTORIES
58 577 60 486 Raw materials 60 486 58 577
17 631 18 144 Work in progress 18 144 17 631
55 127 101 845 Finished products 101 845 55 869
89 821 82 012 Consumable stores 82 012 89 082
5 448 5 651 Merchandise 5 651 5 448
226 604 268 138 268 138 226 607
On 30 June 2016 the impairment to inventories amounted to N$12.1 million (2015: N$9.1 million). The impairment is included in operating expenses in the income statement and is mainly due to redundant spares and changes in packaging design.

Namibia Breweries Limited Integrated Annual Report 201698
About this report
Chairperson’s statement
NBL profile
Partnering forthe future
A Namibian investment
NBL timeline
COMPANY GROUP
2015 N$’000s
2016 N$’000s
2016 N$’000s
2015 N$’000s
11. TRADE AND OTHER RECEIVABLES
174 756 234 559 Trade receivables 237 417 173 275
(1 860) (7 079) Allowance for credit losses (7 079) (1 860)
62 911 – Receivables from Joint Ventures – 62 911
– 60 402 Receivables from Associates 60 402 –
3 671 5 136 Receivables from holding company and fellow subsidiaries (note 29.1) 2 136 740
323 – Receivables from other related parties (note 29.2) – 323
13 700 6 673 Value added taxation 7 733 14 503
4 244 10 989 Receiver of revenue tax receivable 10 989 4 482
10 830 11 874 Refundable deposits 11 874 10 830
30 549 30 991 Prepayments 30 991 30 549
29 905 28 583 Other receivables 29 752 29 850
329 029 382 128 384 215 325 603
Trade receivables is shown net of impairment of N$7.1 million (2015: N$1.9 million). The impairment is included in operating expenses in profit or loss.
Trade receivables are non-interest-bearing and are generally on 30 – 60 days’ terms.
For terms and conditions relating to related party receivables, refer to note 29.
Trade receivables are pledged as security for the medium term loans disclosed in note 15 and Annexure A.
The Directors consider that the carrying amount of trade and other receivables approximate their fair value.
The average credit period on sales of goods of the Company is 45 days (2015: 45 days). No interest is charged on trade receivables. At 30 June 2016, receivables of N$73.9 million (2015: N$57.2 million) were past due but not impaired. The Company has not provided for these as there has not been a significant change in credit quality.
Movement in the allowance account for impairment losses:
(563) (1 860) Balance at the beginning of the year (1 860) (563)
(1 865) (9 187) Charge for the year (9 187) (1 865)
568 3 968 Utilised 3 968 568
(1 860) (7 079) Balance at the end of the year (7 079) (1 860)
Analysed as follows:
(1 860) (7 079) Individually impaired trade receivables (7 079) (1 860)
– – Collectively impaired trade receivables – –
(1 860) (7 079) (7 079) (1 860)
In determining the recoverability of a trade receivable, the Company and Group considers any change in the credit quality of the trade receivable from the date credit was initially granted up to the reporting date. See also note 31.3.
The concentration of credit risk is limited and is fully detailed in note 31.3. The Directors believe that there is no further credit provision required in excess of the allowance for doubtful debts.
The impairment recognised represents the difference between the carrying amount of these trade receivable and the present value of the expected liquidation proceeds. The Group does not hold any collateral over these balances.
FOR THE YEAR ENDED 30 JUNE 2016
NOTES TO THE ANNUAL FINANCIAL STATEMENTS
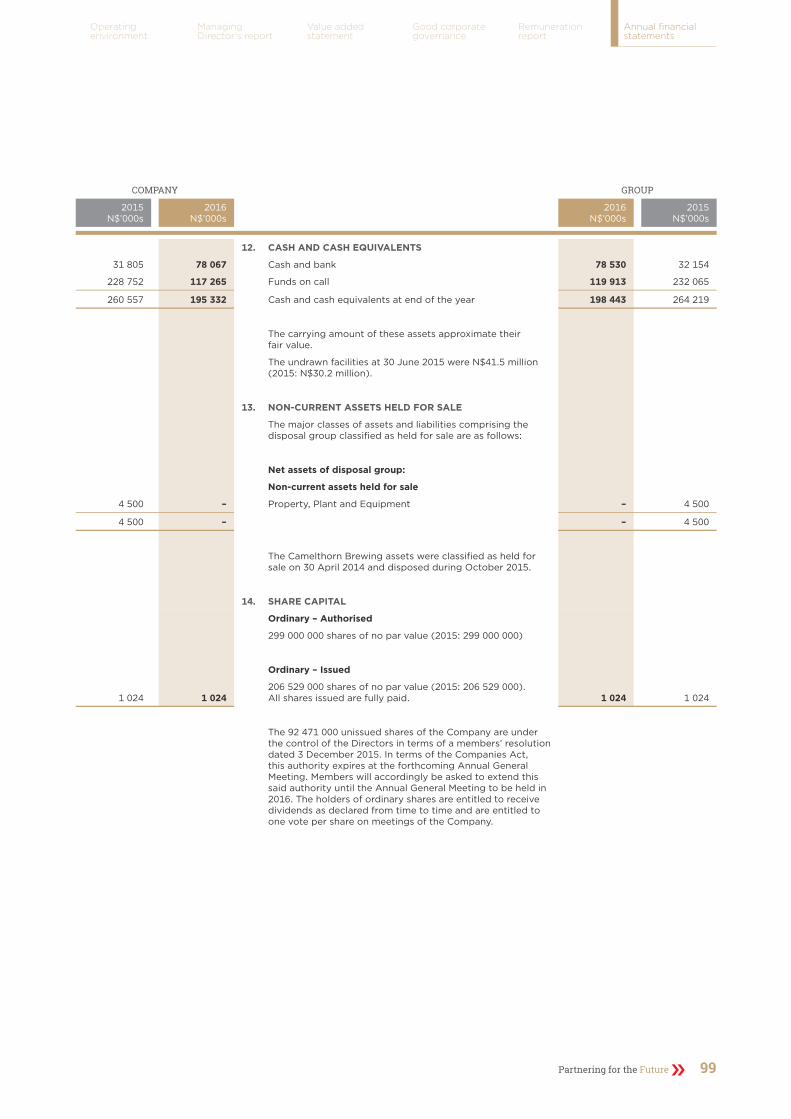
Partnering for the Future 99
Operating environment
Managing Director’s report
Value addedstatement
Good corporate governance
Remuneration report
Annual financial statements
COMPANY GROUP
2015 N$’000s
2016 N$’000s
2016 N$’000s
2015 N$’000s
12. CASH AND CASH EQUIVALENTS
31 805 78 067 Cash and bank 78 530 32 154
228 752 117 265 Funds on call 119 913 232 065
260 557 195 332 Cash and cash equivalents at end of the year 198 443 264 219
The carrying amount of these assets approximate their fair value.
The undrawn facilities at 30 June 2015 were N$41.5 million (2015: N$30.2 million).
13. NON-CURRENT ASSETS HELD FOR SALE
The major classes of assets and liabilities comprising the disposal group classified as held for sale are as follows:
Net assets of disposal group:
Non-current assets held for sale
4 500 – Property, Plant and Equipment – 4 500
4 500 – – 4 500
The Camelthorn Brewing assets were classified as held for sale on 30 April 2014 and disposed during October 2015.
14. SHARE CAPITAL
Ordinary – Authorised
299 000 000 shares of no par value (2015: 299 000 000)
Ordinary – Issued
1 024 1 024 206 529 000 shares of no par value (2015: 206 529 000). All shares issued are fully paid. 1 024 1 024
The 92 471 000 unissued shares of the Company are under the control of the Directors in terms of a members’ resolution dated 3 December 2015. In terms of the Companies Act, this authority expires at the forthcoming Annual General Meeting. Members will accordingly be asked to extend this said authority until the Annual General Meeting to be held in 2016. The holders of ordinary shares are entitled to receive dividends as declared from time to time and are entitled to one vote per share on meetings of the Company.

Namibia Breweries Limited Integrated Annual Report 2016100
About this report
Chairperson’s statement
NBL profile
Partnering forthe future
A Namibian investment
NBL timeline
COMPANY GROUP
2015 N$’000s
2016 N$’000s
2016 N$’000s
2015 N$’000s
15. INTEREST-BEARING LOANS AND BORROWINGS
This note provides information about the contractual terms of the Company and Group’s interest-bearing loans and borrowings. For more information about the exposure to interest rate risk, see Annexure A.
Non-current liabilities
Secured
– 462 500 Medium term loan (Annexure A) 462 500 –
13 811 17 239 Finance lease liabilities (Annexure A) (note 4) 17 239 13 821
13 811 479 739 479 739 13 821
Current liabilities
Unsecured
835 2 086 Loan from related parties (Annexure A) – –
Secured
100 000 37 500 Medium term loan (Annexure A) 37 500 100 000
5 611 6 878 Finance lease liabilities (Annexure A) (note 4) 6 883 5 711
106 446 46 464 44 383 105 711
For terms and conditions relating to interest-bearing borrowings, refer to Annexure A.
16. RETIREMENT BENEFIT INFORMATION
16.1 Retirement fund
The total value of contributions to the Ohlthaver & List Retirement Fund during the period amounted to:
7 014 7 618 Members 7 618 7 014
18 749 19 791 Employer contributions 19 791 18 749
25 763 27 409 27 409 25 763
This is a defined contribution plan and is regulated by the Pension Fund Act. The fund is valued at intervals of not more than three years. The fund was valued by an independent consulting actuary at 30 June 2016 and its assets were found to exceed its actuarially calculated liabilities.
16.2 Post employment medical aid benefit plan
8 882 9 484 Balance at the beginning of the year 9 484 8 882
732 754 Interest cost 754 732
566 (891) Actuarial (gain)/loss (891) 566
(696) (759) Benefits paid (759) (696)
9 484 8 588 Non current balance at the end of the year 8 588 9 484
The O&L Group provides for post employment medical aid benefits in respect of retired employees. The present value of the provision at 30 June 2016, as determined by using projected unit credit method, was N$8.6 million (2015: N$9.5 million). Future benefits valued are projected using specific actuarial assumptions and the liability for in-service members is accrued over the expected working lifetime.
FOR THE YEAR ENDED 30 JUNE 2016
NOTES TO THE ANNUAL FINANCIAL STATEMENTS
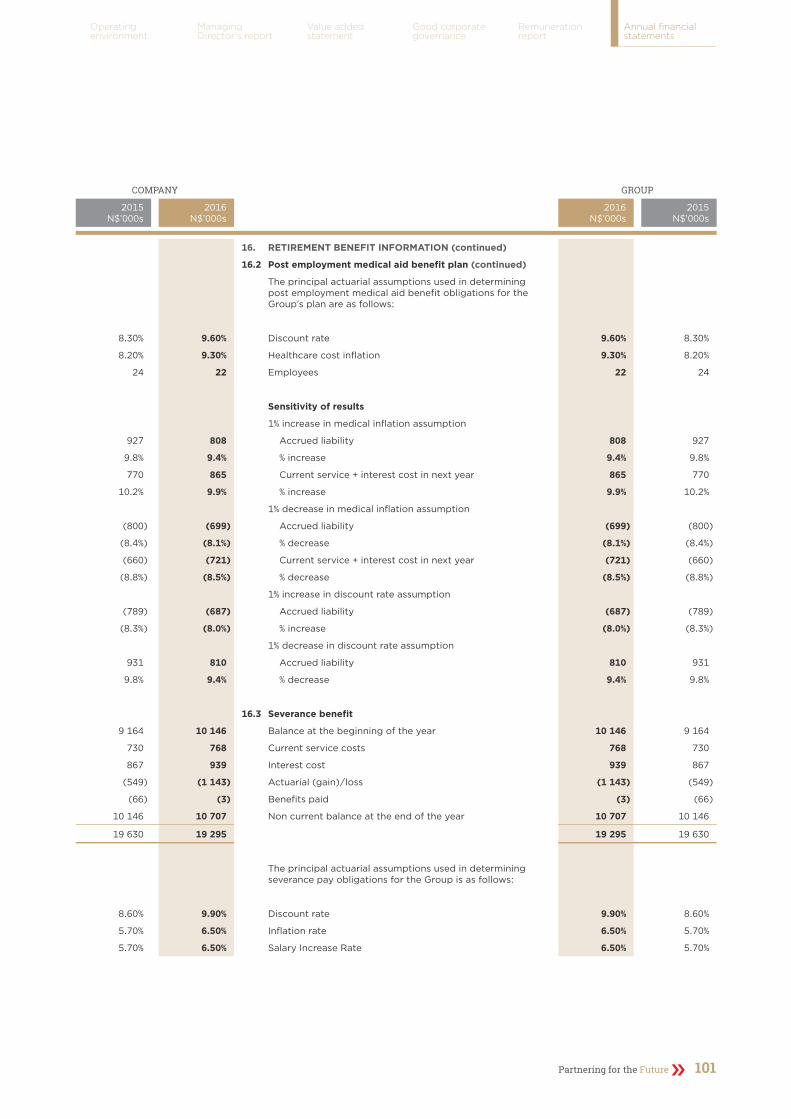
Partnering for the Future 101
Operating environment
Managing Director’s report
Value addedstatement
Good corporate governance
Remuneration report
Annual financial statements
COMPANY GROUP
2015 N$’000s
2016 N$’000s
2016 N$’000s
2015 N$’000s
16. RETIREMENT BENEFIT INFORMATION (continued)
16.2 Post employment medical aid benefit plan (continued)
The principal actuarial assumptions used in determining post employment medical aid benefit obligations for the Group’s plan are as follows:
8.30% 9.60% Discount rate 9.60% 8.30%
8.20% 9.30% Healthcare cost inflation 9.30% 8.20%
24 22 Employees 22 24
Sensitivity of results
1% increase in medical inflation assumption
927 808 Accrued liability 808 927
9.8% 9.4% % increase 9.4% 9.8%
770 865 Current service + interest cost in next year 865 770
10.2% 9.9% % increase 9.9% 10.2%
1% decrease in medical inflation assumption
(800) (699) Accrued liability (699) (800)
(8.4%) (8.1%) % decrease (8.1%) (8.4%)
(660) (721) Current service + interest cost in next year (721) (660)
(8.8%) (8.5%) % decrease (8.5%) (8.8%)
1% increase in discount rate assumption
(789) (687) Accrued liability (687) (789)
(8.3%) (8.0%) % increase (8.0%) (8.3%)
1% decrease in discount rate assumption
931 810 Accrued liability 810 931
9.8% 9.4% % decrease 9.4% 9.8%
16.3 Severance benefit
9 164 10 146 Balance at the beginning of the year 10 146 9 164
730 768 Current service costs 768 730
867 939 Interest cost 939 867
(549) (1 143) Actuarial (gain)/loss (1 143) (549)
(66) (3) Benefits paid (3) (66)
10 146 10 707 Non current balance at the end of the year 10 707 10 146
19 630 19 295 19 295 19 630
The principal actuarial assumptions used in determining severance pay obligations for the Group is as follows:
8.60% 9.90% Discount rate 9.90% 8.60%
5.70% 6.50% Inflation rate 6.50% 5.70%
5.70% 6.50% Salary Increase Rate 6.50% 5.70%

Namibia Breweries Limited Integrated Annual Report 2016102
About this report
Chairperson’s statement
NBL profile
Partnering forthe future
A Namibian investment
NBL timeline
COMPANY GROUP
2015 N$’000s
2016 N$’000s
2016 N$’000s
2015 N$’000s
17. DEFERRED TAXATION
Deferred taxation liability
185 380 187 611 Balance at beginning of the year 187 644 185 588
11 502 13 847 Accelerated depreciation for tax purposes 13 920 11 327
(650) 4 721 Consumables 4 721 (650)
1 723 (5 473) Customer deposits (5 473) 1 723
(10 016) (2 321) Other provisions (2 321) (10 016)
174 (3 134) Other leases (3 134) 174
1 915 (2 404) Prepayments (2 404) 1 915
(523) 303 Retirement and severance pay benefit obligations 303 (523)
(476) 1 037 Intangible asset 1 037 (476)
(1 418) – Prior period adjustment – (1 418)
– (639) Unrealised foreign exchange (losses)/profit (639) –
2 231 5 937 Movement during the year 6 010 2 056
187 611 193 548 193 654 187 644
Analysis of deferred taxation liability:
217 679 231 526 Accelerated depreciation for tax purposes 231 632 217 712
4 528 9 249 Consumables 9 249 4 528
(13 550) (19 023) Customer deposits (19 023) (13 550)
(14 408) (16 729) Other provisions (16 729) (14 408)
(4 584) (7 718) Other leases (7 718) (4 584)
3 158 754 Prepayments 754 3 158
(6 478) (6 175) Retirement benefit obligations (6 175) (6 478)
2 684 3 721 Intangible asset 3 721 2 684
(1 418) (1 418) Prior period adjustment (1 418) (1 418)
– (639) Unrealised foreign exchange (losses)/profit (639) –
187 611 193 548 193 654 187 644
The deferred tax assets and deferred tax liability relate to income in the same jurisdiction, and the law allows net settlement.
Unused tax losses not recognised as deferred tax assets as a result of uncertainty with regards to the recoverability thereof amount to N$57.0 million (2015: N$53.7 million).
FOR THE YEAR ENDED 30 JUNE 2016
NOTES TO THE ANNUAL FINANCIAL STATEMENTS

Partnering for the Future 103
Operating environment
Managing Director’s report
Value addedstatement
Good corporate governance
Remuneration report
Annual financial statements
COMPANY GROUP
2015 N$’000s
2016 N$’000s
2016 N$’000s
2015 N$’000s
18. TRADE AND OTHER PAYABLES
158 362 179 995 Trade and other payables 182 995 162 161
45 685 54 956 Excise duties 54 956 45 685
119 161 174 332 Accruals 176 886 119 332
28 195 42 333 Returnable packaging deposits 42 333 28 195
2 656 3 119 Value added taxation 4 057 3 301
4 694 8 213 Payables to related parties (note 29.1) 8 213 4 694
358 753 462 948 469 440 363 368
For terms and conditions and balances owing to relating to related parties refer to note 29.
Trade and other payables comprise amounts outstanding for trade purchases and ongoing costs. The Directors consider the carrying amount of trade and other payables approximates their fair value.
Trade payables are non-interest-bearing and are normally settled on 30 – 60 day terms.
The Company and Group have financial risk management policies to ensure payables are paid in time.
Accruals relates to leave, medical, bonus, electricity and management fee accruals.
19. DERIVATIVE FINANCIAL INSTRUMENTS
(300) (4 959) Forward foreign exchange contract liability (4 959) (300)
Refer to note 32.2 for details for outstanding forward exchange contracts at year end.
20. REVENUE
2 421 961 2 408 456 Sale of goods 2 432 491 2 432 806
(75 795) (93 232) Discounts allowed (95 221) (77 696)
79 067 88 615 Royalty income 88 615 79 067
2 425 233 2 403 839 2 425 885 2 434 177
The amount included in revenue arising from export sales amounts to N$670 million (2015: N$912 million).
21. OPERATING EXPENSES
Costs by nature
858 531 730 593 Raw material and consumables 730 524 860 587
266 365 286 080 Employment costs 289 544 268 714
442 587 502 171 Administration and marketing expenses 516 165 448 969
177 930 155 880 Railage and transport 155 880 177 930
50 147 67 460 Repairs and maintenance 67 735 50 572
120 163 125 064 Depreciation, amortisation and impairments 125 363 120 891
1 915 723 1 867 248 1 885 211 1 927 663

Namibia Breweries Limited Integrated Annual Report 2016104
About this report
Chairperson’s statement
NBL profile
Partnering forthe future
A Namibian investment
NBL timeline
COMPANY GROUP
2015 N$’000s
2016 N$’000s
2016 N$’000s
2015 N$’000s
22. OPERATING PROFIT
is arrived at after taking account of
Income
– 1 172 Rent received 2 344 –
(2 856) 908 Net gain/(loss) on disposal of property, plant and equipment 825 (2 856)
Expenses
Audit fees
1 404 1 540 – for statutory audit 1 540 1 404
500 1 153 – for other services 1 153 623
112 089 119 396 Depreciation 119 676 112 817
3 745 4 526 Amortisation – intangible asset 4 526 3 745
6 678 8 675 Directors emoluments (Annexure D) 8 675 6 678
46 846 45 204 Management and shared services fees 45 204 46 846
1 731 1 627 Royalties 1 627 1 731
(3 158) 4 312 Realised (profit)/loss on foreign exchange transactions 4 312 (4 050)
Operating lease payments
7 290 6 770 – land and buildings 7 002 7 479
5 117 7 423 – motor vehicles 7 468 5 214
– 4 660 Unrealised losses 4 660 –
1 607 2 966 Impairment of inventories 2 227 1 607
1 297 5 219 Impairment of trade receivables 5 219 1 297
1 425 – Impairment of Non-Current Assets Held for Sale – 1 425
15 405 5 431 Impairment of loans to subsidiaries – –
– 370 Loss on sale of Non-Current Assets Held for Sale 370 –
23. FINANCE COSTS
7 430 37 946 Interest-bearing loans 37 945 7 455
1 377 1 460 Finance leases 1 467 1 392
8 807 39 406 Total finance costs 39 412 8 847
24. FINANCE INCOME
Interest
7 033 12 147 – bank and funds on call interest 12 213 7 137
14 863 2 569 – jointly controlled entities 2 569 14 863
– 3 106 – associates 3 106 –
– 427 – holding company, fellow subsidiaries and other related parties 427 –
21 896 18 249 Total finance income 18 315 22 000
FOR THE YEAR ENDED 30 JUNE 2016
NOTES TO THE ANNUAL FINANCIAL STATEMENTS

Partnering for the Future 105
Operating environment
Managing Director’s report
Value addedstatement
Good corporate governance
Remuneration report
Annual financial statements
COMPANY GROUP
2015 N$’000s
2016 N$’000s
2016 N$’000s
2015 N$’000s
25. INCOME TAX EXPENSE
The major components of income tax expense for the years ended 30 June 2016 and 2015 are:
(113 963) (109 993) Namibian taxation (110 303) (113 968)
(22 124) (25 340) South African taxation (25 340) (22 124)
(136 087) (135 333) Total income tax expense in income statement (135 643) (136 092)
Comprising
Normal taxation
(111 733) (104 056) – current period: Namibian (104 294) (111 911)
(22 124) (25 340) – current period: South African (25 340) (22 124)
Deferred taxation
(2 230) (5 937) – current period: Namibian (6 009) (2 057)
(136 087) (135 333) Income tax expense (135 643) (136 092)
No provision for normal taxation has been made for certain subsidiaries which have estimated tax losses of N$57.0 million (2015: N$53.8 million). No deferred tax asset has been recognised for these calculated tax losses as it is uncertain that future taxable profits will be available against which the associated unused tax losses can be utilised.
– – Estimated tax losses available for set-off against future taxable income 57 036 53 776
– – Less: Applied to offset any deferred taxation liability – –
– – 57 036 53 776
– – Utilised to create deferred tax asset – –
– – Available to reduce future taxable income 57 036 53 776
% % Reconciliation of effective tax rate % %
33.0 32.0 Namibian normal tax rate 32.0 33.0
(Reduction)/increase in rate of taxation
0.0 0.0 – exempt income 0.0 0.0
(9.2) (7.4) – manufacturing allowances (7.4) (9.3)
0.0 (1.3) – decrease in tax rate (1.3) 0.0
1.2 2.0 – disallowable expenditure 1.8 0.1
(1.0) 0.0 – effect of rate differential between tax jurisdictions 0.0 (1.2)
10.2 1.8 – impairment of equity accounted investments 0.0 0.0
0.0 0.0 – equity accounted losses 1.8 10.4
0.0 (0.1) – Prior period error (0.1) 1.5
34.2 26.9 Effective rate of taxation 26.7 34.4

Namibia Breweries Limited Integrated Annual Report 2016106
About this report
Chairperson’s statement
NBL profile
Partnering forthe future
A Namibian investment
NBL timeline
COMPANY GROUP
2015 N$’000s
2016 N$’000s
2016 N$’000s
2015 N$’000s
26. BASIC AND HEADLINE EARNINGS PER ORDINARY SHARE
Basic earnings per share amounts are calculated by dividing profit for the year attributable to ordinary equity holders of the parent by weighted average number of ordinary shares outstanding during the year.
Calculation of weighted average number of shares for basic earnings per share and dilutive earnings per share:
206 529 206 529 Shares issued at beginning of the period 206 529 206 529
– – Shares issued during the year to ordinary shareholders – –
206 529 206 529 Weighted average number of shares 206 529 206 529
Profit attributable to ordinary shareholders 372 470 258 982
Accumulated equity accounted losses from ongoing operations 11 464 124 593
Net (gain)/loss on the sale of property, plant and equipment (after tax) (561) 1 914
Impairment loss on Non-Current Assets Held for Sale (after tax) – 955
Loss on sale of Non-Current Assets Held for Sale (after tax) 252 –
Headline earnings 383 625 386 444
26.1 Basic earnings per ordinary share (cents)
261 919 368 637 Profit attributable to ordinary shareholders 372 470 258 982
206 529 206 529 Weighted number of shares in issue (’000s) 206 529 206 529
126.8 178.5 Basic earnings per ordinary share (cents) 180.3 125.4
26.2 Headline earnings per ordinary share (cents)
Headline earnings 383 625 386 444
Weighted average number of shares in issue (’000s) 206 529 206 529
Headline earnings per ordinary share (cents) 185.7 187.1
FOR THE YEAR ENDED 30 JUNE 2016
NOTES TO THE ANNUAL FINANCIAL STATEMENTS

Partnering for the Future 107
Operating environment
Managing Director’s report
Value addedstatement
Good corporate governance
Remuneration report
Annual financial statements
COMPANY GROUP
2015 N$’000s
2016 N$’000s
2016 N$’000s
2015 N$’000s
27. DIVIDENDS PAID AND PROPOSED
In respect of the 2016 financial year
– 82 611 – interim (40 cents per share, paid 13 May 2016) 82 611 –
– – – final (40 cents per share, proposed) – –
In respect of the 2015 financial year
76 416 – – interim (37 cents per share, paid 8 May 2015) – 76 416
– 76 416 – final (37 cents per share, proposed) 76 416 –
In respect of the 2014 financial year
– – – interim (34 cents per share, paid 9 May 2014) – –
70 220 – – final (34 cents per share, paid 21 November 2014) – 70 220
146 636 159 027 Dividends to equity holders 159 027 146 636
Dividend paid per ordinary share (net of share purchase trust)
34.0 37.0 Final dividend (cents) 37.0 34.0
37.0 40.0 Interim dividend (cents) 40.0 37.0
71.0 77.0 77.0 71.0
Proposed dividend
76 416 82 612
On 6 September 2016 the Directors declared a final dividend of 40 cents (8 September 2015: 37 cents) per ordinary share. This dividend will be paid on 11 November 2016. 82 612 76 416

Namibia Breweries Limited Integrated Annual Report 2016108
About this report
Chairperson’s statement
NBL profile
Partnering forthe future
A Namibian investment
NBL timeline
COMPANY GROUP
2015 N$’000s
2016 N$’000s
2016 N$’000s
2015 N$’000s
28. NOTES TO THE STATEMENT OF CASH FLOWS
28.1 Cash generated by operations
398 006 503 970 Profit before income tax 508 113 395 074
Adjustments for:
112 089 119 396 Depreciation 119 676 112 817
3 745 4 526 Amortisation 4 526 3 745
2 856 (908) (Gain)/Loss on disposal of property, plant and equipment (825) 2 856
– 370 Loss on sale of Non-Current Assets Held for Sale 370 –
– 4 660 Unrealised (gains)/losses 4 660 –
1 584 (335) Increase/(decrease) in provisions (335) 1 584
124 593 11 464 Impairment of equity-accounted investment – –
– – Accumulated equity accounted losses from joint venture 38 917 124 593
– – Accumulated equity accounted income from joint venture (deferred tax asset write-back) (89 212) –
Accumulated equity accounted losses from associate 61 759 –
15 405 5 431 Impairment loss on subsidiary loans – –
1 425 – Impairment loss on Non-Current Assets Held for Sale – 1 425
2 081 – Accrued interest on DHN loan – 2 081
(21 896) (18 249) Finance income (18 315) (22 000)
8 807 39 406 Finance costs 39 412 8 847
648 695 669 731 Operating profit before working capital changes 668 746 631 022
105 799 (10 811) Working capital changes (14 681) 105 459
(17 797) (41 534) Inventories (41 531) (17 036)
51 689 (46 354) Trade and other receivables (52 105) 48 161
71 907 77 077 Trade and other payables 78 955 74 334
754 494 658 920 Cash generated by operations 654 065 736 481
28.2 Dividends paid
Dividends paid are reconciled to the amounts disclosed in the statement of changes in equity as follows:
(146 636) (159 027) Ordinary dividends per statement of changes in equity (159 027) (146 636)
28.3 Income tax paid
12 426 1 668 Balance at beginning of the year 1 906 12 426
(133 857) (129 396) Current tax charge (129 634) (134 036)
(1 668) (10 036) Balance at end of the year (10 036) (1 906)
(123 099) (137 764) Income tax paid during the year (137 764) (123 516)
FOR THE YEAR ENDED 30 JUNE 2016
NOTES TO THE ANNUAL FINANCIAL STATEMENTS

Partnering for the Future 109
Operating environment
Managing Director’s report
Value addedstatement
Good corporate governance
Remuneration report
Annual financial statements
COMPANY GROUP
2015 N$’000s
2016 N$’000s
2016 N$’000s
2015 N$’000s
29. RELATED PARTIES
The immediate holding company of Namibia Breweries Limited is NBL Investment Holdings (Proprietary) Limited of which the shareholding is held by Ohlthaver & List Finance and Trading Corporation Limited and Heineken International B.V.
The Company’s ultimate holding Company is List Trust Company (Proprietary) Limited.
During the year the Company and the Group, in the ordinary course of business, entered into various sales, purchases and loan transactions with fellow subsidiaries and its holding company.
The following table provides the total amount of transactions, which have been entered into with related parties for the relevant financial year. For information regarding outstanding balances at 30 June 2016 and 2015, refer to notes 6, 7, 8, 9, 11, 15 and 18.
29.1 Holding company and fellow subsidiaries
Current assets (note 11)
– 26 Broll and List Property Management (Namibia) (Proprietary) Limited 26 –
441 309 Namibia Dairies (Proprietary) Limited 309 441
71 – Ohlthaver & List Centre (Proprietary) Limited – 71
170 1 738 O&L Leisure (Proprietary) Limited 1 738 170
25 – W.U.M. Properties Limited t/a Model Pick ’n Pay – 25
– 17 W.U.M. Properties Limited t/a O&L Properties Division 17 –
– 13 Wernhill Park (Proprietary) Limited 13 –
2 1 O&L Energy (Proprietary) Limited 1 2
5 135 3 000 Flycatcher (Proprietary) Limited – –
– 12 Hangana Seafood (Proprietary) Limited 12 –
26 20 Dimension Data (Proprietary) Limited 20 26
5 – Weathermen & Co Advertising (Proprietary) Limited – 5
5 875 5 136 2 136 740
Revenue
Sales during the year
78 86 Broll and List Property Management (Namibia) (Proprietary) Limited 86 78
3 131 Hangana Seafood (Proprietary) Limited 131 3
22 28 Weathermen & Co Advertising (Proprietary) Limited 28 22
3 372 3 258 Namibia Dairies (Proprietary) Limited 3 258 3 372
599 3 071 O&L Leisure (Proprietary) Limited 3 071 599
290 300 Ohlthaver & List Centre (Proprietary) Limited 300 290
– 4 Organic Energy Solutions (Proprietary) Limited 4 –
72 67 Wernhill Park (Proprietary) Limited 67 72
10 5 O&L Energy (Proprietary) Limited 5 10
398 1 191 W.U.M. Properties Limited t/a Model Pick ’n Pay 1 191 398
4 844 8 141 8 141 4 844
Rent received
– – W.U.M. Properties Limited t/a Model Pick ’n Pay 1 172 –
4 844 8 141 Total revenue from Group companies 9 313 4 844

Namibia Breweries Limited Integrated Annual Report 2016110
About this report
Chairperson’s statement
NBL profile
Partnering forthe future
A Namibian investment
NBL timeline
COMPANY GROUP
2015 N$’000s
2016 N$’000s
2016 N$’000s
2015 N$’000s
29. RELATED PARTIES (continued)
29.1 Holding company and fellow subsidiaries (continued)
Current liabilities (note 18)
79 1 437 Dimension Data (Proprietary) Limited 1 437 79
124 170 ICT Holdings (Proprietary) Limited 170 124
1 626 – Namibia Dairies (Proprietary) Limited – 1 626
1 395 2 607 Ohlthaver & List Centre (Proprietary) Limited 2 607 1 395
1 186 1 984 Weathermen & Co Advertising (Proprietary) Limited 1 984 1 186
– 1 036 Organic Energy Solutions (Proprietary) Limited 1 036 –
– 341 O&L South Africa (Proprietary) Limited 341 –
231 638 Kraatz Marine (Proprietary) Limited 638 231
53 – W.U.M. Properties Limited t/a Model Pick ’n Pay – 53
4 694 8 213 8 213 4 694
Purchases during the year
547 224 Eros Air (Proprietary) Limited 224 547
1 300 1 778 ICT Holdings (Proprietary) Limited 1 778 1 300
1 414 741 Namibia Dairies (Proprietary) Limited 741 1 414
246 544 O&L Leisure (Proprietary) Limited 544 246
– 2 437 O&L South Africa (Proprietary) Limited 2 437 –
– 1 017 Organic Energy Solutions (Proprietary) Limited 1 017 –
1 568 4 981 Kraatz Marine (Proprietary) Limited 4 981 1 568
15 755 18 567 Weathermen & Co Advertising (Proprietary) Limited 18 567 15 755
178 618 W.U.M. Properties Limited t/a Model Pick ’n Pay 618 178
21 008 30 907 30 907 21 008
Rent paid
– 2 513 W.U.M. Properties Limited t/a O&L Property Division 2 513 –
21 008 33 420 Total payments to related parties 33 420 21 008
Interest received
249 427 O&L Centre (Proprietary) Limited 427 249
14 863 2 569 DHN Drinks (Proprietary) Limited 2 569 14 863
– 3 106 Heineken South Africa (Proprietary) Limited 3 106 –
15 112 6 102 6 102 15 112
Key management personnel
For Directors emoluments refer to Annexure D.
Interest paid
3 – O&L Centre (Proprietary) Limited – 3
3 – – 3
Management and shared service fees paid
40 320 40 189 O&L Centre (Proprietary) Limited 40 189 40 320
Directors fees
360 415 O&L Centre (Proprietary) Limited 415 360
FOR THE YEAR ENDED 30 JUNE 2016
NOTES TO THE ANNUAL FINANCIAL STATEMENTS
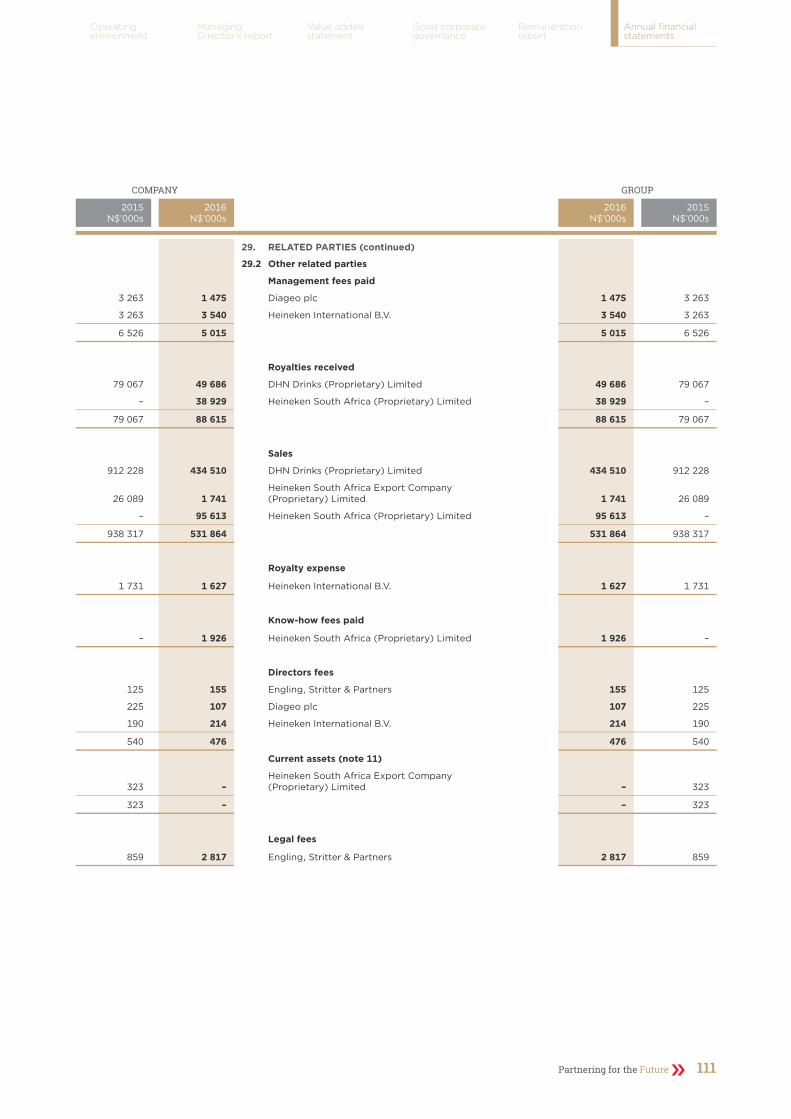
Partnering for the Future 111
Operating environment
Managing Director’s report
Value addedstatement
Good corporate governance
Remuneration report
Annual financial statements
COMPANY GROUP
2015 N$’000s
2016 N$’000s
2016 N$’000s
2015 N$’000s
29. RELATED PARTIES (continued)
29.2 Other related parties
Management fees paid
3 263 1 475 Diageo plc 1 475 3 263
3 263 3 540 Heineken International B.V. 3 540 3 263
6 526 5 015 5 015 6 526
Royalties received
79 067 49 686 DHN Drinks (Proprietary) Limited 49 686 79 067
– 38 929 Heineken South Africa (Proprietary) Limited 38 929 –
79 067 88 615 88 615 79 067
Sales
912 228 434 510 DHN Drinks (Proprietary) Limited 434 510 912 228
26 089 1 741 Heineken South Africa Export Company (Proprietary) Limited 1 741 26 089
– 95 613 Heineken South Africa (Proprietary) Limited 95 613 –
938 317 531 864 531 864 938 317
Royalty expense
1 731 1 627 Heineken International B.V. 1 627 1 731
Know-how fees paid
– 1 926 Heineken South Africa (Proprietary) Limited 1 926 –
Directors fees
125 155 Engling, Stritter & Partners 155 125
225 107 Diageo plc 107 225
190 214 Heineken International B.V. 214 190
540 476 476 540
Current assets (note 11)
323 – Heineken South Africa Export Company (Proprietary) Limited – 323
323 – – 323
Legal fees
859 2 817 Engling, Stritter & Partners 2 817 859
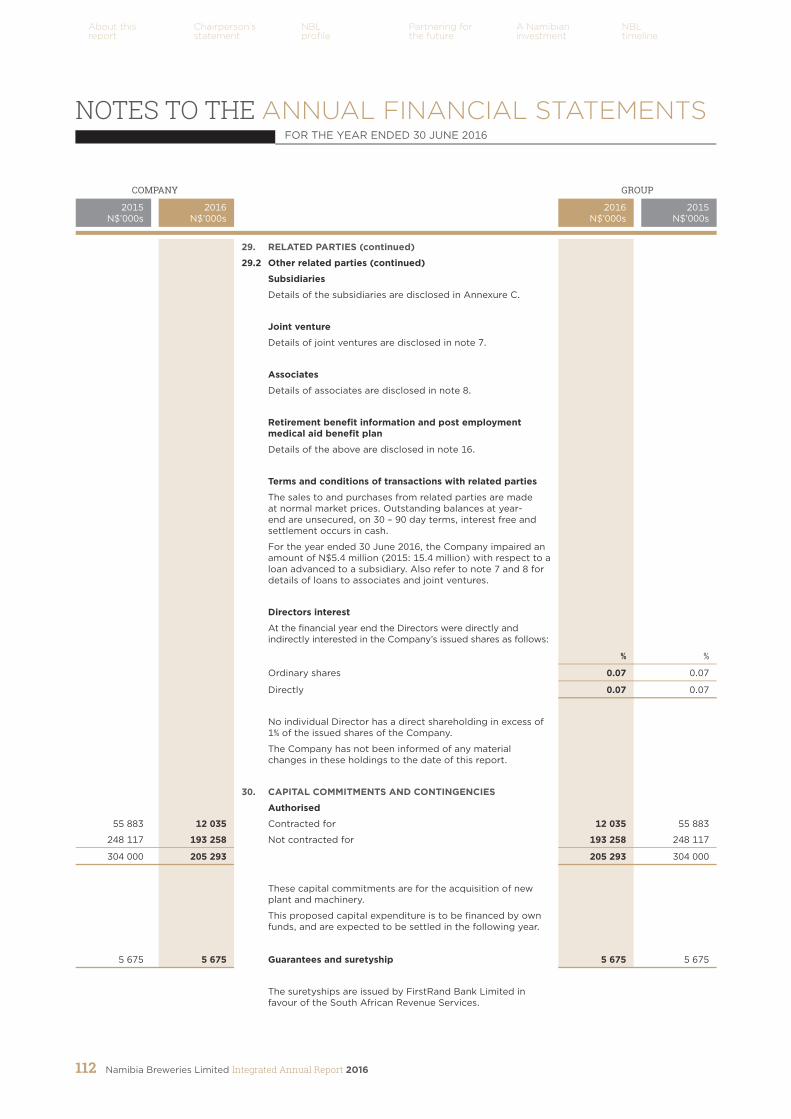
Namibia Breweries Limited Integrated Annual Report 2016112
About this report
Chairperson’s statement
NBL profile
Partnering forthe future
A Namibian investment
NBL timeline
COMPANY GROUP
2015 N$’000s
2016 N$’000s
2016 N$’000s
2015 N$’000s
29. RELATED PARTIES (continued)
29.2 Other related parties (continued)
Subsidiaries
Details of the subsidiaries are disclosed in Annexure C.
Joint venture
Details of joint ventures are disclosed in note 7.
Associates
Details of associates are disclosed in note 8.
Retirement benefit information and post employment medical aid benefit plan
Details of the above are disclosed in note 16.
Terms and conditions of transactions with related parties
The sales to and purchases from related parties are made at normal market prices. Outstanding balances at year-end are unsecured, on 30 – 90 day terms, interest free and settlement occurs in cash.
For the year ended 30 June 2016, the Company impaired an amount of N$5.4 million (2015: 15.4 million) with respect to a loan advanced to a subsidiary. Also refer to note 7 and 8 for details of loans to associates and joint ventures.
Directors interest
At the financial year end the Directors were directly and indirectly interested in the Company’s issued shares as follows:
% %
Ordinary shares 0.07 0.07
Directly 0.07 0.07
No individual Director has a direct shareholding in excess of 1% of the issued shares of the Company.
The Company has not been informed of any material changes in these holdings to the date of this report.
30. CAPITAL COMMITMENTS AND CONTINGENCIES
Authorised
55 883 12 035 Contracted for 12 035 55 883
248 117 193 258 Not contracted for 193 258 248 117
304 000 205 293 205 293 304 000
These capital commitments are for the acquisition of new plant and machinery.
This proposed capital expenditure is to be financed by own funds, and are expected to be settled in the following year.
5 675 5 675 Guarantees and suretyship 5 675 5 675
The suretyships are issued by FirstRand Bank Limited in favour of the South African Revenue Services.
FOR THE YEAR ENDED 30 JUNE 2016
NOTES TO THE ANNUAL FINANCIAL STATEMENTS
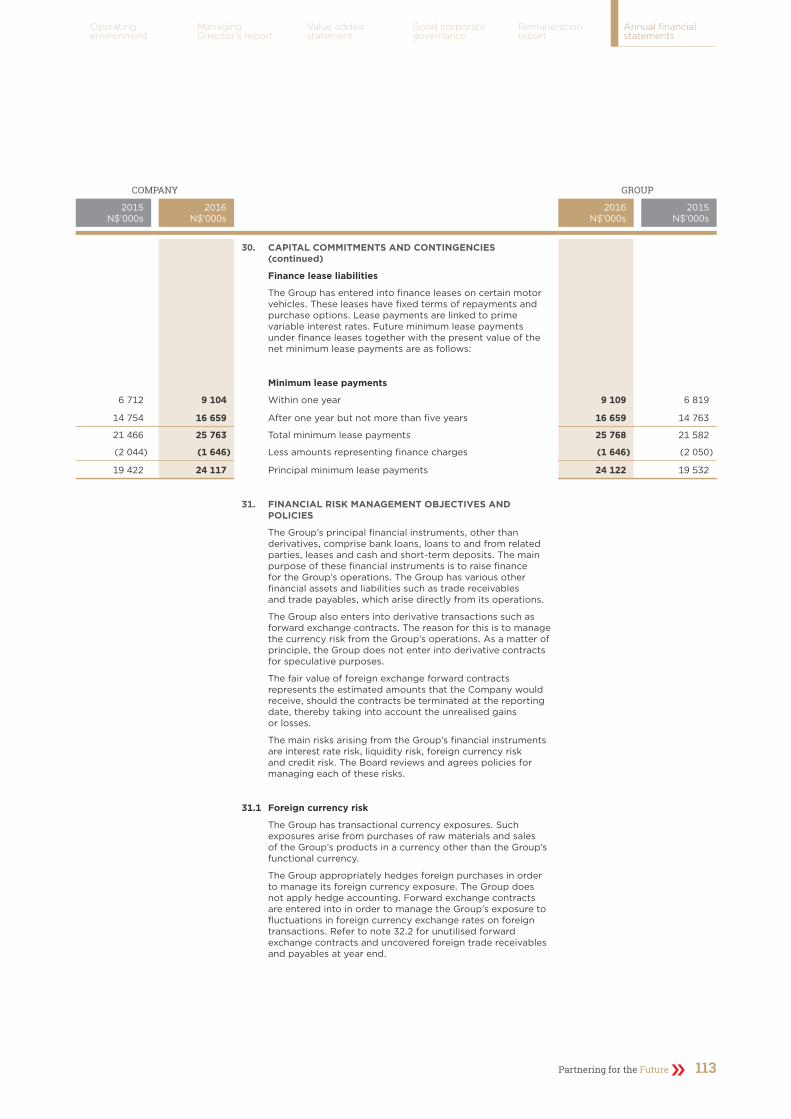
Partnering for the Future 113
Operating environment
Managing Director’s report
Value addedstatement
Good corporate governance
Remuneration report
Annual financial statements
COMPANY GROUP
2015 N$’000s
2016 N$’000s
2016 N$’000s
2015 N$’000s
30. CAPITAL COMMITMENTS AND CONTINGENCIES (continued)
Finance lease liabilities
The Group has entered into finance leases on certain motor vehicles. These leases have fixed terms of repayments and purchase options. Lease payments are linked to prime variable interest rates. Future minimum lease payments under finance leases together with the present value of the net minimum lease payments are as follows:
Minimum lease payments
6 712 9 104 Within one year 9 109 6 819
14 754 16 659 After one year but not more than five years 16 659 14 763
21 466 25 763 Total minimum lease payments 25 768 21 582
(2 044) (1 646) Less amounts representing finance charges (1 646) (2 050)
19 422 24 117 Principal minimum lease payments 24 122 19 532
31. FINANCIAL RISK MANAGEMENT OBJECTIVES AND POLICIES
The Group’s principal financial instruments, other than derivatives, comprise bank loans, loans to and from related parties, leases and cash and short-term deposits. The main purpose of these financial instruments is to raise finance for the Group’s operations. The Group has various other financial assets and liabilities such as trade receivables and trade payables, which arise directly from its operations.
The Group also enters into derivative transactions such as forward exchange contracts. The reason for this is to manage the currency risk from the Group’s operations. As a matter of principle, the Group does not enter into derivative contracts for speculative purposes.
The fair value of foreign exchange forward contracts represents the estimated amounts that the Company would receive, should the contracts be terminated at the reporting date, thereby taking into account the unrealised gains or losses.
The main risks arising from the Group’s financial instruments are interest rate risk, liquidity risk, foreign currency risk and credit risk. The Board reviews and agrees policies for managing each of these risks.
31.1 Foreign currency risk
The Group has transactional currency exposures. Such exposures arise from purchases of raw materials and sales of the Group’s products in a currency other than the Group’s functional currency.
The Group appropriately hedges foreign purchases in order to manage its foreign currency exposure. The Group does not apply hedge accounting. Forward exchange contracts are entered into in order to manage the Group’s exposure to fluctuations in foreign currency exchange rates on foreign transactions. Refer to note 32.2 for unutilised forward exchange contracts and uncovered foreign trade receivables and payables at year end.
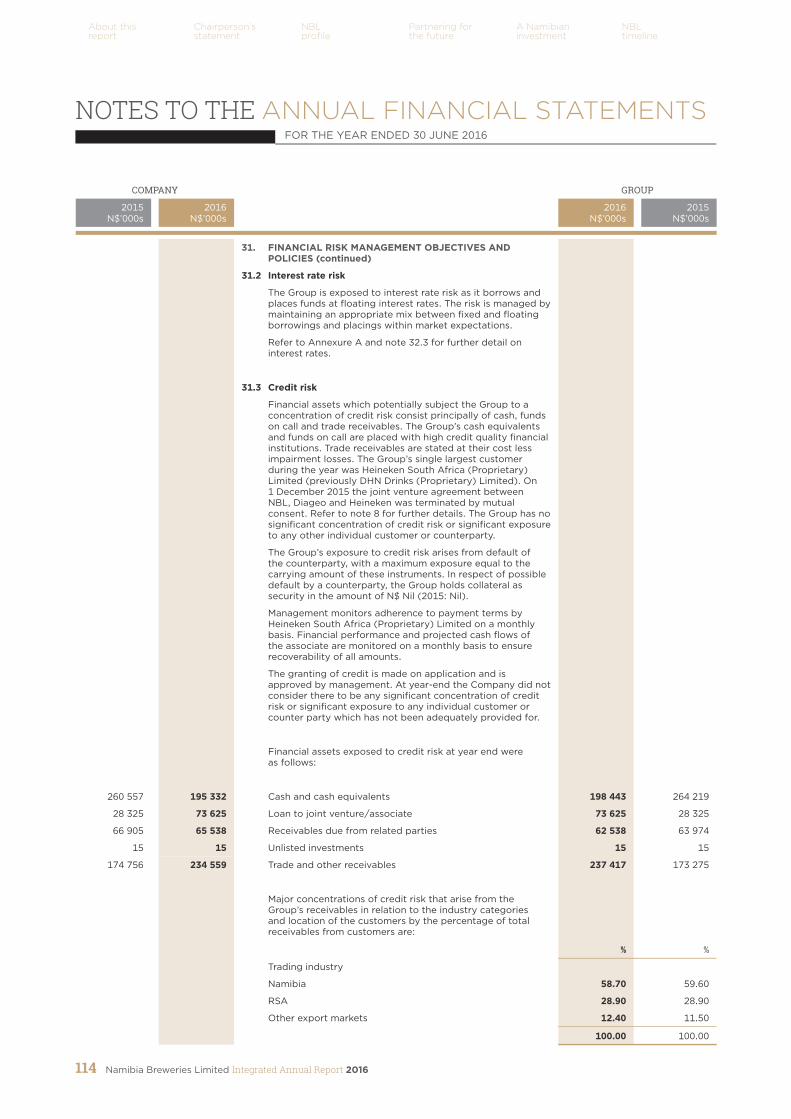
Namibia Breweries Limited Integrated Annual Report 2016114
About this report
Chairperson’s statement
NBL profile
Partnering forthe future
A Namibian investment
NBL timeline
COMPANY GROUP
2015 N$’000s
2016 N$’000s
2016 N$’000s
2015 N$’000s
31. FINANCIAL RISK MANAGEMENT OBJECTIVES AND POLICIES (continued)
31.2 Interest rate risk
The Group is exposed to interest rate risk as it borrows and places funds at floating interest rates. The risk is managed by maintaining an appropriate mix between fixed and floating borrowings and placings within market expectations.
Refer to Annexure A and note 32.3 for further detail on interest rates.
31.3 Credit risk
Financial assets which potentially subject the Group to a concentration of credit risk consist principally of cash, funds on call and trade receivables. The Group’s cash equivalents and funds on call are placed with high credit quality financial institutions. Trade receivables are stated at their cost less impairment losses. The Group’s single largest customer during the year was Heineken South Africa (Proprietary) Limited (previously DHN Drinks (Proprietary) Limited). On 1 December 2015 the joint venture agreement between NBL, Diageo and Heineken was terminated by mutual consent. Refer to note 8 for further details. The Group has no significant concentration of credit risk or significant exposure to any other individual customer or counterparty.
The Group’s exposure to credit risk arises from default of the counterparty, with a maximum exposure equal to the carrying amount of these instruments. In respect of possible default by a counterparty, the Group holds collateral as security in the amount of N$ Nil (2015: Nil).
Management monitors adherence to payment terms by Heineken South Africa (Proprietary) Limited on a monthly basis. Financial performance and projected cash flows of the associate are monitored on a monthly basis to ensure recoverability of all amounts.
The granting of credit is made on application and is approved by management. At year-end the Company did not consider there to be any significant concentration of credit risk or significant exposure to any individual customer or counter party which has not been adequately provided for.
Financial assets exposed to credit risk at year end were as follows:
260 557 195 332 Cash and cash equivalents 198 443 264 219
28 325 73 625 Loan to joint venture/associate 73 625 28 325
66 905 65 538 Receivables due from related parties 62 538 63 974
15 15 Unlisted investments 15 15
174 756 234 559 Trade and other receivables 237 417 173 275
Major concentrations of credit risk that arise from the Group’s receivables in relation to the industry categories and location of the customers by the percentage of total receivables from customers are:
% %
Trading industry
Namibia 58.70 59.60
RSA 28.90 28.90
Other export markets 12.40 11.50
100.00 100.00
FOR THE YEAR ENDED 30 JUNE 2016
NOTES TO THE ANNUAL FINANCIAL STATEMENTS
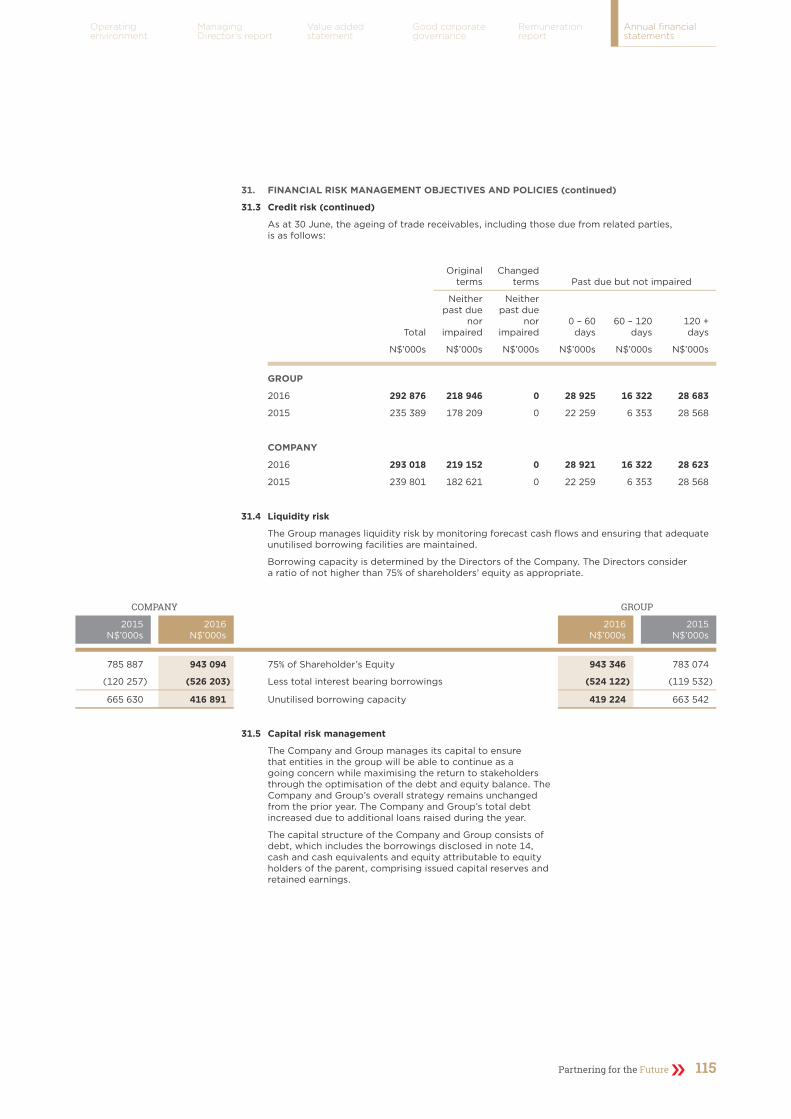
Partnering for the Future 115
Operating environment
Managing Director’s report
Value addedstatement
Good corporate governance
Remuneration report
Annual financial statements
31. FINANCIAL RISK MANAGEMENT OBJECTIVES AND POLICIES (continued)
31.3 Credit risk (continued)
As at 30 June, the ageing of trade receivables, including those due from related parties, is as follows:
Original terms
Changed terms Past due but not impaired
Total
Neither past due
nor impaired
Neither past due
nor impaired
0 – 60 days
60 – 120 days
120 + days
N$’000s N$’000s N$’000s N$’000s N$’000s N$’000s
GROUP
2016 292 876 218 946 0 28 925 16 322 28 683
2015 235 389 178 209 0 22 259 6 353 28 568
COMPANY
2016 293 018 219 152 0 28 921 16 322 28 623
2015 239 801 182 621 0 22 259 6 353 28 568
31.4 Liquidity risk
The Group manages liquidity risk by monitoring forecast cash flows and ensuring that adequate unutilised borrowing facilities are maintained.
Borrowing capacity is determined by the Directors of the Company. The Directors consider a ratio of not higher than 75% of shareholders’ equity as appropriate.
COMPANY GROUP
2015 N$’000s
2016 N$’000s
2016 N$’000s
2015 N$’000s
785 887 943 094 75% of Shareholder’s Equity 943 346 783 074
(120 257) (526 203) Less total interest bearing borrowings (524 122) (119 532)
665 630 416 891 Unutilised borrowing capacity 419 224 663 542
31.5 Capital risk management
The Company and Group manages its capital to ensure that entities in the group will be able to continue as a going concern while maximising the return to stakeholders through the optimisation of the debt and equity balance. The Company and Group’s overall strategy remains unchanged from the prior year. The Company and Group’s total debt increased due to additional loans raised during the year.
The capital structure of the Company and Group consists of debt, which includes the borrowings disclosed in note 14, cash and cash equivalents and equity attributable to equity holders of the parent, comprising issued capital reserves and retained earnings.

Namibia Breweries Limited Integrated Annual Report 2016116
About this report
Chairperson’s statement
NBL profile
Partnering forthe future
A Namibian investment
NBL timeline
COMPANY GROUP
2015 N$’000s
2016 N$’000s
2016 N$’000s
2015 N$’000s
31. FINANCIAL RISK MANAGEMENT OBJECTIVES AND POLICIES (continued)
31.5 Capital risk management (continued)
Gearing ratio
The Company’s and Group’s Risk Committee reviews the capital structure on a semi-annual basis. Consistent with others in the industry, the Group monitors capital on the basis of the gearing ratio. This ratio is calculated as net debt divided by total capital. Net debt is calculated as total borrowings less cash and cash equivalents. Total capital is calculated as ‘equity’ as shown in the consolidated statement of financial position plus net debt.
The gearing ratio at the year end was as follows:
120 257 526 203 Debt (i) 524 122 119 532
(260 557) (195 332) Less: Cash and cash equivalents (198 443) (264 219)
(140 300) 330 871 Net debt 325 679 (144 687)
1 047 849 1 257 459 Equity (ii) 1 257 794 1 044 099
(13%) 26% Net debt to equity ratio 26% (14%)
(i) Debt is defined as long- and short-term borrowings.
(ii) Equity includes all capital and reserves of the Company.
32. FINANCIAL INSTRUMENTS
32.1 Fair values
The fair value of all financial instruments are substantially identical to the carrying amounts reflected in the statement of financial position.
Fair value hierarchy
The table below analyses assets and liabilities carried at fair value. The different levels are defined as follows:
Level 1: Quoted unadjusted prices in active markets for identical assets or liabilities that the Group can access at measurement date.
Level 2: Inputs other than quoted prices included in level 1 that are observable for the asset or liability either directly or indirectly.
Level 3: Unobservable inputs for the asset or liability.
Level 2
Liabilities
Financial liabilities at fair value through profit or loss
300 4 959 Forward foreign exchange liability 4 959 300
Level 3
Non-recurring fair value measurements
Assets held for sale in accordance with IFRS 5
4 500 – Non-current assets held for sale – 4 500
FOR THE YEAR ENDED 30 JUNE 2016
NOTES TO THE ANNUAL FINANCIAL STATEMENTS
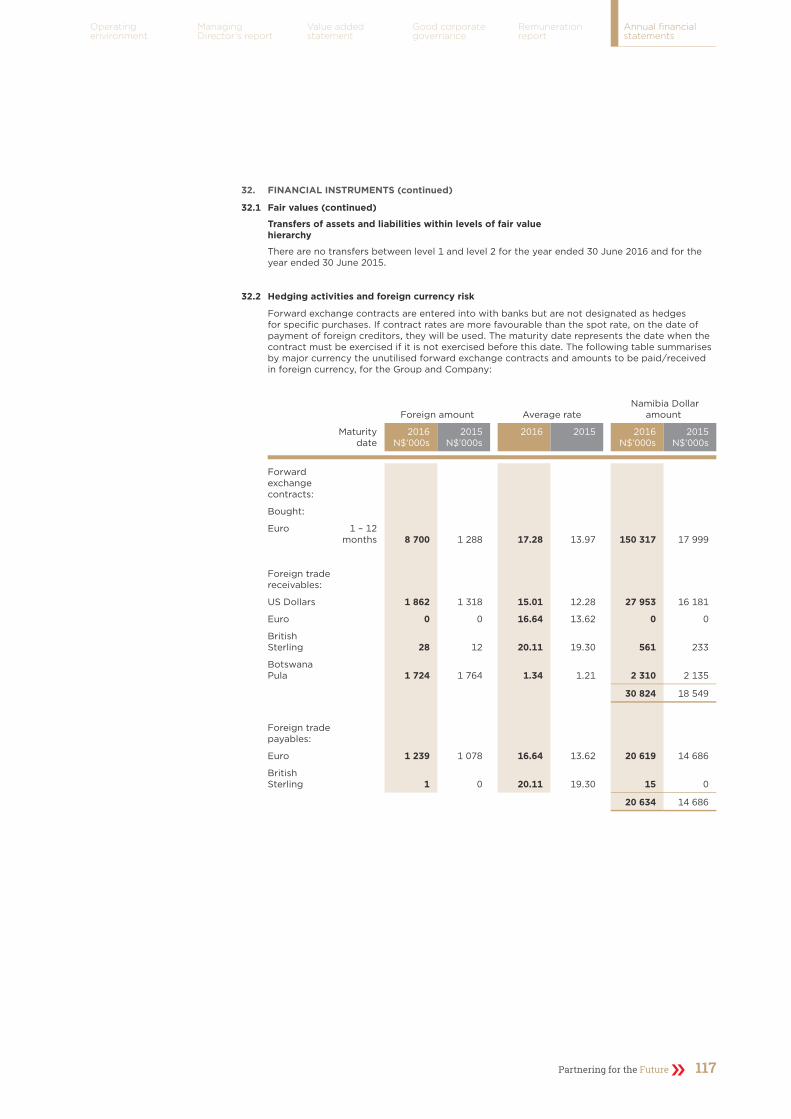
Partnering for the Future 117
Operating environment
Managing Director’s report
Value addedstatement
Good corporate governance
Remuneration report
Annual financial statements
32. FINANCIAL INSTRUMENTS (continued)
32.1 Fair values (continued)
Transfers of assets and liabilities within levels of fair value hierarchy
There are no transfers between level 1 and level 2 for the year ended 30 June 2016 and for the year ended 30 June 2015.
32.2 Hedging activities and foreign currency risk
Forward exchange contracts are entered into with banks but are not designated as hedges for specific purchases. If contract rates are more favourable than the spot rate, on the date of payment of foreign creditors, they will be used. The maturity date represents the date when the contract must be exercised if it is not exercised before this date. The following table summarises by major currency the unutilised forward exchange contracts and amounts to be paid/received in foreign currency, for the Group and Company:
Foreign amount Average rate Namibia Dollar
amount
Maturity date
2016N$’000s
2015N$’000s
2016 2015 2016N$’000s
2015N$’000s
Forward exchange contracts:
Bought:
Euro 1 – 12 months 8 700 1 288 17.28 13.97 150 317 17 999
Foreign trade receivables:
US Dollars 1 862 1 318 15.01 12.28 27 953 16 181
Euro 0 0 16.64 13.62 0 0
British Sterling 28 12 20.11 19.30 561 233
Botswana Pula 1 724 1 764 1.34 1.21 2 310 2 135
30 824 18 549
Foreign trade payables:
Euro 1 239 1 078 16.64 13.62 20 619 14 686
British Sterling 1 0 20.11 19.30 15 0
20 634 14 686
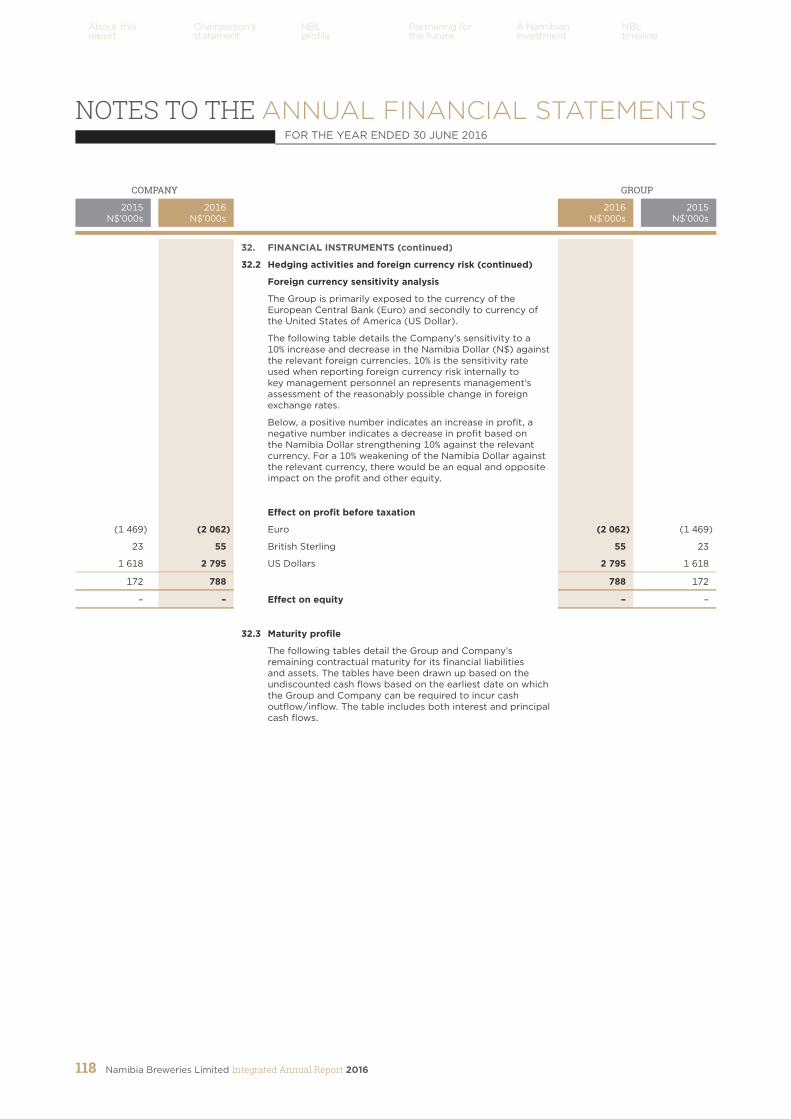
Namibia Breweries Limited Integrated Annual Report 2016118
About this report
Chairperson’s statement
NBL profile
Partnering forthe future
A Namibian investment
NBL timeline
COMPANY GROUP
2015 N$’000s
2016 N$’000s
2016 N$’000s
2015 N$’000s
32. FINANCIAL INSTRUMENTS (continued)
32.2 Hedging activities and foreign currency risk (continued)
Foreign currency sensitivity analysis
The Group is primarily exposed to the currency of the European Central Bank (Euro) and secondly to currency of the United States of America (US Dollar).
The following table details the Company’s sensitivity to a 10% increase and decrease in the Namibia Dollar (N$) against the relevant foreign currencies. 10% is the sensitivity rate used when reporting foreign currency risk internally to key management personnel an represents management’s assessment of the reasonably possible change in foreign exchange rates.
Below, a positive number indicates an increase in profit, a negative number indicates a decrease in profit based on the Namibia Dollar strengthening 10% against the relevant currency. For a 10% weakening of the Namibia Dollar against the relevant currency, there would be an equal and opposite impact on the profit and other equity.
Effect on profit before taxation
(1 469) (2 062) Euro (2 062) (1 469)
23 55 British Sterling 55 23
1 618 2 795 US Dollars 2 795 1 618
172 788 788 172
– – Effect on equity – –
32.3 Maturity profile
The following tables detail the Group and Company’s remaining contractual maturity for its financial liabilities and assets. The tables have been drawn up based on the undiscounted cash flows based on the earliest date on which the Group and Company can be required to incur cash outflow/inflow. The table includes both interest and principal cash flows.
FOR THE YEAR ENDED 30 JUNE 2016
NOTES TO THE ANNUAL FINANCIAL STATEMENTS

Partnering for the Future 119
Operating environment
Managing Director’s report
Value addedstatement
Good corporate governance
Remuneration report
Annual financial statements
32. FINANCIAL INSTRUMENTS (continued)
32.3 Maturity profile (continued)
Effective interest rate
1 year N$’000s
2 years N$’000s
3 – 5 years
N$’000s5 years +N$’000s
TotalN$’000s
2016 – Group
Financial assets
Cash and cash equivalents 4.70% 198 443 – – – 198 443
Loans to associates JIBAR +2.0% 73 625 – 73 625
Trade and other receivables 0.00% 341 581 – – – 341 581
Other investments 0.00% – – – 15 15
613 649 – – 15 613 664
Financial liabilities
Interest-bearing liabilities Ref. Anex. A 92 195 144 686 428 173 – 665 054
Trade and other payables 0.00% 233 541 – – – 233 541
Derivative financial instruments 0.00% 4 959 – – – 4 959
330 695 144 686 428 173 0 903 554
2015 – Group
Financial assets
Cash and cash equivalents 6.75% 264 219 – – – 264 219
Loans to joint venture JIBAR +2.0% 28 325 – – – 28 325
Trade and other receivables 0.00% 278 472 – – – 278 472
Other investments 0.00% – – – 15 15
571 016 0 0 15 571 031
Financial liabilities
Interest-bearing liabilities Ref. Anex. A 105 711 4 702 9 119 – 119 532
Derivative financial instruments 0.00% 300 – – – 300
Trade and other payables 0.00% 195 050 – – – 195 050
301 061 4 702 9 119 0 314 882
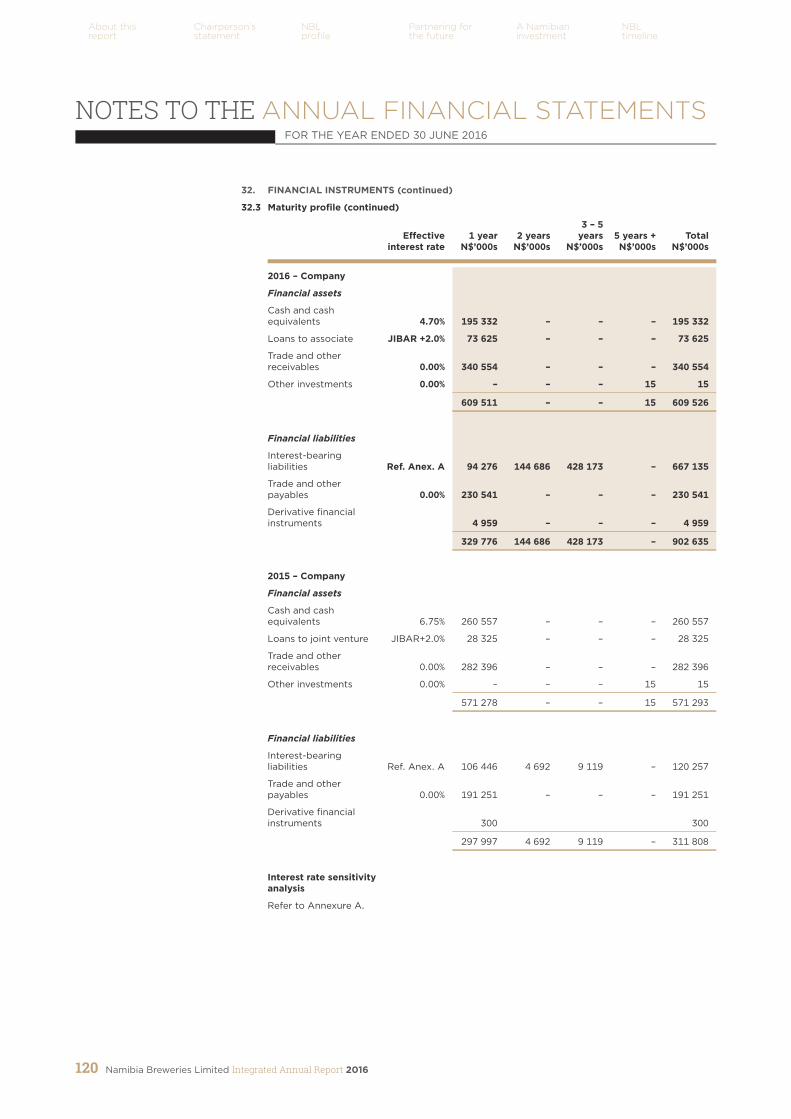
Namibia Breweries Limited Integrated Annual Report 2016120
About this report
Chairperson’s statement
NBL profile
Partnering forthe future
A Namibian investment
NBL timeline
32. FINANCIAL INSTRUMENTS (continued)
32.3 Maturity profile (continued)
Effective interest rate
1 year N$’000s
2 years N$’000s
3 – 5 years
N$’000s5 years +N$’000s
TotalN$’000s
2016 – Company
Financial assets
Cash and cash equivalents 4.70% 195 332 – – – 195 332
Loans to associate JIBAR +2.0% 73 625 – – – 73 625
Trade and other receivables 0.00% 340 554 – – – 340 554
Other investments 0.00% – – – 15 15
609 511 – – 15 609 526
Financial liabilities
Interest-bearing liabilities Ref. Anex. A 94 276 144 686 428 173 – 667 135
Trade and other payables 0.00% 230 541 – – – 230 541
Derivative financial instruments 4 959 – – – 4 959
329 776 144 686 428 173 – 902 635
2015 – Company
Financial assets
Cash and cash equivalents 6.75% 260 557 – – – 260 557
Loans to joint venture JIBAR+2.0% 28 325 – – – 28 325
Trade and other receivables 0.00% 282 396 – – – 282 396
Other investments 0.00% – – – 15 15
571 278 – – 15 571 293
Financial liabilities
Interest-bearing liabilities Ref. Anex. A 106 446 4 692 9 119 – 120 257
Trade and other payables 0.00% 191 251 – – – 191 251
Derivative financial instruments 300 300
297 997 4 692 9 119 – 311 808
Interest rate sensitivity analysis
Refer to Annexure A.
FOR THE YEAR ENDED 30 JUNE 2016
NOTES TO THE ANNUAL FINANCIAL STATEMENTS
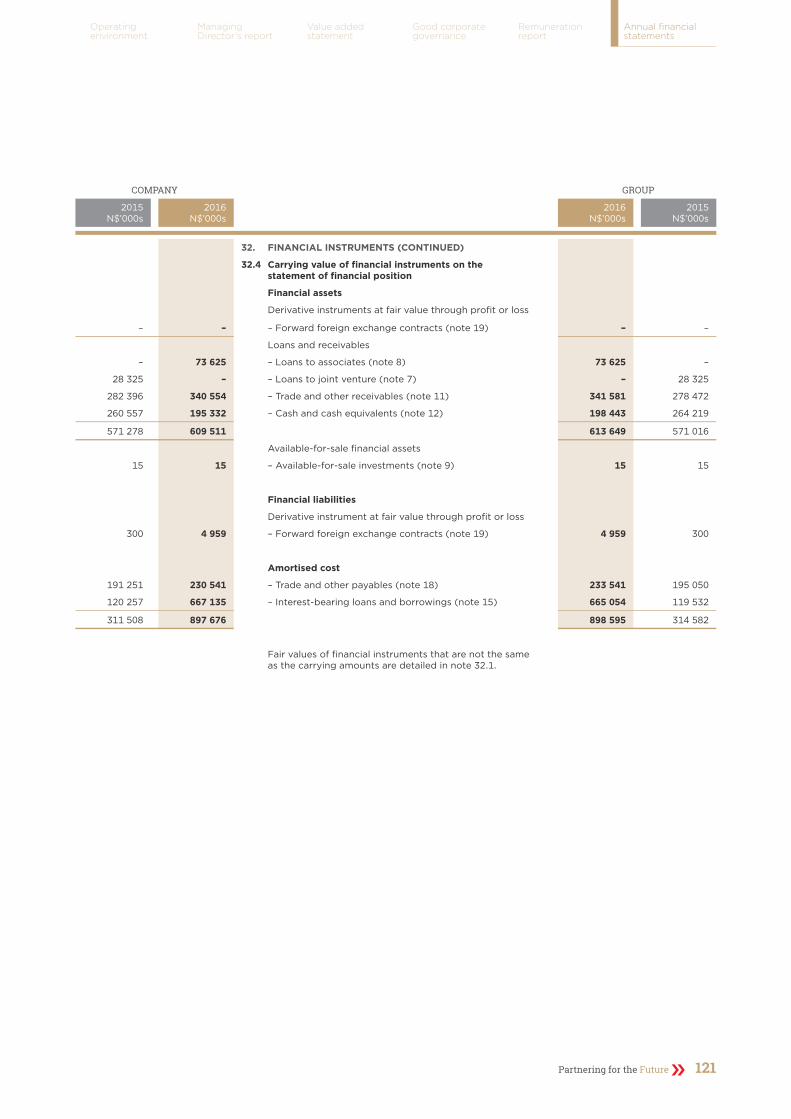
Partnering for the Future 121
Operating environment
Managing Director’s report
Value addedstatement
Good corporate governance
Remuneration report
Annual financial statements
COMPANY GROUP
2015 N$’000s
2016 N$’000s
2016 N$’000s
2015 N$’000s
32. FINANCIAL INSTRUMENTS (CONTINUED)
32.4 Carrying value of financial instruments on the statement of financial position
Financial assets
Derivative instruments at fair value through profit or loss
– – – Forward foreign exchange contracts (note 19) – –
Loans and receivables
– 73 625 – Loans to associates (note 8) 73 625 –
28 325 – – Loans to joint venture (note 7) – 28 325
282 396 340 554 – Trade and other receivables (note 11) 341 581 278 472
260 557 195 332 – Cash and cash equivalents (note 12) 198 443 264 219
571 278 609 511 613 649 571 016
Available-for-sale financial assets
15 15 – Available-for-sale investments (note 9) 15 15
Financial liabilities
Derivative instrument at fair value through profit or loss
300 4 959 – Forward foreign exchange contracts (note 19) 4 959 300
Amortised cost
191 251 230 541 – Trade and other payables (note 18) 233 541 195 050
120 257 667 135 – Interest-bearing loans and borrowings (note 15) 665 054 119 532
311 508 897 676 898 595 314 582
Fair values of financial instruments that are not the same as the carrying amounts are detailed in note 32.1.
Namibia Breweries Limited Integrated Annual Report 2016122
About this report
Chairperson’s statement
NBL profile
Partnering forthe future
A Namibian investment
NBL timeline
33. SEGMENT REPORTING
Segment Information
Segments are reported in a manner consistent with internal reporting provided to the Chief Operating Decision Maker. The Group sells various types of beverages which are Beer, RTDs and Softs, and these reflects the operating segments for the Group. Beer, which meets the quantitative threshold of 10% of sales, EBIT and assets is presented on a standalone basis, as a reportable segment. All corporate assets are disclosed for the Group as a whole and not necessarily for a particular operating segment. In order to ensure that the total of segment results and assets agree to the amounts reported for the Group in terms of IFRS, the operations that do not qualify as separate segments are reported in the “Other” column.
Information about these divisions is presented below:
Beer Other Total
2016 N$’000s
2015 N$’000s
2016 N$’000s
2015 N$’000s
2016 N$’000s
2015 N$’000s
Sales revenue from external customers 2 198 731 2 228 643 184 898 167 734 2 383 629 2 396 377
Sales revenue from Group Companies 42 256 37 800 – – 42 256 37 800
Total sales revenue 2 240 987 2 266 443 184 898 167 734 2 425 885 2 434 177
Depreciation and amortisation 124 202 116 562
Impairment losses 7 446 4 329
Segment profit or loss (operating profit) 501 208 499 742 39 466 6 772 540 674 506 514
Share of losses of equity accounted investments (100 676) (124 593)
Equity income from associate (deferred tax asset write-back)
89 212 –
Finance costs (39 412) (8 847)
Finance income 18 315 22 000
Segmental profit before taxation 501 208 499 742 39 466 6 772 508 113 395 074
Profit before taxation 508 113 395 074
Taxation (135 643) (136 092)
Profit attributable to ordinary shareholders 372 470 258 982
Investments in property, plant and equipment and intangible assets 250 380 123 216
FOR THE YEAR ENDED 30 JUNE 2016
NOTES TO THE ANNUAL FINANCIAL STATEMENTS
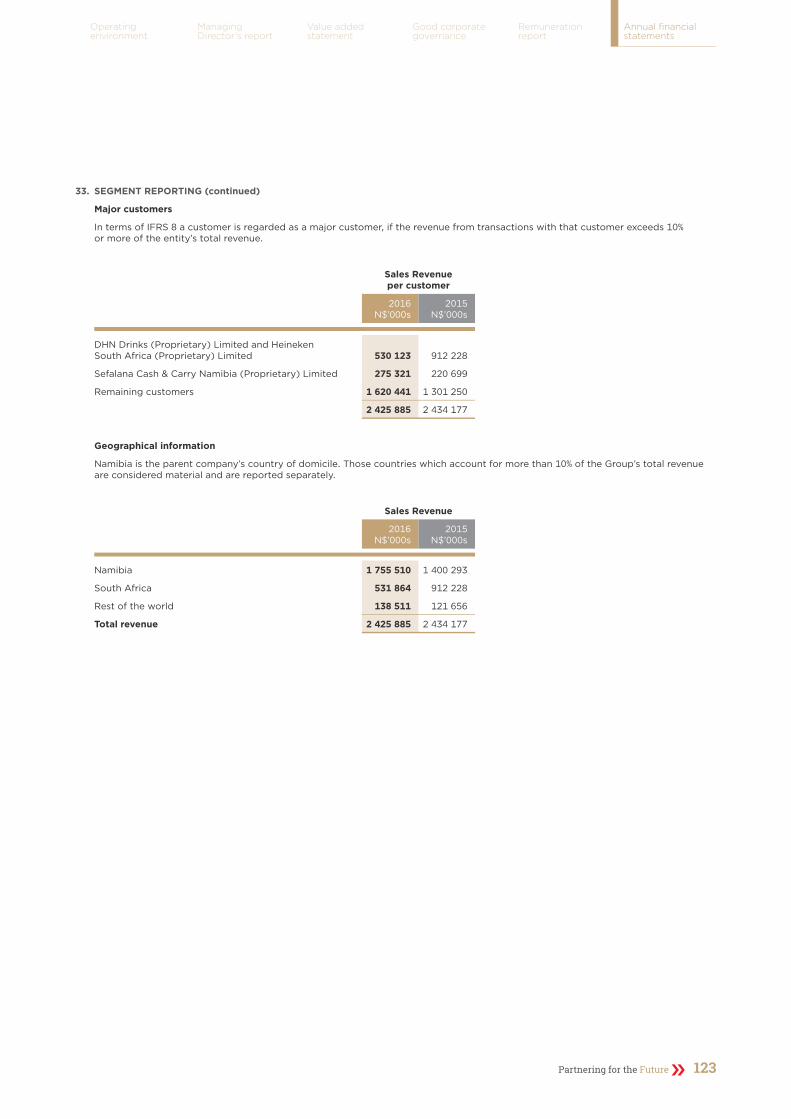
Partnering for the Future 123
Operating environment
Managing Director’s report
Value addedstatement
Good corporate governance
Remuneration report
Annual financial statements
33. SEGMENT REPORTING (continued)
Major customers
In terms of IFRS 8 a customer is regarded as a major customer, if the revenue from transactions with that customer exceeds 10% or more of the entity’s total revenue.
Sales Revenue per customer
2016N$’000s
2015N$’000s
DHN Drinks (Proprietary) Limited and Heineken South Africa (Proprietary) Limited 530 123 912 228
Sefalana Cash & Carry Namibia (Proprietary) Limited 275 321 220 699
Remaining customers 1 620 441 1 301 250
2 425 885 2 434 177
Geographical information
Namibia is the parent company’s country of domicile. Those countries which account for more than 10% of the Group’s total revenue are considered material and are reported separately.
Sales Revenue
2016N$’000s
2015N$’000s
Namibia 1 755 510 1 400 293
South Africa 531 864 912 228
Rest of the world 138 511 121 656
Total revenue 2 425 885 2 434 177

Namibia Breweries Limited Integrated Annual Report 2016124
About this report
Chairperson’s statement
NBL profile
Partnering forthe future
A Namibian investment
NBL timeline
ANNEXURE A SECURED INTEREST-BEARING BORROWINGS
EFFECTIVE INTEREST RATE COMPANY GROUP
2016%
2015%
Maturitydate
2016N$’000s
2015N$’000s
2016N$’000s
2015N$’000s
PREFERENCE SHARE CAPITAL
Authorised
1 000 000 Variable rate redeemable preference shares of N$0.50 each 500 500 500 500
LOANS FROM RELATED PARTIES
Fixed rate instruments
– Northgate Properties (Proprietary) Limited – – 2 086 835 – –
Less: Current portion included in short-term interest-bearing borrowings (2 086) (835) – –
Long-term portion of loans from related parties – – – –
MEDIUM TERM LOAN
Variable rate instruments
– Standard Bank Namibia Limited repayable in 16 equal instalments of N$12 500 000 commencing in December 2016. JIBAR + 2.20% – 31/12/2021 200 000 – 200 000 –
Unsecured loan
– FirstRand Bank Limited – Capex Facility – repayable at the end of the loan term in November 2020. JIBAR + 2.10% – 27/11/2020 100 000 – 100 000 –
Secured by a cession of trade and other receivables and a general national bond
– FirstRand Bank Limited – Acquisition Facility – repayable in four annual instalments of R50 000 000 commencing in November 2017. JIBAR + 1.90% – 27/11/2020 200 000 – 200 000 –
Secured by a cession of trade and other receivables and a general national bond
– FirstRand Bank Limited repayable in three equal quarterly instalments of R26 666 667 commencing in September 2013. JIBAR + 1.85% – 100 000 – 100 000
Less: Current portion included in short-term interest-bearing borrowings (37 500) (100 000) (37 500) (100 000)
Long-term portion of medium term loans 462 500 – 462 500 –

Partnering for the Future 125
Operating environment
Managing Director’s report
Value addedstatement
Good corporate governance
Remuneration report
Annual financial statements
ANNEXURE A SECURED INTEREST-BEARING BORROWINGS (continued)
EFFECTIVE INTEREST RATE COMPANY GROUP
2016%
2015%
Maturitydate
2016N$’000s
2015N$’000s
2016N$’000s
2015N$’000s
Variable rate instruments
– Repayable in monthly instalments of N$611 000 (2015: N$500 000) 10.75 9.75 24 117 19 422 24 122 19 532
Less: Current portion included in short-term interest-bearing borrowings (6 878) (5 611) (6 883) (5 711)
Long-term portion of finance lease liabilities 17 239 13 811 17 239 13 821
TOTAL NON-CURRENT INTEREST-BEARING BORROWINGS 479 739 13 811 479 739 13 821
COMPANY GROUP
2016N$’000s
2015N$’000s
2016N$’000s
2015N$’000s
ANALYSIS OF REPAYMENTS INCLUDING INTEREST
Repayable within:
Year 1 92 190 105 611 92 195 105 711
Year 2 144 686 4 692 144 686 4 702
Year 3 133 038 2 383 133 038 2 383
Year 4 121 679 1 079 121 679 1 079
Repayable thereafter 173 456 5 657 173 456 5 657
665 049 119 422 665 054 119 532
ANALYSIS BY CURRENCY
South African Rands 394 438 100 000 394 438 100 000
Namibia Dollars 270 612 19 422 270 612 19 422
Botswana Pula – – 5 110
INTEREST RATE SENSITIVITY ANALYSIS
The sensitivity analyses have been determined based on the exposure to interest rates for non-derivative instruments at the reporting date. For variable rate liabilities, the analysis is prepared assuming the amount of liability outstanding at the statement of financial position date was outstanding for the whole year. A 100 basis point increase or decrease represents management’s assessment of the reasonably possible change in interest rates.
If interest rates had been 100 basis points higher or lower and all other variables were held constant:
Interest received:
– profit before tax for the year would increase by: 4 281 2 766 4 281 2 766
– other equity reserves would increase by: – – – –
Interest paid
– profit before tax for the year would decrease by: (3 967) (1 986) (3 967) (1 986)
– other equity reserves would decrease by: – – – –

Namibia Breweries Limited Integrated Annual Report 2016126
About this report
Chairperson’s statement
NBL profile
Partnering forthe future
A Namibian investment
NBL timeline
Freeholdland and buildingsN$’000s
Leaseholdland and buildingsN$’000s
Plant andmachinery
N$’000sVehiclesN$’000s
Furniture and
equipmentN$’000s
Returnablecontainers
N$’000s
Assets under
con-structionN$’000s
TotalN$’000s
GROUP
2016
Cost
Balance at beginning of the year 184 470 6 050 994 071 74 261 50 252 193 026 11 042 1 513 172
Additions 2 812 – 46 369 29 624 13 170 85 335 59 776 237 086
Disposals – – (218) (7 267) (554) – – (8 039)
Other movements 1 152 – 6 513 – 58 – (10 393) (2 670)
Balance at end of the year 188 434 6 050 1 046 735 96 618 62 926 278 361 60 425 1 739 549
Accumulated depreciation
Balance at beginning of the year 29 246 4 753 438 150 44 319 35 269 90 301 – 642 038
Depreciation charges 1 079 598 62 464 12 445 5 339 37 751 – 119 676
Accumulated depreciation on disposals – – (219) (5 014) (297) – – (5 530)
Balance at end of the year 30 325 5 351 500 395 51 750 40 311 128 052 756 184
Carrying amount at end of the year 158 109 699 546 340 44 868 22 615 150 309 60 425 983 365
2015
Cost
Balance at beginning of the year 176 931 6 050 960 790 65 069 46 669 206 059 9 227 1 470 795
Additions 7 438 – 40 096 15 194 3 794 39 942 8 601 115 065
Disposals – – (11 700) (6 002) (211) (38 078) (908) (56 899)
Other movements 101 – 4 885 – – – (5 878) (892)
Balance at end of the year 184 470 6 050 994 071 74 261 50 252 207 923 11 042 1 528 069
Accumulated depreciation
Balance at beginning of the year 28 392 3 665 388 602 37 859 30 788 106 557 – 595 863
Depreciation charges 854 1 088 60 334 10 171 4 688 35 682 – 112 817
Accumulated depreciation on disposals – – (10 786) (3 711) (207) (37 040) – (51 744)
Balance at end of the year 29 246 4 753 438 150 44 319 35 269 105 199 – 656 936
Carrying amount at end of the year 155 224 1 297 555 921 29 942 14 983 102 724 11 042 871 133
ANNEXURE B PROPERTY, PLANT AND EQUIPMENT

Partnering for the Future 127
Operating environment
Managing Director’s report
Value addedstatement
Good corporate governance
Remuneration report
Annual financial statements
ANNEXURE B PROPERTY, PLANT AND EQUIPMENT (continued)
Freeholdland and buildingsN$’000s
Leaseholdland and buildingsN$’000s
Plant andmachinery
N$’000sVehiclesN$’000s
Furniture and
equipmentN$’000s
Returnablecontainers
N$’000s
Assets under
con-structionN$’000s
TotalN$’000s
COMPANY
2016
Cost
Balance at beginning of the year 150 362 3 892 993 926 73 992 50 053 193 026 11 042 1 476 293
Additions 2 091 – 46 369 29 640 13 153 85 335 59 776 236 364
Disposals – – (102) (7 167) (480) – – (7 749)
Other movements 1 152 6 513 58 (10 393) (2 670)
Balance at end of the year 153 605 3 892 1 046 706 96 465 62 784 278 361 60 425 1 702 238
Accumulated depreciation
Balance at beginning of the year 29 246 3 138 438 027 44 151 35 167 90 301 – 640 030
Depreciation charges 1 079 443 62 459 12 349 5 315 37 751 – 119 396
Accumulated depreciation on disposals – – (103) (4 898) (240) – – (5 241)
Balance at end of the year 30 325 3 581 500 383 51 602 40 242 128 052 – 754 185
Carrying amount at end of the year 123 280 311 546 323 44 863 22 542 150 309 60 425 948 053
2015
Cost
Balance at beginning of the year – restated 148 087 3 892 960 790 64 809 46 616 206 059 9 227 1 439 480
Additions 2 174 – 40 070 15 178 3 718 39 943 8 601 109 684
Disposals – – (11 819) (5 995) (281) – (908) (19 003)
Breakages and write-offs – – – – – (52 976) – (52 976)
Other movements 101 – 4 885 – – – (5 878) (892)
Balance at end of the year – restated 150 362 3 892 993 926 73 992 50 053 193 026 11 042 1 476 293
Accumulated depreciation
Balance at beginning of the year 28 392 2 656 388 602 37 781 30 782 106 558 – 594 771
Depreciation charges 854 482 60 330 10 080 4 661 35 682 – 112 089
Accumulated depreciation on disposals – – (10 905) (3 710) (276) – – (14 891)
Breakages and write-offs – – – – – (51 939) – (51 939)
Balance at end of the year – restated 29 246 3 138 438 027 44 151 35 167 90 301 – 640 030
Carrying amount at end of the year 121 116 754 555 899 29 841 14 886 102 725 11 042 836 263
GROUP AND COMPANY
The carrying amount of motor vehicles held under finance leases at 30 June 2016 was N$22 481 472 (2015: N$13 734 517). Additions during the year include N$18 369 546 (2015: N$12 900 000) of motor vehicles held under finance leases.

Namibia Breweries Limited Integrated Annual Report 2016128
About this report
Chairperson’s statement
NBL profile
Partnering forthe future
A Namibian investment
NBL timeline
20% 33.3% 0% 20% 33.3% 0%
Auto-mation
processes2016
N$’000s
Externally purchased
software licences
2016N$’000s
Trade-marks2016
N$’000s
Total2016
N$’000s
Auto-mation
processes2015
N$’000s
Externally purchased
software licences
2015N$’000s
Trade-marks2015
N$’000s
Total2015
N$’000s
GROUP
Cost
Balance at beginning of the year 10 971 11 960 9 000 31 931 11 016 9 917 2 000 22 933
Disposals – – – – (45) – – (45)
Additions 6 621 6 673 – 13 294 – 1 151 7 000 8 151
Other movements – – – – – 892 – 892
Balance at end of the year 17 592 18 633 9 000 45 225 10 971 11 960 9 000 31 931
Accumulated amortisation
Balance at beginning of the year 7 700 7 484 – 15 184 5 447 5 992 – 11 439
Amortisation charges 1 948 2 578 – 4 526 2 253 1 492 – 3 745
Balance at end of the year 9 648 10 062 – 19 710 7 700 7 484 – 15 184
Carrying amount at end of the year 7 944 8 571 9 000 25 515 3 271 4 476 9 000 16 747
COMPANY
Cost
Balance at beginning of the year 10 971 11 960 9 000 31 931 11 016 9 917 2 000 22 933
Disposals – – – – (45) – – (45)
Additions 6 621 6 673 – 13 294 – 1 151 7 000 8 151
Other movements – – – – – 892 – 892
Balance at end of the year 17 592 18 633 9 000 45 225 10 971 11 960 9 000 31 931
Accumulated amortisation
Balance at beginning of the year 7 700 7 484 – 15 184 5 447 5 992 – 11 439
Amortisation charges 1 948 2 578 – 4 526 2 253 1 492 – 3 745
Balance at end of the year 9 648 10 062 – 19 710 7 700 7 484 – 15 184
Carrying amount at end of the year 7 944 8 571 9 000 25 515 3 271 4 476 9 000 16 747
Amortisation periods are reviewed at the end of each financial year. If the expected useful life of the asset differ from previous estimates, the amortisation period shall be changed accordingly. The amortisation charge is recognised in the operating expenses in the income statement.
ANNEXURE B INTANGIBLE ASSETS

Partnering for the Future 129
Operating environment
Managing Director’s report
Value addedstatement
Good corporate governance
Remuneration report
Annual financial statements
ANNEXURE C INTEREST IN SUBSIDIARIES
Subsidiary Company
Country of
Incor-poration
IssuedCapital
N$’000s
EffectiveHolding
2016%
2015%
Interest of Holding Company
Shares2016
N$’000s2015
N$’000s
In-debtedness
2016N$’000s
2015N$’000s
BEVERAGES
Hansa Brauerei (Proprietary) Limited Namibia – 100 100 160 160 (160) (160)
Namibia Breweries South Africa (Proprietary) Limited
South Africa – 100 100 – – 57 036 51 605
Flycatcher (Proprietary) Limited Botswana – 100 100 – –
PROPERTY
Northgate Properties (Proprietary) Limited Namibia – 100 100 828 828 (2 086) (835)
Hansa Properties (Proprietary) Limited Namibia – 100 100 – – – –
Northgate Exports (Proprietary) Limited Namibia – 100 100 – – – –
L&T Ventures (Proprietary) Limited Namibia – 100 100 – – – –
Hallie Investments Number Four Hundred and Twenty Eight (Proprietary) Limited Namibia – 100 100 34 830 34 108 – –
Accumulated loan impairment (57 036) (51 605)
35 818 35 096 (2 246) (995)
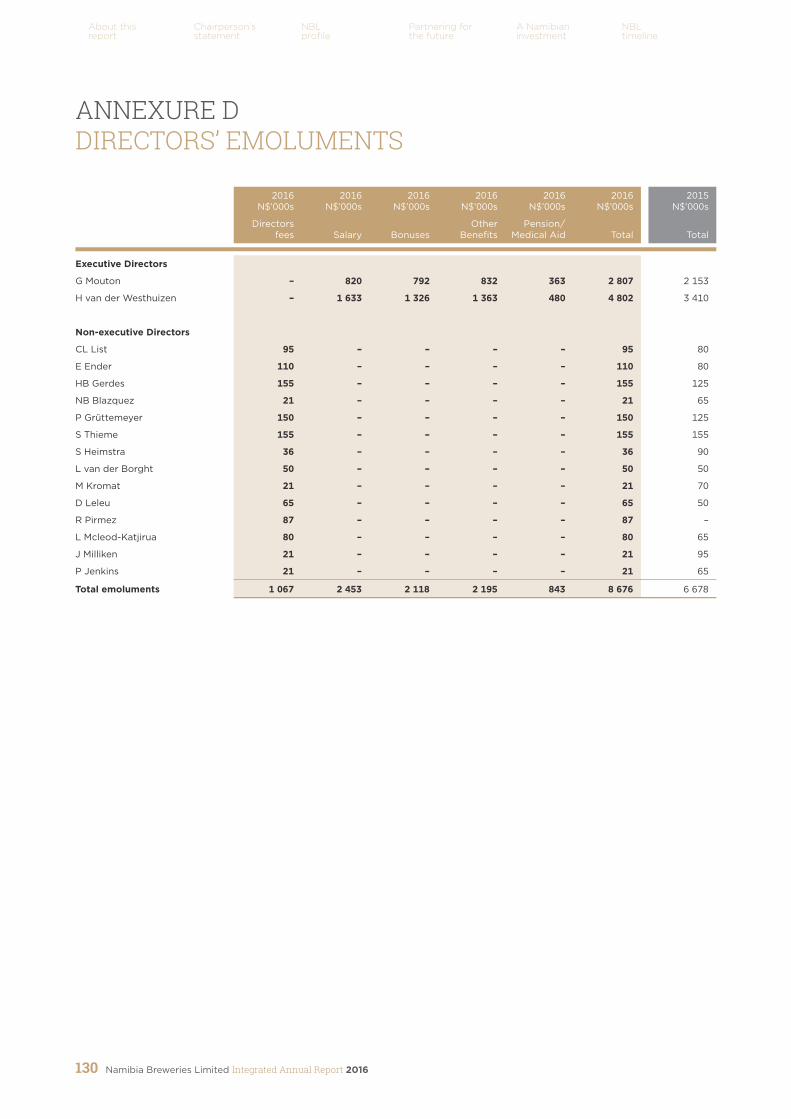
Namibia Breweries Limited Integrated Annual Report 2016130
About this report
Chairperson’s statement
NBL profile
Partnering forthe future
A Namibian investment
NBL timeline
2016 N$’000s
2016 N$’000s
2016 N$’000s
2016 N$’000s
2016 N$’000s
2016 N$’000s
2015 N$’000s
Directorsfees Salary Bonuses
OtherBenefits
Pension/ Medical Aid Total Total
Executive Directors
G Mouton – 820 792 832 363 2 807 2 153
H van der Westhuizen – 1 633 1 326 1 363 480 4 802 3 410
Non-executive Directors
CL List 95 – – – – 95 80
E Ender 110 – – – – 110 80
HB Gerdes 155 – – – – 155 125
NB Blazquez 21 – – – – 21 65
P Grüttemeyer 150 – – – – 150 125
S Thieme 155 – – – – 155 155
S Heimstra 36 – – – – 36 90
L van der Borght 50 – – – – 50 50
M Kromat 21 – – – – 21 70
D Leleu 65 – – – – 65 50
R Pirmez 87 – – – – 87 –
L Mcleod-Katjirua 80 – – – – 80 65
J Milliken 21 – – – – 21 95
P Jenkins 21 – – – – 21 65
Total emoluments 1 067 2 453 2 118 2 195 843 8 676 6 678
ANNEXURE D DIRECTORS’ EMOLUMENTS
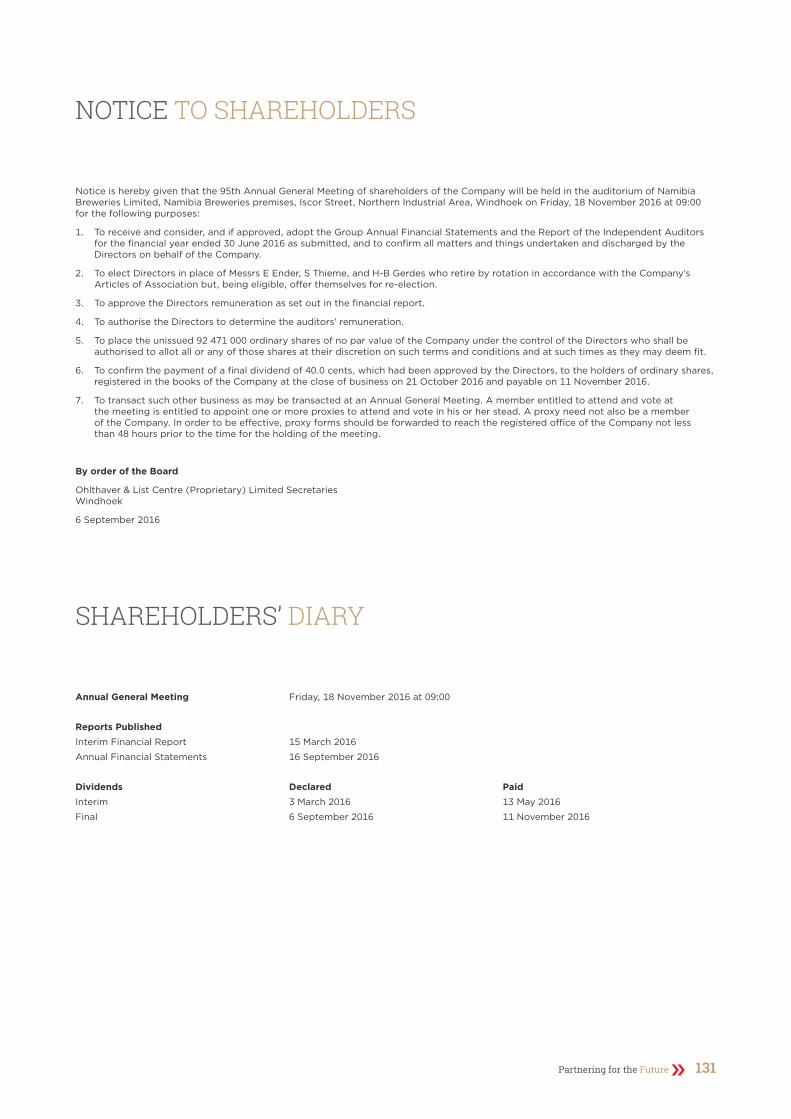
Partnering for the Future 131
NOTICE TO SHAREHOLDERS
Notice is hereby given that the 95th Annual General Meeting of shareholders of the Company will be held in the auditorium of Namibia Breweries Limited, Namibia Breweries premises, Iscor Street, Northern Industrial Area, Windhoek on Friday, 18 November 2016 at 09:00 for the following purposes:
1. To receive and consider, and if approved, adopt the Group Annual Financial Statements and the Report of the Independent Auditors for the financial year ended 30 June 2016 as submitted, and to confirm all matters and things undertaken and discharged by the Directors on behalf of the Company.
2. To elect Directors in place of Messrs E Ender, S Thieme, and H-B Gerdes who retire by rotation in accordance with the Company’s Articles of Association but, being eligible, offer themselves for re-election.
3. To approve the Directors remuneration as set out in the financial report.
4. To authorise the Directors to determine the auditors’ remuneration.
5. To place the unissued 92 471 000 ordinary shares of no par value of the Company under the control of the Directors who shall be authorised to allot all or any of those shares at their discretion on such terms and conditions and at such times as they may deem fit.
6. To confirm the payment of a final dividend of 40.0 cents, which had been approved by the Directors, to the holders of ordinary shares, registered in the books of the Company at the close of business on 21 October 2016 and payable on 11 November 2016.
7. To transact such other business as may be transacted at an Annual General Meeting. A member entitled to attend and vote at the meeting is entitled to appoint one or more proxies to attend and vote in his or her stead. A proxy need not also be a member of the Company. In order to be effective, proxy forms should be forwarded to reach the registered office of the Company not less than 48 hours prior to the time for the holding of the meeting.
By order of the Board
Ohlthaver & List Centre (Proprietary) Limited Secretaries Windhoek
6 September 2016
Annual General Meeting Friday, 18 November 2016 at 09:00
Reports Published Interim Financial Report 15 March 2016
Annual Financial Statements 16 September 2016
Dividends Declared Paid Interim 3 March 2016 13 May 2016
Final 6 September 2016 11 November 2016
SHAREHOLDERS’ DIARY
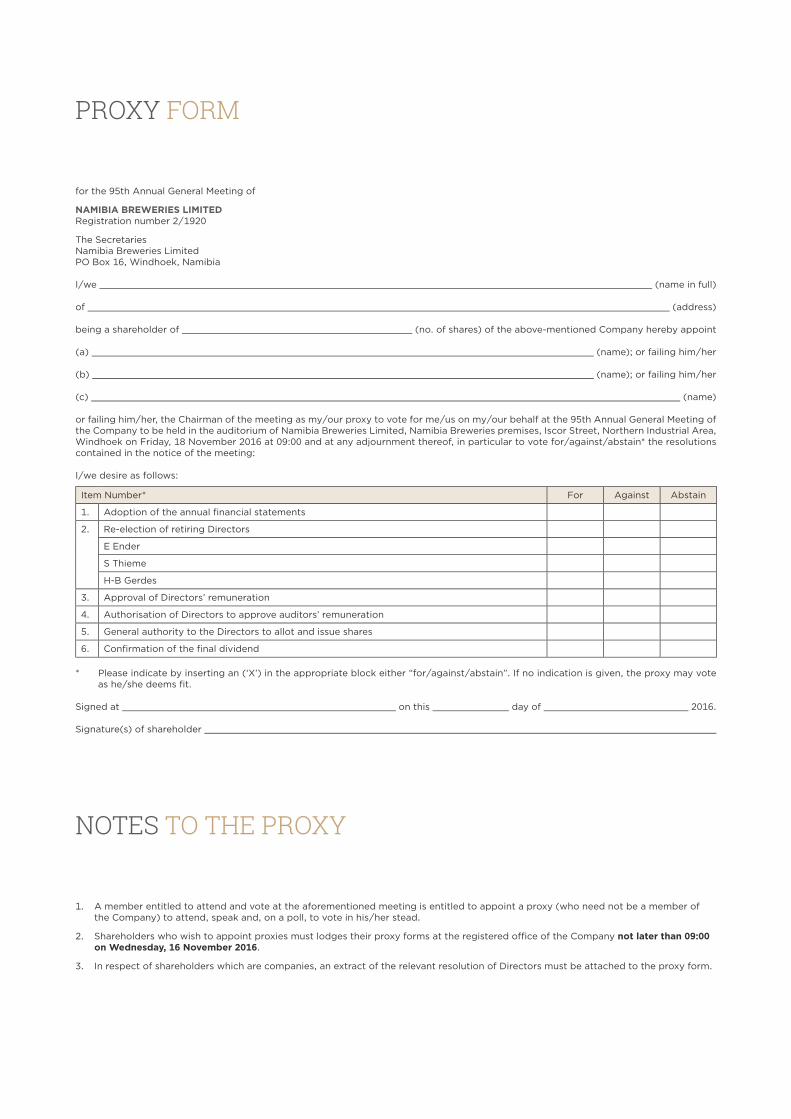
PROXY FORM
for the 95th Annual General Meeting of
NAMIBIA BREWERIES LIMITED Registration number 2/1920
The Secretaries Namibia Breweries Limited PO Box 16, Windhoek, Namibia
I/we (name in full)
of (address)
being a shareholder of (no. of shares) of the above-mentioned Company hereby appoint
(a) (name); or failing him/her
(b) (name); or failing him/her
(c) (name)
or failing him/her, the Chairman of the meeting as my/our proxy to vote for me/us on my/our behalf at the 95th Annual General Meeting of the Company to be held in the auditorium of Namibia Breweries Limited, Namibia Breweries premises, Iscor Street, Northern Industrial Area, Windhoek on Friday, 18 November 2016 at 09:00 and at any adjournment thereof, in particular to vote for/against/abstain* the resolutions contained in the notice of the meeting:
I/we desire as follows:
Item Number* For Against Abstain
1. Adoption of the annual financial statements
2. Re-election of retiring Directors
E Ender
S Thieme
H-B Gerdes
3. Approval of Directors’ remuneration
4. Authorisation of Directors to approve auditors’ remuneration
5. General authority to the Directors to allot and issue shares
6. Confirmation of the final dividend
* Please indicate by inserting an (‘X’) in the appropriate block either “for/against/abstain”. If no indication is given, the proxy may vote as he/she deems fit.
Signed at on this day of 2016.
Signature(s) of shareholder
NOTES TO THE PROXY
1. A member entitled to attend and vote at the aforementioned meeting is entitled to appoint a proxy (who need not be a member of the Company) to attend, speak and, on a poll, to vote in his/her stead.
2. Shareholders who wish to appoint proxies must lodges their proxy forms at the registered office of the Company not later than 09:00 on Wednesday, 16 November 2016.
3. In respect of shareholders which are companies, an extract of the relevant resolution of Directors must be attached to the proxy form.

EXECUTIVE DIRECTORSH van der WesthuizenAppointed to the Board as Managing Director on 2 April 2012.
G MoutonAppointed to the Board on 17 September 2013
NON-EXECUTIVE DIRECTORSS ThiemeAppointed to the Board on 14 March 2002. Elected Chairperson of the Board on 11 July 2002.
E EnderJoined the Group in 1975. Appointed to the Board on 1 February 1983.
H-B GerdesAppointed to the Board on 28 July 2000.
P GrüttemeyerAppointed to the Board on 3 June 2004.
DFM Leleu1 Appointed to the Board on 2 April 2012.
C-L ListAppointed to the Board on 28 June 1979.
L McLeod-Katjirua Appointed to the Board on 2 April 2012.
R Pirmez2
Appointed to the Board on 8 September 2015.
L van der Borght2
Alternate Director to R Pirmez. Appointed to the Board on 2 December 2010.
G HankeAlternate Director to S Thieme. Appointed to the Board on 1 October 2015.
Nationalities1 French2 Belgian
COMMITTEESRemuneration and Nominations CommitteeR Pirmez (Chairperson)P Grüttemeyer B Mukuahima
Audit CommitteeHB Gerdes (Chairperson)P GrüttemeyerE van Lokven
Risk CommitteeH van der Westhuizen (Chairperson)G MoutonSenior Leadership TeamO&L Group Risk Manager
Company Registration Number2/1920 (Incorporated in Namibia)1979/001528/10 (Externally registered in South Africa)
SecretariesOhlthaver & List Centre (Proprietary) LimitedAlexander Forbes House23 – 33 Fidel Castro StreetPO Box 16, Windhoek, Namibia
AuditorsDeloitte & TouchePO Box 47, Windhoek, Namibia
SponsorPSG KonsultPO Box 196, Windhoek, Namibia
Transfer SecretariesTransfer Secretaries (Proprietary) LimitedPO Box 2401, Windhoek, Namibia
Principal BankersFirst National Bank of Namibia LimitedPO Box 285, Windhoek
AttorneysEngling, Stritter & PartnersPO Box 43, Windhoek, Namibia
DIRECTORATE AND ADMINISTRATION
GREYMATTER & FINCH # 10216
www.nambrew.com


