Strategic Applications of Sensory Evaluation for the Wine Industry and Sensory Impact of Alcohol- Friend or Foe? Rosh Pina Winemakers Conference May 29th, 2014 Jane Milligan- Consultant, Winemaking , Consumer Sensory
Transcript
Strategic Applications of Sensory Evaluation for the Wine Industry
and Sensory Impact of Alcohol- Friend or Foe?
Rosh Pina Winemakers Conference May 29th, 2014
Jane Milligan- Consultant, Winemaking , Consumer Sensory
“A person with increasing knowledge and sensory education may derive infinite enjoyment from wine.” Ernest Hemingway
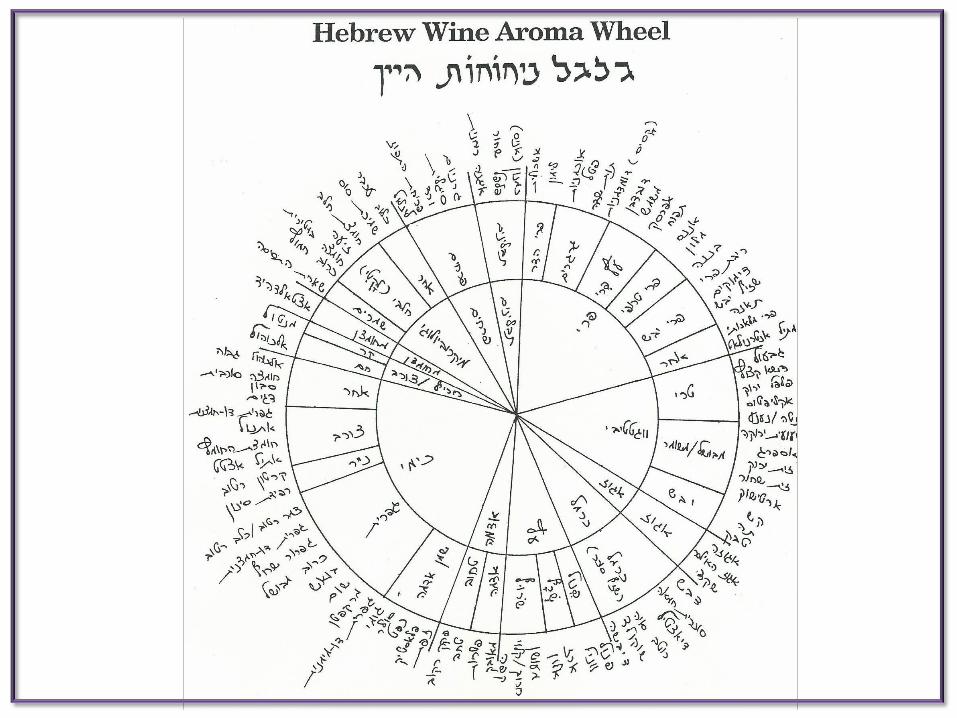
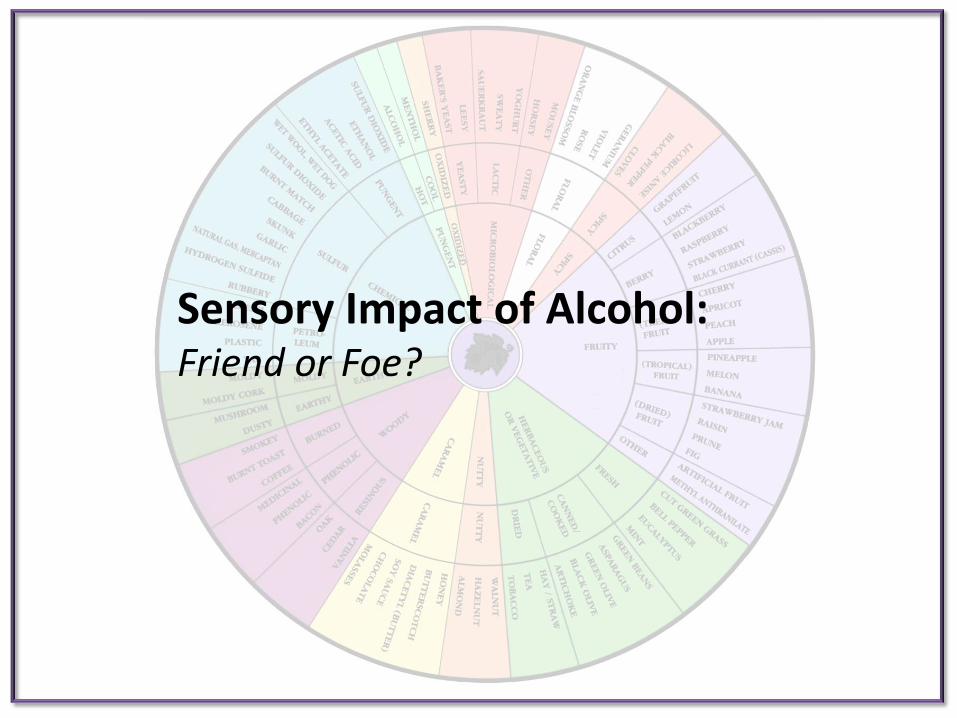
The Wine Aroma Wheel A Language for the World of Wine
1990 Wine Aroma Wheel- Noble, UC Davis
Practical Uses of Sensory Evaluation
What is Sensory Evaluation ?
A science that measures the responses of people to products using sight, sound, smell, taste and texture.
• In other words, it involves more than “taste” • In fact, while the receptors are unique (vision, taste, odor),
their stimulation yields interactive effects.
Think about a feast for the eyes.
• Human sensitivities vary greatly
• One third of us are bitterness blind….
• Even winemakers have “blind spots”
• So, N=1 blending is too risky
• Start by coding, and randomizing samples.
• And don’t give away too much information….
We are not all created equal….
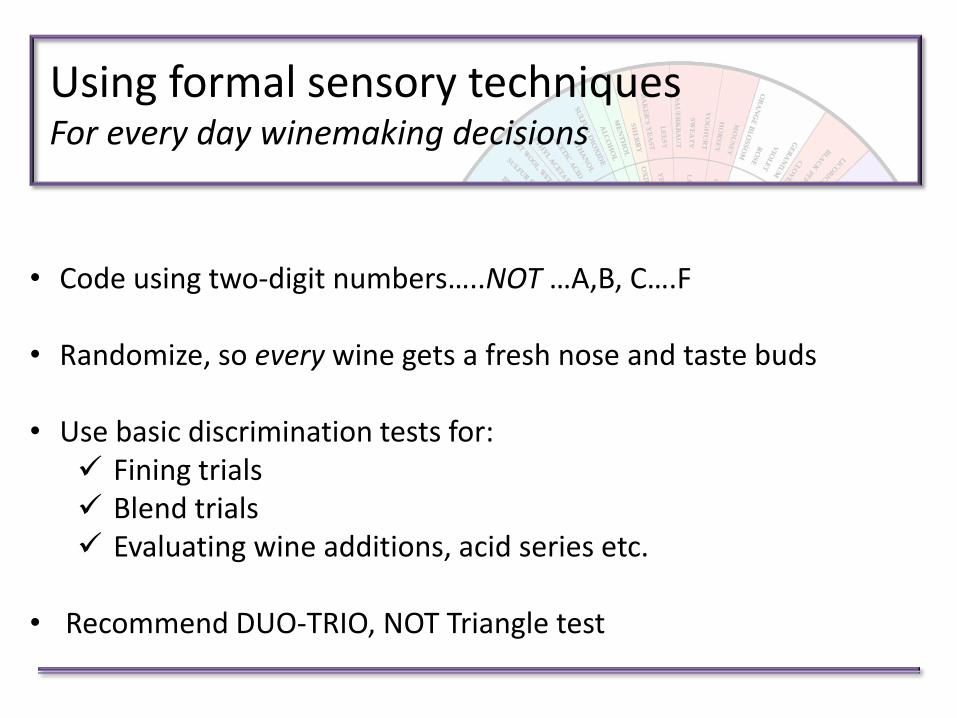
• Code using two-digit numbers…..NOT …A,B, C….F
• Randomize, so every wine gets a fresh nose and taste buds
• Use basic discrimination tests for:
Fining trials Blend trials Evaluating wine additions, acid series etc.
• Recommend DUO-TRIO, NOT Triangle test
Using formal sensory techniques For every day winemaking decisions
• BLIND, always blind! • CODED, not letters • RANDOMIZED, with different order for each person
• RATE liking using numerical or worded scale, do not RANK (1st, 2nd )
• Recommend Overall Liking “Dislike Extremely” (=1) to “Like Extremely” (=9) • Can run stats easily using Excel
• Experts will not agree: Is it “added complexity” or subtle “V.A.”?!
• Expect “house palate” issues….
Evaluating YOU vs THE COMPETITION- Practical tips for in-house tastings
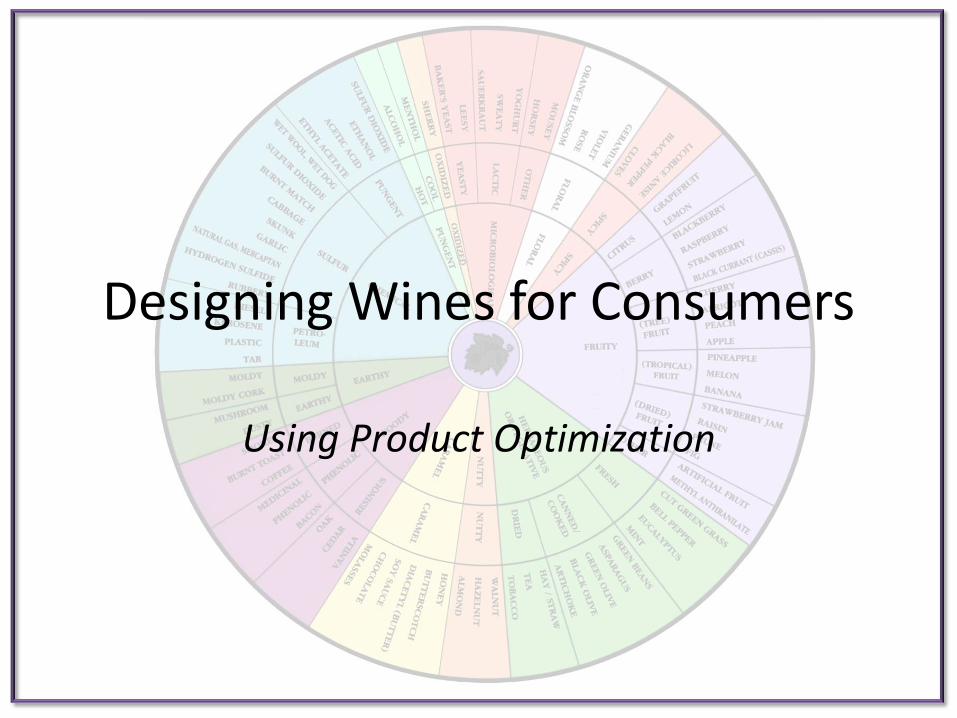
Designing Wines for Consumers
Using Product Optimization
Do winemakers understand what consumers REALLY want?
• Are decisions on wine style/ blending made by a few “expert” individuals?
• Do decisions reflective of wants and needs of consumer? How do they know?
• Are there “blind spots” in the experts’ sensory acuity? Bitterness? Sourness?
• Does wine portfolio cover breadth of “sensory space” desired by consumers?
• How can you determine gaps and overlaps?
Expert Taster vs. Consumer Panel
Traditional Methods Expert tasters- winemaker, might not be user or liker of category being tested. N ≥ 1, typically
Target and opportunity target consumer N=100+
Wine quality evaluations are notoriously “subjective” and vague.
Ranking for preference often used
Blind? Coded? Randomized? NO, not always
Correct experimental design, all samples coded & presentation order balanced
House palate is often a major issue
Acceptance rating on 9-point hedonic scale can be statistically analyzed
NEVER use ranking!
No “house palate”. Nor influence of brand knowledge
So, it’s not surprising that experts and consumers may not agree!
Consumer Panel
So, do consumers agree with wine critics? Correlations between Consumer and Wine Critic Data
80
85
90
95
Win
e C
riti
c R
atin
g
5.50
5.75
6.00
6.25
6.50
6.75
7.00
Ove
rall
Acc
epta
nce
(m
ean
)
Wine Critic Rating
Total Population Degree of Liking
NO relationship between wine critic ratings and consumer liking.
17
Who is your Target Consumer?
An enthusiastic wine connoisseur who maintains a cellar, is wine knowledgeable, and a seeker of luxury goods?
Or….. Is your Target Consumer….
. . . Rather more broadly defined?
Consumers are different; they look different and their attitudes and perceptions are different….
A Few Facts About Consumers
• Consumers do not agree about what they like
• Their sensory skills are not equal.
• Consumers are more sensitive to products they typically use
• Consumers can easily express a preference; however, justifying that preference leads to complications.
By gathering quantitative information on wine attributes and consumer preferences:
1. Using “Quantitative Descriptive Analysis”, QDA, a screened
panel of 10 - 12 people describe and quantify wine attributes
2. Collecting preference data from target consumers (N=100+)
3. Mapping product similarities and differences, and relating these to consumer preferences.
How do we measure consumer perception?
Tragon QDA is a research method that measures product sensory characteristics , using a trained panel .
– 25 to 30 subjects recruited for screening tests
– 12 to 14 selected
– Language development sessions
– Objective, not subjective language
– Typically 25 to 50 sensory terms are used
– Each product rated four times; sufficient for statistical analysis.
Quantitative Descriptive Analysis Methodology
COLOR INTENSITY
OVERALL FLAVOR
OAK WOOD AR.
VANILLA/ BUTTER AR.
PINEAPPLE AR.
TROPICAL FL.
CITRUS/GR.APPLE FL
SOURNESS
DURATION FLAVOR
MOUTH FEEL
COMPANY BEST SELLER RISING STAR
QDA Profiles of Commercial Chardonnays Descriptive Profiles of Commercial Chardonnays
Use PCA to eliminate “like” products from Consumer tests
02 Wine - 6
01 Wine - 4
01 Wine - 1
01 Wine - 2
01 Wine - 3
01 Wine - 5
0 1 Wine - 12
00 Wine - 7
01 Wine - 13
00 Wine - 8
00 Wine - 9
01 Wine 11
01 Wine - 10
02 Wine - 14
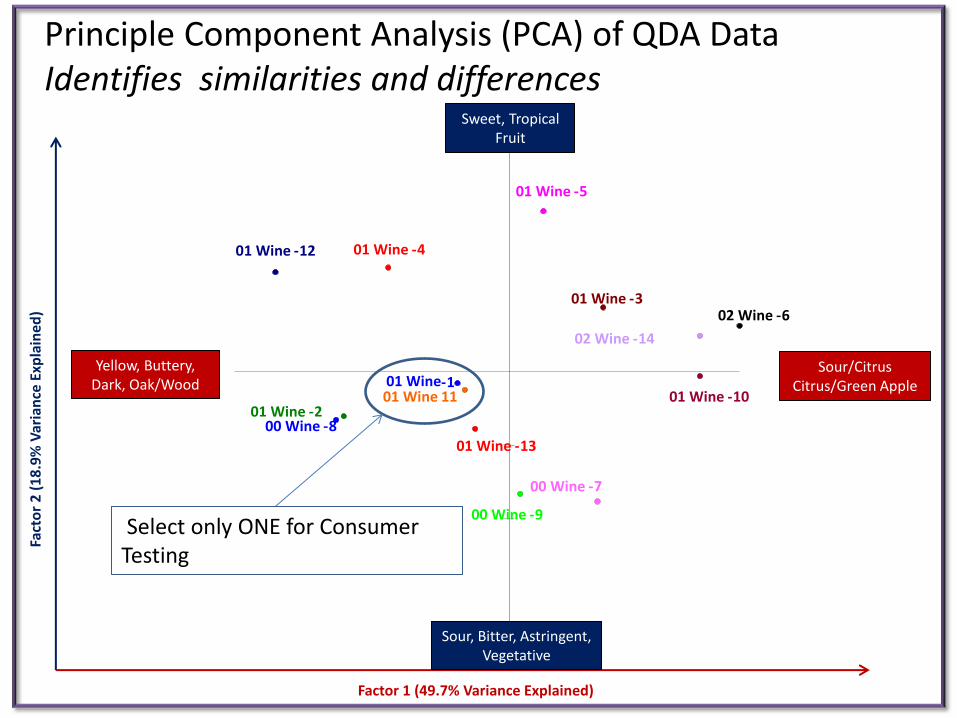
Principle Component Analysis (PCA) of QDA Data Identifies similarities and differences
Factor 1 (49.7% Variance Explained)
Fact
or
2 (
18
.9%
Var
ian
ce E
xpla
ined
)
Sweet, Tropical Fruit
Sour/Citrus Citrus/Green Apple
Sour, Bitter, Astringent, Vegetative
Yellow, Buttery, Dark, Oak/Wood
Select only ONE for Consumer Testing
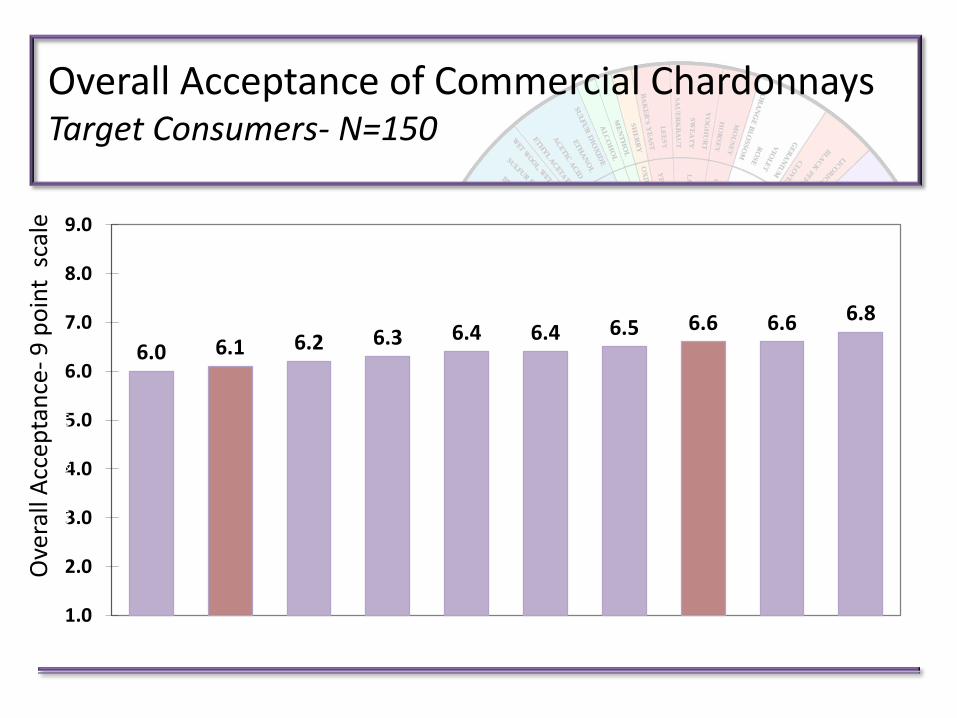
6.0 6.1 6.2 6.3 6.4 6.4 6.5 6.6 6.6 6.8
1.0
2.0
3.0
4.0
5.0
6.0
7.0
8.0
9.0
Ove
rall A
cc
ep
tan
ce
(m
ea
n)
Ove
rall
Acc
epta
nce
- 9
po
int
sca
le
Overall Acceptance of Commercial Chardonnays Target Consumers- N=150
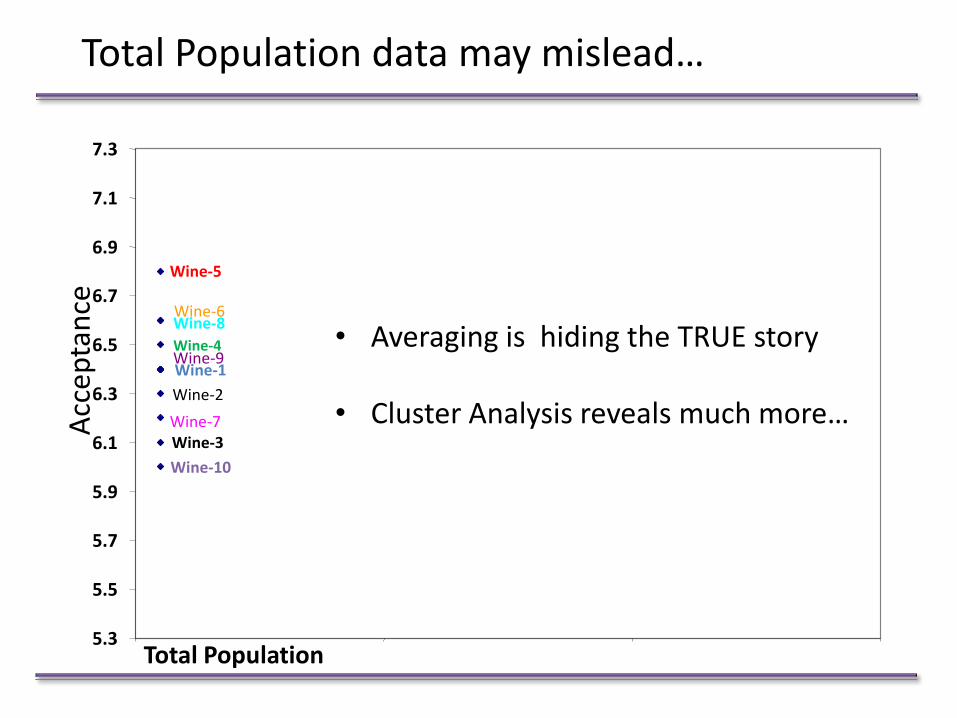
Total Population data may mislead…
00 Wine-9 (g)
00 Wine-7 (defg)
Wine-7
Wine-10
01 Wine-11 (abc) Wine-8
01 Wine-13 (ab)
01 Wine-7 (bcde)
Wine-9
Wine-5
Wine-3
Wine-2)
Wine-1
Wine-4
Wine-6
5.3
5.5
5.7
5.9
6.1
6.3
6.5
6.7
6.9
7.1
7.3
Ove
rall A
cce
pta
nce
(M
ean
)
Total Population
• Averaging is hiding the TRUE story
• Cluster Analysis reveals much more…
Cluster Analysis reveals strong likes and dislikes….
00 Wine-9 (g)
00 Wine-7 (defg)
Wine-7
Wine-10
Wine-8
Wine-9
Wine-5
Wine-3
Wine-2
Wine-1
Wine-4
Wine-6 Wine-7
Wine-10
01 Wine-11 (abc) Wine-8
01 Wine-13 (ab)
01 Wine-7 (bcde)
Wine-9
Wine-5
Wine-3
Wine-2)
Wine-1
Wine-4
Wine-6
5.3
5.5
5.7
5.9
6.1
6.3
6.5
6.7
6.9
7.1
7.3
Ove
rall A
cce
pta
nce
(M
ean
)
Total Population Preference Segment 1
Two almost opposite Preference Segments exist…
Wine-7
Wine-10
00 Wine-9 (g)
Wine-8
00 Wine-7 (defg)
Wine-9
Wine-5
Wine-3
Wine-2
Wine-1
Wine-4
Wine-6
Wine-7
Wine-10
Wine-8
Wine-9
Wine-5
Wine-3
Wine-2
Wine-1
Wine-4
Wine-6 Wine-7
Wine-10
01 Wine-11 (abc) Wine-8
01 Wine-13 (ab)
01 Wine-7 (bcde)
Wine-9
Wine-5
Wine-3
Wine-2)
Wine-1
Wine-4
Wine-6
5.3
5.5
5.7
5.9
6.1
6.3
6.5
6.7
6.9
7.1
7.3
Ove
rall A
cce
pta
nce
(M
ean
)
Total Population Preference Segment 1 Preference Segment 2
Preference Segment 2 -Important Attributes
CITRUS/ GR. APPLE FLAVOR (+)
MOUTH FEEL(-)
VANILLA AROMA(-)
OAK AT (-)
BUTTER FLAVOR(-)
YELLOW/GOLD TINT(-)
TROPICAL/ MELON FLAVOR(-)
CITRUS AROMA (+)
Target Low Target HighScale: 0 - 40
The True Power of Descriptive Analysis- Discovering the “Whys” of Liking
Preference Segment 2 -Important Attributes
CITRUS/ GR. APPLE FLAVOR (+)
MOUTH FEEL(-)
VANILLA AROMA(-)
OAK AT (-)
BUTTER FLAVOR(-)
YELLOW/GOLD TINT(-)
TROPICAL MELON FLAVOR(-)
CITRUS AROMA (+)
Target Low Target High Wine-7 Wine-4Scale: 0 - 40
Descriptive Analysis shows why Wine 4 is so far from target.
Descriptive Analysis- Blending Wines to Maximise Consumer Appeal
Smart use of Sensory has benefits- Even for smaller wineries… • Scientific, reproducible evaluations at every stage of winemaking
• Smart decisions during blending, no more N=1 opinions
• Style guidance for winemakers, useful additional tool
• Directly targeting the competition
• Creating new innovative styles
• Generates high likelihood of REPEAT PURCHASE
• Yes, this MOVES CASES!
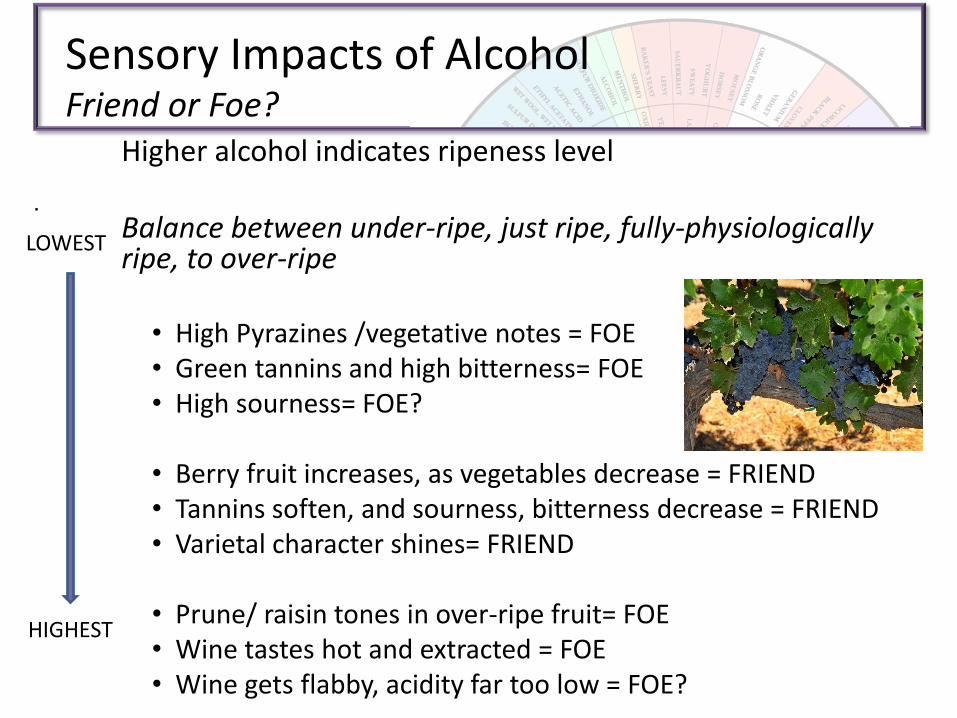
Sensory Impact of Alcohol: Friend or Foe?
Higher ripeness leads to higher alcohol. Sensory effects of ripeness in REDS: • Pyrazines / vegetative notes diminish after
veraision • Ripe berry fruit increases, moving to prune/
raisin tones in over-ripe fruit. • Sourness, bitterness decrease • Wines with ZERO Residual Sugar may appear
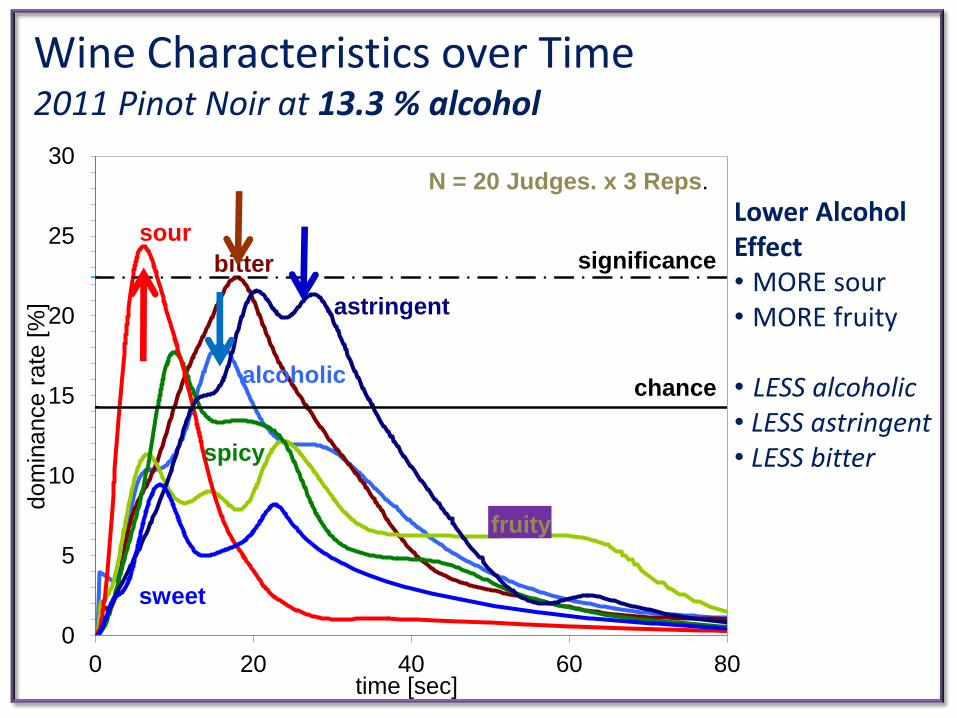
“sweet” SO research on alcohol concentration ALONE can be very enlightening…
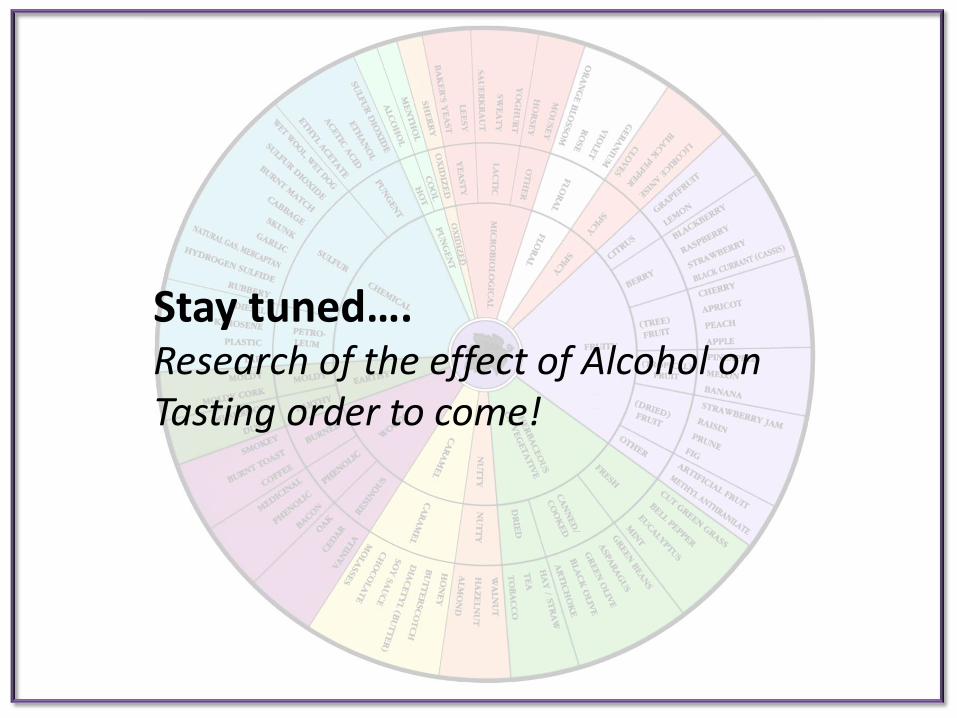
Sensory Impacts of Alcohol What’s really being investigated?