28
Strategic Audit Implementation of environmental management systems in Victorian Government 2014-15
Strategic Audit Implementation of environmental management systems in Victorian Government 2014-15

Published by the Commissioner
for Environmental Sustainability,
Melbourne, Victoria, January 2016
© The State of Victoria, Commissioner
for Environmental Sustainability.
This publication is copyright. No part may be
reproduced by any process except in accordance
with the provisions of the Copyright Act 1968.
Printed on recycled paper.
Authorised by the Victorian Commissioner
for Environmental Sustainability, Level 36,
2 Lonsdale Street, Melbourne, Victoria 3000
For further information email the Office of the
Commissioner for Environmental Sustainability
at [email protected] or visit
http://www.ces.vic.gov.au
Disclaimer:
This report may be of assistance to you and
every effort has been made to ensure that the
information provided is correct. It is based
largely on data and information provided
by the Victorian Government. The Commissioner
for Environmental Sustainability does not
guarantee that the report is without flaw
of any kind or is wholly appropriate for your
particular purposes and therefore disclaims
all liability for any error, loss or other
consequence which may arise from you r
elying on any information in this publication.

Contents
Abbreviations .............................................................................................................. 4
Foreword ..................................................................................................................... 5
Environmental Performance Overview ....................................................................... 8
Background ............................................................................................................... 11
Results ....................................................................................................................... 12
Greenhouse gas emissions ................................................................................... 12
Energy use ........................................................................................................... 14
Transport ............................................................................................................. 16
Waste .................................................................................................................. 20
Paper use ............................................................................................................. 22
Water use ............................................................................................................ 23
Discussion .................................................................................................................. 24
4
Abbreviations
DELWP Department of Environment, Land, Water and Planning
DTF Department of Treasury and Finance (Victoria)
SV Sustainability Victoria
EPA Environment Protection Authority (Victoria)
GRI Global Reporting Initiative
FRD Financial Reporting Direction
EMS Environmental Management System
CES Commissioner for Environmental Sustainability
DEDJTR Department of Economic Development, Jobs, Transport and Resources
FTE Full Time Equivalent
DJR Department of Justice and Regulation (Victoria)
VGPB Victorian Government Purchasing Board

5
Foreword
I am pleased to present the 2016 Strategic Audit Report on the Implementation of Environmental
Management Systems in mandated Victorian Government agencies. This report, for the financial year
2014-15, is based on the aggregate of annually reported information provided by Victorian Government
departments, Sustainability Victoria (SV) and the Environment Protection Authority, Victoria (EPA).
This is the second strategic audit since my appointment as Commissioner for Environmental
Sustainability in 2014.
Last year, I took the opportunity in the report to reflect on the way in which Victorian Government agencies
transparently report on the impact government has on the environment in delivering services to the
community. As I noted, the reporting framework – Financial Reporting Direction 24 C (FRD 24C) – fulfils the
purpose of applying a minimum criteria for government to report on its office-based environmental impacts.
However, there continues to be a need for a broader discussion and consideration of new ways of reporting,
consistent with international frameworks, if we are to fully understand the environmental impacts of
government, demonstrate leadership and drive new and better ways of doing business.
The primary consideration should be what we are measuring and therefore reporting on, and how meaningful it is in driving practical action to improve.
There remains an opportunity to revisit and advance the adoption of the Global Reporting Initiative
framework (GRI). Its strength for government as with the private sector, lies in the ability it provides to
understand the materiality of actions by considering a broader set of criteria, expanding the information
base and giving us a much clearer picture of our environmental impacts, and a better line of sight on
whether our personal choices and business decisions, are moving us in a more sustainable direction.
More meaningful measurement would help us see more clearly and with deeper meaning the trends in our
environmental performance. It would also help counter the impacts of machinery-of-government changes
on the data we receive using the existing method. This outcome can be achieved by considering data that
is more focused on our impact on the environment and therefore, less affected by changes in our use of
government office space.
Following the election of a new Victorian Government in late 2014, there were significant machinery-of-
government changes necessary to deliver the new government’s policy agenda.
6
The corollary of these changes for this report has been its impact on trend data at the agency level.
The FRD 24C reporting framework however allows us to aggregate agency data, albeit with limitations,
to see a whole-of-government picture. This year we have seen some positive trends, particularly in
decreased waste to landfill, decreased water and paper use, along with less air and car travel.
In compiling this Strategic Audit Report, and during consultations throughout the year, I saw a wealth of
enthusiasm and commitment by Victorian Public Sector Environmental Management System coordinators.
They are champions and drivers of sustainable action within their agencies who are ready to enthusiastically
embrace a shift in the way we measure and report on our environmental performance in an effort to
continue to drive and deliver practical action.
As part of the preparation for this Strategic Audit Report we liaised with the Victorian Department of
Treasury and Finance (DTF) to determine the status of a new draft Financial Reporting Direction, FRD 24D,
which reflects the objectives and methods of GRI. To progress the adoption of FRD 24D is not a matter for
DTF. It is a decision for government as a whole and worthy of thoughtful consideration in 2016. The process
of transition to FRD 24D, if it were to be supported, would benefit from a phased implementation plan with
oversight by an executive nominated by the Victorian Secretaries Board to champion the implementation.
There remains an opportunity to revisit and advance the adoption of the Global Reporting Initiative framework (GRI). Its strength for government as with the private sector, lies in the ability it provides to understand the materiality of actions by considering a broader set of criteria, expanding the information base and giving us a much clearer picture of our environmental impacts, and a better line of sight on whether our personal choices and business decisions, are moving us in a more sustainable direction.
As also flagged in last year’s report, procurement policy is a significant opportunity for government to effect
change in its own operations and across the broader community. Our procurement practices and choices
at the whole of Victorian Government level continue to be mechanisms to deliver better environmental
outcomes when the opportunity arises.
It was pleasing to see the role of procurement reflected in the Victorian Government’s Energy Efficiency and
Productivity Statement, released during 2015. I welcome the government’s commitment to use its own
energy purchasing power to drive investment in renewables. The use of renewable energy certificates by
government also demonstrates a model of procurement that can have a positive material impact on the
environment. Adoption of such procurement models that improve government’s own environmental
performance and also create a market demand, can help turn the ideology of sustainability into decisions
by government that deliver tangible, triple bottom line benefits for community.

7
These types of policy initiatives are likely to increasingly prevail over the next decade and beyond as
governments develop more sophisticated procurement policies to act on climate change whilst supporting
jobs and economic prosperity. It exemplifies the type of practical action that could be reported in a more
comprehensive and insightful way by phasing in a more contemporary reporting framework such as the GRI.
Finally, this report once again presents the opportunity to include a discussion piece related to a
contemporary issue. Continuing the theme of procurement driving improved environmental performance
at whole-of-government level, a brief overview of the opportunities that may be presented through changes
to vehicle choice and given effect through an update of the Victorian Government vehicle fleet procurement
policy is included in this report.
With the imminent closure of the vehicle manufacturing industry in Victoria and Australia it is timely
to reconsider existing fleet policy which currently favours manufacturers with an Australian presence.
For consideration by government is the opportunity to make fuel efficiency and advanced environmental
performance in our vehicle fleet procurement a consideration in a new policy paradigm – more reflective
of the changes in our manufacturing profile in Victoria.
This discussion piece also notes that a policy change could impact market activity by, overtime, making
more fuel efficient vehicles more readily available to the community at lower prices through the sale of
ex-government vehicles.
The supply chain power of the automotive sector to drive change in environmental performance more
broadly and support the development of advanced motor vehicle component manufacturers is well
established. This is an innovative and forward thinking sector that is well placed to provide solutions that
can help deliver better environmental outcomes for Victorians.
It is a privilege to be the Commissioner for Environmental Sustainability in Victoria and to contribute to
discussion on the positive role government can play in creating a more sustainable future, and along with
this, help keep our community informed of how reporting on the environment is not an end in itself,
but a means to drive practical action.
Dr Gillian Sparkes
Commissioner for Environmental Sustainability
January 2016

8
Environmental Performance Overview
The Victorian Government’s Financial Reporting Direction (FRD) 24C sets minimum reporting requirements
for office-based activities with environmental impacts including:
greenhouse gas emissions – those associated with building energy use, vehicle fleet use, air travel
and waste production (any offsets purchased are also reported)
energy use – stationary energy: building consumption such as electricity (including green power),
natural gas, LPG, heating oil, diesel and solid fuel
transportation – vehicle fleet energy use and air travel
waste production – which includes waste to landfill, waste sent for recycling and composted waste
paper use – paper used for printing and photocopying
water consumption – including domestic water use, rainwater and reused water
procurement – a discussion of whether and how procurement activities are environmentally
responsible.
FRD 24C requires nominated departments and agencies to measure and report both relative resource
use (efficiency or intensity indicators such as energy consumption per floor area or per number of full time
equivalent employees, or greenhouse gas emissions per kilometres travelled), as well as total resource
use or ‘absolute’ consumption such as total energy use or total greenhouse gas emissions.
Highlights from the 2014-15 data and the six-year data trends
All indicators improved on the benchmark year 2009-10.
The most significant percentage improvements over six years from 2009-10 are in the reduction
of total waste, kilometres of air travel and paper consumption.
The greatest improvements since 2013-14 are reductions in total waste, vehicle energy (there are
less kilometres travelled), paper use and air travel.
Greenhouse gas emissions show good performance in vehicle and air travel emissions which
was offset by a rise in reported office energy use of 6 % from 2013-14.

9
Performance at a glance
Table 1 Performance at a glance
Indicator % change 2009-10 to 2014-15
% change 2013-14 to 2014-15
Greenhouse gas emissions -3 0
Total energy use -3 0
Total waste produced -46 -19
Total office based water use* -9 +8
Vehicle energy -12 -12
Total air travel -38 -5
Total paper use -28 -6
*increase attributed to the inclusion of additional facilities not previously reported

10
Summary of results:
Office-based greenhouse gas emissions reduced by 3 % since 2009-10 with 2013-14’s trend for
decreases in air travel and vehicle use emissions continuing. This positive trend was countered
by a 13 % increase in office building emissions since 2009-10 arising from a reduction in the
purchase of GreenPower and an increase in reported energy use over the past 12 months (+6 %).
GreenPower energy purchases have fallen to 0.3 % of electricity used in 2014-15, reducing from
27 % in 2010-11.
Vehicle kilometres travelled reduced by 11 % on 2013-14 and 12 % on 2009-10. This reduction
in kilometres drove a proportionate reduction in overall energy consumption. CO2 emissions
per 100 km travelled reduced by 2 % on 2013-14. The improvement is largely linked to the
fleet size reduction.
Total waste produced between 2009-10 and 2014-15 decreased by 46 %, a further improvement
on the 34 % figure reported for the previous period.
Absolute quantity of waste generated is now close to half that of 2009-10 and the quantity of waste
generated per FTE has reduced to 72 % of the 2009-10 figure. The overall recycling rate has made
a minor improvement on 2009-10 but remained static when compared to 2013-14.
Total paper consumption continued to decrease, down 6 % on 2013-14 and 28 % on 2009-10. In
2009-10, 14.3 reams of paper were used per FTE. In 2014-15 this had dropped by 17 % to 11.8 %.
Water consumption is down by 9 % on 2009-10, however this represents an increase from 2013-14
of 8 %. The number of litres consumed per FTE was up by 16 % on 2009-10 and virtually unchanged
from 2013-14.

11
Background
Since 2003, Victorian Government departments,1 the Environment Protection Authority (EPA) Victoria and
Sustainability Victoria (SV) - referred to collectively as “mandated departments and agencies” - have been
required to implement environmental management systems (EMS). This requirement was introduced with
an office-based focus, modelled on the ISO 14001 standard2 and enabled by Financial Reporting Direction
24C (FRD 24C).3 The Commissioner for Environmental Sustainability Act 20034 (CES Act) s.18 requires that
not later than 31 January each year, the Commissioner for Environmental Sustainability (the Commissioner)
must report to the Minister for Environment, Climate Change and Water on “the implementation of
environmental management systems by Agencies and public authorities”. Agencies and other public
authorities are, as set out in s.18 (2) a of the CES Act, determined by the Government of Victoria.
This Strategic Audit Report presents environmental performance and analysis for the 2014-15 period, as
provided to the Commissioner, in general accordance with FRD 24C.5 and consistent with s.18 of the CES Act.
Following the Victorian state election in November 2014 and the appointment of a new government,
a number of machinery-of-government changes were made to the Victorian Public Sector commencing
1 January 2015.
These are in addition to a number of significant changes to the make-up of entities since the introduction
of the CES Act in 2003 and the introduction of FRD 24C in 2007.
The net effect of these strategic and functional changes, introduced to meet the policy objectives of
successive governments, makes it difficult to consistently track data for any given entity. In response,
this report, as with previous Strategic Audit Reports, focuses on data totalled from across the mandated
departments and agencies as provided to the Commissioner.
In the Strategic Audit Report6 tabled in 2015, the Commissioner highlighted changes in international trends
in environmental reporting since the adoption of FRD 24C noting the GRI is now the most commonly
referenced sustainability framework with 78 % of reporting companies worldwide referencing the GRI
guidelines. The Commissioner continues to advocate for the use of the GRI framework by government,
noting work already done to advance this by updating FRD 24C to FRD 24D.
1 Applies to all entities as defined in part (a) of the definition of “department” under section 3 of the
Financial Management Act 1994 (FMA) and to the environmental agencies (EPA and SV) referred to in FRD 24C as “entities”. Other public sector entities are encouraged to adopt the requirements of this FRD to their annual reports. 2 ISO 14001 is the recognised international voluntary standard that sets generic requirements for the preparation
of an EMS. It requires an organisation to prepare an EMS that identifies and controls the environmental impact of its services and products, continually improves its environmental performance and implements a systematic approach to setting, achieving and monitoring progress towards meeting environmental objectives and targets. 3 Victorian Department of Treasury and Finance, FRD 24C Reporting of Office-based Environmental Data by
Government Entities, Melbourne, 2008. Available at: http://www.dtf.vic.gov.au/Publications/Government-Financial- Management-publications/Financial-reporting-policy/Financial-reporting-directions-and-guidance 4 Parliament of Victoria, Commissioner for Environmental Sustainability Act 2003, Melbourne, 2003.
Available at: https://www.ces.vic.gov.au/sites/default/files/publication-documents/CES%20Act%202003.pdf 5 Includes Department of Education and Training; Department of Environment, Land, Water and Planning,
Department of Health and Human Services; Department of Justice and Regulation; Department of Premier and Cabinet; Department of Economic Development, Jobs, Transport and Resources; Department of Treasury and Finance; Environment Protection Authority Victoria and Sustainability Victoria. 6 Commissioner for Environmental Sustainability Victoria, Strategic Audit: Implementation of environmental management systems
in Victorian Government 2013-14, Melbourne, 2015. Available at: https://www.ces.vic.gov.au/sites/default/files/publication-documents/Strategic%20Audit%20Report%202013-2014.pdf

12
Results
Greenhouse gas emissions
The total reported greenhouse gas emissions from Victorian Government mandated departments and
agencies remains below the 2009-10 results by 3 % with total emissions remaining virtually unchanged
in the last 12-month period (-0.07% change).7
Energy use is the largest source of greenhouse gas emissions by the mandated departments and agencies
accounting for 74 % of emissions in 2014-15. Vehicle use and air travel accounted for 21 % and 5 % of total
emissions representing a reduction on the 2013-14 results of 24 % and 6 %, respectively. Office-based
waste accounted for less than 1 % of total emissions.
Figure 1 Annual emission contribution by type
Office building emissions resulting from consumed gas and electricity increased by 13 % over the reporting
period 2009-10 to 2014-15. This increase includes a rise in reported energy use above the 2013-14 figure of
6 % and a further reduction in the amount of electricity purchased as GreenPower to 0.3 % (down from 24 %
in 2009-10). The 6 % increase is partially attributed to data from several sites being included in the DEDJTR
report for the first time. The inclusion of additional sites therefore impacts on the interpretation of the
trend data (Figure 1.).
7 Note: As in previous years and in some cases, mandated departments and agencies revised the
2013-14 data presented in the 2014-15 annual reports in line with final billing cycle data. This Strategic Audit Report reflects the latest data consistent with these annual reports.
Office building energy 73.6%
Vehicle use 21.0%
Air travel 5.0%
Office waste to landfill 0.4%
Annual emissions Contribution by type 2014-15
% tonnes CO2-e

13
Table 2: Greenhouse gas emissions from Victorian Government mandated departments and agencies 2009-10 to 2014-15
Emission source
A
Annual emissions (tonnes CO2-e) Percentage change
%
2009-10 2010-11 2011-12 2012-13 2013-14 2014-15 2009-10
to 2014-15
2013-14 to
2014-15
Office building energy
66,823 62,987 68,875 69,689 71,416 75,727 13 6
Vehicle use
24,955 23,458 20,301 20,368 24,718 21,590 -13 -12
Air travel B 13,958 14,911 6,894 6,022 6,462 5,117 -63 -20
Office waste to landfill
394 342 305 272 415 406 3 -2
Total tonnes
106,130 101,698 96,375 96,351 103,010 102,840 -3 0
A Data excludes emissions associated with water and paper use
B The multiplier used to calculate air travel emissions was revised in 2011-12. Consequently, emissions prior to 2011-12 appear
to be over-estimated
Figure 2: Greenhouse gas emissions from Victorian Government mandated departments and agencies,2009-10 to 2014-15
0
20,000
40,000
60,000
80,000
100,000
120,000
2009-10 2010-11 2011-12 2012-13 2013-14 2014-15
Ton
ne
s C
O2
-e
Office building energy Vehicle use Air travel Office waste to landfill

14
Energy use
Energy use in office buildings includes heating, ventilation, air conditioning, water heating, appliances,
lighting and installed equipment such as computers. The most common energy sources in use are electricity
and natural gas.
Total energy use by Victorian Government mandated departments and agencies increased by 3.7 % between
2009-10 and 2014-15. Energy intensity (measured as use per m2) increased by 13.1 % over the same period,
an 11.2 % increase from 2013-14.
Expansion to include operational sites previously not reported and a decrease in staff numbers contributed
to the increase also impacting the validity of trend data.
Table 3: Energy use, intensity and GreenPower purchased for office buildings 2009-10 to 2014-2015
2009-10 2010-11 2011-12 2012-13 2013-14 2014-15
% change 2009-10 to 2014-15
% change 2013-14 to 2014-15
Total building energy (MJ)
285,072,746 291,916,710 283,506,942 262,913,849 269,304,046 295,759,552 3.7 9.8
Building energy per m
2
(MJ)
419 430 420 402 426 474 13.1 11.2
Electricity purchased as GreenPower %
24 27 14 6 1 0.3 -98.8 -59
Notes:
Includes the Department of Environment, Land, Water and Planning’s (DELWP) large ongoing research c omponent at many of its sites accounting for a significant portion of overall energy consumption
Includes EPA’s electricity and gas use in all offices, electricity consumed by its laboratories and air monitoring stations, and a portion of base building consumption for shared buildings.
The increase in energy use from the 2012-13 to the 2013-14 year the Department of Economic Development, Jobs, Transport and Resources (DEDJTR) AgriBio - Centre for AgriBioscience which was f ully operational as of 2013. The Bundoora facility is a combination of offices, laboratories, animal handling facilities and glasshouses, hosting both LaTrobe University and departmental staff. The department reports on 75 % of the centre’s energy consumption
The (former) Department of State Development, Business and Innovation, EPA and SV purchased accredited carbon offsets for the period 2013-14. This offsetting covers the emissions associated with activities such as stationary energy use in buildings, vehicle use and air travel
The Department of Economic Development, Jobs, Transport and Resources (DEDJTR) has the greatest
proportion of total reported energy consumption (45 %). Within DEDJTR the energy used at its Bundoora
AgriBio centre is 35 % of its departmental total. Bundoora’s energy consumption increased in the last
reporting period by 2 MJ for electricity and 2 MJ for gas. DEDJTR figures include additional sites not
previously reported accounting for a further 5 MJ of electricity consumption. These observations account
for approximately four of the 9.8 % increase in energy this year. Further internal departmental analysis
would be required to identify reasons for the remaining increase. The Commissioner notes these changes
in reporting parameters make strict comparison year-on-year invalid.

15
Effect of removing GreenPower purchasing targets
A portion of electricity purchased by Victorian Government agencies includes renewable sources or
GreenPower. GreenPower generates less pollution than power from fossil fuels and contributes no net
increase in greenhouse gas emissions hence the higher the proportion of green energy purchased the
lower the greenhouse gas emission for the same quantity of energy consumed.
Electricity purchased as GreenPower reduced from 27 % in 2010-2011 to 1 % in 2013-14 further
diminishing to 0.3 % in the 2014-15 year as a consequence of the removal of GreenPower purchasing
targets for agencies.
t 215
Figure 3: Energy use, intensity and GreenPower purchased for office buildings 2009-10 to 2013-14
Note: Includes DELWP’s large ongoing research component at many of its sites which accounts for a significant portion of overall energy consumption
24% 27% 14%
6% 1% 0.3% 0
50
100
150
200
250
300
350
400
450
500
-
50,000,000
100,000,000
150,000,000
200,000,000
250,000,000
300,000,000
2009-10 2010-11 2011-12 2012-13 2013-14 2014-15
Bu
ildin
g e
ne
rgy
pe
r m
2 (
mj)
Ene
rgy
(me
gajo
ule
s)
Electricity purchased as GreenPower Non-GreenPower electricity
Natural gas Building energy per m2

16
Transport
Vehicle environmental performance
Victorian Government vehicle use has reduced by 12 % when compared to 2009-10. Variations from year
to year can be influenced by actual numbers of vehicles in the fleet and/or more efficient travel. The change
from 2013-14 to 2014-15 is largely due to a net reduction in vehicle numbers. In 2013-14 the reported
passenger fleet size was 3,331 and in the 2014-15 period this reduced to 2,957 (-11 %).
Actual emission efficiency, expressed as CO2 tonnes per 1,000 kilometres travelled, has shown only minor
improvement over the last six years (-1 %).
In 2013-14 the then Victorian Department of Environment and Primary Industries expanded reporting
to include all operational vehicles (passenger, two and four wheel drive utilities) accounting for an increase
in that year. In addition to more vehicles being captured in the 2013-14 data, four-wheel drive utilities
account for a significant proportion of vehicle kilometres and contribute comparatively higher CO2 emissions.
In the 2014-15 period the Victorian Department of Justice and Regulation (DJR) passenger fleet data
excludes judiciary vehicles following the creation of Courts Victoria from 1 July 2014.
Table 4: Vehicle fleet use, intensity and emissions 2009-10 to 2014-15
Vehicle use 2009-10 2010-11 2011-12 2012-13 2013-14 2014-15 % change 2009-10 to 2014-15
% change 2013-14 to 2014-15
Vehicle energy (Million MJ)
355.35 335.67 288.29 290.07 354.86 312.02 -12 -12
Vehicle Million kilometres
103.01 100.89 95.75 87.77 101.57 90.44 -12 -11
Vehicle kilometres per work day
412,031 403,549 383,012 351,082 406,273 361,767 -12 -11
Vehicle tonnes CO2 per 1,000 km
0.24 0.23 0.21 0.23 0.24 0.24 -1 -2

17
Figure 4: Vehicle fleet use 2009-10 to 2014-15
Victorian Government passenger vehicle fleet composition
The operational fleet composition trends indicate a shift away from LPG toward diesel vehicles. The trend
to increase four cylinder and decrease six cylinder vehicles continued for both operational and executive
fleet in 2014-15. The executive fleet continues to have a predominance of higher emitting six cylinder
vehicles. No electric cars were reported in either operational or executive fleet in 2014-15 period.
The net shift to more fuel efficient passenger vehicles has resulted in a reduction of the average vehicle
emission rate (based on manufacturer specifications) from 215 g CO2/km in 2009-10 to 176 g CO2/km
in 2014-15, a decrease of 18 %. The higher actual average emission intensity reported (240 g CO2/km)
is due to vehicle selection choices, non-passenger vehicle use and/or the driving conditions.
0
50,000
100,000
150,000
200,000
250,000
300,000
350,000
400,000
450,000
0
10,000,000
20,000,000
30,000,000
40,000,000
50,000,000
60,000,000
70,000,000
80,000,000
90,000,000
100,000,000
110,000,000
2009-10 2010-11 2011-12 2012-13 2013-14 2014-15
Ve
hic
le k
ilom
etr
es
pe
r w
ork
day
Ve
hic
le t
ota
l kilo
me
tre
s
Vehicle total kilometres Vehicle kilometres per work day

18
Figure 5: Victorian Government passenger vehicle fleet composition and average vehicle greenhouse intensity 2009-10 to 2014-15
Figure 6: Victorian Government passenger vehicle percentage composition for operational and executive fleets 2013-2014 and 2014-15
100
120
140
160
180
200
220
240
0
500
1,000
1,500
2,000
2,500
3,000
3,500
4,000
2009-10 2010-11 2011-12 2012-13 2013-14 2014-15
g C
O2
/ k
m
Nu
mb
er
of
veh
icle
s
6 Cylinder 4 Cylinder LPG LPG dual fuel
Diesel Electric Hybrid Ave gCO2e/km
0%
10%
20%
30%
40%
50%
60%
70%
80%
90%
100%
Operational 2013-14 Operational 2014-15 Executive 2013-14 Executive 2014-15
Hybrid 6 Cylinder 4 Cylinder Diesel LPG LPG dual fuel Electric
19
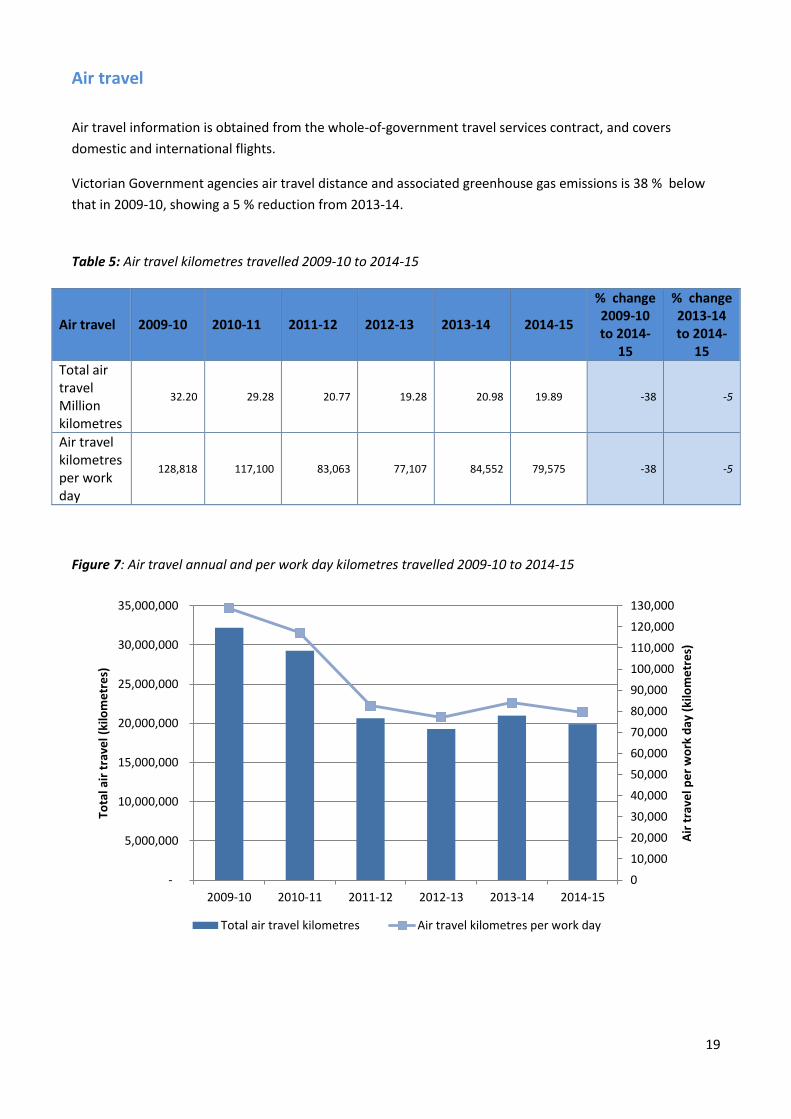
Air travel
Air travel information is obtained from the whole-of-government travel services contract, and covers
domestic and international flights.
Victorian Government agencies air travel distance and associated greenhouse gas emissions is 38 % below
that in 2009-10, showing a 5 % reduction from 2013-14.
Table 5: Air travel kilometres travelled 2009-10 to 2014-15
Air travel 2009-10 2010-11 2011-12 2012-13 2013-14 2014-15
% change 2009-10 to 2014-
15
% change 2013-14 to 2014-
15
Total air travel Million kilometres
32.20 29.28 20.77 19.28 20.98 19.89 -38 -5
Air travel kilometres per work day
128,818 117,100 83,063 77,107 84,552 79,575 -38 -5
Figure 7: Air travel annual and per work day kilometres travelled 2009-10 to 2014-15
0
10,000
20,000
30,000
40,000
50,000
60,000
70,000
80,000
90,000
100,000
110,000
120,000
130,000
-
5,000,000
10,000,000
15,000,000
20,000,000
25,000,000
30,000,000
35,000,000
2009-10 2010-11 2011-12 2012-13 2013-14 2014-15
Air
tra
vel p
er
wo
rk d
ay (
kilo
me
tre
s)
Tota
l air
tra
vel (
kilo
me
tre
s)
Total air travel kilometres Air travel kilometres per work day
20
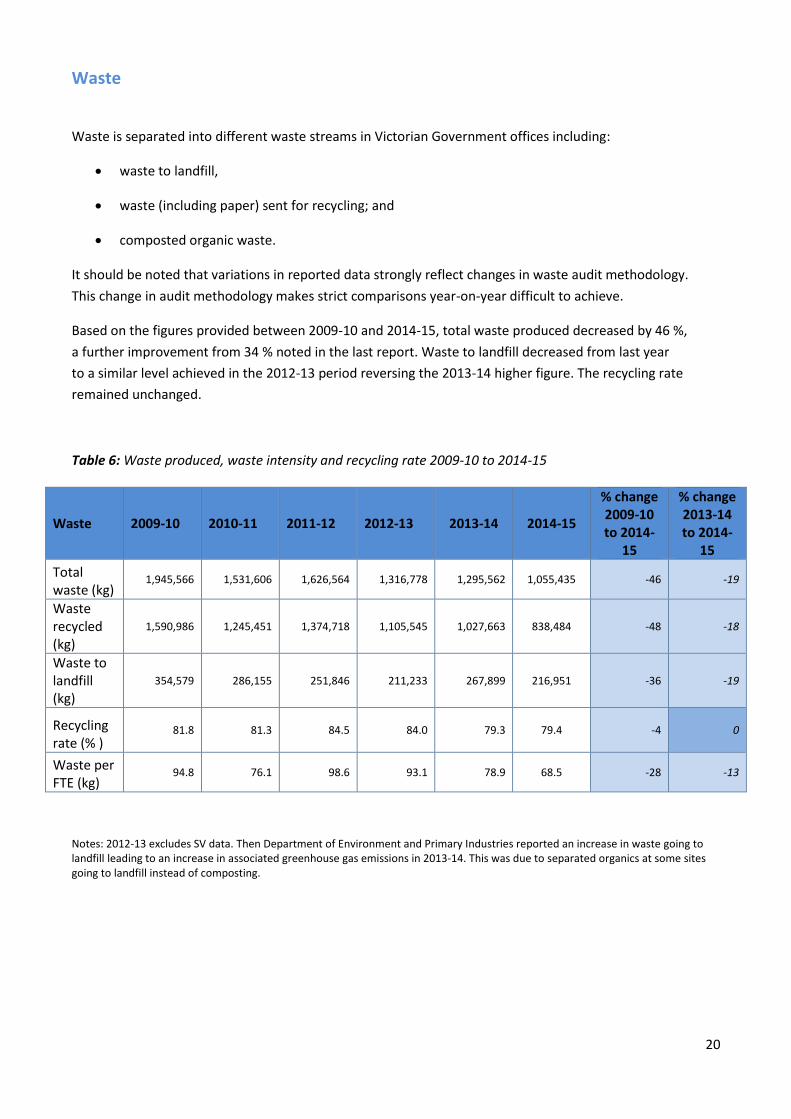
Waste
Waste is separated into different waste streams in Victorian Government offices including:
waste to landfill,
waste (including paper) sent for recycling; and
composted organic waste.
It should be noted that variations in reported data strongly reflect changes in waste audit methodology.
This change in audit methodology makes strict comparisons year-on-year difficult to achieve.
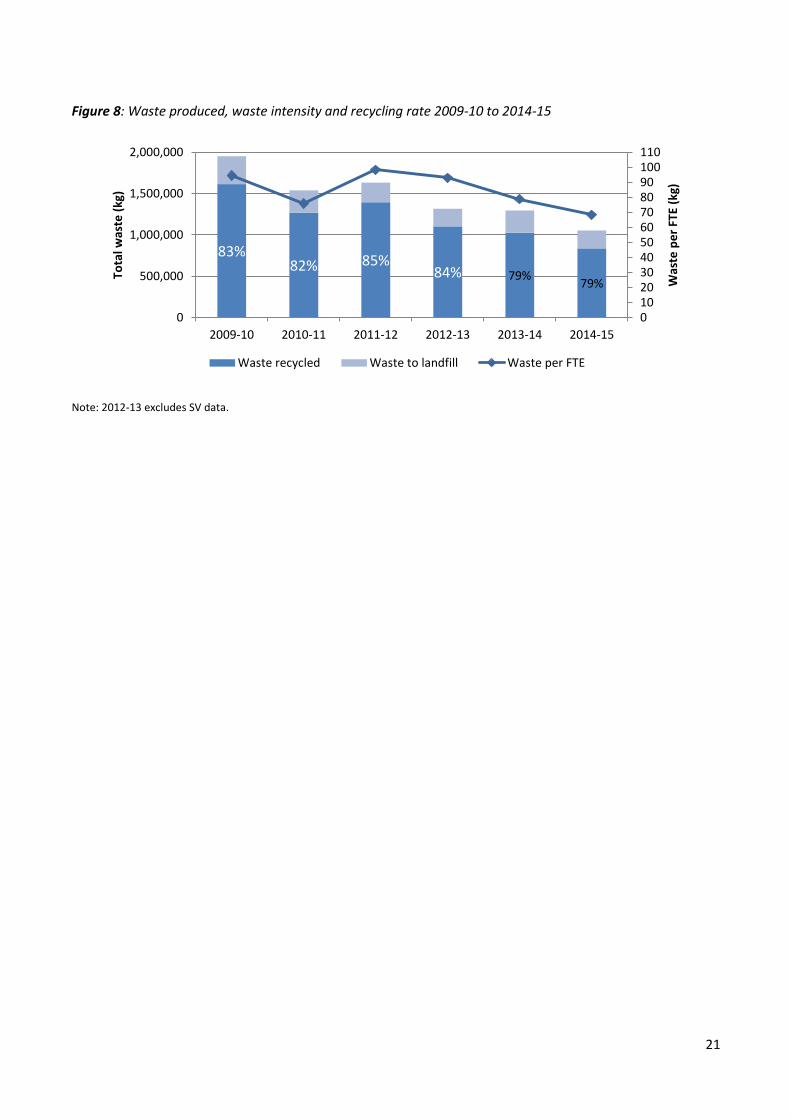
Based on the figures provided between 2009-10 and 2014-15, total waste produced decreased by 46 %,
a further improvement from 34 % noted in the last report. Waste to landfill decreased from last year
to a similar level achieved in the 2012-13 period reversing the 2013-14 higher figure. The recycling rate
remained unchanged.
Table 6: Waste produced, waste intensity and recycling rate 2009-10 to 2014-15
Waste 2009-10 2010-11 2011-12 2012-13 2013-14 2014-15
% change 2009-10 to 2014-
15
% change 2013-14 to 2014-
15
Total waste (kg)
1,945,566 1,531,606 1,626,564 1,316,778 1,295,562 1,055,435 -46 -19
Waste recycled (kg)
1,590,986 1,245,451 1,374,718 1,105,545 1,027,663 838,484 -48 -18
Waste to landfill (kg)
354,579 286,155 251,846 211,233 267,899 216,951 -36 -19
Recycling rate (% )
81.8 81.3 84.5 84.0 79.3 79.4 -4 0
Waste per FTE (kg)
94.8 76.1 98.6 93.1 78.9 68.5 -28 -13
Notes: 2012-13 excludes SV data. Then Department of Environment and Primary Industries reported an increase in waste going to landfill leading to an increase in associated greenhouse gas emissions in 2013-14. This was due to separated organics at some sites going to landfill instead of composting.
21
Figure 8: Waste produced, waste intensity and recycling rate 2009-10 to 2014-15
Note: 2012-13 excludes SV data.
83% 82% 85%
84% 79% 79%
0102030405060708090100110
0
500,000
1,000,000
1,500,000
2,000,000
2009-10 2010-11 2011-12 2012-13 2013-14 2014-15
Was
te p
er
FTE
(kg)
Tota
l was
te (
kg)
Waste recycled Waste to landfill Waste per FTE

22
Paper use
Victorian Government agencies source data on the amount and type of paper purchased from the
government’s nominated stationery suppliers.
Victorian Government agencies used 28 % less paper in 2014-15 than 2009-10 representing a reduction
on 2013-14 of 6 %.
The average paper used per FTE has reduced from 13.5 reams in 2013-14 to 11.8 reams per FTE representing
13 % improvement on the 2013-14 performance. Paper use per FTE across the mandated agencies ranged
from 5.3 to 19 reams per FTE.
Table 7: Paper use and use per full time equivalent employee 2009-10 to 2014-15
Paper 2009-10 2010-11 2011-12 2012-13 2013-14 2013-14
% change 2009-10
to 2013-14
% change 2013-14
to 2014-15
Total paper use (reams)
391,506 387,986 367,493 318,421 300,433 282,368 -28 -6
Paper use per FTE (reams)
14.3 14.1 14.2 13.6 13.5 11.8 -17 -13
Figure 9: Paper use and use per full time equivalent employee 2009-10 to 2014-15
5
6
7
8
9
10
11
12
13
14
15
0
50,000
100,000
150,000
200,000
250,000
300,000
350,000
400,000
450,000
2009-10 2010-11 2011-12 2012-13 2013-14 2014-15
Pap
er
use
pe
r FT
E (r
eam
s)
Tota
l pap
er
use
(re
ams)
Total paper use (reams) Paper use per FTE (reams)

23
Water use
Office-based water use data includes water consumption for drinking, washing, cleaning and toilet flushing,
and base building requirements such as heating and cooling systems.
Victorian Government mandated departments and agencies are implementing a range of initiatives which
seek to reduce potable water use in office-based accommodation. These range from flow restrictors on taps,
harvesting and reusing water from roofs, to installing water meters and real-time water tracking.
This year’s data shows an increase on 2013-14 however mandated departments and agencies have advised
the Commissioner that most of this increase can be attributed to improved monitoring and the inclusion
of some sites not previously reported as “office”.
While total water use decreased by 9 % between 2009-10 and 2014-15, water use per FTE increased
by 16 % over the same period. As with office energy consumption, the inclusion of additional site data
has contributed to the increase and has made year to year comparisons difficult.
Table 8: Water use, water intensity across government offices 2009-10 to 2014-15
Water 2009-10 2010-11 2011-12 2012-13 2013-14 2014-15 % change
2009-10 to 2014-15
%change 2013-14 to
2014-15
Total litres 204,731,690 192,034,220 186,288,090 169,613,313 173,768,540 187,130,00 -9 8
Litres per FTE
10,028 9,633 9,639 10,119 11,712 11,669 16 - 0.4
Notes: DTF noted in its annual report that an increase in water consumption per FTE was due to improved reporting and fewer employees. DJR advised significant variance in relation to prior years was due to DJR office data now including sites (previously reported separately) following the machinery-of-government changes noted previously.
Figure 10: Total water use and water intensity across government offices 2009-10 to 2014-15
01,0002,0003,0004,0005,0006,0007,0008,0009,00010,00011,00012,00013,00014,000
0
20,000,000
40,000,000
60,000,000
80,000,000
100,000,000
120,000,000
140,000,000
160,000,000
180,000,000
200,000,000
220,000,000
2009-10 2010-11 2011-12 2012-13 2013-14 2014-15
Litr
es p
er F
TE
Tota
l lit
res
Total litres Litres per FTE

24
Discussion
The 2013-14 Strategic Audit Report highlighted the role of procurement as a means to reduce office based
environmental impacts.8
The public sector has a great opportunity to influence environmental outcomes through procurement choices. Incorporating environmental considerations into purchasing decisions and selecting products and services that represent value for money with the least environmental impact over the life of the product or service is a win-win.
With the Victorian Government Purchasing Board (VGPB) reporting that department-specific procurement
activity for goods and services in 2014–15 is valued at around $1.6 billion, incorporating environmental
considerations into procurement requirements remains an area for opportunity and focus.9
The VGPB continue to support a definition of value for money that considers environmental and
sustainability issues, defining value for money as: involving “a balanced judgement of financial and non-
financial factors. Typical factors include fitness for purpose, quality, whole-of-life costs, risk, environmental
and sustainability issues, as well as price”.10
As the results of the 2014-15 audit indicate (Figure1) the Victorian Government’s reported office-based
green house gas emissions are from office building energy consumption (73.6 %), followed by vehicle use
(21 %) air travel (5 %), and waste to landfill ( 0.4%).
The opportunity for improvement can be focussed on procurement initiatives that deliver greenhouse
emission reductions and other efficiency measures relating to office buildings and vehicles.
8 Commissioner for Environmental Sustainability Victoria, Strategic Audit: Implementation of environmental management systems
in Victorian Government 2013-14, Melbourne, 2015. Available at: https://www.ces.vic.gov.au/publications/strategic-audit-report 9 Victorian Government Purchasing Board, Annual report 2014-15, Melbourne, 2015. Available at:
http://www.procurement.vic.gov.au/About-the-VGPB/Annual-Reports 10
Victorian Government Purchasing Board, Annual report 2014-15, Melbourne, 2015. Available at: http://www.procurement.vic.gov.au/About-the-VGPB/Annual-Reports

25
Renewable Energy Purchasing: Sourcing renewable energy certificates from new Victorian projects
In August 2015 the Victorian Government announced an initiative to source renewable energy certificates
through a tender process, from new projects in Victoria, which is expected to drive significant improvement
in the use of renewables by government agencies.
This initiative is part of the Renewable Energy Roadmap for Victoria.11
Public sector can help drive a more efficient vehicle fleet
With the imminent closure of the vehicle manufacturing industry in Victoria and Australia the Victorian
Government has the opportunity to refresh its vehicle fleet procurement policy. A new policy paradigm
should aim to reflect both the changes in our manufacturing profile in Victoria and introduce fuel efficiency
and advanced environmental performance objectives.
Reflecting a commitment made by the current Victorian Government to review the Victorian Government
fleet’s fuel efficiency, the Office of the Commissioner for Environmental Sustainability commissioned
ClimateWorks to undertake a small research project12 to analyse the current fleet makeup, how it is used
and how it might be changed in the future to meet contemporary community expectations.
Below is a snap shot of key findings of that work as it relates to the purpose of this audit process.
The total reported greenhouse gas emissions from Victorian Government mandated departments and
agencies this year was 102,840 tCO2 per year. This remains below the 2009-10 results by 3 % with total
emissions remaining virtually unchanged in the last 12 month period (-0.07% change).13 In the context of the
scope of this audit, vehicle use is the second largest source of greenhouse gas emissions by the mandated
departments and agencies. Notably, vehicle use decreased by 12 % this year compared with 2013-14.
Energy use in office buildings is the largest source of greenhouse gas emissions by the mandated
departments and agencies accounting for 74 % of emissions in 2014-15. Vehicle use and air travel accounted
for 21 % and 5 % of total emissions representing a reduction on the 2013-14 results of 24 % and 6 %
respectively. Office-based waste accounted for less than 1 % of total emissions.
At present the Victorian Government’s passenger vehicle fleet reporting under the EMS program emits
approximately 16,000 tCO2 per year and has an average CO2 emissions intensity of 180 gCO2/km based
on vehicle manufacturer specifications.
11
Victorian Department of Economic Development, Jobs, Transport and Resources, Victoria’s Renewable Energy Roadmap, Melbourne, 2015. Available at: http://www.energyandresources.vic.gov.au/__data/assets/pdf_file/0007/1193281/9057-DEDJTR-ESD-Renewable-Energy-Roadmap-20150820.PDF
12 ClimateWorks Australia, Strategy to Improve the Fuel Efficiency of the Victorian Government’s Passenger Vehicle Fleet, unpublished
report to Commissioner for Environmental Sustainability Victoria, Melbourne, 2016. 13
Note: As in previous years and in some cases, Victorian Government entities revised the 2013–14 data presented in the 2014-15 annual reports in line with final billing cycle data. This Strategic Audit Report reflects the latest data consistent with the entities’ annual reports.

26
The emission intensity has been steadily improving, having decreased from approximately 215 gCO2/km
in 2010-11 to 180 gCO2/km now. This has been achieved primarily through the natural turnover of vehicles
and replacement with more efficient models, aided by the Victorian Government mandate to purchase
2000 Hybrid Toyota Camrys in 2010.
While the emission intensity is in line with Australia’s national 2015 average of 182 gCO2/km for new
passenger vehicles,14 in comparison to global peers Australia has scored poorly in the energy efficiency
of its land transport sector.15
State and Territory governments are working to reduce emissions and improve the fuel efficiency of their
passenger fleets, demonstrated by the South Australian Government’s recent request for proposals to
investigate the potential to convert its existing vehicle fleet to low or zero-emission intensity vehicles.16
There are positive trends in the environmental performance of the Victorian Government fleet. The
passenger vehicle fleet from departments and agencies that report under this EMS program, as at 30 June
2015, totalled 2,965 of which 2,465 are operational17 and 500 executive18 vehicles. The size of this vehicle
fleet has decreased by approximately 18 % between 2010-11 and 2014-15. In addition, the overall
composition continues to move to a lower intensity fleet with a decrease in unleaded petrol vehicles with
six cylinders, of 12 % and of four cylinder vehicles by 19 %.This is accompanied by an increase in hybrid
vehicles by 20 % over the five-year period.
Based on the current structure of the Victorian Government’s fleet, a range of opportunities have been
identified to improve the fleet’s efficiency and reduce emissions.19
Simple changes to existing policy could deliver early efficiency gains by shifting the remaining six
cylinder vehicles currently in the executive fleet to more fuel efficient four cylinder vehicles. On
average, for each vehicle that switches from six to four cylinders, 2 tCO2 and 787 litres of fuel can
be saved per year. If the entire executive fleet was shifted to four cylinder vehicles at the natural
time of replacement over the next three years, this would cumulatively save approximately 2,219
tCO2e and 867,000 litres of fuel in total by 2019-20. This could be expedited through the
introduction of a percentage based phase out over the next two years. This could, for example, be
targeted exclusively towards the executive fleet, to provide an incentive for a shift from high
emissions intensity six cylinder vehicles to low emissions alternatives.
14
National Transport Commission, Carbon Dioxide Emissions Intensity for New Australian Light Vehicles 2014: Information paper, Melbourne, 2015. Available at: http://www.ntc.gov.au/Media/Reports/(28DF073D-71D6-40BB-8FC4-C358C475A2B3).pdf 15
American Council for an Energy-Efficient Economy, The 2014 International Energy Efficiency Scorecard, Washington D.C., 2014. Available at: http://aceee.org/research-report/e1402 16
South Australian Government, EOI for Low or Zero Emission Vehicles in the Government Fleet, Adelaide, 2015. Available at: http://www.premier.sa.gov.au/images/news_releases/2015/15_11Nov/fleeteoi.pdf 17
As per the Standard Motor Vehicle Policy, an operational vehicle refers to the use of vehicles by government employees to conduct their regular duties where motor vehicles are required. 18
As per the Standard Motor Vehicle Policy, an executive vehicle is a vehicle used by executive officers. 19
ClimateWorks Australia, Strategy to Improve the Fuel Efficiency of the Victorian Government’s Passenger Vehicle Fleet, unpublished report to Commissioner for Environmental Sustainability Victoria, Melbourne, 2016.
27
In general, the cost considerations for efficiency gains for the fleet are influenced by the vehicle’s
depreciation over the life of the lease and the potential fuel savings available. For short-term leases,
depreciation is the most significant factor in terms of determining lease costs. Depreciation costs are
lower for vehicles with a higher resale value. This has been demonstrated with the inclusion of the
Hybrid Camry in the Victorian Government fleet, where there has been a strong second hand market
demand specifically by taxi operators.
Electric vehicles offer the potential for zero emissions when coupled with the use of renewables
as a recharge source. However, the economics related to depreciation vary significantly from those
applying to the current fleet. For electric vehicles, these economic impacts can be addressed in part
by increasing the length of the vehicle lease. For example, the City of Sydney incorporated electric
vehicles into its fleet and found that for the Nissan Leaf, while depreciation occurred rapidly over
the first year of ownership, it then plateaued and held its value after this.
There are a range of cost savings which can work towards offsetting any additional costs for shifting
to more efficient vehicles that may have higher depreciation rates. These savings include overall fuel
savings, savings from shifting vehicle classes, savings from reducing fleet size and, maintenance and
repair savings. In total, these savings could equate to approximately $7 million per year in lease
costs, and $2.5 million to $4.5 million in fuel savings per year which could be used to offset
additional costs for the purchase of best in class or electric vehicles.
In addition there are behavioural considerations: more mindful driving, using proven eco-driving
techniques, and new ways of thinking that consider alternate modes of transport rather than
a default preference for a motor vehicle as part of executive employment.
These are complex issues for government. A change of fleet policy will happen as the Australian vehicle
manufacturing industry is phased out. Governments can demonstrate leadership in setting its new policies,
favouring smarter cars that deliver for the environment, encouraging consideration of other modes
of transport or taking a more long term view of the economics of purchasing costs that factor in
longer lease terms.

28
Published by the Commissioner for Environmental Sustainability
Melbourne, Victoria
2016
Level 36, 2 Lonsdale Street
Melbourne Victoria 3000
T 03 9948 2846
www.ces.vic.gov.au
©The State of Victoria, Comissioner for Environmental Sustainability 2016. This publication is copyright.
No part may be reproduced by any process except in accordance with the provisions of the Copyright Act 1968.
For further information contact the Office of the Commissioner for Environmental Sustainability,
phone +61 3 9948 2846 or visit www.ces.vic.gov.au


