57
STRATEGIC DIRECTIONS 2017 NATURAL GAS INDUSTRY REPORT Black & Veatch Insights Group

STRATEGIC DIRECTIONS
20 1 7
NATURAL GAS INDUSTRY REPORT
Black & Veatch Insights Group

About This Report The 2017 Strategic Directions: Natural Gas Industry Report continues the discussion of how sustained low commodity prices are affecting all elements of the natural gas value chain. With current forecasts indicating prices will remain flat for an extended period, sector leaders are adjusting with many taking a proactive, longer-term approach to planning as projections push a market rebound further into the next decade.
Low natural gas prices, as well as evolving global market dynamics, are considerably impacting supply and demand trends worldwide. Trade relations, growing population centers and emerging production leaders are influencing factors such as gas production and transport. Liquefied natural gas (LNG) and liquefaction capacity, for example, are drastically changing the volume of supply available to global markets. However, infrastructure investments will be necessary for accommodating increased LNG trade.
All along the value chain, organizations are working toward more efficient and sustainable systems. Data analytics, workforce management, and physical security and cybersecurity issues continue to challenge the industry. Additionally, in the United States, the current presidential administration has stoked discussion on regulatory impacts to natural gas providers and storage facility operators.
The 2017 Strategic Directions: Natural Gas Industry Report explores these dynamics and how upstream, midstream and downstream enterprises are managing operations to keep pace. Regardless of their roles in the supply chain or geographic location, organizations are adapting to the global forces shaping the natural gas industry.
We welcome your questions and comments regarding this report or Black & Veatch services. You can reach us at [email protected].
Sincerely,
HOE WAI CHEONG | President, Oil & Gas
JOHN CHEVRETTE | President, Management Consulting
Table of Contents1 EXECUTIVE SUMMARY 1 Global Forces Drive Natural Gas Supply and Demand
5 INTERNATIONAL MARKET DYNAMICS
5 Critical Considerations for Global Gas-to-Power Deployment Success
9 Hurricanes Harvey and Irma: Impacts to U.S. Oil and Gas Sector
11 Natural Gas Poised to Unlock Latin America Power Prospects
14 For FLNG Projects, Bigger is Not Always Better
18 UK Energy Sector Transformation Marks Historic Milestones
20 SUSTAINABLE OPERATIONS20 Natural Gas Market: Strengthening Foundations for Long-Term Growth
26 Economics Remain Driving Force for Downstream Sector Trends
29 Balancing Modern Power: The Convergence of Natural Gas and the Electric Market
32 Oil and Gas Asset Data Quality and Asset Integrity
36 Funding, Preparation and Culture Keys to Securing Critical Infrastructure and Systems
39 Amid Changes in the Federal Regulatory Landscape, States Take the Lead
42 Natural Gas Storage Operators Bracing for Regulatory Impact
45 CLOSING COMMENTARY 45 Global Supply Stokes New Infrastructure Opportunities
49 2017 REPORT BACKGROUND 50 Primary Business Region/Industry Type
51 LIST OF FIGURES/TABLES

1 | 2017 STRATEGIC DIRECTIONS: NATURAL GAS INDUSTRY REPORT | BV.COM
Executive SummaryGLOBAL FORCES DRIVE NATURAL GAS SUPPLY AND DEMAND
By Hoe Wai Cheong
As much as recent natural gas industry dynamics are influenced by price, the reality is that the global market always is truly driven by supply and demand. Where gas reserves reside, where energy demand is needed, and how supply is being transported all tell a more holistic story of the market’s dynamics. The current disparity in supply and demand is giving natural gas buyers the upper hand in negotiating contracts and is affecting how organizations throughout the value chain are planning for the future.
The 2017 Strategic Directions: Natural Gas Industry Report reflects how global forces are impacting all sectors of the natural gas industry:
Trade Relations: Saudi Arabia, the United Arab Emirates, Bahrain and Egypt recently severed diplomatic, trade and transport ties with Qatar, the world’s biggest supplier of liquefied natural gas (LNG). The sanctions highlight the potential impacts of interrupted or blocked supply routes around the Middle East and decreased volumes of LNG on the market.
Growing Population Centers: Projections for population surges in regions such as India, Southeast Asia and Sub-Saharan Africa will increase demand in both developed and developing areas that will require new infrastructure to receive, process and transport gas supply.
Hoe Wai Cheong is President of Black & Veatch’s oil & gas business. He is responsible for global strategy, business development, and project acquisition and execution. He is based in Singapore.
EXECUTIVE SUMMARY

2 | 2017 STRATEGIC DIRECTIONS: NATURAL GAS INDUSTRY REPORT | BV.COM
FIGURE 1
Please rate the importance of each of the following issues and/or challenges related to the natural gas market.
Source: Black & Veatch
U.S. “Energy Dominance”: The presidential administration is pushing increased capital expenditures toward LNG export terminals. A policy shift signaling support for the United States to sell more energy to new markets such as China could address the current market oversupply; this and other trends point to the United States emerging as a major LNG supplier.
Discovery of Natural Gas Reserves: The discovery of natural gas reserves in resource-rich regions such as East Africa is creating
opportunities to develop projects that integrate more power domestically and boost local economies.
These factors seemingly play into how the industry views the market, with 90 percent of survey respondents naming economic/demand growth as a top issue. Low gas prices and price stability, and gas supply reliability round out the top three natural gas market challenges (Figure 1).
EXECUTIVE SUMMARY
Economic/demand growth
Low gas prices and price stability
Gas supply reliability
Environmental regulation
Rate and regulatory certainty
Regulations (other than environmental)
Electric/gas interdependency
Competition from new technologies
Access to international markets
Industry consolidation through M&A
89.6% 9.2%
78.9% 19.0%
76.6% 17.1%
76.9% 17.1%
77.5% 19.2%
73.6% 21.6%
71.6% 22.5%
66.3% 29.0%
56.5% 21.3% 21.6%
42.7% 44.8% 12.4%
1.2%
2.1%
6.3%
6.0%
3.3%
4.8%
6.0%
4.8%
n Very Important and Important n Neutral n Not Important At All + Not Important
3 | 2017 STRATEGIC DIRECTIONS: NATURAL GAS INDUSTRY REPORT | BV.COM
As the industry plans for differing geopolitical scenarios that could affect these top issues, forward-thinking leaders are aligning businesses to prepare for the long-term ramifications. For LNG transport, if shipping channels are blocked because of regional tensions, are there alternate methods of moving supply to buyers? Will buyers backfill supply by purchasing from the spot market? Will emerging supply leaders such as the United States and Australia capitalize by providing more flexible contracts to buyers? While these may be seen as challenges, the industry is keeping a close watch on global trends and strategically mapping out business opportunities from each scenario.
SUPPLY RELIABILITY HINGES ON INFRASTRUCTURE INVESTMENTS
Oil and gas leaders must look beyond the next few years and plan for decades to come. For example, investments made now in infrastructure will be key to support future economic growth and facilitate reliable transport of natural gas to demand centers. In India, Swan LNG Private Limited is developing the country’s first floating storage and regasification unit (FSRU) import terminal, which will increase LNG import capacity by 2022.
Black & Veatch is providing engineering, procurement and construction services on the project, which will support development of the Indian gas market, projected to be one of the fastest growing in the world in the next two decades.
While financial investment decisions have slowed in some regions, plans to advance gas-to-power projects are beginning to positively impact economies, particularly in underdeveloped regions. In many African countries that historically have been net exporters of gas, a turning point is being reached, and more gas is slated to be utilized in-country. Foreign investments from trade partners in China and Japan are helping energy projects there come to fruition, which will provide much-needed baseload power to rural areas. When completed, these projects could dramatically affect LNG trade around the world.
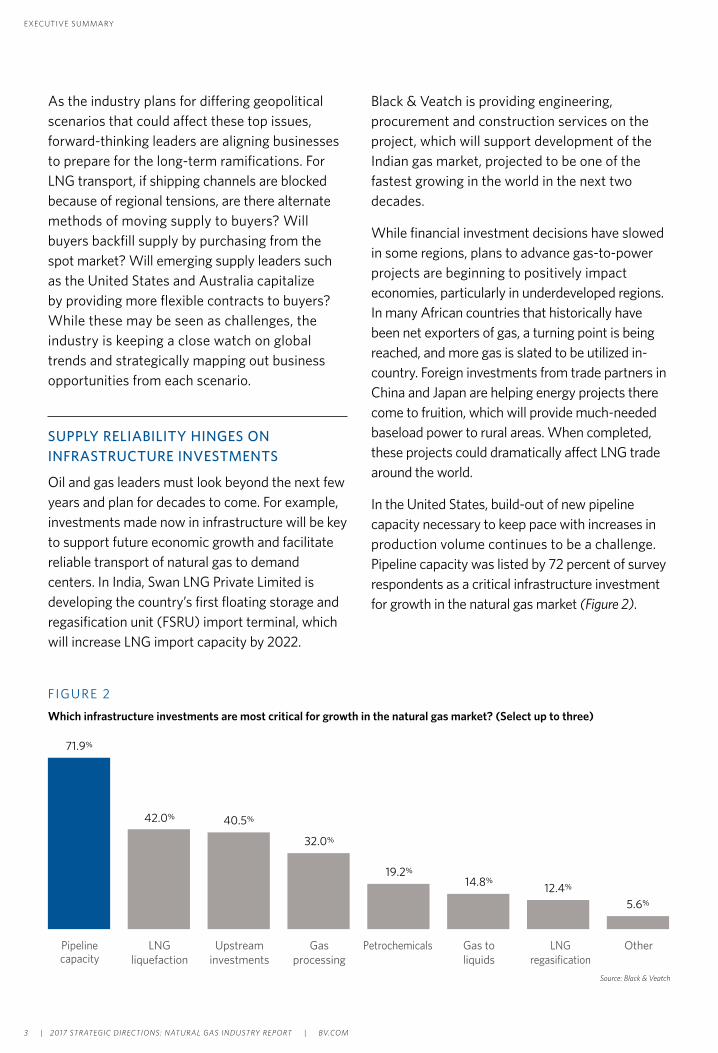
In the United States, build-out of new pipeline capacity necessary to keep pace with increases in production volume continues to be a challenge. Pipeline capacity was listed by 72 percent of survey respondents as a critical infrastructure investment for growth in the natural gas market (Figure 2).
F IGURE 2
Which infrastructure investments are most critical for growth in the natural gas market? (Select up to three)
Pipeline capacity
LNG liquefaction
Upstream investments
Gas to liquids
Gas processing
Petrochemicals LNG regasification
Other
71.9%
42.0% 40.5%
32.0%
19.2%
14.8%12.4%
5.6%
Source: Black & Veatch
EXECUTIVE SUMMARY

4 | 2017 STRATEGIC DIRECTIONS: NATURAL GAS INDUSTRY REPORT | BV.COM
These developments and their interrelated impacts are seen throughout this year’s report:
Market Outlook: One of the most dramatic swings from previous years’ surveys is the expectation for global crude oil prices between now and 2020. Of natural gas industry respondents, nearly half expect prices to be between $40 and $50 per barrel. In our 2016 report, only 7 percent listed this price range as their expectation. This shift could be attributed directly to recent Organization of the Petroleum Exporting Countries (OPEC) quota cuts, which highlighted that OPEC’s control of the market and ability to drive oil prices up may be diminishing.
Natural Gas’s Latin American Connection: Rising demand in Mexico and Latin America presents broad opportunities across the industry. Steadily growing economies are spiking energy demand and, in turn, catalyzing soaring imports from the United States. However, conditions beyond these neighboring countries present critical challenges that must be overcome to seize natural gas’s potential as a cheap, reliable and cleaner power generation source.
Critical Considerations for Global Gas-to-Power Deployment Success: Many developing regions are working to establish stable, long-term gas markets. These markets will provide a base for energy diversification, sustained growth and local job creation. South Africa, for example, has launched its LNG-to-Power Independent Power Producer Procurement Programme for 3 GW of new gas-to-power capacity, and other regions with significant gas deposits, such as South America, Bangladesh and Indonesia, have similar gas-to-power efforts under way.
Convergence with the Electric Market: Clean burning, cost-effective and reliable, the benefits of natural gas are undeniable. Amid the decline of coal and the increased integration of solar and wind power, providers will continue to see value in gas-fired generation, especially when it comes to backstopping renewable energy supply.
Regulatory Mandates: For years, Environmental Protection Agency (EPA) regulations have shaped natural gas operations in the United States, but the presidential administration has sparked discussions on how and when new methane regulations will be enforced. Particularly for new pipeline infrastructure, federal compliance requirements could delay or accelerate project approvals and overall timelines for getting gas to markets inside and out of the United States.
SEEING THE GLOBAL PICTURE
Whether in the United States or abroad, the industry leaders most poised for future growth in the natural gas industry will be the ones who see the broader global picture. Regardless of their role in the supply chain, organizations will be subject to impacts from geopolitical crises and increasing foreign competition. The next few years could bring about drastic changes, including who the dominant market players are and what technology is being applied to bring supply to demand centers.
Analysts still predict a market rebound within the next 10 years. However, those who do not engage in proactive planning, especially in regard to long-term projects, risk being unable to capitalize on big opportunities down the road.
EXECUTIVE SUMMARY

5 | 2017 STRATEGIC DIRECTIONS: NATURAL GAS INDUSTRY REPORT | BV.COM
International Market DynamicsCRITICAL CONSIDERATIONS FOR GLOBAL GAS-TO-POWER DEPLOYMENT SUCCESS
By Shawn Hoffart and Alap Shah
After the Fukushima disaster in 2011 and the subsequent sunsetting of many of Japan’s nuclear facilities, the Japanese economy’s reliance on fossil fuels intensified and altered the country’s energy mix. In the following years, major suppliers profited from rising demand in Asian markets and promoted the benefits of liquefied natural gas (LNG). Its ability to be transported easily with minimal infrastructure requirements, as well as drastically lower prices compared to domestic or stranded gas prices, led to a tremendous buildup of liquefaction capacity globally. Consequently, the increased supply on the market also caused prices to drop dramatically.
Looking to take advantage of the LNG oversupply and low pricing, many developing regions are now establishing gas-to-power markets that can accommodate imported supply. Converting to gas power, particularly in regions that have historically run on diesel fuel oil, can carry additional economic benefits. In some areas, conversions can cut electric costs in half.
It is a lucrative time to invest in gas-to-power projects, but developing long-term stable markets will rely heavily on effectively moving LNG to these emerging regions and on the economical configuration of gas-fired generation infrastructure.
Shawn Hoffart is a Vice President and the LNG Technology Manager for Black & Veatch’s oil & gas business. He is responsible for project development in the LNG area and evaluating emerging technology.
Alap Shah is a Vice President and Director of Technologies and Services Areas within Black & Veatch’s power business. He manages the selection of gas and steam turbine technologies, risk identification and mitigation of gas turbine technology integration, performance guarantees and performance testing of combined and simple cycle projects
INTERNATIONAL MARKET DYNAMICS

6 | 2017 STRATEGIC DIRECTIONS: NATURAL GAS INDUSTRY REPORT | BV.COM
INTEGRATING LNG-TO-POWER
Territories in the Caribbean are seeing opportunities to lock in long-term LNG supply contracts and build integrated LNG import facilities and combined-cycle power plants. In Puerto Rico, Ecoeléctrica’s Peñuelas plant project, commissioned in 2000, was helping to cut the country’s reliance on oil and coal. Black & Veatch supported the development of this combined-cycle power plant and LNG regasification units, the first project in the territory to produce electricity with natural gas. The regasification facility integrates waste heat vaporization with combined-cycle turbine operation-one of the most efficient methods to regasify LNG. However, the devastation wrought by Hurricane Maria, a Category 5 hurricane that made landfall on Puerto Rico in late September 2017, has since set back efforts within the island nation.
In Brazil, a 1,516 MW combined-cycle power plant is being built in conjunction with a new natural gas floating storage and regasification unit (FSRU). The Porto de Sergipe plant is being built by Centrais Elétricas de Sergipe (CELSE), a consortium formed by eBRASIL and Golar Power. The plant will include advanced technology gas turbines that run on LNG power. It will be
the largest natural gas power station in South America when fully commissioned in 2019.
“When complete, the Porto de Sergipe project will serve as a preeminent example of efficient and economical LNG-to-power integration,” said Eduardo Antonello, Chief Executive of Golar Power. “To successfully deploy a project of this magnitude, collaboration with experts with strong development, technical design and execution expertise is critical to meeting cost and schedule goals.”
If LNG import terminals and natural gas-based combined-cycle plants are designed and integrated appropriately, energy providers can experience up to a 10 percent increase in power generation capacity, increased power plant efficiency and lower operating expenses, with a minimum cost impact. In addition to a significant reduction in a project’s overall capital cost and increased efficiency of LNG import facilities, there are also environmental benefits. In locations with colder winters, vaporized LNG is warm enough to meet distribution pipeline minimum supply temperatures for more efficient transport to power consumers.
Converting to gas power, particularly in regions that have historically run on diesel fuel oil, can carry additional economic benefits. In some areas, conversions can cut electric costs in half.
INTERNATIONAL MARKET DYNAMICS

7 | 2017 STRATEGIC DIRECTIONS: NATURAL GAS INDUSTRY REPORT | BV.COM
Integrated LNG-to-power projects can be complex endeavors, and successful deployment will require well-defined plans established early in development. Comprehensive project execution planning and collaborating with gas distribution companies in addition to power generation can also help capture necessary funding for LNG supply and import infrastructure for maximum return on investments.
ADVANTAGES OF FLOATING APPLICATIONS
Floating LNG (FLNG) applications carry several advantages over onshore LNG import terminals because of their flexibility and quicker deployment schedules. FLNG and FSRU projects reduce potential issues due to shoreline impacts, size and complexity considerations in development.
In India, Black & Veatch is working with Swan LNG Private Limited on India’s first FSRU LNG import terminal in Gujarat. The Jafrabad FSRU
project includes construction of a jetty topside that will receive LNG from carriers and also includes onshore support facilities. The new FSRU will be moored to a fixed jetty and will regasify imported LNG to enable distribution by pipeline and road tanker. Scheduled for completion in 2020, the project will boost the country’s LNG import capacity and help develop the Indian gas market, which is projected to be one of the fastest growing in the world during the next two decades.
The LNG-to-Power Independent Power Producer Procurement Programme (IPPPP) underway in South Africa is also providing a framework for similar projects that may be ideal for deploying floating solutions. Closed-cycle gas turbine projects in Richards Bay and the Coega Industrial Development Zone are slated to add up to 3,000 MW of power capacity. Both ports will be equipped with LNG import and regasification facilities. Existing transmission infrastructure
INTERNATIONAL MARKET DYNAMICS

8 | 2017 STRATEGIC DIRECTIONS: NATURAL GAS INDUSTRY REPORT | BV.COM
and the need to move new power supply are important factors for each project site’s generation and storage elements.
From a technology perspective, the installation of an FSRU should be considered at both sites. Floating applications in South Africa can reduce execution and startup time, mitigate siting constraints and allow for the shipment of gas to multiple locations. Business decisions must be carefully weighed, and sound planning and implementation, supported by proven project controls and management, can enable gas to become a more prominent, economically viable energy source for South Africa.
OVERCOMING BARRIERS IN SOUTHEAST ASIA: INDONESIA
For island nations such as Indonesia, planning for integrated LNG receiving terminals and gas-fired generation can help balance energy portfolios and meet environmental regulations. More LNG infrastructure will need to be developed to meet these objectives and increase access to gas supply across the country. As in Puerto Rico and Brazil, Indonesia could gain from co-locating LNG and power infrastructure, but such projects will require additional planning considerations, collaboration with local governments and engagement with nontraditional stakeholders for successful deployment.
LNG oversupply throughout Asia has changed dynamics in the region, encouraging buyers to renegotiate long-term contracts and boosting spot trade. In Indonesia, this has strengthened
the case for smaller and more distributed LNG receiving terminals for combined-cycle generation. Unlike landlocked areas, co-located facilities in Indonesia can use and share heat, water and cold energy. The power plant can work as a “sink” for the LNG cold produced in the vaporization process. As a result, less seawater would be needed to regasify LNG, thereby reducing capital, operating costs and impacts to the environment while boosting the available output from the power plant. Investors need to plan strategically for these integrated projects to overcome barriers, lessen risks and bring plans to final investment decisions. A recent memorandum of understanding has been signed to provide LNG imports to Bangladesh, reinforcing the importance of increasing investment in LNG infrastructure in Indonesia.
Markets in nearly every continent are looking to use natural gas power to diversify energy portfolios and support economic development. The viability of LNG from a price perspective incentivizes nations that run solely on fuel oil or that have limited existing infrastructure for fossil fuels. For long-term deployment success, developing projects will need to consider both the economics of converting power generation from fuel oil to LNG, and evolving global trade trends.
INTERNATIONAL MARKET DYNAMICS

9 | 2017 STRATEGIC DIRECTIONS: NATURAL GAS INDUSTRY REPORT | BV.COM
International Market DynamicsHURRICANES HARVEY AND IRMA: IMPACTS TO U.S. OIL AND GAS SECTOR
By Denny Yeung
On August 25, 2017, Hurricane Harvey (a Category 4 storm) made landfall on the southern Texas coast as one of the most damaging storms to hit one of the United States’ largest cities. What followed was catastrophic flooding that affected millions of Gulf Coast residents, businesses and the overall energy market. The true impact to the region’s vital oil and gas markets is still unfolding, but the disaster has raised concerns about gas pricing spikes, refinery operations and network resilience.
HARVEY SLOWS PRODUCTION, GAS PRICES RISE
Hurricane Harvey caused moderate and temporary reductions to Texas Gulf Coast onshore and offshore production. As the hurricane approached, offshore platforms in the path were evacuated, and onshore production activities were halted, leading to a decline in gas supplies. During the last week of August, offshore Gulf of Mexico production was reduced by approximately 21 percent, or 700 million cubic feet per day (MMcf/d), when compared to the prior week. Onshore conventional production along the Texas Gulf Coast over the same period also declined by approximately 8 percent, or 96 MMcf/d. Further inland, the Eagle Ford Shale saw a temporary 10 percent reduction, or approximately 450 MMcf/d, across the dry, associated and wet windows.
Natural gas consumption along the Texas Gulf Coast also was affected by temporary declines in power generation and pipeline exports to Mexico. Fortunately, Hurricane Harvey ushered in a few days of cooler weather, reducing gas demand for power generation
Denny Yeung is a Principal at Black & Veatch with expertise in natural gas fundamental market analysis, asset valuation and financial analysis. As the interstate pipeline market lead, he has led detailed modeling of fundamentals factors in the North American natural gas market and assessments of price impacts.
INTERNATIONAL MARKET DYNAMICS

10 | 2017 STRATEGIC DIRECTIONS: NATURAL GAS INDUSTRY REPORT | BV.COM
by 1.0 billion cubic feet per day (Bcf/d). Gulf Coast pipelines saw several force majeure declarations that reduced gas pipeline exports to Mexico, where some of those gas supplies were redirected to Southeast markets.
Regional Texas Gulf Coast gas prices in the Houston Ship Channel, Katy hub and Agua Dulce rose temporarily for a few days before falling back to the weekly average. While crude oil prices have remained unaffected, gasoline and diesel prices steadily have risen. Gulf Coast Ultra-Low Sulfur No. 2 diesel spot prices rose from $1.58/gallon prior to the arrival of Hurricane Harvey to $1.72/gallon over the following two weeks.
HURRICANE IRMA CHALLENGES ENERGY RESILIENCE IN SOUTH FLORIDA
Just a few weeks later, on September 10, 2017, Hurricane Irma made landfall in South Florida, bringing powerful hurricane-force winds and extensive flooding. The natural disaster led to a power outage that impacted more than 90 percent of Florida residents in the region. Diminished gas demand for power generation in Florida and the Southeast lasted for roughly seven to 10 days, as electric utilities began restoring power to homes.
The ability to restore power to residents in a relatively short amount of time reflects, in part, improvements in crisis management and significant infrastructure investments made in the last decade. With limited supply and pipeline disruptions, the oil and gas industry has made strong efforts to improve on its response to natural disasters and its use of evolving technologies to identify problems and engage with customers.
HARVEY AND IRMA MARKET IMPACTS
Hurricane Harvey’s impact on overall energy markets has been limited, as natural gas production and consumption have steadily recovered after the passing of the storm. The diminished proportion of offshore Gulf of Mexico production, coupled with onshore shale gas production growth, has played a role in reducing current price impacts compared to previous natural disasters such as Hurricane Katrina. Further, taking lessons learned post-Katrina, the natural gas industry has made significant strides to improve safety and crisis management during natural disasters. The muted impacts of Hurricanes Harvey and Irma on the oil and gas market exemplify how far the industry has come in supporting infrastructure resilience and reliable supply.
INTERNATIONAL MARKET DYNAMICS
The ability to restore power to residents in a relatively short amount of time reflects, in part, improvements in crisis management and significant infrastructure investments made in the last decade.
11 | 2017 STRATEGIC DIRECTIONS: NATURAL GAS INDUSTRY REPORT | BV.COM
International Market DynamicsNATURAL GAS POISED TO UNLOCK LATIN AMERICA POWER PROSPECTS
By Joe Farach and Karina Sevcik Gabaldon
Latin America’s rising demand for natural gas presents broad opportunities across the industry. While these opportunities may be most acutely present in Mexico — where a steadily growing economy is catalyzing soaring natural gas imports from the United States — conditions across the region reflect positive trends for U.S. producers and midstream players. Emerging markets are eager to tap U.S. supplies and seize on natural gas’s potential as a low cost, reliable and cleaner power generation source.
Meeting these market demands goes beyond delivering rapidly growing supply to countries and regions such as Mexico, Brazil, Chile or the Caribbean. Organizations increasingly are considering the opportunity to support the transition toward liquefied natural gas (LNG)-based power alternatives. Too often, however, those aspirations are challenged by insufficient infrastructure and investment, economic instability and inadequate regulatory frameworks.
Recent reform and a shift in economic and energy policy in Mexico, Brazil and Argentina are attracting foreign investment and development. International firms are teaming to develop the entire energy project, from LNG import and regasification terminals to electricity generation in an “all-in-one” approach that addresses the internal LNG demand among users (power plants) along with the necessary importing infrastructure.
Joe Farach is Director of Business Development for Black & Veatch’s oil & gas business. He has 30 years of international experience in the gas, process and capital goods industries. His experience also includes starting and running subsidiaries in Eastern Europe and Latin America.
Karina Sevcik Gabaldon is a Process Engineer for Black & Veatch’s oil & gas business. She has technical experience working on several projects in the oil and gas industry, specifically in gas processing and liquefied natural gas applications. Gabaldon also supports business development in the Latin America region.
INTERNATIONAL MARKET DYNAMICS
12 | 2017 STRATEGIC DIRECTIONS: NATURAL GAS INDUSTRY REPORT | BV.COM
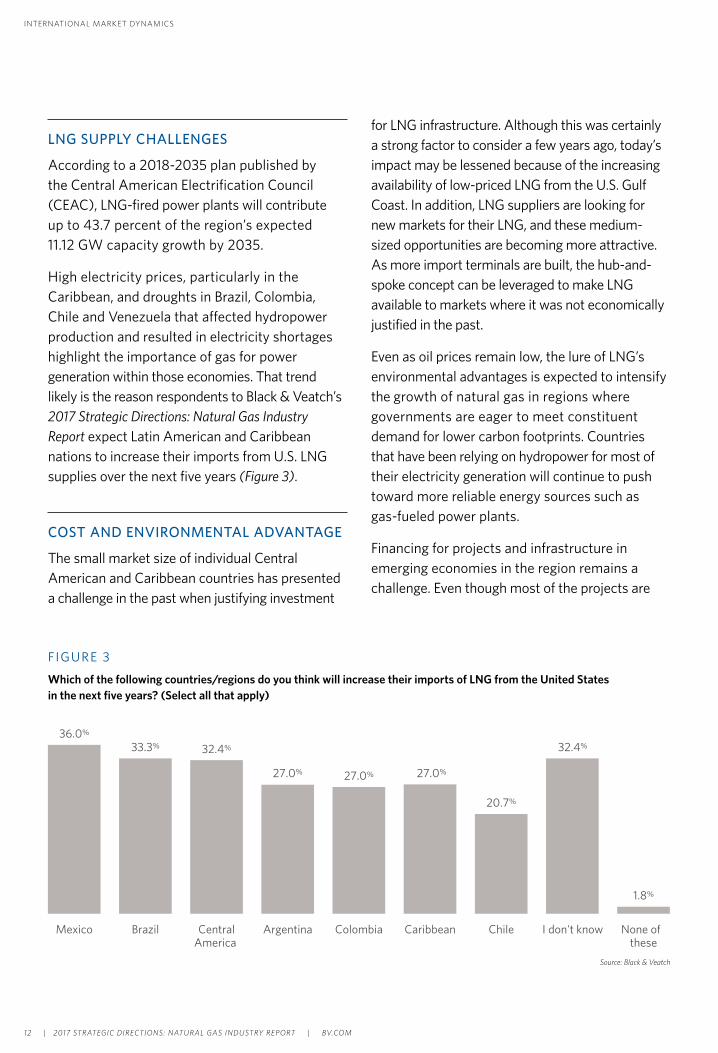
FIGURE 3
Which of the following countries/regions do you think will increase their imports of LNG from the United States in the next five years? (Select all that apply)
36.0%
33.3% 32.4%
27.0% 27.0% 27.0%
20.7%
32.4%
1.8%
Mexico Brazil CentralAmerica
Argentina Colombia Caribbean Chile I don't know None of these
Source: Black & Veatch
LNG SUPPLY CHALLENGES
According to a 2018-2035 plan published by the Central American Electrification Council (CEAC), LNG-fired power plants will contribute up to 43.7 percent of the region’s expected 11.12 GW capacity growth by 2035.
High electricity prices, particularly in the Caribbean, and droughts in Brazil, Colombia, Chile and Venezuela that affected hydropower production and resulted in electricity shortages highlight the importance of gas for power generation within those economies. That trend likely is the reason respondents to Black & Veatch’s 2017 Strategic Directions: Natural Gas Industry Report expect Latin American and Caribbean nations to increase their imports from U.S. LNG supplies over the next five years (Figure 3).
COST AND ENVIRONMENTAL ADVANTAGE
The small market size of individual Central American and Caribbean countries has presented a challenge in the past when justifying investment
for LNG infrastructure. Although this was certainly a strong factor to consider a few years ago, today’s impact may be lessened because of the increasing availability of low-priced LNG from the U.S. Gulf Coast. In addition, LNG suppliers are looking for new markets for their LNG, and these medium-sized opportunities are becoming more attractive. As more import terminals are built, the hub-and-spoke concept can be leveraged to make LNG available to markets where it was not economically justified in the past.
Even as oil prices remain low, the lure of LNG’s environmental advantages is expected to intensify the growth of natural gas in regions where governments are eager to meet constituent demand for lower carbon footprints. Countries that have been relying on hydropower for most of their electricity generation will continue to push toward more reliable energy sources such as gas-fueled power plants.
Financing for projects and infrastructure in emerging economies in the region remains a challenge. Even though most of the projects are
INTERNATIONAL MARKET DYNAMICS
13 | 2017 STRATEGIC DIRECTIONS: NATURAL GAS INDUSTRY REPORT | BV.COM
relatively small in scale, they still likely would exceed the financial capabilities of the public sector. External financing would be the most likely option, creating opportunities for private sector companies to develop, own and operate the entire project from LNG fuel supply to power generation.
THE GENERATION PLAY
Some organizations are making the leap themselves. AES Corporation signed an agreement with ENGIE late last year to jointly market LNG in the Caribbean from AES’ Andres regasification facility in the Dominican Republic. Most recently, the two companies entered into a joint venture that will utilize AES’ Costa Norte LNG terminal under construction in Colon, Panama, to market LNG in Central America. The AES Costa Norte LNG terminal is being built to supply the 380 MW combined-cycle gas turbine (CCGT) power plant that AES is building.
This concept demonstrates the synergies and growth leverage that are possible when a company builds a gas-fired power plant and LNG regasification terminal then uses the hub-and-spoke concept to market LNG to smaller players. The smaller users now have an opportunity to convert their diesel-fueled power plants to gas. These plants also can operate in dual-fuel mode, which provides price and supply flexibility.
Single development group projects, where a company or joint venture invests, owns and operates the entire power generation concept (power plant and LNG import and regasification terminal), seem to have better chances of success. This means that a company that is traditionally an investor or operator will now assume risks for all aspects of the project. To be successful, project owners leverage the use of external expertise across the power generation and LNG import terminal and regasification sides of the project.
Countries that have been relying on hydropower for most of their electricity generation will continue to push toward more reliable energy sources such as gas-fueled power plants.
INTERNATIONAL MARKET DYNAMICS
14 | 2017 STRATEGIC DIRECTIONS: NATURAL GAS INDUSTRY REPORT | BV.COM
International Market DynamicsFOR FLNG PROJECTS, BIGGER IS NOT ALWAYS BETTER
By Bob Germinder and Javid Talib
Floating liquefied natural gas (FLNG) projects, after years of planning and development, are finally starting to come online and demonstrate the potential for FLNG technology to further global gas trade. LNG liquefaction was named the second most critical infrastructure investment for growth in the natural gas market, according to survey results from the 2017 Strategic Directions: Natural Gas Industry Report, and floating solutions provide a more flexible solution to adding much needed capacity to boost market growth.
The ability to sell offtake gas through floating solutions has attracted the attention of producers and investors alike. Floating applications typically require fewer resources than onshore facilities and have the added capability of being able to be transported to nearly any location. Current market trends point to smaller-scale projects being more profitable in the long-term, but regardless of size, developing a sustainable business model will involve overcoming financing hurdles.
COMMERCIAL VIABILITY KEY TO INVESTMENT DECISIONS
As with any critical infrastructure project, investments will rely on market dynamics that incentivize project development. In this year’s report, low natural gas prices and the ability to build gas infrastructure to serve demand growth were named the top factors that will impact natural gas growth, reflecting the need to create solutions that respond to those dynamics.
Bob Germinder is a Senior Vice President and Managing Director of Floating Oil & Gas Solutions. He established Black & Veatch’s floating LNG business and has an extensive background in managing large, lump sum international projects.
Javid Talib is a Vice President within Black & Veatch’s oil & gas business and Director of Floating Technology Applications. He has 43 years of global project engineering, project management and strategic business development experience including both onshore and offshore projects. Talib has been involved in LNG liquefaction projects since 1998 and helped establish the FLNG Program at Black & Veatch.
INTERNATIONAL MARKET DYNAMICS

15 | 2017 STRATEGIC DIRECTIONS: NATURAL GAS INDUSTRY REPORT | BV.COM
FLNG projects can more quickly move supply to end users versus a traditional onshore facility, which is particularly crucial in the current price environment. With these forces at work, it is not surprising that commercial viability was named the top driver for making FLNG investment decisions, followed by implementation costs and global LNG market trends (Figure 4). These drivers further suggest that cost and speed of delivery are top priorities for investors.
To make projects more commercially viable, developers are partnering with engineering, construction and technology providers that can configure FLNG solutions that assure returns. Black & Veatch’s patented PRICO® process, for instance, can liquefy natural gas easier, faster and more cost-efficiently than traditional technologies. PRICO® has been applied to the Exmar Caribbean FLNG project, which successfully completed performance testing in November 2016. Exmar is currently discussing several deployment opportunities for the supply from this project.
INTERNATIONAL MARKET DYNAMICS
FIGURE 4
What are the major drivers for making FLNG investment decisions? (Select top three)
Commercial viability 48.8%
Implementation costs 38.1%
Global LNG market trends 32.1%
Technology complexity 22.6%
Environmental approvals 17.9%
Health & safety concerns 11.9%
FLNG unit lifespan 11.9%
Monetization of assets 11.9%
Project design 7.1%
Don’t know 22.6%
Source: Black & Veatch
To make projects more commercially viable, developers are partnering with engineering, construction and technology providers that can configure FLNG solutions that assure returns.
16 | 2017 STRATEGIC DIRECTIONS: NATURAL GAS INDUSTRY REPORT | BV.COM
FLNG PROJECTS EVOLVE WITH MARKET
Initial FLNG developments focused on building massive facilities that could move and process large quantities of LNG (5 million tons per annum (mtpa) and up), requiring significant capital investments in the vicinity of $10 billion or more. These commitments could only be afforded by a few independent oil companies and national oil companies who were willing to take on risks associated with still fairly nascent FLNG concepts. The capital expenditure (CAPEX) dollar per ton of production was extremely high at more than $3 billion/mtpa, however, LNG prices were higher a few years ago which made the model seem more economically sound at the time.
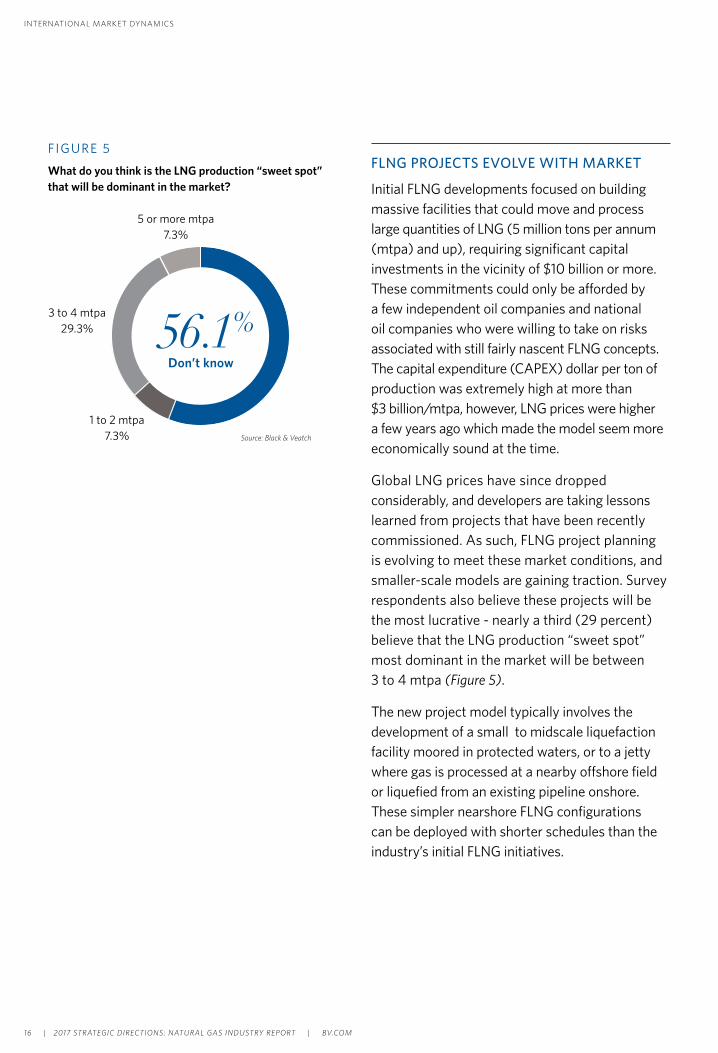
Global LNG prices have since dropped considerably, and developers are taking lessons learned from projects that have been recently commissioned. As such, FLNG project planning is evolving to meet these market conditions, and smaller-scale models are gaining traction. Survey respondents also believe these projects will be the most lucrative - nearly a third (29 percent) believe that the LNG production “sweet spot” most dominant in the market will be between 3 to 4 mtpa (Figure 5).
The new project model typically involves the development of a small to midscale liquefaction facility moored in protected waters, or to a jetty where gas is processed at a nearby offshore field or liquefied from an existing pipeline onshore. These simpler nearshore FLNG configurations can be deployed with shorter schedules than the industry’s initial FLNG initiatives.
FIGURE 5
What do you think is the LNG production “sweet spot” that will be dominant in the market?
56.1%Don’t know
1 to 2 mtpa7.3%
3 to 4 mtpa29.3%
5 or more mtpa7.3%
Source: Black & Veatch
INTERNATIONAL MARKET DYNAMICS
17 | 2017 STRATEGIC DIRECTIONS: NATURAL GAS INDUSTRY REPORT | BV.COM
PHASED APPROACH GAINS TRACTION
Some industry leaders are also taking a new approach to mitigating project risks by developing FLNG solutions in “blocks,” rather than one large CAPEX-heavy megaproject. The phased approach allows developers to build out projects in stages. Instead of taking on a 12 mtpa project, they could start with a 3 mtpa block, generate some revenue, and then construct subsequent phases incrementally thereafter. This approach also makes the solution easier to manage and finance, allows variable sales commitment volumes, and does not force producers to lock in offtakers taking in large LNG volumes before a train could start producing.
Ophir Energy, for example, is awarding contracts for projects phase-by-phase, in case they need to disconnect supply from any of their three vessels. In May 2017, the organization awarded the midstream construction contract for the Fortuna FLNG project which will channel gas from their offshore “block R” development.
PLANNING FOR FUTURE DEMAND
While FLNG solutions continue to advance, the expectation from the industry is that the need for these projects is not expected to abate anytime soon. When asked if the trend to monetize stranded gas reserves with low condensate levels will continue to gain interest given sustained periods of low gas prices, more than a third of respondents (38 percent) agreed that was their expectation.
With sustained low prices and thin margins, FLNG project developers will continue to innovate to stay competitive. For now, the industry is discovering that bigger is not always better, and smaller or mid-size solutions are likely to provide a better return on investment.
The challenging market also demands a new level of flexibility. This includes flexibility in terms of size, with modular facilities that can scale to meet changing production targets. New business models will also continue to drive collaboration as new partnerships, joint ventures and consortiums bring more FLNG projects to life. Flexibility in financing will influence how contracts are structured and enable industry players of all sizes with a comprehensive strategy to be poised to have a competitive edge in the market.
Some industry leaders are also taking a new approach to mitigating project risks by developing FLNG solutions in “blocks,” rather than one large CAPEX-heavy megaproject.
INTERNATIONAL MARKET DYNAMICS

18 | 2017 STRATEGIC DIRECTIONS: NATURAL GAS INDUSTRY REPORT | BV.COM
International Market DynamicsUK ENERGY SECTOR TRANSFORMATION MARKS HISTORIC MILESTONES
By Peter Hughes
In the chronicles of Great Britain’s energy industry, 2017 will go down as a significant year. At a time already characterized by change and uncertainty, two events stand out. One signals a break with the past; the other suggests the shape of things to come.
In April, for the first time ever, Britain’s National Grid ran for 24 hours without any coal-generated power. In September, for the first time ever, the cost of wind power in Britain fell below that of nuclear power.
A “coal-free” day may now seem unsurprising — inevitable even — yet it is easy to overlook its significance until one considers that until relatively recently, coal dominated Britain’s energy mix. In 1974, burning coal generated 80 percent of Britain’s energy. In 2012, that not-too-distant Olympic year, coal still accounted for 40 percent of the country’s energy.
The tail-off in recent years has been more dramatic. In 2016, 9 percent of Britain’s energy came from coal. Today the fuel is cast in a supporting role, called upon mostly at times when demand is high and the weather unfavorable for wind and solar. During the short, cool summer of 2017, under 2 percent of the country’s power was sourced from coal plants; the last of which the UK government wants to close by 2025.
Peter Hughes is Director of Business Development for Black & Veatch Europe. He is responsible for the company’s development strategy, as well as sales and marketing activities in this region. He has extensive experience in gas-fired generation asset construction.
INTERNATIONAL MARKET DYNAMICS

19 | 2017 STRATEGIC DIRECTIONS: NATURAL GAS INDUSTRY REPORT | BV.COM
RENEWABLE ENERGY PROVING MORE ECONOMICAL
In a government auction, two wind arrays — Hornsea Project 2 off the Yorkshire coast and Scotland’s Moray offshore wind farm — secured a guaranteed price for their electricity of £57.50 (US$77.04) per megawatt-hour (MWh). The cost was nearly half the price the government has guaranteed EDF Energy — £92.50 (US$123.93) MWh — for power generated by two new nuclear reactors planned for Hinkley Point C in Somerset.
The wind deals were part of the UK government’s second Contracts-for-Difference (CfD) auction, in which developers compete for projects by bidding the price they would be willing to accept for generating electricity. The auction, for “less-established technologies,” awarded power purchase contracts worth £172 million (US$230.4 million) to renewable energy projects; all of the successful bids were below the MWh price secured by EDF for Hinkley.
The auction led the Economist Intelligence Unit to report that “the trajectory of cheaper renewable technologies is irreversible.” Although last year was the first during which Britain got more energy from wind than coal — 11.5 percent compared to 9.2 percent — a huge capacity gap between coal and renewables remains.
NATURAL GAS TO SERVE AS BRIDGE BETWEEN COAL AND RENEWABLES
With no new nuclear plants due online in the short term, gas offers the logical bridge — for reliable, flexible generation — between coal and renewables.
In the 2016 capacity auction, more than 10 GW of generating capacity — including 9.7 GW from new gas plants — exited the T-4 auction early, signifying gas’s key role in the energy mix. Of the 3.3 GW of new capacity contracted in the T-4 auction, more than half came from a new gas power plant. This comprises just one combined-cycle gas turbine plant, a retrofit to an existing generating station, Centrica’s 333 MW project in King’s Lynn, Norfolk, and 1.5 GW of gas engine and gas turbine projects.
The vast majority of new gas projects to secure capacity contracts were smaller, distributed generation units, such as Centrica’s 50 MW gas-reciprocating plants at Brigg in North Lincolnshire and Peterborough in Cambridgeshire, together with numerous smaller gas engine projects.
Look to Germany if you want a further sign that Britain’s need for gas power stations remains strong.
Christopher Delbrück, Chief Financial Officer of the German utility Uniper, said, “It may be worth it to disassemble some of the [German gas] plants and to rebuild them in Great Britain.” He added, “In a couple of years I think taking stakes in new gas power stations in Great Britain is a possibility.”
At a time characterized by change, uncertainty and Brexit, this is a strong signal that rumors of gas’s demise are greatly being exaggerated. Flexible, highly efficient new combined-cycle gas turbine (CCGT) plants can be built much more cheaply and quickly than nuclear power plants. What we expect to see is not a dash for gas, but a steady route march, and we are under starter’s orders.
INTERNATIONAL MARKET DYNAMICS

20 | 2017 STRATEGIC DIRECTIONS: NATURAL GAS INDUSTRY REPORT | BV.COM
Sustainable OperationsNATURAL GAS MARKET: STRENGTHENING FOUNDATIONS FOR LONG-TERM GROWTH
By Deepa Poduval
The dominant sentiment within the natural gas industry is that the current low price environment is likely here to stay. Throughout the value chain, industry players who were once awaiting a market recovery are now taking a different, but more holistic, view on planning for the future: a view that is focused on optimizing current assets, rightsizing workforces and incorporating cost-cutting measures.
The 2017 Strategic Directions: Natural Gas Industry Report survey found that low gas prices and price stability were among the top five issues and/or challenges related to the natural gas market, along with economic/demand growth, gas supply reliability, environmental regulation, and rate and regulatory certainty (Figure 6).
Deepa Poduval is a Senior Managing Director and Black & Veatch management consulting’s Oil & Gas industry leader. She provides strategic, economic and fundamental market advisory services to producers; midstream entities including those with pipeline, storage and liquefied natural gas assets; utilities; project developers; financial institutions and sovereigns.
SUSTAINABLE OPERATIONS
FIGURE 6
Please rate the importance of each of the following issues and/or challenges related to the natural gas market. (Choose from a scale of 1-5; 5 = very important)
Economic/demand growth
Low gas prices and price stability
Gas supply reliability
Environmental regulation
Rate and regulatory certainty
Regulations (other than environmental)
Electric-gas interdependency
Competition from new technologies
Access to international markets
Industry consolidation through M&A
4.30
4.10
4.10
4.10
4.00
3.90
3.90
3.80
3.50
3.40
Source: Black & Veatch

21 | 2017 STRATEGIC DIRECTIONS: NATURAL GAS INDUSTRY REPORT | BV.COM
In this year’s survey, one of the most dramatic shifts from previous years is the expectation for global crude oil prices between now and 2020. Of natural gas industry respondents, nearly half expect prices to be between $40 to $50 per barrel. This is in stark contrast to 2016 results, where only 7 percent listed this price range as their expectation. Last year, more than half of survey participants indicated their expectations for crude oil prices to be between $51 and $70 per barrel (Figure 7). In another striking contrast, whereas about a quarter of the respondents in 2016 indicated price expectations above $70 per barrel, less than 2 percent of respondents indicated this level of optimism about crude oil prices in 2017.
One significant factor affecting industry expectations of oil prices stems from the effect, or lack thereof, of production quota cuts implemented by the Organization of the Petroleum Exporting Countries (OPEC). OPEC’s low cost of production and significant spare capacity historically have allowed it to be effective in moderating crude oil price movements. In last year’s report, more than one-third (38 percent) of industry respondents indicated that
FIGURE 7
Expectation of global crude oil prices between now and 2020 (natural gas industry respondents only)
■ 2015 ■ 2016 ■ 2017
Less than $40/bbl
Between $40-$50/bbl
Between $51-60/bbl
Between $61-70/bbl
Between $71-80/bbl
Greater than $80/bbl
Don’t know
0.5%
2.6%
4.9%
6.8% 7.2%
48.9%
11.5%
24.1%
29.2%
18.0%
31.6%
5.7%
27.8%
14.7%
1.9%
20.6%8.5%
0.0%
14.8%
11.4%
9.5%
Source: Black & Veatch
SUSTAINABLE OPERATIONS
In last year’s report, more than one-third (38 percent) of industry respondents indicated that OPEC strategy would have the most effect on oil prices between 2016 and 2018, signaling the perceived importance then of OPEC’s influence on prices.

22 | 2017 STRATEGIC DIRECTIONS: NATURAL GAS INDUSTRY REPORT | BV.COM
The United States’ budding role as a major producer is reshaping global natural gas trade.
SUSTAINABLE OPERATIONS

23 | 2017 STRATEGIC DIRECTIONS: NATURAL GAS INDUSTRY REPORT | BV.COM
OPEC strategy would have the most effect on oil prices between 2016 and 2018, signaling the perceived importance then of OPEC’s influence on prices.
In late 2016 through this year, OPEC member countries came to an agreement to undertake supply cuts in an effort to rebalance the market and support higher prices. After a period of sustaining their production at high levels to protect market share which saw crude oil prices plummeting below $30 per barrel, the cartel’s agreement to curb production was considered an important measure to bolster prices.
However, U.S. shale oil producers who survived the price crash of 2014 made significant technological and process investments, lowering their marginal cost of supply. As prices initially rose with OPEC’s production cuts and stabilized in the $50 to $55 per barrel range, these U.S. shale producers ramped up their drilling programs and rapidly increased supply, diminishing the impact of OPEC’s production cuts and curtailing any further price increases.
Given this fundamental market shift driven by the availability of significant supply of U.S. shale oil resources and lower prices, OPEC’s control of market supply and its ability to sustain higher oil prices has been greatly weakened.
MAXIMIZING ASSETS, MINIMIZING COSTS
With prices not expected to change drastically in the coming years, organizations throughout the oil and gas value chain are being tasked with creating long-term strategies for managing operations in a challenging environment. Industry leaders are focusing on finding operational efficiencies, divesting noncore assets and comprehensively strengthening their organizational foundations.
Several producers are looking to cut costs by divesting upstream assets and reducing exploratory functions that are not directly tied to growth strategies. Devon Energy, an independent natural gas, natural gas liquids and petroleum producer, for example, recently announced plans to divest $1 billion in assets “to further strengthen its investment-grade financial position.”
Maximizing performance from current assets was listed by 65 percent of survey respondents as the highest priority within organizations to maintain stable earnings. Solid asset management strategies increasingly are a focus area facilitating long-term efficiency, safety and cost reduction. Asset data analytics, for example, is allowing operators to automate and optimize asset maintenance and reduce redundancies. As many firms look to streamline their workforces, automation also can help consolidate roles and responsibilities that were once only performed manually.
While asset performance monitoring is helping to decrease operational costs, one of the key drivers for adopting smart technologies is safety which, for the sixth year in a row, was named the most important issue for the natural gas industry overall. The natural gas industry faces increasing regulatory pressure driven by safety concerns to monitor and manage its assets. The dynamic social and business climate of the 21st century means effective decision-making will increasingly rely on asset intelligence. Historically poor recordkeeping and inconsistent quality of asset data cannot meet the challenge.
Regulators, both on the federal and local levels, now are mandating the types of data on natural gas-related assets that need to be collected and analyzed. To comply with regulations and increase transparency, natural gas companies require flexible asset data acquisition and management
SUSTAINABLE OPERATIONS
24 | 2017 STRATEGIC DIRECTIONS: NATURAL GAS INDUSTRY REPORT | BV.COM
solutions designed to supplement, rather than replace, current company systems and provide actionable intelligence on asset performance.
DIFFERENT MARKET SEGMENTS, DIFFERENT PRIORITIES
While management of existing assets remains top of mind, new natural gas infrastructure continues to be vital, and nearly three-quarters (72 percent) of survey respondents selected pipeline capacity as one of the most critical infrastructure investments necessary for market growth. When broken down by respondent type, 84 percent of local distribution companies named pipeline capacity a critical investment, along with 71 percent of natural gas organizations (intrastate/interstate pipelines, natural gas processors and producers), signaling the
continued need to move growing supply to end-use consumers. Infrastructure to support growing natural gas demand in Mexico or for moving increasing supply from the Marcellus and Utica shale resources in Pennsylvania and Ohio, for example, are essential for continued growth.
It’s important to note the different perspectives according to where respondents operate in the value chain. Not surprisingly, upstream investments are a higher priority to oil producers. More than half indicated that these were critical investments; over 10 percent more than respondents from any other market segment. While midstream and downstream players may not see these investments as a priority, investments from the private sector in exploration and production will continue to be vital to the market’s long-term growth.
SUSTAINABLE OPERATIONS
25 | 2017 STRATEGIC DIRECTIONS: NATURAL GAS INDUSTRY REPORT | BV.COM
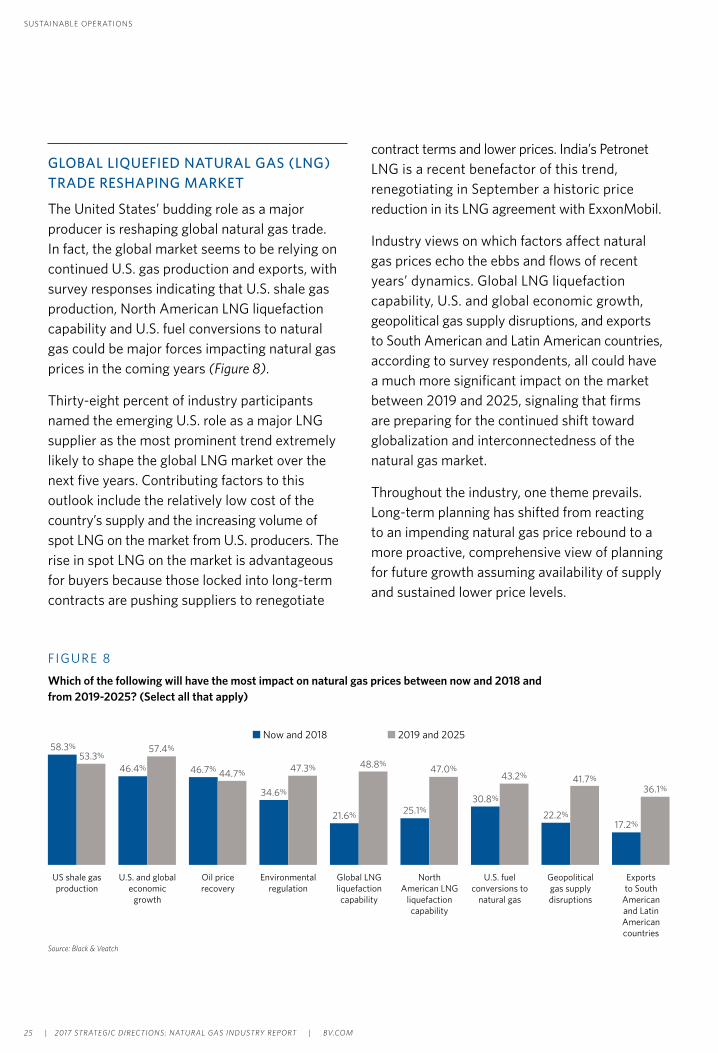
GLOBAL LIQUEFIED NATURAL GAS (LNG)TRADE RESHAPING MARKET
The United States’ budding role as a major producer is reshaping global natural gas trade. In fact, the global market seems to be relying on continued U.S. gas production and exports, with survey responses indicating that U.S. shale gas production, North American LNG liquefaction capability and U.S. fuel conversions to natural gas could be major forces impacting natural gas prices in the coming years (Figure 8).
Thirty-eight percent of industry participants named the emerging U.S. role as a major LNG supplier as the most prominent trend extremely likely to shape the global LNG market over the next five years. Contributing factors to this outlook include the relatively low cost of the country’s supply and the increasing volume of spot LNG on the market from U.S. producers. The rise in spot LNG on the market is advantageous for buyers because those locked into long-term contracts are pushing suppliers to renegotiate
contract terms and lower prices. India’s Petronet LNG is a recent benefactor of this trend, renegotiating in September a historic price reduction in its LNG agreement with ExxonMobil.
Industry views on which factors affect natural gas prices echo the ebbs and flows of recent years’ dynamics. Global LNG liquefaction capability, U.S. and global economic growth, geopolitical gas supply disruptions, and exports to South American and Latin American countries, according to survey respondents, all could have a much more significant impact on the market between 2019 and 2025, signaling that firms are preparing for the continued shift toward globalization and interconnectedness of the natural gas market.
Throughout the industry, one theme prevails. Long-term planning has shifted from reacting to an impending natural gas price rebound to a more proactive, comprehensive view of planning for future growth assuming availability of supply and sustained lower price levels.
SUSTAINABLE OPERATIONS
58.3%
46.4% 46.7%
34.6%
21.6% 25.1%30.8%
22.2%17.2%
53.3%57.4%
44.7% 47.3% 48.8%47.0%
43.2% 41.7%
36.1%
■ Now and 2018 ■ 2019 and 2025
US shale gas production
U.S. and global economic
growth
Oil price recovery
Environmental regulation
Global LNG liquefaction capability
North American LNG
liquefaction capability
U.S. fuel conversions to
natural gas
Geopolitical gas supply disruptions
Exports to South
American and Latin American countries
FIGURE 8
Which of the following will have the most impact on natural gas prices between now and 2018 and from 2019-2025? (Select all that apply)
Source: Black & Veatch

26 | 2017 STRATEGIC DIRECTIONS: NATURAL GAS INDUSTRY REPORT | BV.COM
Sustainable OperationsECONOMICS REMAIN DRIVING FORCE FOR DOWNSTREAM SECTOR TRENDS
By Michael Goff
Lower gas prices are driving investment across the sector as the industry hedges its bets on market recovery. Continuing flat demand has caused a stalemate across the industry, and most natural gas utilities remain in waiting mode. Nevertheless, the industry is looking ahead. It is expecting demand to shift and prices to eventually rise, and utilities are working to keep their assets running and maintain the systems currently in place.
INVESTING IN EFFICIENCY, RELIABILITY
Many in the industry are taking advantage of this breathing room to analyze their systems and plan strategically for when the market recovers. Efficiency is a major focus; this year’s Strategic Directions: Natural Gas Industry Report survey results show that nearly half of respondents (47 percent) are considering increasing investments in this area to remain competitive when the market recovers. Focusing on aging assets and efficiency while prices are down is a wise move, especially for an industry where most domestic facilities were built in the late 1960s and early 1970s, and outdated infrastructure is a well-known challenge.
Michael Goff is a Technology Manager for Black & Veatch’s oil & gas business. His responsibilities include ensuring appropriate technologies are applied to projects to provide commercial advantages to clients. His expertise includes gasification, syngas processing, ammonia, urea, methanol, dimethyl ether, gas-to-liquids and alternative energy resources.
SUSTAINABLE OPERATIONS

27 | 2017 STRATEGIC DIRECTIONS: NATURAL GAS INDUSTRY REPORT | BV.COM
SUSTAINABLE OPERATIONS
Reliability ranks second to efficiency, with 24 percent of respondents considering increasing investments in reliability to remain competitive. Increasing capacity ranked a close third, with 23 percent looking to expand their facilities, while 16 percent are looking to diversify production by expanding into other products that can be made from natural gas. Nearly one-third (31 percent) have no plans to invest in any of the above (Figure 9).
STRATEGIES FOR STRANDED GAS
Stranded gas — remote natural gas that has been discovered, yet remains inaccessible because of economic or logistical issues or pipeline standards — is a global issue. According to a 2013 U.S. Department of the Interior report, the estimated amount of stranded gas in gas fields alone totals 2,612 trillion cubic feet, with about 60 percent located in onshore stranded gas fields, and the remainder offshore. Companies, therefore, continue to invest in new ways to utilize and transport this abundant resource (Figure 10).
Survey results show that the industry sees building pipelines (32 percent) and investing in LNG (27 percent) as the most economical ways to move stranded gas. New pipeline infrastructure would be the most efficient and cheapest method to move gas a short distance, while LNG would be better for longer distances.
Advanced technologies such as gas-to-liquids (GTL) also offer a possible solution to monetize stranded gas. Ten percent of survey respondents see GTL as a viable option to move stranded gas. Granted, it requires a higher capital cost, but it would result in a higher value product. A similar number of respondents (9 percent) see methanol as the best option, while 6 percent consider flare, a process that increasingly is being restricted by regulations, to be the most economical.
F IGURE 9
Which of the following is your organization considering due to lower natural gas prices? (Select all that apply)
47.0%
24.1% 22.9%
15.7%
31.3%
Increased efficiency
investments
Increased reliability
investments
Increasing plant
capacity
Diversifying to produce
other products
from natural gas
None of the above
Source: Black & Veatch
FIGURE 10
In your opinion, what is the most economical use for stranded gas?
32.0%Build pipeline
LNG 27.0%
Gas to liquids (GTL) 10.0%
Methanol 9.0%
Flare 6.0%
Ammonia, DME or other 16.0%
Source: Black & Veatch

28 | 2017 STRATEGIC DIRECTIONS: NATURAL GAS INDUSTRY REPORT | BV.COM
ECONOMICS DRIVE BIOMASS OPTION
An increasingly interesting trend, one well worth monitoring, is the production of gas or other products from renewable biomass resources. Although the majority of respondents do not plan to use biomass resources, one-third (33 percent) say they are considering it. Of those respondents, approximately half see economics as the primary driver (Figure 11).
This is no surprise, given the Environmental Protection Agency’s (EPA’s) credit system. In 2005, the EPA mandated that fuel blenders add renewable fuels or purchase renewable identification numbers (RINs) on the open market. According to the EPA’s Renewable Fuel Standard (RFS) Program, RINs are credits used for compliance and serve as “the ‘currency’ of the RFS program.”
Similar to the carbon credit system, producers who do not meet this mandate have the option of purchasing a RIN from another producer. Biomass qualifies under this mandate, and it’s fair to estimate that up to 75 percent of the revenue from a gallon of renewable fuel could be derived from RINs.
The remaining respondents who are considering biomass see it as a potential solution to meeting internal sustainability goals and regulatory needs, while the remaining 4 percent see it as a valuable marketing and/or public relations initiative.
While traditional players are considering biomass, interest seems to be blossoming among project developers. Considering the benefits at hand — both economic as well as environmental — producers might be well served to weigh their options and consider diversification.
FIGURE 11
If your organization is considering producing gas or products from renewable biomass resources, what is the primary driver for doing so?
Regulatory 6.2%
Internal sustainability
goals 6.2%
Economics 17.3%
Marketing/branding 3.7%
66.7%None, we aren’t
considering renewable resources
SUSTAINABLE OPERATIONS

29 | 2017 STRATEGIC DIRECTIONS: NATURAL GAS INDUSTRY REPORT | BV.COM
Balance new renewable energy with gas as a hedge against
potential price increases
Add gas-fired resources regardless of future natural gas pricing
Add only renewable energy resources
Utilize transmission upgrades, or other non-generation means
Other
Don’t know
27.2%
11.1%
16.0%
8.6%
3.7%
33.3%
Sustainable OperationsBALANCING MODERN POWER: THE CONVERGENCE OF NATURAL GAS AND THE ELECTRIC MARKET
By Roger Lenertz and Lou Graving
One might think the proliferation of renewables would spell the demise of natural gas, but market leaders know that gas-fired generation will continue to play an important role even as an influx of renewable energy reshapes the American power landscape.
Clean-burning, cost-effective and reliable — the benefits of natural gas are undeniable. Amid the decline of coal and the increased integration of solar and wind power, providers will continue to see value in gas-fired generation, especially when it comes to backstopping renewable energy.
Survey results support this view, with nearly one-third of respondents (27 percent) planning to balance new renewable energy with gas resources (Figure 12).
Roger Lenertz is an Executive Vice President and the Director of Power Generation Services/Renewable Energy for Black & Veatch’s power business. Lenertz has extensive experience in the power industry on domestic and international projects utilizing various technologies.
Lou Graving is a Vice President and Director of Global Solution Development for Black & Veatch’s renewable energy business. He is responsible for pursuing and capturing major projects, project delivery innovation, strategic resource alignment with growth markets and operational efficiency.
Source: Black & Veatch
SUSTAINABLE OPERATIONS
FIGURE 12
As it relates to the potential addition of a gas-fired generation, how does your organization plan on responding to potential capacity needs over the next five to 10 years?
30 | 2017 STRATEGIC DIRECTIONS: NATURAL GAS INDUSTRY REPORT | BV.COM
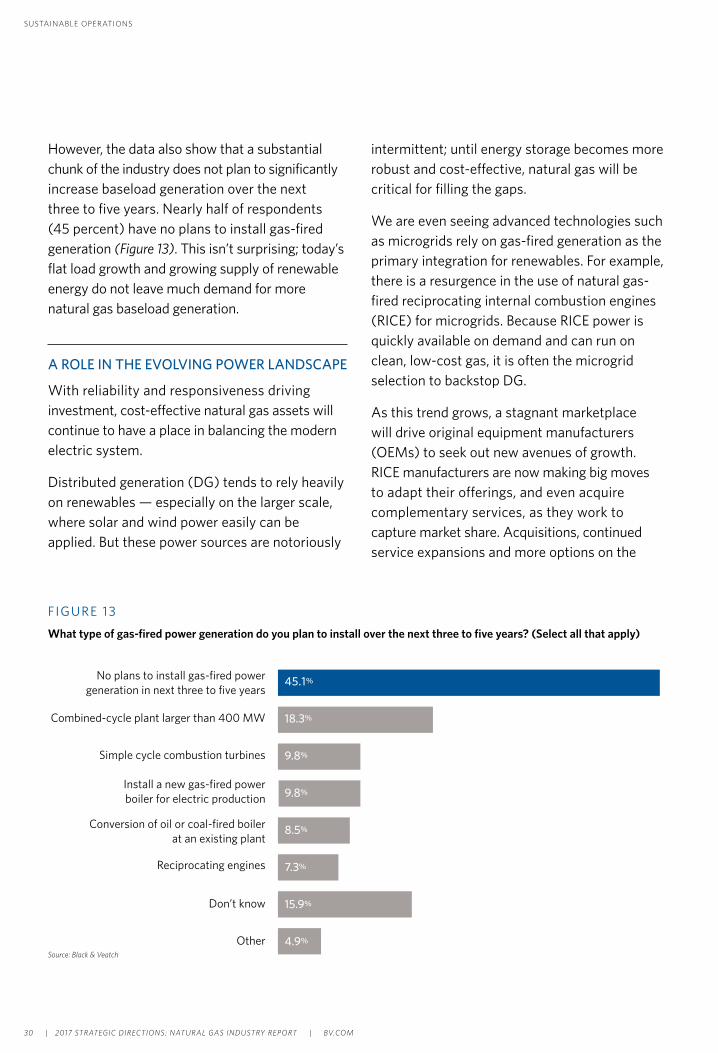
However, the data also show that a substantial chunk of the industry does not plan to significantly increase baseload generation over the next three to five years. Nearly half of respondents (45 percent) have no plans to install gas-fired generation (Figure 13). This isn’t surprising; today’s flat load growth and growing supply of renewable energy do not leave much demand for more natural gas baseload generation.
A ROLE IN THE EVOLVING POWER LANDSCAPE
With reliability and responsiveness driving investment, cost-effective natural gas assets will continue to have a place in balancing the modern electric system.
Distributed generation (DG) tends to rely heavily on renewables — especially on the larger scale, where solar and wind power easily can be applied. But these power sources are notoriously
intermittent; until energy storage becomes more robust and cost-effective, natural gas will be critical for filling the gaps.
We are even seeing advanced technologies such as microgrids rely on gas-fired generation as the primary integration for renewables. For example, there is a resurgence in the use of natural gas-fired reciprocating internal combustion engines (RICE) for microgrids. Because RICE power is quickly available on demand and can run on clean, low-cost gas, it is often the microgrid selection to backstop DG.
As this trend grows, a stagnant marketplace will drive original equipment manufacturers (OEMs) to seek out new avenues of growth. RICE manufacturers are now making big moves to adapt their offerings, and even acquire complementary services, as they work to capture market share. Acquisitions, continued service expansions and more options on the
FIGURE 13
What type of gas-fired power generation do you plan to install over the next three to five years? (Select all that apply)
No plans to install gas-fired power generation in next three to five years
Combined-cycle plant larger than 400 MW
Simple cycle combustion turbines
Install a new gas-fired power boiler for electric production
Conversion of oil or coal-fired boiler at an existing plant
Reciprocating engines
Don’t know
Other
45.1%
18.3%
9.8%
9.8%
8.5%
7.3%
15.9%
4.9%
Source: Black & Veatch
SUSTAINABLE OPERATIONS
31 | 2017 STRATEGIC DIRECTIONS: NATURAL GAS INDUSTRY REPORT | BV.COM
technological side will take place as OEMs fight to claim market share and more players move into the market.
As this continues, OEMs can expect to encounter new challenges as they realign their business objectives and move into the renewable energy integration and engineering, procurement and construction spaces.
CONTINUING UNCERTAINTY AND A NEED FOR REGULATION
The survey pointed to uncertainty within the industry due to a rapidly evolving marketplace and a murky regulatory landscape. Respondents are struggling to understand what is going to become mainstream and where they should invest capital.
There are so many unknowns that Black & Veatch has been working directly with traditional utility clients to develop tailored solutions. The company’s technology-agnostic stance and big-picture mentality means that our professionals provide customized support, allowing clients from across the spectrum — from utilities to independent power producers to OEMs — to focus on what they do best.
Where will natural gas have a strong play as we continue to move forward into a world of renewable energy and microgrids?
Black & Veatch recently helped American Electric Power (AEP), Duke and Alliant by providing insight into technology trends, marketplace experience and collaborating in new business plays.
UNDERSTANDING THE INTERPLAY OF MICROGRIDS
Another example of an industry challenge is understanding the addition, integration and implementation of microgrids. As discussions of the applicability of microgrids have increased, it is clear that the industry doesn’t have a universal definition or overall understanding of their impact. Is a microgrid anything that can be islanded? Or is it something more?
There is a clear need to better define microgrids across the industry, which also would serve as the first step in modifying the regulations to allow traditional power generation providers to recover microgrid costs. Regulations usually dictate who should pay for what, and what’s legal to recover, but those regulations do not align with today’s DG landscape.
Regulations will help determine the path forward for natural gas as it continues to integrate with renewable energy and advanced technologies. In short, the regulations need to catch up; until that happens, uncertainty will continue to run roughshod over the industry.
SUSTAINABLE OPERATIONS
Where will natural gas have a strong play as we continue to move forward into a world of renewable energy and microgrids?

32 | 2017 STRATEGIC DIRECTIONS: NATURAL GAS INDUSTRY REPORT | BV.COM
Sustainable OperationsOIL AND GAS ASSET DATA QUALITY AND ASSET INTEGRITY
By David Price
From the HAL 9000’s chilling psychosis to the world-ending artificial intelligence at the heart of the Terminator franchise, the movie industry has created a perception that data-driven computing is a heartless force singularly focused on results. Yet it is this singular focus that is critical to understanding the challenge facing the natural gas value chain when it comes to enterprise asset data quality. Today’s approaches to managing application data do not provide the high-quality foundation necessary to drive new insights into improving operations, regardless of how much we may wish for it.
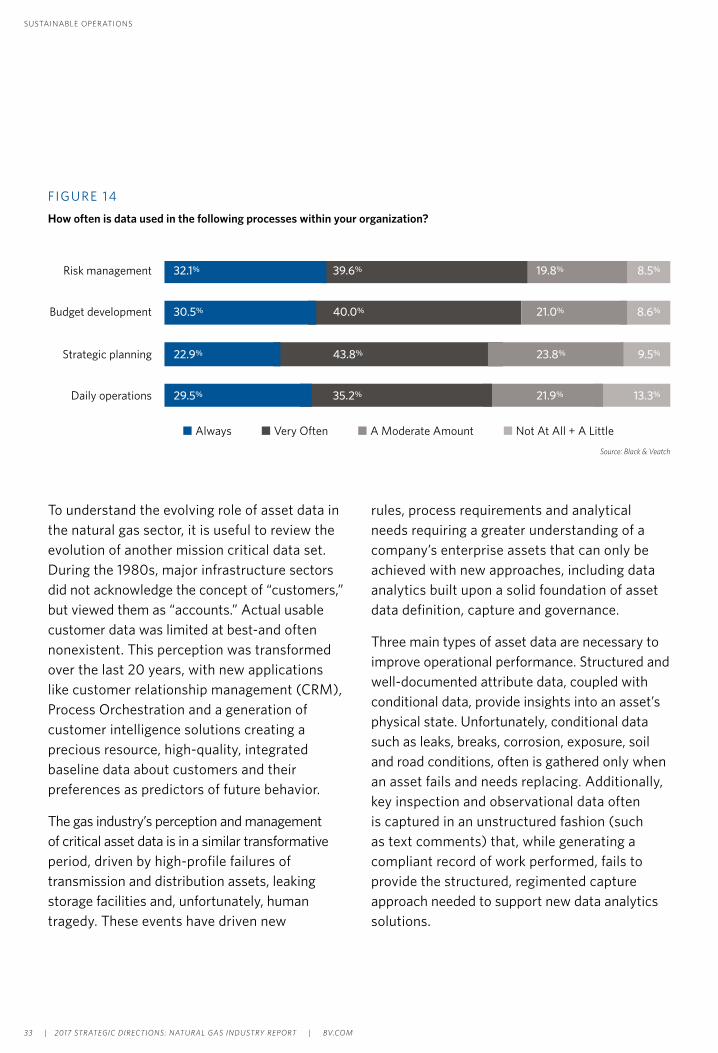
For more than a decade, risk-based approaches to asset management have been gaining prevalence across the utility space. Yet less than one-third of respondents use data to manage risk, with other key management functions like budgeting, strategic planning and daily operations even less reliant on data (Figure 14). This is despite current state and federal regulatory pressures pushing a drive to differentiate, quantify and improve asset data across the organization.
David Price an Associate Vice President and Chief Technology Officer for Black & Veatch management consulting. He has more than 25 years of management, strategy, product development, delivery and operational experience in the utility consulting, systems integration and software industry, specializing in the creation and delivery of large-scale, complex business solutions.
SUSTAINABLE OPERATIONS
33 | 2017 STRATEGIC DIRECTIONS: NATURAL GAS INDUSTRY REPORT | BV.COM
FIGURE 14
How often is data used in the following processes within your organization?
Risk management 32.1% 39.6% 19.8% 8.5%
Budget development 30.5% 40.0% 21.0% 8.6%
Strategic planning 22.9% 43.8% 23.8% 9.5%
Daily operations 29.5% 35.2% 21.9% 13.3%
n Always n Very Often n A Moderate Amount n Not At All + A Little
To understand the evolving role of asset data in the natural gas sector, it is useful to review the evolution of another mission critical data set. During the 1980s, major infrastructure sectors did not acknowledge the concept of “customers,” but viewed them as “accounts.” Actual usable customer data was limited at best-and often nonexistent. This perception was transformed over the last 20 years, with new applications like customer relationship management (CRM), Process Orchestration and a generation of customer intelligence solutions creating a precious resource, high-quality, integrated baseline data about customers and their preferences as predictors of future behavior.
The gas industry’s perception and management of critical asset data is in a similar transformative period, driven by high-profile failures of transmission and distribution assets, leaking storage facilities and, unfortunately, human tragedy. These events have driven new
rules, process requirements and analytical needs requiring a greater understanding of a company’s enterprise assets that can only be achieved with new approaches, including data analytics built upon a solid foundation of asset data definition, capture and governance.
Three main types of asset data are necessary to improve operational performance. Structured and well-documented attribute data, coupled with conditional data, provide insights into an asset’s physical state. Unfortunately, conditional data such as leaks, breaks, corrosion, exposure, soil and road conditions, often is gathered only when an asset fails and needs replacing. Additionally, key inspection and observational data often is captured in an unstructured fashion (such as text comments) that, while generating a compliant record of work performed, fails to provide the structured, regimented capture approach needed to support new data analytics solutions.
Source: Black & Veatch
SUSTAINABLE OPERATIONS

34 | 2017 STRATEGIC DIRECTIONS: NATURAL GAS INDUSTRY REPORT | BV.COM
While developing a comprehensive vision of system assets is broadly a goal of service providers, survey responses show that much work needs to be done.
These analyses are at the heart of future success in identifying trends and opportunities for asset replacement and overall gas network enhancement. While developing a comprehensive vision of system assets is broadly a goal of service providers, survey responses show that
much work needs to be done. While nearly half the respondents claim good quality data, the statistics are undercut by the fact that availability and, more importantly, data completeness, are ranked much lower (Figure 15). Thus, organizations largely report they don’t have critical information they need to provide higher levels of service.
The lack of data completeness and accuracy can be tied to several factors, particularly access to assets and historical records. Unlike customer data, which can be updated by direct outreach, asset data can be hard to track. With much of gas transportation infrastructure underground or remote, often for decades, it can be difficult to collect and analyze efficiently. Figure 16 highlights that a significant group of respondents have not yet implemented solutions to improve data accuracy, completeness and availability.
FIGURE 15
How would you rate your organization’s data in the following areas?
Data accuracy 18.3% 34.6% 39.4% 7.7%
Data availability 16.5% 35.0% 36.9% 11.7%
Data completeness 12.5% 29.8% 47.1% 10.6%
n Always n Above Average n Average n Below AverageSource: Black & Veatch
SUSTAINABLE OPERATIONS

35 | 2017 STRATEGIC DIRECTIONS: NATURAL GAS INDUSTRY REPORT | BV.COM
The natural gas industry has done a reasonable job collecting historical asset data but lacks the type of data that can be used for predictive analysis. In many areas, data still is stored on paper or if in digital formats, any critical information is contained in comments fields or other notations where it cannot be automated and analyzed. If the raw data is mediocre, the information needed for analytics is in a poor state, limiting insights gained from even high-quality analytics software.
The sector faces an additional motivation for enhancing asset data quality. Increasingly, service providers operate in environments where less work is being done by their own employees, notably in the installation of new infrastructure or asset-replacement programs. Relying on third-party vendors increases the difficulty of gathering quality data. Business rules critical to the validation of source data on assets, typically not used by outside parties, need to be used to govern data-capture processes.
Addressing gaps in data quality will not happen overnight. The transformation of record-keeping has been underway for more than 40 years, and undoing the mazes created by mergers, acquisitions and asset software implementations will take time. Integrating functions of separate leak departments or technical services groups as well as the individual solutions and tactical programs will be necessary to create the next-generation enterprise asset data model. A complete picture of the history, condition and trending data for a company’s assets then can be developed, starting with recognizing that enterprise asset data is a business governance issue critical to future risk mitigation and business success.
SUSTAINABLE OPERATIONS
FIGURE 16
What technologies does your organization currently use to collect data and/or improve its accuracy, completeness, and availability? (Select all that apply)
Mobile data collection Machine learning and analysis
Drone imagery/ sensor analysis
Satellite imagery analysis
Optical data recognition and
extraction
44.2%
38.0%
25.7%23.0%
20.4%
27.0%
18.6% 20.0%
16.8%21.0%
n Currently Using n Plan to Use
Source: Black & Veatch

36 | 2017 STRATEGIC DIRECTIONS: NATURAL GAS INDUSTRY REPORT | BV.COM
Sustainable OperationsFUNDING, PREPARATION AND CULTURE KEYS TO SECURING CRITICAL INFRASTRUCTURE AND SYSTEMS
By Nathan Ives and David Mayers
In Washington, D.C., the Trump administration’s focus on infrastructure investment has gained growing attention in the energy sector and intensified dialogue about how these assets are protected from both cyber and physical attack. To get a better sense of the risk environment, the administration issued an executive order in May mandating an assessment of the country’s resilience against cyber attacks.
In August, the National Infrastructure Advisory Council (NIAC) also released a report on urgent cyber threats to high-risk assets in the public and private sectors. The report found that cybersecurity was “the sole arena where private companies are the front line of defense in a nation-state attack on U.S. infrastructure.” Despite these findings and recent high-profile events like the Equifax data breach, only a minority of natural gas industry organizations seem to be evaluating their cyber risk exposure and identifying where vulnerabilities exist within their systems.
Survey responses from the 2017 Strategic Directions: Natural Gas Industry Report suggest that a root cause of inadequate preparedness for risks may be insufficient funding for physical and cybersecurity initiatives. In fact, results reveal that approximately 65 percent of respondents either don’t know how much money is being earmarked or are allocating less than $1 million annually to fund security programs (Figure 17).
Nathan Ives is a Managing Director and leads the Security, Risk & Resilience Service Offering for Black & Veatch management consulting. He has 25 years of energy industry experience, including eight years in the management, operation and maintenance of nuclear power plants.
David Mayers is a Senior Managing Director within Black & Veatch’s management consulting business. He has 26 years of management consulting experience, including 12 years in the banking industry and 14 years in the energy sector.
SUSTAINABLE OPERATIONS

37 | 2017 STRATEGIC DIRECTIONS: NATURAL GAS INDUSTRY REPORT | BV.COM
The fact that more than one-third of survey respondents indicated they don’t know how much financial investment is dedicated to security programs suggests that, in general, natural gas professionals may not see security as a priority.
A new report from Deloitte found that the oil and gas sector was the second-most targeted industry for cyber attacks, with nearly three-quarters of U.S. companies subjected to at least one incident in the past year alone. To more fully grasp the risk to assets and systems, risk and vulnerability assessments should be conducted regularly to identify which system areas are more susceptible to intrusion. These assessments could help natural gas providers see the impact of a security-related incident on their systems and make the business case for implementing a comprehensive security risk framework.
These frameworks also enable natural gas industry organizations to meet and maintain compliance with evolving regulatory requirements such as the National Institute of Standards and Technology (NIST) Cybersecurity Framework, recommended by NIAC as a standard requirement.
CREATING A RISK-AWARE WORKPLACE CULTURE
Regardless of funding or regulatory requirements, the lack of a workplace culture focused on preventing cyber incidents may be another reason why the natural gas sector appears to be lagging behind similar efforts being applied in the power and water industries, among others. Challenges such as executive engagement, organizational resistance or hefty time requirements for training also could be barriers to implementing comprehensive programs. To create a more risk-aware culture, executive leadership should not only consider increasing security investment but also infuse security-related initiatives with culture-changing activities.
F IGURE 17
What are the approximate funding allocations for security programs for your organization?
$6-$10 million 9.6%
$1-$5 million 17.4%
More than $10 million 7.8%
35.7%Don’t know
Less than $1 million 29.6%Source: Black & Veatch
SUSTAINABLE OPERATIONS

38 | 2017 STRATEGIC DIRECTIONS: NATURAL GAS INDUSTRY REPORT | BV.COM
Exercises to simulate environmental, cyber or physical attacks can help professionals better understand the ramifications of an incident. Survey results show that in the last year only one-third of respondents participated in an exercise that simulated an environmental, cyber attack or physical attack. Further, of the respondents who participated in a security exercise, more than half disclosed the level of simulation was primarily tabletop and not a real-world business continuity and disaster recovery incident (Figure 18).
While it is promising to see a growing number of natural gas professionals participating in some form of simulation, it would be a significantly more impactful and interactive learning experience to conduct real-world simulations better depicting the gravity of an event and appropriate measures professionals should take in real time.
An important consideration for these exercises is addressing how technology is handled by different employee demographic groups. While today’s younger professionals tend to be more proficient using technology, the same may not be true for those nearing retirement. These differences should be taken into account when planning training programs. Overall, engaging employees in varying roles and levels of experience in collaborative activities helps reinforce a risk-averse culture.
MORE DATA, MORE PROBLEMS
The increasing frequency of cyber attacks signals that deploying robust security programs is becoming vital to the prevention of service disruptions and negative network impacts. Natural gas professionals must increase their efforts to protect critical infrastructure, operating systems and customer data.
While many of this year’s industry respondents may be undervaluing and underfunding physical security and cybersecurity programs, proactive planning and establishing a risk-averse corporate culture can help organizations effectively manage threats and secure buy-in for future security program funding. The current administration’s commitment to bolstering critical infrastructure does not seem to be abating any time soon, furthering the need for more comprehensive security systems that protect consumers and natural gas industry assets, data and operations.
F IGURE 18
Was the level of simulation primarily tabletop, in an isolated test environment or in the real world?
Isolated test environment
19.4%
51.6 %Table top
Other 1.6%
In the real world
27.4%Source: Black & Veatch
SUSTAINABLE OPERATIONS

39 | 2017 STRATEGIC DIRECTIONS: NATURAL GAS INDUSTRY REPORT | BV.COM
Sustainable OperationsAMID CHANGES IN THE FEDERAL REGULATORY LANDSCAPE , STATES TAKE THE LEAD
By Andy Byers
Capitalizing on sustained low natural gas prices, the United States has seen a fair amount of build-out of new pipeline infrastructure to reach new markets since last year’s Strategic Directions: Natural Gas Industry Report. Additionally, the changeover in administrations at the federal level is widely seen as favorable for continued industry growth. However, despite announced intentions to immediately accelerate energy infrastructure development, several bumps have been encountered right out of the gate.
Vacancies on the Federal Energy Regulatory Commission (FERC) have constricted approvals of major interstate pipeline projects. Increased activist opposition has brought more media coverage and public scrutiny to project development and construction activities. The saga of the Environmental Protection Agency (EPA) methane rule has led to several readjustments in strategies from natural gas providers. And while federal compliance requirements continue to fluctuate, many states are preparing their own regulations for greenhouse gas emissions.
Andy Byers is an Associate Vice President and Director of Environmental Services within Black & Veatch’s power business. He currently serves as the Environmental Regulatory and Legislative Policy Advisor and is responsible for tracking developments and advising on risks and opportunities arising from key federal legislative, regulatory and judicial initiatives.
SUSTAINABLE OPERATIONS
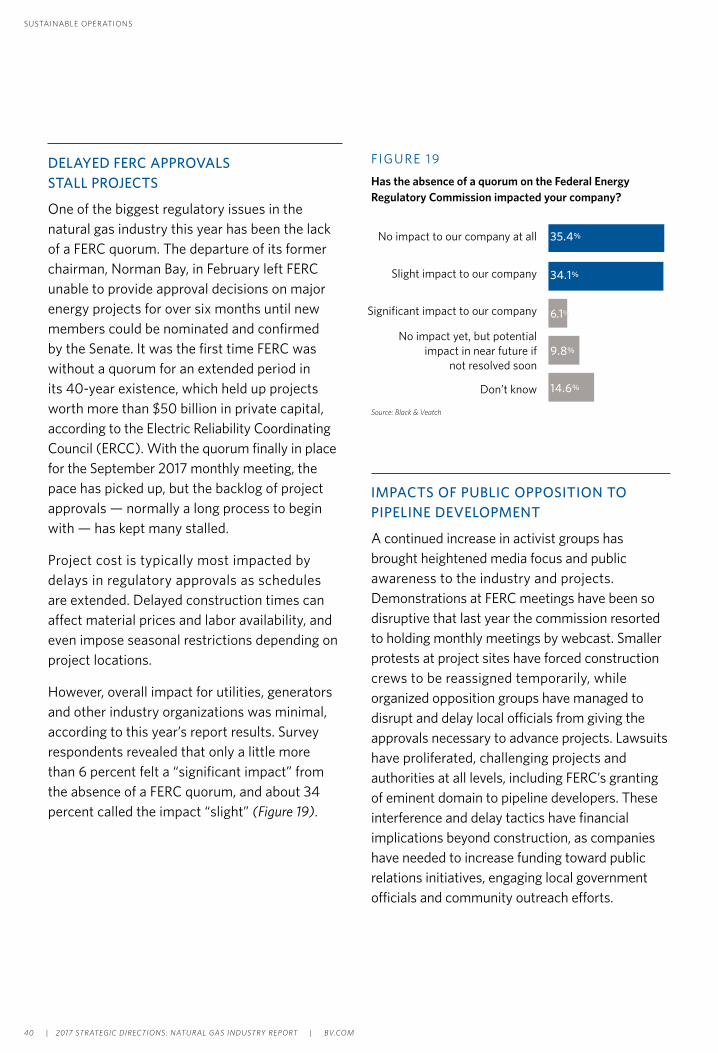
40 | 2017 STRATEGIC DIRECTIONS: NATURAL GAS INDUSTRY REPORT | BV.COM
DELAYED FERC APPROVALS STALL PROJECTS
One of the biggest regulatory issues in the natural gas industry this year has been the lack of a FERC quorum. The departure of its former chairman, Norman Bay, in February left FERC unable to provide approval decisions on major energy projects for over six months until new members could be nominated and confirmed by the Senate. It was the first time FERC was without a quorum for an extended period in its 40-year existence, which held up projects worth more than $50 billion in private capital, according to the Electric Reliability Coordinating Council (ERCC). With the quorum finally in place for the September 2017 monthly meeting, the pace has picked up, but the backlog of project approvals — normally a long process to begin with — has kept many stalled.
Project cost is typically most impacted by delays in regulatory approvals as schedules are extended. Delayed construction times can affect material prices and labor availability, and even impose seasonal restrictions depending on project locations.
However, overall impact for utilities, generators and other industry organizations was minimal, according to this year’s report results. Survey respondents revealed that only a little more than 6 percent felt a “significant impact” from the absence of a FERC quorum, and about 34 percent called the impact “slight” (Figure 19).
F IGURE 19
Has the absence of a quorum on the Federal Energy Regulatory Commission impacted your company?
No impact to our company at all
Slight impact to our company
Significant impact to our company
No impact yet, but potential impact in near future if
not resolved soon
Don’t know
35.4%
34.1%
6.1%
9.8%
14.6%
SUSTAINABLE OPERATIONS
IMPACTS OF PUBLIC OPPOSITION TO PIPELINE DEVELOPMENT
A continued increase in activist groups has brought heightened media focus and public awareness to the industry and projects. Demonstrations at FERC meetings have been so disruptive that last year the commission resorted to holding monthly meetings by webcast. Smaller protests at project sites have forced construction crews to be reassigned temporarily, while organized opposition groups have managed to disrupt and delay local officials from giving the approvals necessary to advance projects. Lawsuits have proliferated, challenging projects and authorities at all levels, including FERC’s granting of eminent domain to pipeline developers. These interference and delay tactics have financial implications beyond construction, as companies have needed to increase funding toward public relations initiatives, engaging local government officials and community outreach efforts.
Source: Black & Veatch

41 | 2017 STRATEGIC DIRECTIONS: NATURAL GAS INDUSTRY REPORT | BV.COM
Increased media coverage also has brought heightened public scrutiny on incidents at many major projects. States have asserted their authorities to bring enforcement actions and even suspend projects where construction mishaps have caused damages to ecological and historical resources.
Nearly 60 percent of this year’s survey respondents have felt the heat from the increase in activist groups and public opposition to pipeline development projects. Construction progress takes the biggest hit (32 percent); and approximately 24 percent say permitting delays and more regulatory scrutiny were a result of increased public opposition (Figure 20).
STATES TAKE LEAD ON CLIMATE ACTION
The Trump administration reversed course on national climate change initiatives by promptly announcing withdrawal from the Paris climate agreement and issuing executive orders to reconsider and repeal numerous carbon-reduction programs. The 2016 methane rule for oil and gas operations was immediately targeted by both the EPA and Congress for repeal. Despite their resolve, congressional repeal votes have so far fallen short, and the EPA’s attempt to suspend the rule was initially supported but then rebuffed by the courts. Once thought to be dead, its back-and-forth status has created uncertainty and left many in the industry whipsawed in their ongoing compliance management efforts. While the fate of this and other greenhouse gas rules at the federal level still appears tenuous, several states are stepping into the growing federal void to address climate change issues. Led by California and New York, states are enacting laws and asserting their authority to force reduction of methane releases across the industry.
We have had no significant or perceived impact
Impacted construction progress
Extended schedule of permitting projects
More scrutiny from regulators
Increased costs and resources in public relations
Increased costs and resources in legal actions
43.9%
31.7%
24.4%
24.4%
23.2%
22.0%
FIGURE 20
How has your company been impacted by the increase in activist groups and public opposition to pipeline development projects? (Select all that apply)
SUSTAINABLE OPERATIONS
When polled, survey respondents seem to be in agreement that commitment to environmental priorities at the state level will increase, especially when it comes to climate change programs. While less than one-third think fewer than 10 will develop their own programs, most see up to 30 states enacting their own laws to fill the void. Just over 17 percent say 30 or more states will have new climate programs to roll out in the future. As the industry continues to monitor the regulatory landscape at the federal level, rules at the state level could set the standard for years to come.
Source: Black & Veatch
Surveyed said 30 or more states will have new climate programs to roll out in the future.
17%
42 | 2017 STRATEGIC DIRECTIONS: NATURAL GAS INDUSTRY REPORT | BV.COM
SUSTAINABLE OPERATIONS
Sustainable OperationsNATURAL GAS STORAGE OPERATORS BRACING FOR REGULATORY IMPACT
By Michael Nushart
Storage solutions continue to drive natural gas’s prominence as part of a balanced power portfolio. Results from the 2017 Strategic Directions: Natural Gas Industry Report survey signal that in order to realize natural gas storage potential, industry organizations will first need to manage the array of associated federal and state regulations. Final rules to be issued by the U.S. Pipeline and Hazardous Materials Safety Administration (PHMSA), for instance, will require up-front planning and may pose compliance challenges for storage facility operators.
Issued last year to address public concerns stemming from earlier incidents and culminating in the 2015 Aliso Canyon methane leak in Southern California, a PHMSA interim final rule (IFR) aims to mandate “critical safety standards” to address aging infrastructure and reliability, and enhance the safety of underground facilities to prevent future incidents. The rule incorporates American Petroleum Institute-recommended practices and contains guidance for operators of underground gas storage facilities. The standards include policies on inspection, enforcement, training and certification.
Several industry groups have spoken out against the IFR, and PHMSA announced in June that it will conduct a review of petitions, further postponing enforcement of the final rule. The partial stay issued this summer stated that a final rule would be issued by January 2018, with a one-year compliance grace period.
Michael Nushart is a Principal Consultant for Black & Veatch management consulting. He brings more than four decades of natural gas industry experience and provides data-driven pipeline integrity management and code compliance expertise with a focus on data definition, acquisition, integration and analysis.
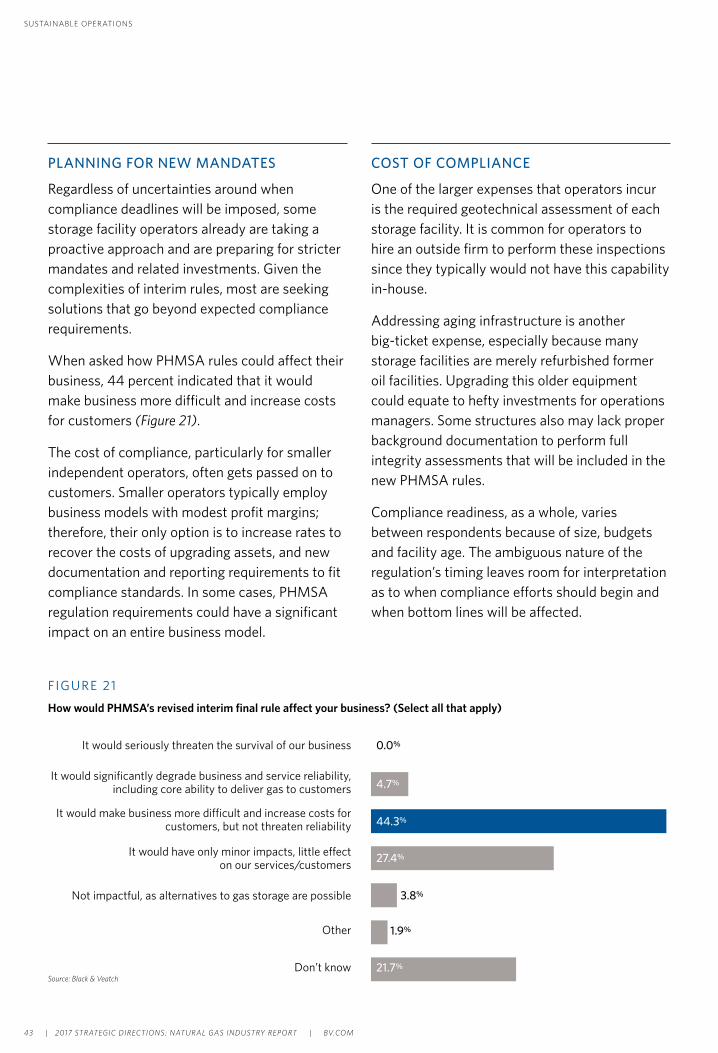
43 | 2017 STRATEGIC DIRECTIONS: NATURAL GAS INDUSTRY REPORT | BV.COM
PLANNING FOR NEW MANDATES
Regardless of uncertainties around when compliance deadlines will be imposed, some storage facility operators already are taking a proactive approach and are preparing for stricter mandates and related investments. Given the complexities of interim rules, most are seeking solutions that go beyond expected compliance requirements.
When asked how PHMSA rules could affect their business, 44 percent indicated that it would make business more difficult and increase costs for customers (Figure 21).
The cost of compliance, particularly for smaller independent operators, often gets passed on to customers. Smaller operators typically employ business models with modest profit margins; therefore, their only option is to increase rates to recover the costs of upgrading assets, and new documentation and reporting requirements to fit compliance standards. In some cases, PHMSA regulation requirements could have a significant impact on an entire business model.
It would seriously threaten the survival of our business
It would significantly degrade business and service reliability, including core ability to deliver gas to customers
It would make business more difficult and increase costs for customers, but not threaten reliability
It would have only minor impacts, little effect on our services/customers
Not impactful, as alternatives to gas storage are possible
Other
Don’t know
0.0%
4.7%
44.3%
27.4%
3.8%
1.9%
21.7%
FIGURE 21
How would PHMSA’s revised interim final rule affect your business? (Select all that apply)
COST OF COMPLIANCE
One of the larger expenses that operators incur is the required geotechnical assessment of each storage facility. It is common for operators to hire an outside firm to perform these inspections since they typically would not have this capability in-house.
Addressing aging infrastructure is another big-ticket expense, especially because many storage facilities are merely refurbished former oil facilities. Upgrading this older equipment could equate to hefty investments for operations managers. Some structures also may lack proper background documentation to perform full integrity assessments that will be included in the new PHMSA rules.
Compliance readiness, as a whole, varies between respondents because of size, budgets and facility age. The ambiguous nature of the regulation’s timing leaves room for interpretation as to when compliance efforts should begin and when bottom lines will be affected.
SUSTAINABLE OPERATIONS
Source: Black & Veatch

44 | 2017 STRATEGIC DIRECTIONS: NATURAL GAS INDUSTRY REPORT | BV.COM
Forty-one percent of survey respondents believe PHMSA’s rules will begin to affect their business planning within the next two years while almost one-third (29 percent) anticipate effects within three to five years (Figure 22).
MINIMIZING DISRUPTION ON OPERATIONS
When the rule finally drops, operators will have options to consider for determining the most effective approach to meet inspection criteria. For some facilities, nondestructive downhole inspection methodologies, similar to in-line inspections, allow for minimal overall impact on operations. Various ultrasonic methods also can be done on-site and prevent the need to remove piping and other hardware. While both methods can be costly, operators benefit from fewer service disruptions.
Another approach to compliance is the participation in regional consortiums where storage operators partner to alleviate administrative costs. In this approach, the group pools their respective compliance budgets and delegates specific tasks to each member company. This collaborative strategy carries cost savings as well as benefits to both the operations and maintenance side.
For example, instead of each operator spending time and money developing its own updated operating and maintenance manuals, a consortium would enable a more efficient process where one universal manual is produced that every participating business agrees upon and can then tweak for its own facility. In the end, it’s ultimately less time-consuming and taxing on an individual plant.
The regional approach also can be applied to rule interpretation and compliance and can yield benefits during audits and inspections.
On the mechanical side of the operation, a consortium also can help offset some of the expensive geotechnical assessment and testing that is required. In this scenario, member companies pool resources and hire a geological testing firm as a group instead of individually. This method can leverage the economies of scale to help reduce the cost for individual operators.
Ultimately, whenever PHMSA’s final rule is issued, regulatory compliance requirements will be unavoidable. Waiting to address the possible changes could become more costly in the long run for operators that do not begin strategic business planning proactively. At the very least, facility owners should start exploring their compliance options and plan now to prepare for the coming impact.
41.3%Within the
next 2 years
Within the next 3-5 years
28.8%
Within the next 6+ years/Never
6.7%
Don’t know23.1%
FIGURE 22
If PHMSA’s published interim final rules are implemented, how soon do you think the final rules would affect your business planning?
SUSTAINABLE OPERATIONS
Source: Black & Veatch
45 | 2017 STRATEGIC DIRECTIONS: NATURAL GAS INDUSTRY REPORT | BV.COM
Closing CommentaryGLOBAL SUPPLY STOKES NEW INFRASTRUCTURE OPPORTUNITIES
By John Chevrette
Even as the global supply of natural gas surges — lowering the cost but also the margins for organizations across the industry — production shows no signs of decelerating. Countries with abundant reserves stand poised to raise their output, hoping to satisfy an increasing worldwide appetite for cleaner energy. But major questions persist about the ability of emerging markets to absorb this expected surge in supply, given challenges that include the lack of terminals, pipelines and other infrastructure. Producers and traders are increasingly stepping in, helping to finance and build onshore infrastructure or floating terminals that bring natural gas to international markets where funding for such projects may be lacking.
The market continues to evolve as dominant producers such as Qatar stoke production. On the import side, China is expected to maintain an increasing appetite for natural gas as a power generation source, and opportunities are blooming in Latin America as Mexico and other countries continue investing in infrastructure and working to unlock natural gas’s full potential as a cleaner fuel.
Many in the industry believe few countries stand to benefit more than the United States, which is broadly viewed as perhaps having reshaped the global market for liquefied natural gas (LNG). After decades as a net importer of gas, the United States is now the world’s largest producer of natural gas, with much of that output consumed domestically. Yet, continued advances in production technology are allowing U.S. producers to set the table toward
John Chevrette is President of Black & Veatch management consulting and works closely with clients to address key challenges affecting today’s electric, water and gas utilities. Chevrette has more than 20 years of industry consulting experience and has worked with domestic and international clients in the electric utility, energy technology, gas pipeline, telecommunications and water industries.
CLOSING COMMENTARY

46 | 2017 STRATEGIC DIRECTIONS: NATURAL GAS INDUSTRY REPORT | BV.COM
supplying more of the world. According to the Energy Information Administration (EIA), the U.S. Department of Energy’s statistical and research arm, the United States is projected in 2017 to export more natural gas than it brings in on a net basis for the first time in nearly six decades.
EIA expects that shift to continue throughout next year and beyond, given growing demand from Mexico for the fuel, declining pipeline imports from Canada and increased LNG exports. As a nod to potential U.S. global influence in the sector, roughly 80 percent of survey respondents to the 2017 Strategic Directions: Natural Gas Industry Report noted that United States emergence as a major LNG supplier is either extremely or somewhat likely to shape the global LNG market over the next half decade (Figure 23). More than
75 percent cited the emergence of new LNG markets in developing countries as extremely or somewhat likely to shape the world LNG market during that stretch.
Optimism about the United States’ stature in the LNG space is being driven by the fuel’s low production costs and a profound shift in contracting practices — the latter amounting to a price restructuring that now challenges LNG’s long-standing overseas suppliers. For example, India — which previously signed a 20-year deal in 2009 for LNG from ExxonMobil — has renegotiated the terms after its rate for LNG far exceeded spot market pricing. India in recent years also has reworked its contract with Qatar, the world’s dominant LNG exporter.
FIGURE 23
To what extent are the following emerging trends likely to shape the global LNG market over the next five years?
The U.S. emerging as a major LNG supplier
Emergence of new markets for LNG in developing countries
Lowering of LNG project costs
Renegotiation of traditional contractual terms (such as destination flexibility)
Increased spot market transactions
Emergence of Asian price index
Emergence and prevalence of smaller scale LNG including FLNG
Asian buyers converging to create buyer consortiums
37.7% 42.2% 14.4% 5.7%
24.2% 53.5% 15.7% 6.6%
17.9% 48.6% 19.8% 13.7%
17.7% 43.1% 33.6% 5.5%
18.2% 42.4% 32.1% 7.3%
9.8% 42.5% 37.5% 10.2%
9.4% 41.3% 35.6% 13.7%
10.7% 39.1% 34.6% 15.6%
CLOSING COMMENTARY
n Extremely Likely n Somewhat Likely n Neither Likely Nor Unlikely n Unlikely
Source: Black & Veatch

47 | 2017 STRATEGIC DIRECTIONS: NATURAL GAS INDUSTRY REPORT | BV.COM
Higher expectations of U.S. relevance in the LNG sector come at a time of a global oversupply. Qatar removed its decade-long moratorium on the North Field development in July, setting the stage to potentially increase LNG output to 100 million metric tons per annum (mtpa), up from the current 77 mtpa. But Black & Veatch report respondents believe that glut will dwindle, making the case for new, bigger exporters such as the United States. When asked when the current LNG oversupply will abate and foster a need for a restocking in that sector, more than 60 percent of the respondents estimated that would come by 2025 (Figure 24).
Within the next five years, the survey showed, increased appetite for LNG is expected to come from south of the U.S. border. Thirty-six percent of respondents expected Mexico to up its demand for LNG over that span — an expectation underscored by the EIA, which in August said Mexico’s national energy ministry expects to increase its natural gas use for electrical power generation by nearly 50 percent between last year
and 2020. Natural gas exports to Mexico from the United States reached near-record levels over the first five months of 2017, the EIA noted in August.
This year’s report survey also showed that increased Latin American demand for LNG over the next half decade would come from Brazil, Central America, Argentina, Colombia and the Caribbean (Figure 25).
Additionally, other overseas markets continue to surface; Lithuania, for instance, received its first U.S. natural gas shipment in August, marking a potential geopolitical shift in a European market predominantly supplied by Russia. Poland got its first LNG delivery from the United States just two months earlier.
China’s thirst for LNG has been undeniable. Over the first seven months of 2017, the EIA noted in September, imports of the fuel spiked by 45 percent over the same period of the previous year. Aside from a slight decline in 2015, China’s
CLOSING COMMENTARY
FIGURE 24
When do you expect the current global LNG supply overhang to be absorbed and the need for the next tranche of LNG supply to arise?
Never or not in foreseeable
future
2017-2020 2021-2025 2026-2030 After 2030 Don’t know
5.9%
14.8%
48.5%
15.4%
1.8%
13.6%
Source: Black & Veatch
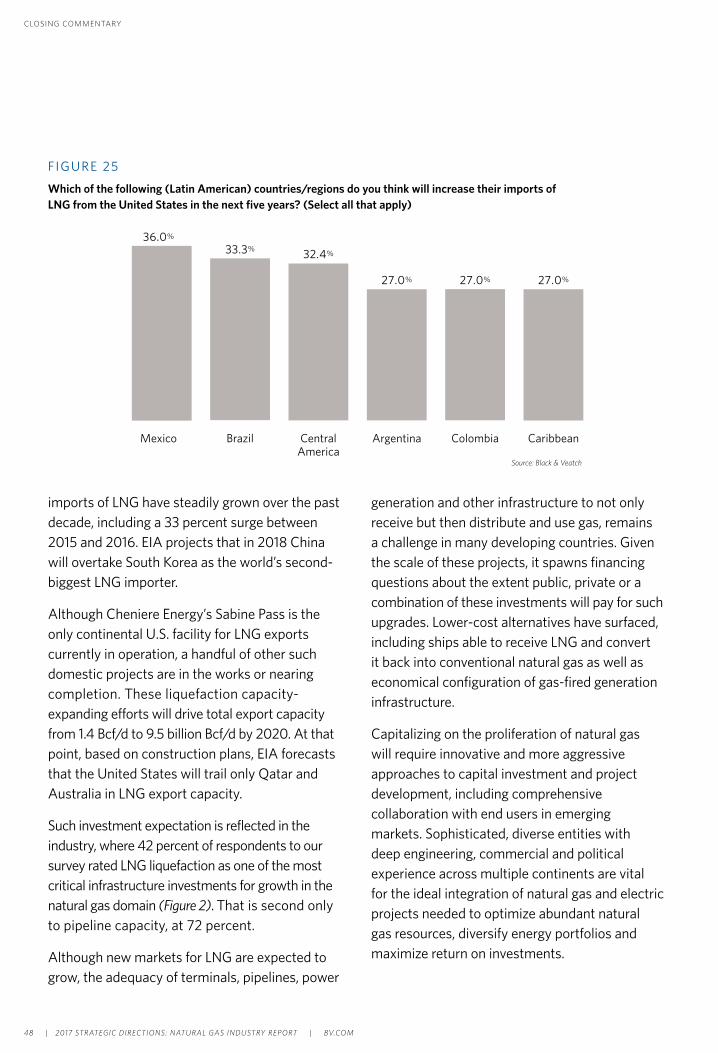
48 | 2017 STRATEGIC DIRECTIONS: NATURAL GAS INDUSTRY REPORT | BV.COM
imports of LNG have steadily grown over the past decade, including a 33 percent surge between 2015 and 2016. EIA projects that in 2018 China will overtake South Korea as the world’s second-biggest LNG importer.
Although Cheniere Energy’s Sabine Pass is the only continental U.S. facility for LNG exports currently in operation, a handful of other such domestic projects are in the works or nearing completion. These liquefaction capacity-expanding efforts will drive total export capacity from 1.4 Bcf/d to 9.5 billion Bcf/d by 2020. At that point, based on construction plans, EIA forecasts that the United States will trail only Qatar and Australia in LNG export capacity.
Such investment expectation is reflected in the industry, where 42 percent of respondents to our survey rated LNG liquefaction as one of the most critical infrastructure investments for growth in the natural gas domain (Figure 2). That is second only to pipeline capacity, at 72 percent.
Although new markets for LNG are expected to grow, the adequacy of terminals, pipelines, power
generation and other infrastructure to not only receive but then distribute and use gas, remains a challenge in many developing countries. Given the scale of these projects, it spawns financing questions about the extent public, private or a combination of these investments will pay for such upgrades. Lower-cost alternatives have surfaced, including ships able to receive LNG and convert it back into conventional natural gas as well as economical configuration of gas-fired generation infrastructure.
Capitalizing on the proliferation of natural gas will require innovative and more aggressive approaches to capital investment and project development, including comprehensive collaboration with end users in emerging markets. Sophisticated, diverse entities with deep engineering, commercial and political experience across multiple continents are vital for the ideal integration of natural gas and electric projects needed to optimize abundant natural gas resources, diversify energy portfolios and maximize return on investments.
Mexico
36.0%
Brazil Central America
Argentina Colombia Caribbean
33.3% 32.4%
27.0% 27.0% 27.0%
FIGURE 25
Which of the following (Latin American) countries/regions do you think will increase their imports of LNG from the United States in the next five years? (Select all that apply)
Source: Black & Veatch
CLOSING COMMENTARY

49 | 2017 STRATEGIC DIRECTIONS: NATURAL GAS INDUSTRY REPORT | BV.COM
2017Report BackgroundThe 2017 Black & Veatch Strategic Directions: Natural Gas Industry Report is a compilation of quantitative and qualitative data and analysis from industrywide surveys. This year’s online survey was conducted from 8 August 2017 through 29 August 2017 and reflects the input of more than 300 qualified utility, municipal, commercial and community stakeholders.
A total of 338 qualified oil, natural gas, utility and other industry organization providers completed a majority of the survey. Because the survey was administered online, the amount of self-selection bias is unknown; therefore, no estimates of sampling error have been calculated. The following figures provide additional details on the participants in this year’s survey.

50 | 2017 STRATEGIC DIRECTIONS: NATURAL GAS INDUSTRY REPORT | BV.COM
2017 REPORT BACKGROUND
FIGURE 27
Which of the following best describes the services provided by your organization?
FIGURE 26 In which countries or regions does your organization operate/provide services?
Source: Black & Veatch
UNITED STATES 89.6%
CANADA 22.8%
MEXICO15.7%
CENTRAL AMERICA9.2%
SOUTH AMERICA12.7%
ASIA
18.0%
AUSTRALIA/OCEANIA10.7%
EUROPE17.2%
MIDDLE EAST, including the GCC
12.7%
AFRICA13.3%
Source: Black & Veatch
Oil“Oil” refers to those predominantly in
production (as opposed to gathering,
transportation, storage, marketing, or refining).
18.3%
Natural GasThe lion share of “Natural Gas” survey
respondents work in interstate/ intrastate
pipelines or processing.
33.1%Generator/UtilityThe “Generator/Utility” group are mostly
local distribution companies (LDCs) or
utility/regulated energy professionals.
29.9%
Other Oil & Gas industry organizationMost common “Other” responses
were architects, engineers, EPC
contractors and equipment/
service providers.
18.6%

51 | 2017 STRATEGIC DIRECTIONS: NATURAL GAS INDUSTRY REPORT | BV.COM
LIST OF FIGURES
List of Figures
2 FIGURE 1 Please rate the importance of each of the following issues and/or
challenges related to the natural gas market.
3 FIGURE 2 Which infrastructure investments are most critical for growth in the
natural gas market? (Select up to three)
12 F IGURE 3 Which of the following countries/regions do you think will increase
their imports of LNG from the United States in the next five years? (Select all that apply)
15 FIGURE 4 What are the major drivers for making FLNG investment decisions?
(Select top three)
16 FIGURE 5 What do you think is the LNG production “sweet spot” that will be
dominant in the market?
20 FIGURE 6 Please rate the importance of each of the following issues and/or
challenges related to the natural gas market. (Choose from a scale of 1-5; 5 = very important)
21 FIGURE 7 Expectation of global crude oil prices between now and 2020
(natural gas industry respondents only)
25 FIGURE 8 Which of the following will have the most impact on natural
gas prices between now and 2018 and from 2019-2025? (Select all that apply)
27 FIGURE 9 Which of the following is your organization considering due to lower
natural gas prices? (Select all that apply)
27 FIGURE 10 In your opinion, what is the most economical use for stranded gas?
28 FIGURE 11 If your organization is considering producing gas or products from
renewable biomass resources, what is the primary driver for doing so?
29 FIGURE 12 As it relates to the potential addition of a gas-fired generation, how
does your organization plan on responding to potential capacity needs over the next five to 10 years?

52 | 2017 STRATEGIC DIRECTIONS: NATURAL GAS INDUSTRY REPORT | BV.COM
30 FIGURE 13 What type of gas-fired power generation do you
plan to install over the next three to five years? (Select all that apply)
33 FIGURE 14 How often is data used in the following
processes within your organization?
34 F IGURE 15 How would you rate your organization’s data in
the following areas?
35 FIGURE 16 What technologies does your organization
currently use to collect data and/or improve its accuracy, completeness, and availability? (Select all that apply)
37 FIGURE 17 What are the approximate funding allocations
for security programs for your organization?
38 FIGURE 18 Was the level of simulation primarily tabletop, in
an isolated test environment or in the real world?
40 FIGURE 19 Has the absence of a quorum on the Federal
Energy Regulatory Commission impacted your company?
41 FIGURE 20 How has your company been impacted by
the increase in activist groups and public opposition to pipeline development projects? (Select all that apply)
43 FIGURE 21 How would PHMSA’s revised interim final rule
affect your business? (Select all that apply)
44 FIGURE 22 If PHMSA’s published interim final rules are implemented, how soon do you think the final rules would affect your business planning?
46 FIGURE 23 To what extent are the following emerging trends
likely to shape the global LNG market over the next five years?
47 F IGURE 24 When do you expect the current global LNG
supply overhang to be absorbed and the need for the next tranche of LNG supply to arise?
48 FIGURE 25 Which of the following (Latin American)
countries/regions do you think will increase their imports of LNG from the United States in the next five years? (Select all that apply)
50 FIGURE 26 In which countries or regions does your
organization operate/provide services?
50 FIGURE 27 Which of the following best describes the
services provided by your organization?
LIST OF FIGURES

LEGAL NOTICE
Please be advised, this report was compiled primarily based on information Black & Veatch received from third parties, and Black & Veatch was not requested to independently verify any of this information. Thus, Black & Veatch’s reports’ accuracy solely depends upon the accuracy of the information provided to us and is subject to change at any time. As such, it is merely provided as an additional reference tool, in combination with other due diligence inquiries and resources of user. Black & Veatch assumes no legal liability or responsibility for the accuracy, completeness, or usefulness of any information, or process disclosed, nor does Black & Veatch represent that its use would not infringe on any privately owned rights. This Survey may include facts, views, opinions and recommendations of individuals and organizations deemed of interest and assumes the reader is sophisticated in this industry. User waives any rights it might have in respect of this Survey under any doctrine of third-party beneficiary, including the Contracts (Rights of Third Parties) Act 1999. Use of this Survey is at users sole risk, and no reliance should be placed upon any other oral or written agreement, representation or warranty relating to the information herein.
THIS REPORT IS PROVIDED ON AN “AS-IS” BASIS. BLACK & VEATCH DISCLAIMS ALL WARRANTIES OF ANY KIND, EXPRESSED OR IMPLIED, INCLUDING, WITHOUT LIMITATION, ANY WARRANTY OF MERCHANTABILITY, FITNESS FOR A PARTICULAR PURPOSE OR NON-INFRINGEMENT. BLACK & VEATCH, NOR ITS PARENT COMPANY, MEMBERS, SUBSIDIARIES, AFFILIATES, SERVICE PROVIDERS, LICENSORS, OFFICERS, DIRECTORS OR EMPLOYEES SHALL BE LIABLE FOR ANY DIRECT, INDIRECT, INCIDENTAL, SPECIAL OR CONSEQUENTIAL DAMAGES ARISING OUT OF OR RELATING TO THIS REPORT OR RESULTING FROM THE USE OF THIS REPORT, INCLUDING BUT NOT LIMITED TO DAMAGES FOR LOSS OF PROFITS, USE, DATA OR OTHER INTANGIBLE DAMAGES, EVEN IF SUCH PARTY HAS BEEN ADVISED OF THE POSSIBILITY OF SUCH DAMAGES.
In addition, user should place no reliance on the summaries contained in the Surveys, which are not intended to be exhaustive of the material provisions of any document or circumstances. If any point is of particular significance, reference should be made to the underlying documentation and not to this Survey. This Survey (and the content and information included therein) is copyrighted and is owned or licensed by Black & Veatch. Black & Veatch may restrict your access to this Survey, or any portion thereof, at any time without cause. User shall abide by all copyright notices, information, or restrictions contained in any content or information accessed through this Survey. User shall not reproduce, retransmit, disseminate, sell, distribute, perform, display, publish, broadcast, circulate, create new works from, or commercially exploit this Survey (including the content and information made available through this Survey), in whole or in part, in any manner, without the written consent of Black & Veatch, nor use the content or information made available through this Survey for any unlawful or unintended purpose.

© Black & Veatch Corporation, 2017. All Rights Reserved. The Black & Veatch name and logo are registered trademarks of Black & Veatch Holding Company. REV 2017-11 bv.com
Black & Veatch
P +1 913 458 2000 | E [email protected] | W bv.com


