Journal of Hospitality Financial Management Journal of Hospitality Financial Management The Professional Refereed Journal of the International Association of Hospitality Financial The Professional Refereed Journal of the International Association of Hospitality Financial Management Educators Management Educators Volume 27 Issue 1 Article 3 2019 Strategic Effect of Degree of Operating Leverage on Value Strategic Effect of Degree of Operating Leverage on Value Premium of Lodging Firms Premium of Lodging Firms Akshaya Pawar University of Massachusetts Amherst Raju Gholap University of Massachusetts Amherst Atul Sheel University of Massachusetts - Amherst Follow this and additional works at: https://scholarworks.umass.edu/jhfm Recommended Citation Recommended Citation Pawar, Akshaya; Gholap, Raju; and Sheel, Atul (2019) "Strategic Effect of Degree of Operating Leverage on Value Premium of Lodging Firms," Journal of Hospitality Financial Management: Vol. 27 : Iss. 1 , Article 3. DOI: https://doi.org/10.7275/2zz5-ey49 Available at: https://scholarworks.umass.edu/jhfm/vol27/iss1/3 This Refereed Article is brought to you for free and open access by ScholarWorks@UMass Amherst. It has been accepted for inclusion in Journal of Hospitality Financial Management by an authorized editor of ScholarWorks@UMass Amherst. For more information, please contact [email protected].
Transcript
Journal of Hospitality Financial Management Journal of Hospitality Financial Management The Professional Refereed Journal of the International Association of Hospitality Financial The Professional Refereed Journal of the International Association of Hospitality Financial
Management Educators Management Educators
Volume 27 Issue 1 Article 3
2019
Strategic Effect of Degree of Operating Leverage on Value Strategic Effect of Degree of Operating Leverage on Value
Premium of Lodging Firms Premium of Lodging Firms
Akshaya Pawar University of Massachusetts Amherst
Raju Gholap University of Massachusetts Amherst
Atul Sheel University of Massachusetts - Amherst
Follow this and additional works at: https://scholarworks.umass.edu/jhfm
Recommended Citation Recommended Citation Pawar, Akshaya; Gholap, Raju; and Sheel, Atul (2019) "Strategic Effect of Degree of Operating Leverage on Value Premium of Lodging Firms," Journal of Hospitality Financial Management: Vol. 27 : Iss. 1 , Article 3. DOI: https://doi.org/10.7275/2zz5-ey49 Available at: https://scholarworks.umass.edu/jhfm/vol27/iss1/3
This Refereed Article is brought to you for free and open access by ScholarWorks@UMass Amherst. It has been accepted for inclusion in Journal of Hospitality Financial Management by an authorized editor of ScholarWorks@UMass Amherst. For more information, please contact [email protected].
THE JOURNAL OF HOSPITALITY FINANCIAL MANAGEMENT2019, VOL. 27, NO. 1, 16–26https://doi.org/10.7275/2zz5-ey49
CONTACT: Address correspondence to Akshaya Pawar, Isenberg School of Management, University of Massachusetts Amherst, 121 Presidents Drive, Amherst, MA 01003, USA. Email: [email protected].
Strategic Effect of Degree of Operating Leverage on Value Premium of Lodging FirmsAkshaya Pawar, Raju Gholap, and Atul SheelIsenberg School of Management, University of Massachusetts Amherst, Amherst, MA
ABSTRACTThe potential association between a firm’s strategic use of its degree of operating leverage (DOL) and its value premium has been a subject of considerable interest and debate among researchers in the past (Carlson, Fisher, & Giammarino, 2004; Garcia- Feijoo & Jorgensen, 2010). Existent finance literature also discusses the trade- off between DOL and degree of financial leverage (DFL) (Dugan & Shriver, 1992; Mandelker & Rhee, 1984). While most researchers focus on cross- sectional research in this area, Huffman (1989) further documented variation in the DOL and DFL across industries. The lodging sector of the hospitality industry is unique in many ways (Lee and Jang, 2007; Madan, 2007; Singal, 2015). This paper evaluates the impact of DOL on the value premium of lodging firms, the trade- off between DOL and DFL in these firms, and how this important lever can be used by manage-ment to make strategic business decisions.
Key words: lodging firms, strategic business decisions, value premium, degree of operating leverage, degree of financial leverage, trade- off
Introduction
A firm’s choice between debt versus equity financ-ing can impact its cost of capital and hence its per-formance (Modigliani & Miller, 1963). Researchers have further shown that a firm’s degree of operating leverage (DOL), a proxy for the firm’s operating risk, and its degree of financial leverage (DFL), a proxy for its financial risk, can also affect the equity value of the firm and its expected rate of return (Lev, 1974; McDaniel, 1984; Lederer & Mehta, 2005; Guthrie, 2011). While a firm’s DOL measures the sensitivity of its earnings before interest and taxes to changes in its revenue, its DFL measures the sensitivity of the earnings per share to the percentage change in earnings before interest and taxes. A firm’s man-agement can use this information to make strategic capital structure decisions and to assess the rewards from operating and financial decisions (Gahlon & Gentry, 1982).
Several conventional studies in finance document a positive association between operating leverage
and stock returns suggesting that operating lever-age influences a firm’s value premium (Carlson, Fisher, & Giammarino, 2004; Zhang, 2005; Cooper, 2006; García- Feijóo & Jorgensen, 2010). According to these studies, DOL affects the operating risk of a firm, thus affecting its equity value and expected rate of return. Hence, DOL is vital for corporate policy and performance. While there is a plethora of stud-ies in this area in the general framework, industry- specific DOL and DFL studies have been scarce.
Industry differences in the book- to- market ratios (BE/ME) are often attributed to the varying levels of fixed capital found across industries (Novy- Marx, 2010). Historically, lodging sector firms have been known for their higher capital intensity relative to firms in many other sectors (Lee & Jang, 2007; Madan, 2007; Muradoglu & Sivaprasad, 2014; Sin-gal, 2015). Many of these firms prefer using debt for funding investments as they find it cheaper than using equity (Modigliani & Miller, 1963; Myers & Majluf, 1984; Frank & Goyal, 2003). Also, real estate and other tangible assets in these firms can be used
THE JOURNAL OF HOSPITALITY FINANCIAL MANAGEMENT 17
as collateral (Madan, 2007; Singal, 2015) for raising the capital. Hence, the level of DOL and DFL in these firms, and their potential relationship to firm value becomes especially important for both researchers and industry experts.
This paper examines the effect of DOL on the value premium of lodging firms. It also studies the trade- off between DOL and DFL in the context of lodging firms.
Literature Review
The theories of Mandelkar and Rhee (1984), Kwansa (1994), and Darrat and Mukherjee (1995) are some of the studies that paved the way and are followed by most of the researchers to test the effect of operating and financial leverage on a firm’s equity risk. Man-delkar and Rhee (1984) tested their model across industries and found no difference of the effect of degree of operating leverage and degree of financial leverage on beta. However, Huffman (1989) posited that the degree of operating leverage, degree of finan-cial leverage and beta are affected by a firm’s capital structure, which varies across industries. Valuation theory points out that there is a relation between the firm earnings and value of its common stock (Modigliani & Miller, 1958; Beaver, 1968). Modigli-ani and Miller (1958) argue that the expected yield on a share is equal to the sum of appropriate capi-talization ratio and financial risk premium, which is related to the debt- equity ratio. They found a positive relationship between leverage and return. Hamada (1972) provided support to this theory.
Changes in earnings of the firm are associated with stock returns, hence they are considered value relevant (Ball & Brown, 1968). Dimitrov and Jain (2008) found a negative relation between stock returns and the firm’s leverage. Thus, leverage can provide important information about the economic performance of the firm. Most of these studies do not consider the differences between firms in differ-ent sectors and do not test the relationship between leverage and performance in highly leveraged and capital- intensive firms like the lodging industry and their returns. The true nature of the relationship between leverage and stock returns can be found only by testing this relationship within industries. This is true, as the financial needs differ within industries. (Arditi, 1967; Baker, 1973; Melicher, 1974). Highly
leveraged firms are considered to have potentially higher distress costs and hence regarded as risky by investors. Hence, higher leverage increases the firm’s risk (Brealey & Myers, 1984). An increase in revenues results in an increase in operating gains for a firm whose degree of operating leverage is high. But on the flip side, in unsuitable economic environ-ments, when the revenues decrease, the firms with a high degree of operating leverage will face large operating losses.
Lev (1974) showed a positive relationship between a firm’s operating leverage and the system-atic risk, and the overall risk to the common stock. Value stocks earn higher average stock returns as they have higher systematic risk (Carlson, Fisher, & Giammarino, 2004; Zhang, 2005; Cooper, 2006). Garcia- Feijoo and Jorgenson (2010) found a posi-tive relation between stock returns and DOL, both at the firm and portfolio level. Both DOL and DFL are found to influence value premium (Fama & French, 1996; Chen & Zhang, 1998; Berk, Green, & Naik, 1999; Carlson, Fisher, & Giammarino, 2004). Novy- Marx (2010) tested the relationship between value premium and operating leverage across and within industries. The study showed that the value premium is weak across industries but strong within industries.
The effect of financial leverage on the restaurant firm’s profitability and risk was investigated by Yoon and Jang (2005). Jang and Tang (2009) studied the effects of international diversification and financial risk on the profitability of hospitality firms. Huo and Kwansa (1994) compared the riskiness of the firms in the hospitality industry with the firms in the util-ity industry in the years 1990 to 1991, the recession-ary period. Lee, Koh, and Kang (2011) examined the effect of capital intensity on the relationship between a firm’s leverage and degree of financial stress for restaurant firms during 1990 to 2008. Financial stress can be defined as the condition in which the firm is either unable to meet its financial obligations or has difficulty meeting them (Wu, Liang, & Yang, 2008).
Most of the modern research on the impact of oper-ating leverage and financial leverage has its origins in the studies by Hamada (1972), Rubinstein (1973), Lev (1974), and Bowman (1979). These studies have demonstrated that a firm’s financial and operating leverage have a positive relationship with its beta. Thus, operating leverage and financial leverage are
18 A. PAWAR ET AL.
two real determinants of the systematic risk of com-mon stock (Garcia & Jorgensen, 2010). Dugan and Shriver (1992) present a dynamic concept of DOL in which operating leverage is a function of fixed costs. There are difficulties in estimating equity betas using return data (Gahlon & Gentry, 1982; Jagannathan & Wang, 1993). There is no unified approach for esti-mating DOL and DFL in the literature. Assumptions are made in the classical ex- ante model to conclude that DOL and DFL should be estimated as elasticity measures. The time- series approach was pioneered by Mandelkar and Rhee (1984) and Ang and Peter-son (1984), which uses a regression of the earnings before interest and taxes (EBIT) on sales to estimate DOL. This approach seems to be the most appropri-ate theoretically, although it suffers biases similar to the point- to- point approach put forth by Ferri and Jones (1979) and Lord (1998).
As discussed below, time series regression method is the main empirical method used in the paper while the point- to- point approach has been used as a robustness check. The point- to- point estimate is the ratio of net fixed assets to total assets (Ferri & Jones, 1979; Mandelkar & Rhee, 1984). To control for a spurious correlation in terms of growth in both EBIT and sales, O’Brien and Vanderheiden (1987) recommended detrending the series. This will avoid biasing the DOL toward either value. After compar-ing the techniques of O’Brien and Vanderheiden (1987) and Mandelkar and Rhee (1984), Dugan and Shriver (1992) found that the detrending technique was more consistent with the ex- ante model. The O’Brien and Vanderheiden (1987) detrending tech-nique has been used in this paper before using the time series regression approach followed by Man-delkar and Rhee (1984).
The transformation to compute logs of negative earnings (Ljungquist and Wilhelm, 2005) used by Garcia and Jorgensen (2010) in their study, is a use-ful tool to treat firms with negative earnings while estimating the DOL using the time- series regres-sion. As reviewed earlier, a number of theoretical papers have put forward a hypothesis relating oper-ating leverage and value premium (Carlson, Fisher, & Giammarino, 2004). The empirical analysis by Novy- Marx (2007) measures operating leverage as operating costs over book assets, which supports the earlier hypothesis but does not report an association
between DOL and BE/ME. Also, the measure for operating leverage has not been used in the litera-ture. This paper measures the operating leverage (DOL) as per the existing literature.
The unique nature of lodging industry has a pro-found impact on the financial leverage (FL) of the hospitality firms. The financial leverage is associ-ated with the systematic risk of the firm (Hamada, 1972; Bowman, 1979). The association between DFL and beta does not seem to be conclusive. Mandelker and Rhee (1984) concludes a positive relationship between DFL and beta whereas Dar-rat and Mukherjee (1995) and Lord (1996) do not see any such association. As per Fama and French (1992), the relationship between financial leverage and stock returns is weak, while other researchers suggest a tradeoff (Dotan & Ravid, 1985; Trezevant, 1992). Researchers like Huffman (1989), Prezas (1987), and Kale, Noe, and Ramirez (1991) found a U-shaped association of operating leverage with the financial leverage. The DFL is therefore considered a control variable in this study. Further, the DFL is correlated to financial distress (Fama & French, 1996) as value premium compensates for the finan-cial distress risk. The high levels of financial leverage are a contributing factor while measuring finan-cial distress cost (Opler & Titman, 1994). Thus, to the extent that financial leverage is correlated with financial distress, this study can shed additional light on the hypothesis that the value premium is associated with financial distress risk.
Empirical evidence suggests that financial dis-tress is generally related to idiosyncratic factors. As per Campbell, Hilscher, and Szilagyi (2008) value premium is not a compensation for financial distress risk. It was found in this study that value premium is associated with both operating lever-age and financial leverage. Even though theoretical papers generally ignore degree of financial leverage while exploring the relationship between operating leverage and value premium, it is still included in this paper. The DFL acts as a control for financial leverage and as a factor in evaluating the relation-ship between value premium and DOL/financial distress risk. To maintain consistency and to facil-itate comparisons with previous literature, DFL has been estimated using the time series regression method.
THE JOURNAL OF HOSPITALITY FINANCIAL MANAGEMENT 19
Lodging Sector Features and Hypothesis Development
As explained earlier, lodging sector firms have been known for their higher capital intensity relative to firms in many other sectors (Singh & Kwansa, 1999; Upneja & Dalbor, 2001; Singh & Upneja, 2007; Lee & Jang, 2007; Madan, 2007; Muradoglu & Sivaprasad, 2014; Singal, 2015). Many of these firms prefer using debt for funding investments, as they find it cheaper than using equity (Modigliani & Miller, 1963, Myers & Majluf, 1984; Frank & Goyal, 2003). Also, real estate and other tangible assets in these firms can be used as collateral (Madan, 2007; Singal, 2015) for raising the capital. Higher capital intensity often results in higher operating and financial lever-age. Further, this sector is also prone to seasonality, causing significant revenue fluctuations and poten-tial profit squeezes during off seasons and economic downturns. Consequently, the role of DOL and DFL in these firms, and their potential relationship to a firm’s value premium becomes especially import-ant from a research perspective. In line with the above discussion, this study examines the following hypotheses:
Hypothesis 1: There is a relationship between DOL and value premium in the lodging firms.
Hypothesis 2: There is a trade- off in the impact of DOL and DFL on the value premium of lodging firms.
Data and Methodology
Data were collected for all companies with NAICS code 721110 (hotels except casinos and motels) in Compustat and CRSP for the period 1978– 2017. The variables used were total assets, current assets, market capitalization, book value, common shares outstanding, EBIT, EAIT, liabilities and stockholder equity, income taxes, interest and related expenses total, dividend per share, and price close.
Estimating DOL and DFL, and Portfolio Formation
DOL estimation methods used by Mandelker and Rhee (1984) and O’Brien and Vanderheiden (1987) were followed in the analysis. Using the methods
adopted by Garcia and Jorgensen (2010), regres-sions were run at the firm level.
The following regressions were run to estimate DOL:
LnEBITt = LnEBIT0 + gebit t + µt,ebit ,LnSalest = Ln Sales0 + gsales t + µt,sales ,
EBIT0 represents beginning level of EBIT and Sales0 represents the beginning level of sales. Transforma-tion is used to compute logs of negative earnings (Ljungqvist & Wilhelm, 2005).
Ln (1 + EBIT) if EBIT ≥ 0 , and – Ln (1– EBIT) if EBIT <0 .
Once the µt,ebit and µt,sales residual series are produced by the regressions, the following is estimated:
µt,ebit = OL µt,sales + et,
et is an error term. OL, the estimates of DOL, mea-sures the average sensitivity of the percentage devi-ation of EBIT from its trend relative to the percent deviation of sales from its trend.
DFL was similarly estimated running regression as below:
LnEAITt = LnEAIT0 + geait t + µt,eait ,µt,eait = FL µt,ebit + ut
FL is the estimate of DFL and measures average sen-sitivity of the percentage deviation of EAIT from its trend relative to the percentage deviation of EBIT from its trend. The firm level estimates of DOL and DFL for the years 1978 to 2018 are obtained. DOL is measured in absolute values (Reilly & Brown, 2003).
Market Equity and Book Equity were obtained from Compustat and CRSP. BE/ME ratio was com-puted by dividing book value of the equity by the market value of equity (Fama & French, 1992). Data on market value were obtained from CRSP and stock returns were computed as follows:
Stock Return = {(P1— P0 ) + D} / P0
where P0 is the initial stock price, P1 is the ending stock price for the period, and D is the dividend
20 A. PAWAR ET AL.
payout. All firms, both active and inactive for the period 1978– 2017, were included in the database to capture effects of recessionary trends.
Mandelkar and Rhee (1984) found measurement errors of variable at the level of individual firms. Therefore, portfolio grouping procedures (Beaver, Kettler, & Scholes, 1970; Jensen, Black, & Scholes, 1972; Fama & McBeth, 1973) also employed by Man-delkar and Rhee (1984) were used to reduce these measurement errors. Each year, the stocks were divided into five groups based on ranked values of their size computed as market value (obtained from Compustat and CRSP) and into five groups based on ranked values of their book- to- market equity ratios. The size and BE/ME breakpoints were computed by percentiles, and 25 portfolios were formed by com-bining the sorts by size and by BE/ME ratio.
Computation of the Other Variables
The Book- to- Market Equity ratio (BE/ME) was computed using the data on market capitalization (ME) and book equity (BE) obtained from Compus-tat and CRSP. The market capitalization (ME) was obtained by using market value, while stock returns were computed from the stock prices and dividends obtained from Compustat and CRSP. To reduce sur-vival biases, firms with Compustat/CRSP data of less than five years were not included in the analysis.
DOL, DFL, and DTL are the degree of operating, financial, and total leverage computed as explained in the estimation of DOL and DFL and in Table 1. DOL and DFL were measured in absolute terms and the Degree of Total Leverage (DTL) was computed as DOL times DFL (DOL*DFL). Book DOL is the ratio of fixed assets to total assets and Book DFL is the ratio of total debt to total assets.
Empirical Results
Table 1 summarizes the summary statistics relevant to the test sample for the 1978– 2017 period. Panel A of the table provides the descriptive statistics for the test variables. Panel B summarizes the correlation analysis results.
As shown in Panel A, the mean BE/ME ratio was 0.99, indicating a higher market capitalization in the
sample. The average size of the firms was reported at 5.67 million. The average DOL and DFL estimates were 0.26 and 1.70, respectively, and average DTL for all the firms was 2.27. The mean Book DFL was 0.80 and Book DFL was 0.61 for all the firms in the sample.
As shown in Panel B, the BE/ME was significantly negatively correlated to the DOL and significantly positively correlated with DFL. The correlations were statistically significant at the 5% and 1% level, respectively. Firm size was significantly negatively correlated to BE/ME, DOL, and DFL
In essence, Table 1 results showed a potential relationship between DOL, DFL, and a lodging firm’s book- to- market ratio that required further investigation. To study this phenomenon further, we formed portfolios for lodging firms based on their BE/ME and Size Quintiles as in Fama and French (1993). Results of mean attributes of these quintiles are summarized in Table 2. The DOL and DFL val-ues of each quintile were graphed in Figures 1 and 2.
As shown in Table 2, over the financial period, high BE/ME stocks outperformed low BE/ME stocks. The average quarterly stock returns of high BE/ME quintile were 3% vis- à- vis the –1% of the low BE/ME quintile across all firms.
The same trend was seen in the large firms: 14% and –1% in the high BE/ME and low BE/ME quin-tile, respectively. The reverse was true for the smaller firms, where the low BE/ME quintile outperformed the high BE/ME quintile: the returns were 7% and 1%, respectively.
Consistent with Garcia and Jorgensen (2010), when both size and BE/ME quintiles were used simultaneously, no significant association between size and returns was found. In the low BE/ME quin-tile, the low size firms earned 7% returns and high size firms earned –1% returns, while in the high BE/ME quintiles, the low size firms earned 1% returns vis- à- vis 5% in the high size firms.
Table 2 reports the DOL estimates by size and BE/ME quintile, and the same is illustrated in Figure 2. In contrast to the findings seen in most conventional finance literature, there is a clear negative associa-tion between DOL and BE/ME. Unconditionally, the DOL estimates decreased from 0.67 to 0.13 as the BE/ME quintile increased from low to high. After
THE JOURNAL OF HOSPITALITY FINANCIAL MANAGEMENT 21
conditioning for size, the DOL decreased from 7.6 to 0.31 in the small size firms and the DOL settled at 0.08 in the high size firms across the BE/ME quintile (low to high). DOL was also negatively correlated to size. Unconditionally, it decreased from 1.04 to 0.07 across the firms as they increased in size. When con-ditioned with BE/ME, the DOL decreased from 7.6 to 0.08 in the lower BE/ME quintile and from 0.31 to 0.05 in the higher BE/ME quintile across the size quintile (low to high).
Table 2 also reports the DFL estimates by size and BE/ME quintile, which is illustrated in Figure 3.
There was positive association between DFL and BE/ME. Unconditionally, the DFL increased from 1.03 to 3.61 as the BE/ME quintile increased from
low to high. When conditioned on size, the DFL increased from 4.47 to 5.74 in small size firms across the BE/ME quintile and from 0.49 to 0.54 in high size firms across the BE/ME quintile (low to high).
The association between DFL and size was nega-tive. Unconditionally, from low to high, it decreased from 4.78 to 0.48 across the size quintile. When con-ditioned on BE/ME, it decreased from 4.47 to 0.49 in the low BE/ME quintile, and it decreased from 5.74 to 0.64 in the high BE/ME quintile across the size quintile (low to high).
The findings in Table 2 and the subsequent graphs suggested the need for further investigation of the relationship between a lodging firm’s DOL and DFL, vis- à- vis its book- to- market ratio and size. To
Table 1. Sample Summary StatisticsData were collected for Earnings before interest and taxes and Earnings after interest and taxes from the Compustat database for the fiscal period 1978- 2017. The DOL and DFL were estimated for the same period by running the following regressions at the individual firm level:
LnEBITt = LnEBIT0 + gebit t + µt,ebit ,
LnSalest = Ln Sales0 + gsales t + µt,sales ,
EBIT0 represents beginning level of EBIT and Sales0 represents the beginning level of sales. Transformation is used to compute logs of negative earnings as follows:
Ln(1 + EBIT) if EBIT ≥ 0 , and – Ln(1 – EBIT) if EBIT < 0.
Once the µt,ebit and µt,sales residual series are produced by the regressions, the following is estimated:
µt,ebit = OL µt,sales + et,
et is an error term. OL, the estimate of DOL , measures the average sensitivity of the percentage deviation of EBIT from its trend relative to the percent deviation of Sales from its trend. DFL is similarly estimated by running the regression as follows:
LnEAITt = LnEAIT0 +geait t+ µt,eait ,
µt,eait=FL µt,ebit + ut
ut is an error term. FL, the estimate of DFL, measures average sensitivity of the percentage deviation of EAIT from its trend relative to the percentage deviation of EBIT from its trend.
A. Descriptive Statistics for the Test VariablesVariables Mean Std. Dev P5 P25 P50 P75 P95
Note: * Correlation is significant at the 0.05 level (2- tailed). ** Correlation is significant at the 0.01 level (2- tailed).
22 A. PAWAR ET AL.
0.500.450.400.350.300.250.200.150.100.050.00
Low 2
43
2
3 4 High
Size Quintile
Low
High
BE/ME Q
uintile
3.00
2.50
2.00
1.50
1.00
0.50
0.00Low 2 3 4 High
Size Quintile
High
LowBE/M
E Quintile
23
4
Figure 2. Average Degree of Financial Leverage by Book- to- Market Equity Ratio and Market Capitalization Quintiles.
Figure 1. Average Degree of Operating Leverage by Book- to- Market Equity Ratio and Market Capitalization Quintiles.
Table 2. Characteristics for Quintile Portfolios Formed on Book- to- Market Equity and SizeThe mean estimates of quarterly stock returns, DOL, DFL and DTL are reported for 25 portfolios based on the BE/ME and Size, as in Fama and French (1993).
THE JOURNAL OF HOSPITALITY FINANCIAL MANAGEMENT 23
analyze this phenomenon, we first used t-tests to test for differences in mean values of DOL and DFL in contrasting samples of high/low BE/ME portfolios and high/low size portfolios. Table 3 summarizes the results of these tests for mean differences.
As shown in Table 3, for high BE/ME quintile portfolio, the DOL levels were 0.52 lower than the low BE/ME portfolio. The difference was significant at the 5% level. The DFL level was 0.56 higher in the high BE/ME portfolio than the low BE/ME portfolio and the difference was significant at the 5% level.
In the size quintiles, DOL levels were 1.45 lower for large firms than the small firms. The DFL levels were 0.53 higher for large firms than the small firms.
Both the differences in DOL and DFL were signifi-cant at the 5% level.
The statistical significance for t-tests for differ-ences in mean DOL and DFL values for the contrast-ing portfolios of high/low BE/ME and size portfolios, and the possible moderating effect of size quintiles (Table 2 and Figures 1 & 2) suggested the need to explore the robustness of this phenomenon further. The final phase of our study used GLM regressions to assess how the DOL and DFL of lodging firms related to their value premium proxies— BE/ME ratio, after controlling for size. Table 4 summarizes the results of these regressions.
Table 3. T- Test Results for Difference in Means of DOL and DFL in Contrasting Samples of High and Low BE/ME Portfolios and High and Low Size Portfolios
This table summarizes the results of a t-test for differences in means of the high BE/ME quintile group (Portfolio 5) vis- à- vis the low BE/ME quintile group (Portfolio 1) and higher size quintile group (Portfolio 5) vis- à- vis lower size quintile group (Portfolio 1). The mean values and the differences in mean between the two groups are provided along with the significance levels.
Book Equity to Market Equity Market Value of Equity
Table 4. Cross Sectional Regression Test Results of Book- to- Market Values on Degree of Operating and Financial Leverage after Controlling for Size
This set of tests included three sets of GLM regressions using the following models:1. LnBE/ME = f(LnDOL, Size)2. LnBE/ME = f(LnDFL, Size)3. LnBE/ME = f(LnDOL, LnDFL, Size)The coefficients along with their corresponding t-values and significance levels are summarized below:
Average Parameter Values and t-statistics
Dependent Variable N Intercept LnDOL LnDFL Size F statistic P-value
Note: *** Correlation is significant at the 0.01 level. ** Correlation is significant at the 0.05 level. Robustness Checks: Regression values for VIF’s < 5.6. Durbin Watson Statistics 2 < d < 2.5
24 A. PAWAR ET AL.
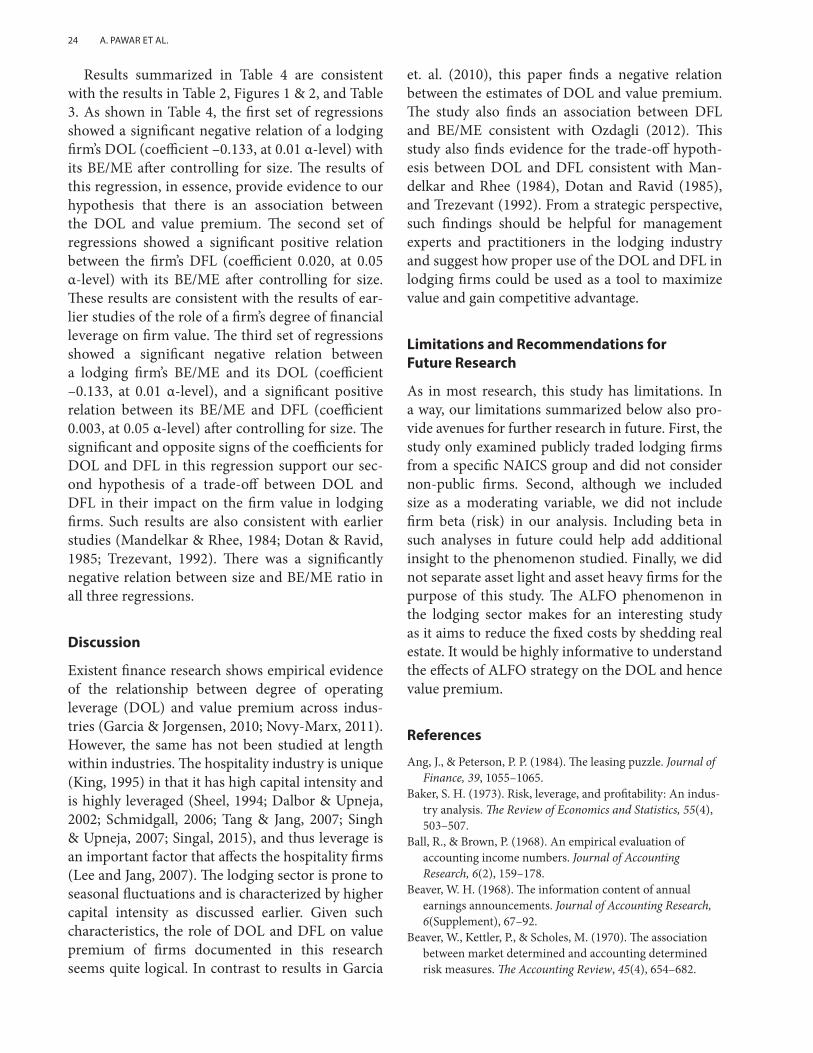
Results summarized in Table 4 are consistent with the results in Table 2, Figures 1 & 2, and Table 3. As shown in Table 4, the first set of regressions showed a significant negative relation of a lodging firm’s DOL (coefficient –0.133, at 0.01 α-level) with its BE/ME after controlling for size. The results of this regression, in essence, provide evidence to our hypothesis that there is an association between the DOL and value premium. The second set of regressions showed a significant positive relation between the firm’s DFL (coefficient 0.020, at 0.05 α- level) with its BE/ME after controlling for size. These results are consistent with the results of ear-lier studies of the role of a firm’s degree of financial leverage on firm value. The third set of regressions showed a significant negative relation between a lodging firm’s BE/ME and its DOL (coefficient –0.133, at 0.01 α- level), and a significant positive relation between its BE/ME and DFL (coefficient 0.003, at 0.05 α- level) after controlling for size. The significant and opposite signs of the coefficients for DOL and DFL in this regression support our sec-ond hypothesis of a trade- off between DOL and DFL in their impact on the firm value in lodging firms. Such results are also consistent with earlier studies (Mandelkar & Rhee, 1984; Dotan & Ravid, 1985; Trezevant, 1992). There was a significantly negative relation between size and BE/ME ratio in all three regressions.
Discussion
Existent finance research shows empirical evidence of the relationship between degree of operating leverage (DOL) and value premium across indus-tries (Garcia & Jorgensen, 2010; Novy- Marx, 2011). However, the same has not been studied at length within industries. The hospitality industry is unique (King, 1995) in that it has high capital intensity and is highly leveraged (Sheel, 1994; Dalbor & Upneja, 2002; Schmidgall, 2006; Tang & Jang, 2007; Singh & Upneja, 2007; Singal, 2015), and thus leverage is an important factor that affects the hospitality firms (Lee and Jang, 2007). The lodging sector is prone to seasonal fluctuations and is characterized by higher capital intensity as discussed earlier. Given such characteristics, the role of DOL and DFL on value premium of firms documented in this research seems quite logical. In contrast to results in Garcia
et. al. (2010), this paper finds a negative relation between the estimates of DOL and value premium. The study also finds an association between DFL and BE/ME consistent with Ozdagli (2012). This study also finds evidence for the trade- off hypoth-esis between DOL and DFL consistent with Man-delkar and Rhee (1984), Dotan and Ravid (1985), and Trezevant (1992). From a strategic perspective, such findings should be helpful for management experts and practitioners in the lodging industry and suggest how proper use of the DOL and DFL in lodging firms could be used as a tool to maximize value and gain competitive advantage.
Limitations and Recommendations for Future Research
As in most research, this study has limitations. In a way, our limitations summarized below also pro-vide avenues for further research in future. First, the study only examined publicly traded lodging firms from a specific NAICS group and did not consider non- public firms. Second, although we included size as a moderating variable, we did not include firm beta (risk) in our analysis. Including beta in such analyses in future could help add additional insight to the phenomenon studied. Finally, we did not separate asset light and asset heavy firms for the purpose of this study. The ALFO phenomenon in the lodging sector makes for an interesting study as it aims to reduce the fixed costs by shedding real estate. It would be highly informative to understand the effects of ALFO strategy on the DOL and hence value premium.
References
Ang, J., & Peterson, P. P. (1984). The leasing puzzle. Journal of Finance, 39, 1055– 1065.
Baker, S. H. (1973). Risk, leverage, and profitability: An indus-try analysis. The Review of Economics and Statistics, 55(4), 503– 507.
Ball, R., & Brown, P. (1968). An empirical evaluation of accounting income numbers. Journal of Accounting Research, 6(2), 159– 178.
Beaver, W. H. (1968). The information content of annual earnings announcements. Journal of Accounting Research, 6(Supplement), 67– 92.
Beaver, W., Kettler, P., & Scholes, M. (1970). The association between market determined and accounting determined risk measures. The Accounting Review, 45(4), 654– 682.
THE JOURNAL OF HOSPITALITY FINANCIAL MANAGEMENT 25
Berk, J. B., Green, R. C., & Naik, V. (1999). Optimal invest-ment, growth options, and security returns. Journal of Finance, 54, 1553– 1607.
Bowman, R. G. (1979). The theoretical relationship between the systematic risk and financial (accounting) variables. Journal of Finance, 34, 617– 630.
Brealey, R. A., & Myers, S. C. (1984). Principles of corporate finance. New York: McGraw- Hill.
Campbell, J. Y., Hilscher, J., & Szilagyi, J. (2008). In search of distress risk. Journal of Finance, 63, 2899– 2939.
Carlson, M., Fisher, A., & Giammarino, R. (2004). Corporate investment and asset price dynamics: Implications for the cross section of returns. Journal of Finance, 59, 2577– 2603.
Chen, N., & Zhang, F. (1998). Risk and return of value stocks. Journal of Business, 71, 501– 535.
Cooper, I. (2006). Asset pricing implications of non- convex adjustment costs and irreversibility of investment. Journal of Finance, 61, 139– 170.
Dalbor, M. C., & Upneja, A. (2002). Factors affecting the long- term debt decision of restaurant firms. Journal of Hospital-ity and Tourism Research, 26(4), 422– 432.
Darrat, A. F., & Mukherjee, T. K. (1995). Inter- industry differences and the impact of operating and financial lever-ages on equity risk. Review of Financial Economics, 4(2), 141– 155.
Dimitrov, V., & Jain, P. C. (2008). The value relevance of changes in financial leverage beyond growth in assets and GAAP earnings. Journal of Accounting, Auditing and Finance, 23(2), 191– 222.
Dotan, A., & Ravid, S. A. (1985). On the interaction of real and financial decisions of the firm under uncertainty. Jour-nal of Finance, 40, 501– 517.
Dugan, M. T., & Shriver, K. A. (1992). An empirical compari-son of alternative methods for the estimation of the degree of operating leverage. Financial Review, 27(2), 309– 321.
Fama, E. F., & French, K. R. (1992). The cross-section of expected stock returns. Journal of Finance, 47(2), 427– 465.
Fama, E. F., & French, K. R. (1993). Common risk factors in the returns on stocks and bonds. Journal of Financial Economics, 33(1), 3– 56.
Fama, E. F., & French, K. R. (1996). The CAPM is wanted, dead or alive. Journal of Finance, 51(5), 1947– 1958.
Fama, E. F., & French, K. F. (2006). The value premium and the CAPM. Journal of Finance, 61(5), 2163– 2185.
Fama, E. F., & MacBeth, J. D. (1973). Risk, return, and equilib-rium: Empirical tests. Journal of Political Economy, 81(3), 607– 636.
Ferri, M. G., & Jones, W. H. (1979). Determinants of financial structure: A new methodological approach. Journal of Finance, 34, 631– 644.
Frank, M. Z., & Goyal, V. K. (2003). Testing the pecking order theory of capital structure. Journal of Financial Economics, 67(2), 217– 248.
Gahlon, J. M., & Gentry, J. A. (1982). On the relationship between systematic risk and the degrees of operating and financial leverage. Financial Management, 11(2), 15– 23.
García- Feijóo, L., & Jorgensen, R. D. (2010). Can operating leverage be the cause of the value premium? Financial Management, 39(3), 1127– 1154.
Guthrie, G. (2011). A note on operating leverage and expected rates of return. Finance Research Letters, 8(2), 88– 100.
Hamada, R. S. (1972). The effect of the firm’s capital struc-ture on the systematic risk of common stocks. Journal of Finance, 27(2): 435– 452.
Huffman, S. P. (1989). The impact of the degrees of operating and financial leverage on the systematic risk of common stocks: Another look. Quarterly Journal of Business and Economics, 28(1), 83– 100.
Huo, Y. H., & Kwansa, F. (1994). Effect of operating and financing leverage on firm. Journal of the International Academy of Hospitality Research, (8).
Jagannathan, R., & Wang, Z. (1993). The CAPM is alive and well. Federal Reserve Bank of Minneapolis, Research Department.
Jang, S., & Tang, C. H. (2009). Simultaneous impacts of inter-national diversification and financial leverage on profit-ability. Journal of Hospitality and Tourism Research, 33(3), 347– 368.
Jensen, M. C., Black, F., & Scholes, M. S. (1972). The capital asset pricing model: Some empirical tests. New York: Praeger.
Kale, J. R., Noe, T. H., & Ramirez, G. G. (1991). The effect of business risk on corporate capital structure: Theory and evidence. Journal of Finance, 46(5), 1693– 1715.
Kwansa, F. A. (1994). Acquisitions, shareholder wealth and the lodging sector: 1980– 1990. International Journal of Contemporary Hospitality Management, 6(6), 16– 20.
Lederer, P. J., & Mehta, T. D. (2005). Economic evaluation of scale dependent technology investments. Production and Operations Management, 14(1), 21– 34.
Lee, J. S., & Jang, S. (2007). The systematic- risk determinants of the US airline industry. Tourism Management, 28(2), 434– 442.
Lee, S., Koh, Y., & Kang, K. H. (2011). Moderating effect of capital intensity on the relationship between leverage and financial distress in the U.S. restaurant industry. Interna-tional Journal of Hospitality Management, 30(2), 429– 438.
Lev, B. (1974). On the association between operating leverage and risk. The Journal of Financial and Quantitative Analy-sis, 9(4), 627– 641.
Ljungqvist, A., & Wilhelm, W. J., Jr. (2005). Does prospect theory explain IPO market behavior? Journal of Finance, 60, 1759– 1790.
Lord, R. (1996). The impact of operating and financial risk on equity risk. Journal of Economics and Finance, 20, 27– 38.
Lord, R. (1998). Properties of time- series estimates of degree of leverage measures. Financial Review, 33, 69– 84.
Madan, K. (2007). An analysis of the debt- equity structure of leading hotel chains in India International Journal of Con-temporary Hospitality Management, 19(5), 397– 414.
Mandelker, G. N., & Rhee, S. G. (1984). The impact of the degree of operation and financial leverage on systematic risk of common stock. Journal of Financial and Quantita-tive Analysis, 19(1), 45– 57.
26 A. PAWAR ET AL.
McDaniel, W. R. (1984). Operating leverage and operating risk. Journal of Business Finance and Accounting, 11(1), 113– 125.
Melicher, R. W. (1974). Financial factors which influence beta variations within a homogeneous industry environment. Journal of Financial and Quantitative Analysis, 9(2), 231– 241.
Modigliani, F., & Miller, M. H. (1958). The cost of capital, cor-poration finance and the theory of investment. American Economic Review, 48(3), 261– 297.
Modigliani, F., & Miller, M. H. (1963). Corporate income taxes and the cost of capital: A correction. American Economic Review, 53(3), 433– 443.
Muradoğlu, Y. G., & Sivaprasad, S. (2014). The impact of leverage on stock returns in the hospitality sector: Evidence from the UK. Tourism Analysis, 19(2), 161– 171.
Novy- Marx, R. (2007). Operating Leverage. University of Chicago and NBER Working Paper.
Novy- Marx, R. (2010). Operating leverage. Review of Finance, 15(1), 103– 134.
O’Brien, T. J., & Vanderheiden, P. A. (1987). Empirical mea-surement of operating leverage for growing firms. Financial Management, 16, 45– 53.
Opler, T. C., & Titman, S. (1994). Financial distress and corpo-rate performance. Journal of Finance, 49(3), 1015– 1040.
Ozdagli, A. K. (2012). Financial leverage, corporate invest-ment, and stock returns. The Review of Financial Studies, 25(4), 1033– 1069.
Prezas, A. P. (1987). Effects of debt on the degrees of operating and financial leverage. Financial Management, 16, 39– 44.
Reilly, F. K., & Brown, K. C. (2003). Investment analy-sis and portfolio management. Mason, OH: Thomson South- Western.
Rubinstein, M. E. (1973). A mean- variance synthesis of corpo-rate financial theory. Journal of Finance, 28, 167– 182.
Schmidgall, R. S., & Damitio, J. W. (2006). Hospitality indus-try financial accounting. East Lansing, MI: Educational Institute of the American Hotel and Lodging Educational Association.
Sheel, A. (1994). Determinants of capital structure choice and empirics on leverage behavior: A comparative analysis of hotel and manufacturing firms. Hospitality Research Jour-nal, 17(3), 1– 16.
Singal, M. (2015). How is the hospitality and tourism industry different? An empirical test of some structural character-istics. International Journal of Hospitality Management, 47, 116– 119.
Singh, A. J., & Kwansa, F. A. (1999). Financing the lodging industry in the next millennium. International Journal of Hospitality Management, 18(4), 415– 425.
Singh, A., & Upneja, A. (2007). Extent of hedging in the US lodging industry. International Journal of Hospitality Man-agement, 26(4), 764– 776.
Trezevant, R. (1992). Debt financing and tax status: Tests of the substitution effect and the tax exhaustion hypothesis using firms’ responses to the Economic Recovery Tax Act of 1981. Journal of Finance, 47, 1557– 1568.
Upneja, A., & Dalbor, M. (2001). The choice of long- term debt in the US lodging industry. UNLV Journal of Hospitality, Tourism and Leisure Science, 1, 1– 19.
Wu, D. D., Liang, L., & Yang, Z. (2008). Analyzing the finan-cial distress of Chinese public companies using proba-bilistic neural networks and multivariate discriminate analysis. Socio- Economic Planning Sciences, 42(3), 206– 220.
Yoon, E., & Jang, S. C. (2005). The effect of financial leverage on profitability and risk of restaurant firms. Journal of Hos-pitality Financial Management, 13(1), 1– 18.
Zhang, L. (2005). The value premium. Journal of Finance, 60, 67– 103.