Page 1
Strategic Environmental Assessment for the roll out of wind and solar
photovoltaic (PV) energy in South Africa
Norma Malatji 1, Kedibone Lamula1, Lydia Cape2, Fahiema Daniels1, Tsamaelo Malebu1, Abulele Adams2 and Reinett Ramogotshi2
Page 2
- Renewable energy is energy produced using natural resources that are
constantly replaced and never run out such as wind and sunlight.
- South Africa has experienced challenges with power supply in the past
- In order to resolve some of the energy challenges, South Africa has
identified a suite of energy sources as part of the integrated resource plan
- In 2012, as part of the NDP, 18 Strategic Integrated Projects were
identified, one of them was in support of the further development of the
renewable energy industry
- In 2013, The National Department of Environmental Affairs (DEA)
commissioned the wind and solar photovoltaic (PV) Strategic
Environmental Assessment (SEA) , in support of the Strategic Integrated
Project (SIP) 8.
Introduction
Page 3
The first phase of the Wind and Solar PV SEA was completed in 2015, and
identified 8 Renewable Energy Development Zones (REDZs)
The aim of this SEA was to identify areas where large scale wind and solar
(PV) energy facilities can be developed in a manner that limits significant
negative impacts on the environment, while yielding the highest possible
socio-economic benefits to the country.
Introduction continued ..
Page 4
Phase 1 Renewable Energy Development Zones
Page 5
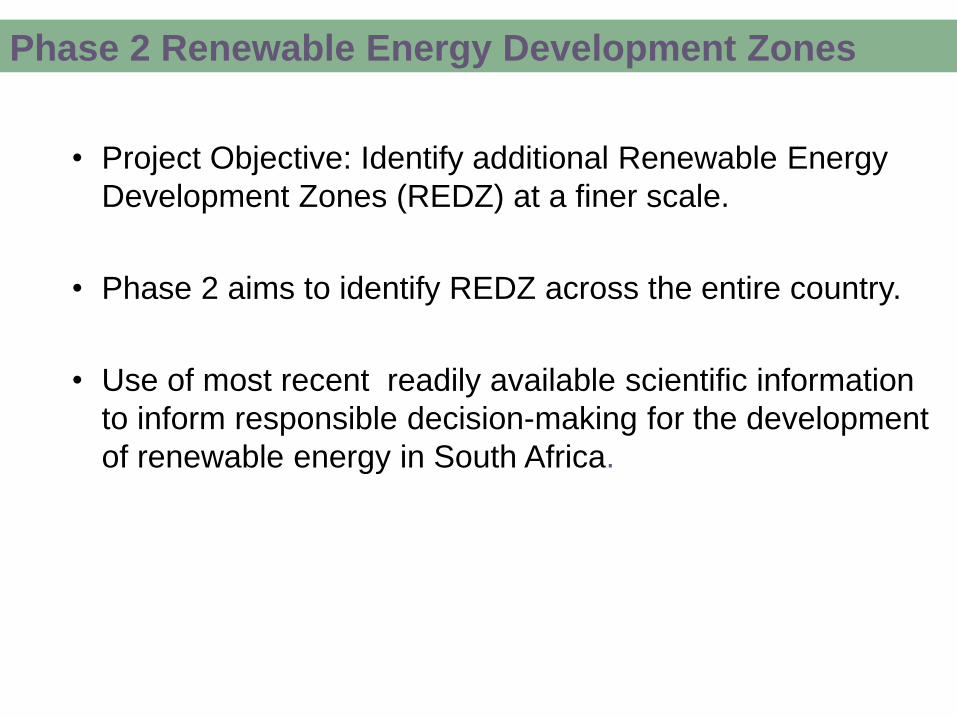
• Project Objective: Identify additional Renewable Energy
Development Zones (REDZ) at a finer scale.
• Phase 2 aims to identify REDZ across the entire country.
• Use of most recent readily available scientific information
to inform responsible decision-making for the development
of renewable energy in South Africa.
Phase 2 Renewable Energy Development Zones
Page 6
Socio-
economic
activity index
mapping
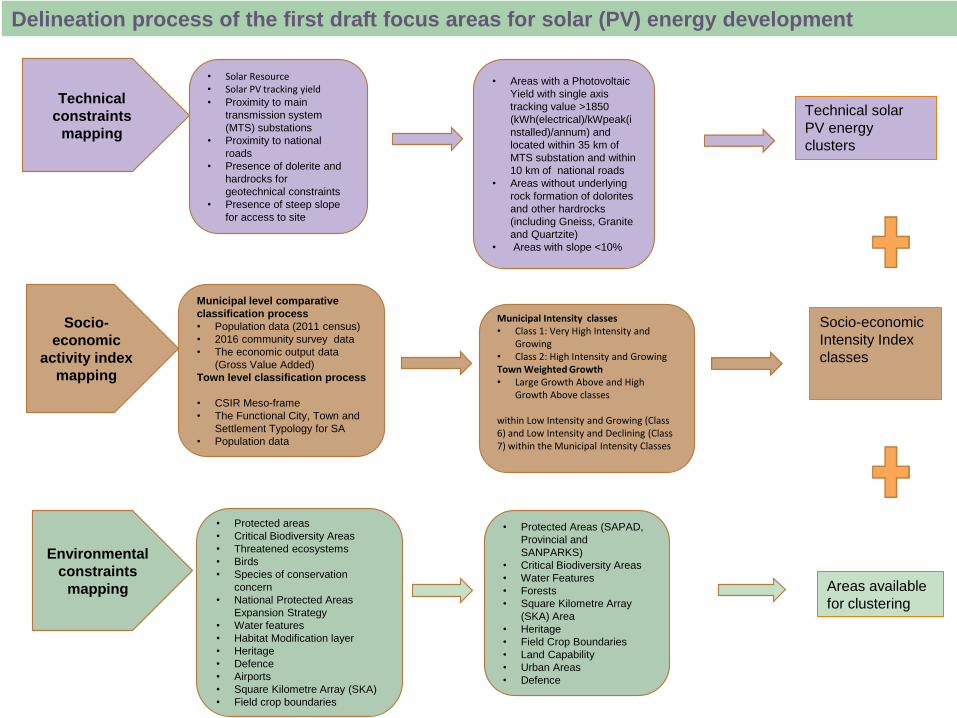
Delineation process of the first draft focus areas for solar (PV) energy development
Socio-economic
Intensity Index
classes
Municipal level comparative
classification process
• Population data (2011 census)
• 2016 community survey data
• The economic output data
(Gross Value Added)
Town level classification process
• CSIR Meso-frame
• The Functional City, Town and
Settlement Typology for SA
• Population data
Municipal Intensity classes • Class 1: Very High Intensity and
Growing • Class 2: High Intensity and Growing Town Weighted Growth • Large Growth Above and High
Growth Above classes within Low Intensity and Growing (Class 6) and Low Intensity and Declining (Class 7) within the Municipal Intensity Classes
Areas available
for clustering
• Protected areas
• Critical Biodiversity Areas
• Threatened ecosystems
• Birds
• Species of conservation
concern
• National Protected Areas
Expansion Strategy
• Water features
• Habitat Modification layer
• Heritage
• Defence
• Airports
• Square Kilometre Array (SKA)
• Field crop boundaries
• Protected Areas (SAPAD,
Provincial and
SANPARKS)
• Critical Biodiversity Areas
• Water Features
• Forests
• Square Kilometre Array
(SKA) Area
• Heritage
• Field Crop Boundaries
• Land Capability
• Urban Areas
• Defence
Environmental
constraints
mapping
Technical solar
PV energy
clusters
• Solar Resource • Solar PV tracking yield • Proximity to main
transmission system
(MTS) substations
• Proximity to national
roads
• Presence of dolerite and
hardrocks for
geotechnical constraints
• Presence of steep slope
for access to site
• Areas with a Photovoltaic
Yield with single axis
tracking value >1850
(kWh(electrical)/kWpeak(i
nstalled)/annum) and
located within 35 km of
MTS substation and within
10 km of national roads
• Areas without underlying
rock formation of dolorites
and other hardrocks
(including Gneiss, Granite
and Quartzite)
• Areas with slope <10%
Technical
constraints
mapping
Page 7
Spatial distribution of features used for the delineation process
Technical solar PV energy clusters Socio-economic Intensity Index
Available areas for clustering
Page 8
Focus areas for solar PV energy development
Page 9
Socio-economic
Intensity Index
classes
Municipal level comparative
classification process
• Population data (2011 census)
• 2016 community survey data
• The economic output data
(Gross Value Added)
Town level classification
process
• CSIR Meso-frame
• The Functional City, Town and
Settlement Typology for SA
• Population data
Municipal Intensity classes • Class 1: Very High Intensity and
Growing • Class 2: High Intensity and Growing Town Weighted Growth • Large Growth Above and High
Growth Above classes within Low Intensity and Growing (Class 6) and Low Intensity and Declining (Class 7) within the Municipal Intensity Classes
Socio-
economic
activity index
mapping
Delineation process of the first draft focus areas for wind energy development
Areas available
for clustering
• Protected areas
• Critical Biodiversity Areas
• Threatened ecosystems
• Birds
• Species of conservation
concern
• National Protected Areas
Expansion Strategy
• Water features
• Habitat Modification layer
• Heritage
• Defence
• Airports
• Square Kilometre Array
(SKA) Area
• Field crop boundaries
• Protected Areas (SAPAD,
Provincial and SANPARKS)
• Critical Biodiversity Areas
• Water Features
• Forests
• Square Kilometre Array (SKA)
Area
• Heritage
• Field Crop Boundaries
• Land Capability
• Urban Areas
• Defence
• Birds (VULPRO cape vulture
colonies and restaurants, black
harrier roosts sites, important
bird areas
• Bats ( Bat Roosts, Ecoregions)
Environmental
constraints
mapping
Technical wind
energy clusters
• Wind resource
• Wind capacity factor
• Proximity to main
transmission system
(MTS) substations
• Proximity to national
roads
• Presence of dolerite
and hardrocks for
geotechnical
constraints
• Presence of steep
slope for access to site
• Areas with a wind
capacity factor value >
0.352209 and located
within 35 km of MTS
substation and within 10
km of national roads
• Areas with a wind speed
value > 5.5 m per second
at a 100m average hub
height
• Areas without underlying
rock formation of dolorites
and other hardrocks
(including Gneiss, Granite
and Quartzite)
• Areas with slope <10%
Technical
constraints
mapping
Page 10
Spatial distribution of features used for the delineation process
Technical wind energy clusters Socio-economic intensity index Areas available for clustering
Page 11
Focus areas for wind energy development
Page 13
Project timeline continued
Page 14
Thank You
[email protected]