Page 1
EVALUATION QUALITY ASSURANCE SYSTEM Office of Evaluation Measuring Results, Sharing Lessons
TERMS OF REFERENCE
STRATEGIC EVALUATION OF
SCHOOL FEEDING CONTRIBUTION TO THE SDGS1
Table of Contents
1. Background ........................................................................................................................... 1
1.1. Introduction ................................................................................................................................ 1
1.2. Context ........................................................................................................................................ 1
2. Reason for the Evaluation ................................................................................................... 5
2.1. Rationale ..................................................................................................................................... 5
2.2. Objectives ................................................................................................................................... 5
2.1 Stakeholders and Users of the Evaluation .............................................................................. 6
3. Subject of the Evaluation ..................................................................................................... 7
3.1. WFP Policy and Strategic Framework...................................................................................... 7
3.2. Overview of Activities .............................................................................................................. 14
3.3. Scope of the evaluation .......................................................................................................... 16
4. Evaluation Approach, Questions and Methodology........................................................ 18
4.1. Overview of Evaluation Approach ......................................................................................... 18
4.2. Evaluability Assessment.......................................................................................................... 18
4.3. Evaluation Questions. ............................................................................................................. 18
4.4. Methodology ............................................................................................................................ 20
4.5. Quality Assurance .................................................................................................................... 22
5. Organization of the Evaluation ............................................................................................... 23
5.1. Phases and Deliverables ......................................................................................................... 23
5.2. OEV Roles and Responsibilities .............................................................................................. 23
5.3. Evaluation Team Composition ............................................................................................... 24
5.4. WFP Roles and Responsibilities ............................................................................................. 25
5.5. Evaluation governance............................................................................................................ 25
1 The title of this evaluation has changed in comparison to the 2019-2021 OEV Work Plan approved by the Executive Board.
This change is to better reflect the evolving conceptual and practical landscape of school feeding.
Page 2
5.6. Communication ....................................................................................................................... 25
5.7. Budget ....................................................................................................................................... 26
Annex 1: Tentative Evaluation Timeline ....................................................................................... 27
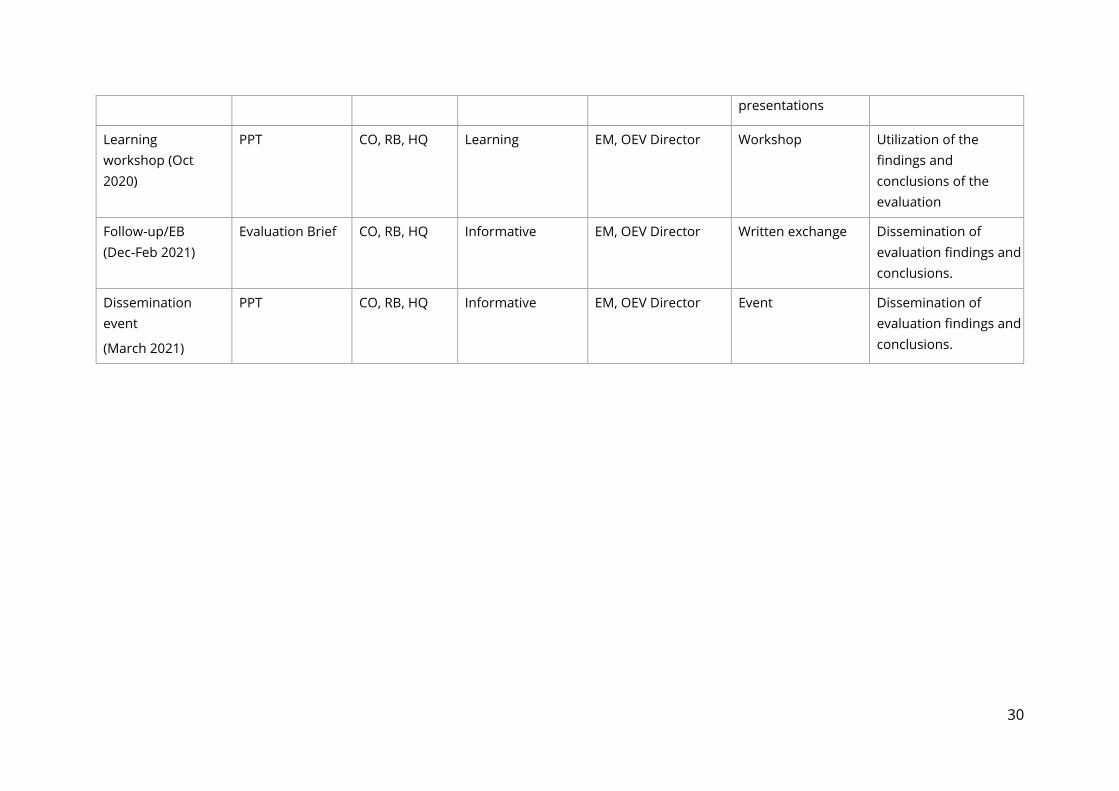
Annex 2: Initial Evaluation Communication and Learning Plans .............................................. 29
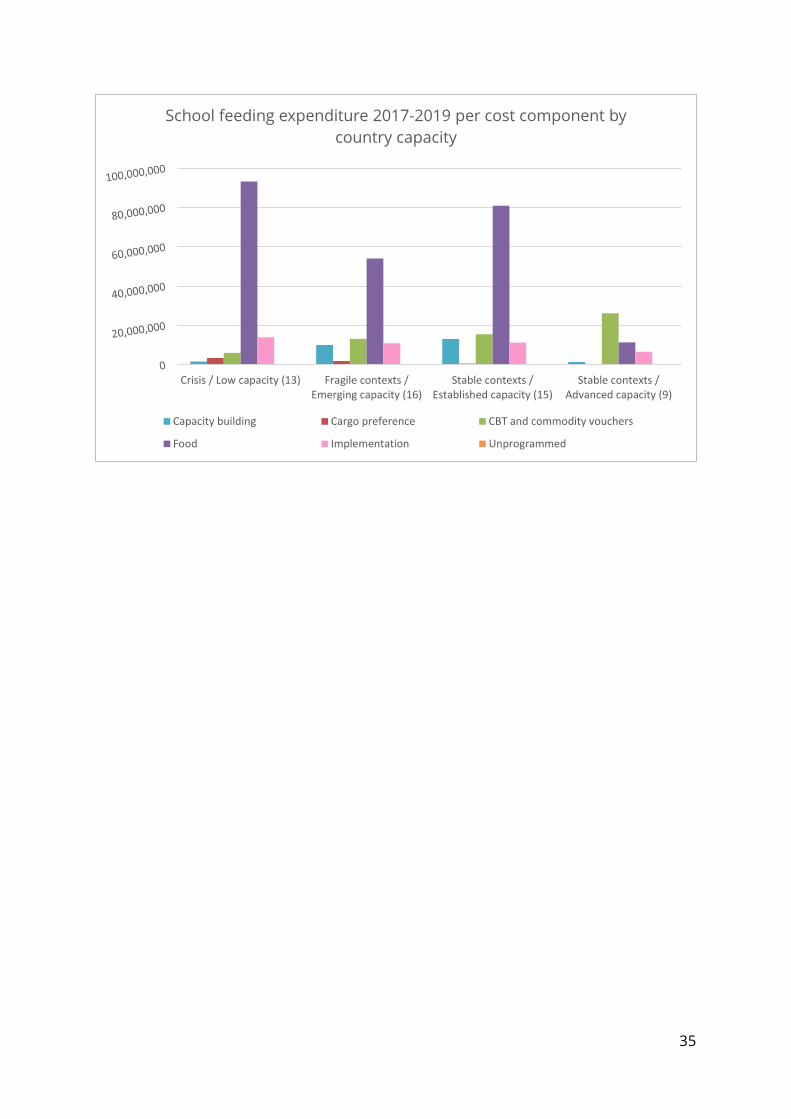
Annex 3: Overview of Expenditure 2017-2019 ............................................................................ 32
Annex 4: Feeding Participants by Region and Country Capacity , 2017-2019 ........................ 36
Annex 5: Sampling Methodology and Country Selection .......................................................... 37
Annex 6: Key Background reading ................................................................................................ 47
Annex 7: Summary and list of documents for systematic review ............................................ 49
Annex 8: Office of Evaluation Guidance....................................................................................... 55
Annex 9: Members of the Internal Reference Group (IRG) ....................................................... 56
Page 3
1
1. Background
1.1. Introduction
Strategic evaluations focus on strategic and systemic issues of corporate relevance, including the
new WFP strategic direction and associated policy, operations and activities. They evaluate the
quality of the work being done related to the new strategic direction as well as its results and seek
to explain why and how these results occurred. This strategic evaluation was included in the WFP
Office of Evaluation (OEV) Work Plan 2019-2021 presented to the Executive Board at the Second
Regular Session in November 2018.2
The Terms of Reference (ToR) were prepared by the OEV evaluation manager, Sergio Lenci, Senior
Evaluation Officer, based on a document review and discussions with stakeholders.
The purpose of these ToR is to provide key information to stakeholders about the proposed
evaluation, to guide the evaluation team and specify expectations that the evaluation team should
fulfil. The ToR are structured as follows: Chapter 1 provides information on the context; Chapter 2
sets out the rationale, objectives, stakeholders and main users of the evaluation; Chapter 3
provides an overview of the school feeding landscape and how its conceptualization and practice
evolved over time in WFP and outside, and defines the scope of the evaluation; Chapter 4 presents
the evaluation approach and methodology; and Chapter 5 indicates how the evaluation will be
organized.
The annexes provide additional information on the evaluation timeline (Annex 1), the
communication and learning plan (Annex 2), WFP direct expenditures by region and country,
(Annex 3), criteria for country selection (Annex 4), key background reading (Annex 5), document
for systematic review (Annex 6), OEV Guidance (Annex 7), proposed composition of the Internal
Reference Group and the External Advisory Group (Annexes 8 and 9).
The evaluation process will take place from October 2019 to November 2020. It will be managed
by OEV and conducted by an independent evaluation team. The Summary Evaluation Report will
be presented to the WFP Executive Board in February 2021.
1.2. Context
Prior to 2008/09 food and financial crises, the humanitarian and development community
viewed school feeding primarily as a way to deliver food aid to enhance access to school. However,
new strategic thinking during the 1990s and 2000 brought in different sectorial perspectives within
a more integrated approach. In several countries, a social change policy agenda drove the creation
of national school feeding programs that targeted social protection (e.g. the Zero Hunger
programme in Brazil). Another important driver was the education sector, which through the
launch of the FRESH3 framework in the 2000’s, supported by UNESCO, UNICEF, WFP, WHO, FAO
and other development partners, helped provide a policy context for school-based health
interventions, including school feeding. Ensuring that the learner had the health and cognitive
development to take full advantage of the new education opportunities, contributed to the
countries’ massive and largely successful efforts towards Education for All. 4
2 Annex V of the WFP Work Plan 2019-2021 (WFP/EB.2/2018/6-A/1) 3 Focusing Resources on Effective School Health 4 World Bank 2018: Bundy et al. Disease Control Priorities-imagining School Feeding a high Return Investment in human
Capital and local Economies, page xvii.
Page 4
2
Gradually, the role of the agricultural sector also became more prominent in school feeding in
Africa, as exemplified by the inclusion of school feeding programs that source food locally from
smallholders by nine African governments in the Comprehensive Africa Agriculture Development
Programme (CAADP) in 2003. 5 The adoption by countries of this “Home Grown” agenda has grown
and evolved dramatically since those early days, with significant support from FAO, IFAD, NEPAD,
the Gates Foundation, and other development partners6
In 2009, there was a marked increase in country demand for school feeding in response to the
global food, fuel and finance crises. A joint in-depth analysis between the World Bank and WFP on
the motivations of countries to invest in school feeding (‘ Rethinking School Feeding”) established
that, in addition to educational benefits, school feeding programmes are important because in the
short term they provide a safety net during crises and in the long term they act as investments in
human capital, local economies, hunger reduction and equity. In fact, a recent report that
synthesizes evidence from publicly available, independent evaluations from 13 organizations,
highlighting evidence gaps and summarizing ‘what works’ (for whom and in what contexts) found
that school feeding is among the two interventions with the strongest evidence of impact on equity
and inclusion in education (the other one being conditional cash transfers)7.
An integrated package of support through schools can also have specific benefits for girls. Some
of the most common health conditions affecting education are more prevalent in girls and gender
inequalities and exclusion can place girls at greater risk of ill health, neglect, and hunger. For
example, girls are, for physiological reasons, more likely to experience higher rates of anaemia,
than are boys. Girls can benefit greatly from health promotion and life-skills lessons offered in
schools. Evidence shows that where families undervalue girls’ education, increasing other values
of schooling, such as providing food or health services, has a disproportionately positive impact
on girls’ attendance.8 For example, a meta-analysis of school meals programmes across 32 sub-
Saharan countries showed on-site meals combined with take-home rations (THRs) increased the
enrolment of girls by 12%.9 In Northern Uganda, school meals and THRs were found to reduce
anemia prevalence in girls ages 10–13 years by 17% - 20%.10
Access to quality education for girls is also strongly correlated to the reduction of adolescence
birth rates, which in turns contributes to breaking intergenerational cycles of poverty. A review of
evidence conducted by UNFPA in 2013 recognizes that, “access to good quality education is one of
the most effective interventions to empower adolescents with the most basic skills to function and
contribute to society. This is of greater relevance for girls to obtain comprehensive sexual education; to
know and recognize options; to be able to negotiate reproductive desires, including when and how many
children to have; and to be able to demand access to good quality services for reproductive health. All
these faculties could be easily denied to adolescent girls who are out of school and unable to complete
their secondary education as a minimum.”11
5 Ibid. 6 WFP, FAO, IFAD, NEPAD, GCNF, PCD (2018) Home-Grown School Feeding. Resource Framework. Technical Document.
Rome https://www.wfp.org/content/home-grown-school-feeding-resource-framework 7 Mundy, K., Proulx, K., (2019) Making evaluation work for the achievement of SDG 4 target 5: Equality and inclusion in
education, UNESCO, NORAD, World Bank Group, UNICEF 8 Bundy, Donald. 2011. Rethinking School Health: A Key Component of Education for All. Directions in Development-
Human Development. World Bank. In WFP School feeding Strategy 9 Snilstveit et al. (2015) Interventions for Improving Learning Outcomes and Access to Education in Low- and Middle-
Income Countries: A Systematic Review. Systematic Review 24, International Initiative for Impact Evaluation (3ie), in Bashir et
al. (2018) Facing Forward: Schooling for Learning in Africa. Washington, DC: World Bank. In ‘The Impact of School
Feeding”, WFP, September 2019. 10 Adelman et al. (2012) The Impact of Food for Education Programs on School Participation in Northern Uganda,
Economic Development and Cultural Change 61 (1): 187–218. 11 UNFPA, New York. 2013. Adolescence Pregnancy: A review of evidence, pag. 11.
Page 5
3
The World Bank considers investments in human capital development of children to be the most
effective and productive investments that countries can make12. Low- income countries in Africa
account for 25 out of the 30 countries with the lowest Human Capital Index rankings. For many of
these countries, underinvestment in human capital leads to a loss of economic potential ranging,
from 50 to 70 per cent in the long-term. Africa’s Human Capital Index score of 0.40 puts the region
at 40 per cent of its potential. Africa’s GDP can be 2.5 times higher if the benchmarks for health
and education were achieved13.
The third edition of the World Bank publication Disease Control Priorities (2018) confirms the crucial
importance of investing in the 1000 days of a child’s life, but also highlights the neglected
investment during the next 7000 days (or until a human being turns 21) leading to the realization
that there is a need to move towards a new 8,000-day paradigm. The publication also points to
the mismatch between investments in the health of children, currently almost all focused on
children under 5 years of age, and interventions in education, mostly between 5 and 21 years of
age. The UN Systems Standing Committee on Nutrition has echoed many of these findings in a
new statement on ‘School as a System to Improve Nutrition’. (UNSCN 2017)14.
The endorsement of the Sustainable Development Goals and the Agenda 2030 represent another
key milestone in the evolving school feeding landscape, providing a framework for integrated
school feeding policy and programme design and an empirical basis for inter-institutional
coordination at national and international level. In fact, the potential results of school feeding
programmes are related to varying degrees to the sustainable development goals addressing
poverty (SDG1), hunger (SDG2), health and wellbeing (SDG3), education (SDG4), gender equality
(SDG5), economic growth (SDG8) reduced inequalities (SDG 10) and strengthened partnerships
(SDG17). The figure below provides a visual synthesis of how the potential benefits of school
feeding are currently conceptualized around four broad outcome areas.
Source: World Bank 2018: Disease Control Priorities
School feeding programmes are also assumed to be instrumental in strengthening the
humanitarian - development nexus. They can become an essential safeguard and can make an
important contribution to a sense of normalcy and educational continuation for children living in
12 World Bank. 2018. The Human Capital Project (eds Roberta Gatti and Aart Kraay). 50pp. Washington DC: The World
Bank. 13 World Bank, Human Capital Plan in Africa, 2019. 14 World Bank 2018: Bundy et al. Disease Control Priorities-imagining School Feeding a high Return Investment in human
Capital and local Economies, page xvii.
Page 6
4
fragile and conflict-affected areas, where food insecurity and fragility are mutually reinforcing. In
this connection, school feeding programmes may also be related to resilience building, particularly
as relates to absorptive and adaptive capacities. At the same time, the contributions that School
Feeding may have to improving the prospects for peace on different levels need to be further
researched.15
Today, more than half of the world’s school children receive food at school, the largest number
and proportion ever. Around 30 countries have started their own school feeding programmes
since 2009, while 20 national school feeding policies have been adopted during the same period.
These country-led changes have been supported in part by new global public goods, including
WFP’s Center of Excellence Against Hunger, established in partnership with the government of
Brazil, and by the Global Child Nutrition Foundation’s annual school feeding forum.
In Latin America and the Caribbean, nearly all countries now provide school meals to their
children.16 In the Middle East, interest is growing thanks in large part to the Middle East and North
Africa Initiative for School Meals and Social Protection launched with the support of WFP.17 In Asia,
most countries have introduced school feeding programmes, with exceptionally large-scale
programmes in China and India.
In Africa, where the need is greatest and the programmatic response has traditionally been
weakest, there is a renaissance. During the African Union Summit in 2016, 54 Heads of State
committed to promoting nationally owned programmes and are working to operationalize these
commitments.18 In West Africa alone, governments are investing USD 500 million dollars per year
on school feeding, and in 2019, a new Center of Excellence in Cote d’Ivoire has been inaugurated
to support South-South efforts across the African continent.19
15 WFP Draft School Feeding Strategy 2020 – 2030. unpublished. 16 WFP. 2017. Smart School Meals: Nutrition-Sensitive National Programmes in Latin America and the Caribbean, A
Review of 16 Countries. Rome, WFP. 17 WFP. 2017. Middle East and North Africa Initiative for School Meals and Social Protection: A partnership for enhanced
nutrition, education and resilience. Cairo, WFP. 18 African Union. 2018. Sustainable School Feeding across the African Union. Addis Ababa, African Union. 19 The last three paragraphs on current coverage of school feeding are extracted form a draft School feeding Thematic
Report produced by WFP School feeding Division that is about to be published.
Page 7
5
2. Reason for the Evaluation
2.1. Rationale
To strengthen WFP’s contribution to the 2030 Agenda, the WFP Executive Board approved, in
November 2016, an integrated package of actions that make up the Integrated Road Map (IRM).
This package re-aligns WFP’s strategy, programme structure, financial management and reporting
in order to transform WFP’s ability to help countries achieve the Sustainable Development Goals
by 2030, prioritizing SDG 2, “End hunger, achieve food security and improved nutrition and
promote sustainable agriculture” and SDG 17, “Strengthen the means of implementation and
revitalize the global partnership for sustainable development.” The new and comprehensive
architecture of the IRM links four inter-related corporate components – the Strategic Plan (2017-
2021), the Policy on Country Strategic Plans, the Financial Framework Review and the Corporate
Results Framework.
The alignment to the SDG through the IRM represents a strategic shift for the organization also
because, while maintaining its focus on emergency response and preparedness, it is increasingly
trying to position itself across the humanitarian/development/peace nexus. This positioning
implies increased emphasis on strategic partnership, national ownership, capacity strengthening
and sustainability as important dimensions of WFP engagement at the country level, which is in
line with the changes envisaged under ongoing UN reform20.
Against this backdrop, school feeding programmes are gaining increasingly more traction as a
strategic entry point to address and contribute to several interrelated aspects of the Agenda 2030,
as also illustrated in the previous section of this ToR. Over the last 6 to 10 years different WFP
business units, including Country Offices and HQ divisions, commissioned evaluations focusing on
school feeding, showing the increased interest and learning needs on this topic; let alone
accountability needs vis a vis WFP donors. These evaluations included the evaluation of the 2009
School Feeding Policy conducted by the Independent Office of Evaluation, which informed the
design of a revised Policy approved by the Executive Board in 2013. Currently, a new school feeding
strategy covering the next 10 years (2020-2030) is being developed and a new school feeding policy
will be presented to the Executive Board in November 2021. Therefore, there is need for an
independent global strategic outlook to the relevance and effectiveness of the existing policy, to
the efficiency of implementation and to the sustainability of the results achieved, in order to
account for the resources used and to inform the design of the new policy with the key lessons
learnt.
2.2. Objectives
With the aim to serve institutional accountability and learning functions, the objectives of this
evaluation are to:
• Assess the continued relevance of WFP School Feeding Policy and its results.
• Assess WFP global strategic positioning in school feeding and analyse the roles of the
organization in different country settings.
• Assess how WFP is equipped for the effective delivery of school feeding and to assist
Governments in building or consolidating their own capacities in the framework of the
Sustainable Development Goals.
20 Ref. Repositioning the United Nations development system to deliver on the 2030 Agenda: ensuring a better future for all, Report of the Secretary-General. A/72/124–E/2018/3.
Page 8
6
• Understand what factors are enabling or hindering progress and distil lessons to inform
future direction for WFP.
Findings will be actively disseminated and OEV will seek opportunities to present the results at
internal and external events as appropriate. A detailed strategy will be developed in the Evaluation
Communication and Learning Plans (an initial version can be found in Annex 2).
2.3 Stakeholders and Users of the Evaluation
The Executive Board, WFP School Feeding Service, senior management, regional and country-level
programme colleagues/school feeding programme advisors is the primary audience for this
evaluation. Key internal stakeholders and users include: Policy and Programme Division (OSZ), the
Brazil Centre of Excellence (BRA); the Technical Assistance and Country Capacity Strengthening
Service (OSZI); the Emergency Preparedness and Support Response Division (OSE) the Nutrition
Division (OSN); the Gender Office (GEN); and at decentralized level: WFP Regional Bureaus (RBs)
and country offices (COs).
Potential global stakeholders and users of the evaluation include national and local governments,
international humanitarian and development actors, and networks working on issues related to
school health and nutrition issues.
WFP colleagues from the various Divisions and offices listed above will be asked to be members
of the Internal Reference Group. External experts will be invited to be members of an Expert
Advisory Panel.
The inception report to be prepared by the evaluation team at the start of the process will include
a more in-depth stakeholder analysis.
Page 9
7
3. Subject of the Evaluation
3.1. WFP Policy and Strategic Framework
WFP’s approach to school feeding and the different dimensions of sustainable development to
which it may have contributed are reflected in several policy and strategy documents including:
- WFP School Feeding Policy (WFP/EB.2/2009/4-A)
- Revised School Feeding Policy (WFP/EB.2/2013/4-C)
- WFP Policy on Capacity Development (WFP/EB.2/2009/4-B)
- Update of WFP’s Safety Nets Policy (WFP/EB.A/2012/5-A)
- Gender Policy (2015–2020) (WFP/EB.A/2015/5-A)
- Policy on Building Resilience for Food Security and Nutrition (WFP/EB.A/2015/5-C)
- Nutrition Policy (WFP/EB.1/2017/4-C)
- Strategic Plan 2017 – 2021 (WFP/EB.2/2016/4-A/1/Rev.2)
- Draft School Feeding Strategy 2020 – 2030 (under development)
The School Feeding Policy approved in 2009 widened the scope of school feeding beyond food aid,
acknowledging the conceptual and practical developments occurring in the global landscape. The
safety net element was introduced, and WFP’s school feeding approach was repositioned to
emphasize sustainability, based on the idea of providing time-bound support with the objective of
eventually phasing out its assistance in certain countries. WFP also reinforced its partnership with
the World Bank and the Partnership for Child Development (PCD) to support the new policy
direction by establishing a research agenda; it also undertook the first global quantitative review
of school feeding, providing technical support to governments and developing tools and guidance
to help countries through the transition to national ownership.
Within this new approach, the Policy introduced a set of quality standards for school feeding
interventions and defined the roles that WFP should play. These go much beyond efficient delivery
of food aid, as they emphasize the importance of embedding school feeding into national
institutional settings, social fabric and production systems, and stress the need for WFP to engage
in analytical work, knowledge management, coordination, strategic partnership, resource
mobilization and management support. In 2011, to enhance its capacity to support governments,
WFP established a Centre of Excellence Against Hunger in partnership with the Government of
Brazil. The Centre works as a platform for South-South cooperation and helps governments
establish national school feeding programmes by engaging in high-level policy dialogue, facilitating
study visits and providing technical assistance.
Table 1 below provides a snapshot of the school feeding quality standards and of WFP roles as
defined in the 2009 Policy.
Page 10
8
Table 1. 2009 School Feeding Policy: Quality Standards and Roles of WFP
Quality Standards Roles of WFP
Stable Funding and Budgeting
In-d
ep
th u
nd
ers
tan
din
g.
An
aly
sis
an
d A
dvic
e
Co
ord
ina
tio
n a
nd
Su
pp
ort
Ca
pa
city
de
ve
lop
me
nt
an
d t
ech
nic
al su
pp
ort
to
en
sure
su
sta
ina
bilit
y
Imp
lem
en
tati
on
Su
pp
ort
Fu
nd
ing
an
d r
eso
urc
e m
ob
iliz
ati
on
.
Pa
rtn
ers
hip
Kn
ow
led
ge
ba
se
Re
sult
s B
ase
d M
an
ag
em
en
t
Needs based cost-effective quality
programme design
Strong institutional arrangements for
implementation, monitoring and
accountability
Strategy for Local Production and
Sourcing
Strong partnership and intersection
coordination
Strong Community Participation and
Ownership
Source: elaborated based on the 2009 School Feeding Policy
An evaluation of the 2009 Policy conducted in 2012 found that the Policy was timely, well aligned
with WFP Strategic Plan and taking stock of accumulated evidence on school feeding: insights
included the holistic view of the effects of school feeding, including social protection, the need to
work towards sustainable government-run school feeding systems, and the possibilities for linking
school feeding to agricultural development. The evaluation also found that the proposal of the
Policy to set quality standards for school feeding was an important innovation. However, in its
conclusions, the Evaluation also stressed the need for the Policy to better distinguish between the
generic objectives of school feeding and the specific objectives for WFP and the role it could play.
Along the same line, the Policy was found not to distinguish enough between advocacy and
guidance: A tension was noted between the advocacy role of the document (persuading the Board
and wider stakeholders of the legitimacy of school feeding and of WFP's role in supporting it) and
its role as corporate guidance for WFP. Advocacy was found to be dominating. Finally, there was
insufficient recognition that the potential benefits of school feeding are not realized automatically,
and that, in practice, there are usually trade-offs between objectives.
In response to this evaluation, WFP updated its programme guidance in 2012 and established an
online Global School Feeding network enabling WFP staff to exchange experience and good
practices. Finally, in 2013 a revised School Feeding Policy was developed. Building on the previous
one, the new policy went beyond the quality standard to set out clear objectives for WFP school
feeding interventions. Acknowledging the multidimensional character of school feeding the
objectives of the revised Policy are to:
1. provide safety Net for food insecure households through Income transfers;
2. support Children’s Education through enhanced learning Ability and Access to the
Education system;
3. enhance Children’s Nutrition by reducing micronutrient deficiencies and
Page 11
9
4. develop links between School Feeding and local Agricultural Production where
possible and feasible21.
5. strengthen National Capacity for School Feeding through Policy Support and Technical
Assistance
Against these objectives, the revised Policy continued to emphasise the importance of establishing
and maintaining nationally owned programmes; hence the need to develop clear hand over
strategies in countries still requiring WFP operational support. In so doing, it committed to
systematically assess progress in the transition to national ownership in all operations, using the
System Assessment for Better Education Results (SABER)22 framework developed with the World
Bank. It also stressed the importance of facilitating technical assistance and knowledge exchange,
using the experience of individual countries and through WFP Center of Excellence Against Hunger
in Brazil and other South-South initiatives. It also renewed WFP commitment to strong partnership
with the World Bank and Partnership for Child Development, while also aiming to reinforce
partnerships with UNESCO and UNICEF, through the Nourishing Bodies, Nourishing Minds
initiative, and with the FAO on supporting links between school feeding and local agricultural
production.
Working with partners to assess the cost-effectiveness of school feeding and the efficiency of
different implementation models is also emphasized in the revised Policy, as well as the need to
explore better ways of reaching beneficiaries, such as by using cash and vouchers to replace take-
home rations or to enable local procurement.
In relation to the observation made by the Evaluation of the 2009 Policy, regarding the need to
consider the trade-offs between objectives, the revised Policy also committed to assess individual
cases to decide whether to purchase higher-priced, locally produced food, given the potential to
benefit the local economy and increase the sustainability of school feeding programmes.
Within this revised policy framework, the roles of WFP are also redefined in relation to
progress towards full ownership of school feeding programmes. Depending on the transition
stage, WFP was meant to focus on service delivery or on capacity development and knowledge
building, or a mix of both with different proportions according to the context. Table 2 below
illustrates the definitions of each transition stage.
Table 2: Definition of SABER Transition Stages
Stage 1: Latent Stage 2: Emerging Stage 3: Established Stage 4: Advanced
Unstable contexts,
Limited capacity.
Government relies on
WFP and others to
implement school
Feeding
Stable contexts,
Limited capacity.
Government may rely
On WFP and others to
implement school
Feeding, but transition
planning can be
Initiated.
Stable
Contexts, medium
capacity. Government
Has established a
national programme
But lacks the capacity to
cover all
Requirements. The
transition is under
Way, with WFP
decreasing operational
support.
Stable contexts,
high capacity.
Government has an
established national
programme
managed without WFP
support.
21 WFP 2013: Revised School Feeding Policy, page 3 22 http://worldbank.org/education/saber
Page 12
10
Source: Revised 2013 School Feeding Policy.
Table 3 illustrates the objectives of WFP Strategic Plan 2014-2017, to which the revised Policy was
aligned, in relation to: a) countries’ transition stage; b) WFP roles and c) programmatic focus.
Table 3: Supporting countries in the transition stages –
WFP’s strategic objectives, roles and focus
Stage 1 –
Latent
Stage 2 –
Emerging
Stage 3 –
Established
Stage 4 –
Advanced
WFP
Strategic
Objectives
connected
to the
Strategic
Plan
1 – Save lives and
protect
livelihoods in
emergencies
2 – Support or
restore food
security and
nutrition and
establish or
rebuild
livelihoods in
fragile settings
and following
emergencies
2 – Support or restore
food security and
nutrition and establish or
rebuild livelihoods in
fragile settings and
following emergencies
3 – Reduce risk and
enable people,
communities and
countries to meet their
own food and nutrition
needs 4 – Reduce
undernutrition and break
the intergenerational
cycle of hunger
3 – Reduce risk and
enable people,
communities and
countries to meet
their own food and
nutrition needs 4 –
Reduce
undernutrition and
break the
intergenerational
cycle of hunger
4 – Reduce
undernutrition
and break the
intergenerational
cycle of hunger
WFP’s
roles
Role 1: Service
delivery. Provide
income transfers
to beneficiaries
and their
families; protect
or restore access
to education and
nutrition
Role 1: Service delivery.
Restore or enhance
access to education and
nutrition; provide income
transfers Role 2: Capacity
development and
knowledge-building.
Support national
institutions, setting the
ground for transition
Role 2: Capacity
development and
knowledge-building.
Focus on the
transition Role 1:
Service delivery.
Enhance access to
education and
nutrition; provide
income transfers
Role 2: Capacity
development
and knowledge
building. Provide
specialized
technical
support to high-
capacity
countries
WFP’s
possible
focus
Use WFP’s
operational
capacity and
ability to reach
difficult areas
Design simple
programmes for
quick scaleup,
considering the
eventual scale-
down strategy;
Initiate dialogue with
government on transition
and establishing a budget
line, while maintaining
operational support Put
transition strategies in
place with government;
focus on generating
political will Initiate
assessments and pilots
for linking school feeding
Support government
in drafting the policy
or legal framework
Evaluate experiences
of linking school
feeding to local
agriculture, and
innovations with
potential for scaleup
by government Start
scaling down WFP
(Transition
completed; WFP
does not deliver
services, but can
provide technical
assistance)
Establish South–
South
agreements and
other technical
cooperation
Page 13
11
ensure that
required
infrastructure is
in place Establish
operational
partnerships
to local agricultural
production Start
estimating the time until
full transition
operations; estimate
government’s
financial capacity for
school feeding and
support funding
strategies
Learn from
government
experience for
other countries
Source: WFP Revised 2013 School feeding Policy, pag: 11.
This integrated approach and its multiple outcome paths are also recognized in WFP’ s Strategic
Plan 2017-2021. The latter clearly states: “…in supporting or implementing school meals programmes,
WFP might contribute to SDG 2 targets related to access to food, improved nutrition or smallholder
livelihoods, while also often making substantial contributions to the achievement of other SDG targets,
including those related to education (SDG 4), gender equality and women’s empowerment (SDG 5), family
income (SDG 1) and health (SDG 3).”.
The plan highlights that school meals programmes, as part of the essential package for
schoolchildren’s health and nutrition, help ensure that children have access to education and
support achievement of education improvement targets, despite crises or chronic poverty; it also
notes that the combination of quality education and nutritious foods contributes to breaking the
intergenerational cycle of hunger.
The Gender Policy also refers to school feeding. Particularly, when defining the minimum
standards for targeted interventions it states that where persistent gaps exist, WFP invests in
community and school-based strategies and partnerships for school feeding that generate more
sustainable incentives for parents to continue girls’ education beyond primary school.23
Along the same lines, WFP 2017 Nutrition Policy recognizes that in addition to improving children’s
nutrition, school meal programmes have the potential to serve as a delivery platform for nutrition
education….. and... Linkages between school meals and local smallholder production may also be
made to improve nutrition while strengthening farming families’ livelihoods. It also stresses the
need to work with governments, local authorities, communities and other interested partners on
issues of availability and access at the system level.24
Similarly, WFP Capacity Building Policy highlights WFP’s work on strengthening the technical and
management capacities of national and subnational government organizations; and the
evaluation of such Policy found that school feeding had the highest number of reported capacity
development activities in SPR data, with 628 during 2013–2015.
WFP 2015 Policy on Building Resilience for Food Security and Nutrition states that: Ensuring
adequate nutrition among vulnerable groups during an emergency has benefits that extend
beyond the immediate shock: adequate nutrition during adolescence and the first 1,000 days of
life – during mother’s pregnancy and up to the child’s second birthday – promotes lifetime health
and productivity. A preventive approach, including nutrition specific and sensitive actions, is
preferable to treating acute malnutrition: it is more cost-effective and contributes to resilience25.
Broadly speaking, it is arguable that school feeding programs across the humanitarian and
development nexus may contribute to strengthen the capacity to absorb and adapt, as the key
dimensions of resilience. Transformative capacities may also be addressed when contributing to
national capacities to deliver school feeding programmes in the context of national protection
23 WFP Gender Policy, pag. 16 2015-2020 24 WFP Nutrition Policy, January 2017, pag. 10 25 WFP 2015 Policy on Building Resilience for Food Security and Nutrition, pag. 12
Page 14
12
systems. In fact, the policy explicitly acknowledges that cross cutting policies that contribute to
WFP’s resilience building approach include gender, nutrition and school feeding.
The holistic approach reflected in WFP school feeding policy framework also calls for more
integrated programming and greater emphasis on partnership with a wide range of local, national
and international development actors. This is instrumental in order to address the multiple
variables that can materialize the potential benefits of school feeding across different dimensions
of sustainable development but constitutes one of the pending challenges for WFP.
Recurrent findings across the Policy evaluations include the fact that while these policies are
generally aligned to the global development landscape and reflect strong conceptual clarity and
organizational commitment, they also need to be complemented with more consistent
frameworks linking the policy to strategy and guidance, to integrated programming and
measurable results. On a more positive note related to school feedings effects on gender relations
and protection systems, the evaluation of WFP Safety Nets Policy (2012) found a few cases of
school feeding programmes to be among the examples of programmes designed to lead to gender
transformative outcomes, together with some examples of nutrition programmes specifically targeted
to women and their children. Other than that, the evaluation did not find many other examples26.
The review of key findings from WFP programme evaluations, summarising successes and
challenges of implementing USDA McGovern-Dole-funded Food for Education Programmes in the
Asia/Pacific Region, highlights challenges in applying consistent measurement frameworks across
countries, which impact WFP ability to compare and aggregate results. Key findings from this
review include the importance of engaging with a diverse range of partners, beyond implementing
partners for school feeding. This is critical to address outcomes that fall outside the direct
influence of WFP but are part of the holistic approach in addressing challenges, such as improving
literacy rates, which in turn are highly dependent on coverage and quality of education systems.
In some cases, the review also found that WFP cooperation with other agencies could be improved
and that more focus on capacity building is needed while strengthening monitoring systems.
More broadly, WFP’s school feeding evaluations highlight some key recurring challenges that
include: i) the ability to monitor and demonstrate results, even more when related to issues of
policy advocacy and capacity development; ii) sustainable hand over to national institutions; iii)
lack of integration between different areas of WFP work.
In 2019, WFP drafted a School Feeding Strategy with a 10-year vision (2020 to 2030) that is currently
being finalized. Its main objective is to call for action to reach 73 million primary school children
living in extreme poverty in 60 countries that do not have access to national school feeding
programmes and are most likely not receiving most of the other essential school health
interventions.
The strategy affirms WFP's commitments to work with governments and partners to reach these
73 million primary school children. By adopting a medium to long term perspective and placing
more emphasis on WFP catalytic role, the draft Strategy also lays out a significant organizational
shift. Although such shift was somehow already envisaged in the 2013 Revised School Feeding
Policy and is in line with WFP “changing lives” mandate, as stated in the current Strategic Plan, it
still requires some systemic changes for the organization to deliver.
The Strategy also builds on the 2013 revised policy while benefiting from the latest conceptual and
practical developments in the school feeding landscape; particularly by adopting the 8,000 days
paradigm, which calls for rethinking the investment in health and nutrition of school children with
a longer-term vision and a wider scope. The draft strategy is aligned to the four outcome areas
identified for school feeding in the third edition of the World Bank publication Disease Control
26 Updates of Safety Nets Policy (2012) Summary Evaluation Report, pag. 10.
Page 15
13
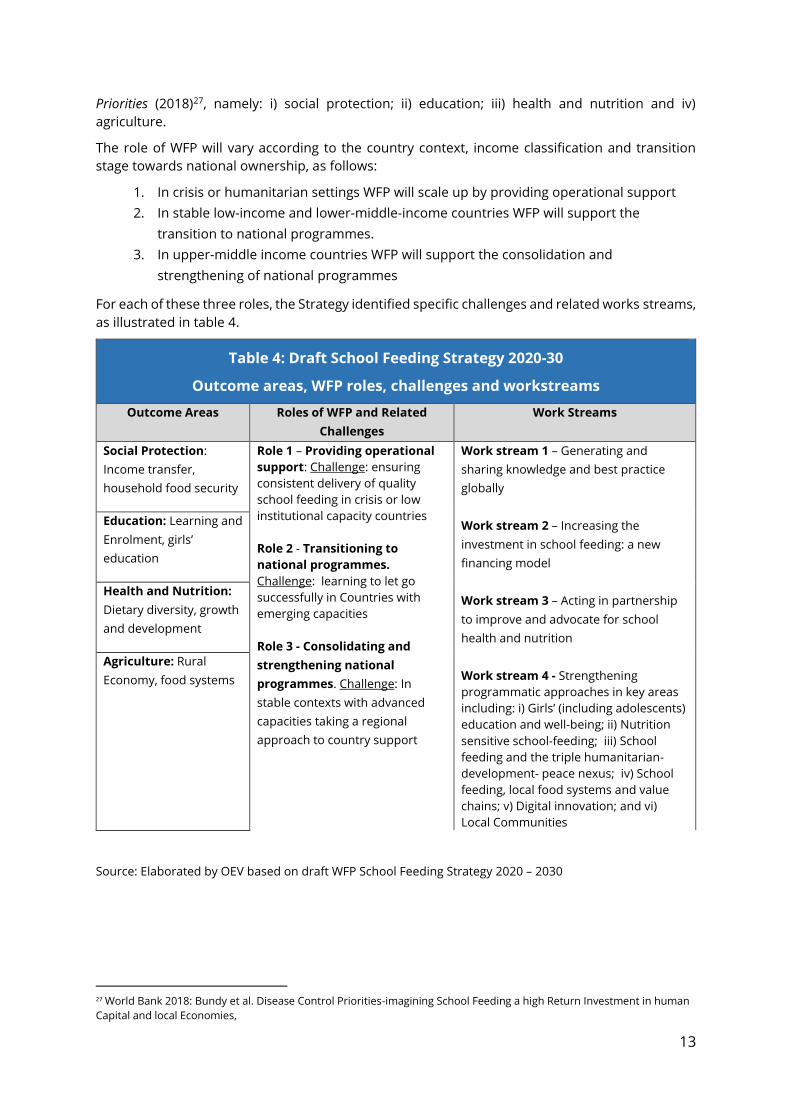
Priorities (2018)27, namely: i) social protection; ii) education; iii) health and nutrition and iv)
agriculture.
The role of WFP will vary according to the country context, income classification and transition
stage towards national ownership, as follows:
1. In crisis or humanitarian settings WFP will scale up by providing operational support
2. In stable low-income and lower-middle-income countries WFP will support the
transition to national programmes.
3. In upper-middle income countries WFP will support the consolidation and
strengthening of national programmes
For each of these three roles, the Strategy identified specific challenges and related works streams,
as illustrated in table 4.
Table 4: Draft School Feeding Strategy 2020-30
Outcome areas, WFP roles, challenges and workstreams
Outcome Areas Roles of WFP and Related
Challenges
Work Streams
Social Protection:
Income transfer,
household food security
Role 1 – Providing operational
support: Challenge: ensuring
consistent delivery of quality
school feeding in crisis or low
institutional capacity countries
Role 2 - Transitioning to
national programmes.
Challenge: learning to let go
successfully in Countries with
emerging capacities
Role 3 - Consolidating and
strengthening national
programmes. Challenge: In
stable contexts with advanced
capacities taking a regional
approach to country support
Work stream 1 – Generating and
sharing knowledge and best practice
globally
Work stream 2 – Increasing the
investment in school feeding: a new
financing model
Work stream 3 – Acting in partnership
to improve and advocate for school
health and nutrition
Work stream 4 - Strengthening
programmatic approaches in key areas
including: i) Girls’ (including adolescents)
education and well-being; ii) Nutrition
sensitive school-feeding; iii) School
feeding and the triple humanitarian-
development- peace nexus; iv) School
feeding, local food systems and value
chains; v) Digital innovation; and vi)
Local Communities
Education: Learning and
Enrolment, girls’
education
Health and Nutrition:
Dietary diversity, growth
and development
Agriculture: Rural
Economy, food systems
Source: Elaborated by OEV based on draft WFP School Feeding Strategy 2020 – 2030
27 World Bank 2018: Bundy et al. Disease Control Priorities-imagining School Feeding a high Return Investment in human
Capital and local Economies,
Page 16
14
3.2. Overview of Activities28
For the past six decades, the World Food Programme (WFP) has provided operational support and
technical assistance to help children in the poorest regions of the world attend school and reach
their full potential.
In 2018, WFP assisted 16.4 million school children with nutritious meals, snacks or take-home
rations in 61 countries, making school feeding WFP’s second largest programme in terms of
beneficiaries. About 51 per cent of the schoolchildren assisted through WFP school feeding
activities were girls and the target for female retention rate was met in 73 per cent of countries
that reported on this indicator.
The number of beneficiaries reached in 2018 falls short of what WFP had planned (19 million
children), for several reasons. The main reason is a positive one: more progress than expected
was achieved in handing over operations to governments. Handover led to a total reduction of 2.5
million children assisted by WFP in countries such as Bangladesh, Cambodia, Côte D’Ivoire, Kenya,
Kyrgyzstan and Zambia. In some cases, the handover is still on going. For example, in Zambia, WFP
successfully handed over responsibility to the government for 600,000 school-age children, thus
reducing its school feeding beneficiaries from about 800,000 in 2017 to 200,000 in 2018.
School feeding activities were scaled up in 20 operations to reach an additional 1.7 million children
in fragile settings such as Mali, South Sudan and Yemen and in more stable settings where WFP
implements school feeding based on the request of the host government, such as Benin and Sierra
Leone. The table below compares 2017 and 2018 figures:
Table 5: WFP school feeding beneficiaries 2017 and 2018
Previous year
(2017)
Increase
(2018)
Decrease
(2018)
Number of school-age children reached
in 2017 18.3 million
Number of school-age in countries where
WFP scaled up direct implementation 1.7 million
Number of school-age children that WFP
handed over to national governments 2.5 million
Number of school-age children that WFP
did not reach due to funding shortfalls
and/or operational constraints
1.1 million
Total school-age children reached in
2018 16.4 million
Source: draft School feeding Thematic Report 2018
28 The information and the data reported in this section is extracted from the School feeding Thematic Report: School
feeding in 2018, Beyond the Annual Progress Report 2018 Series. WFP, October 2019. It should also be noted that the School
Feeding Thematic Report is based on data from the 2018 APR and, as such, the Activities section provides limited
information on school feeding activities from 2014-2017
Page 17
15
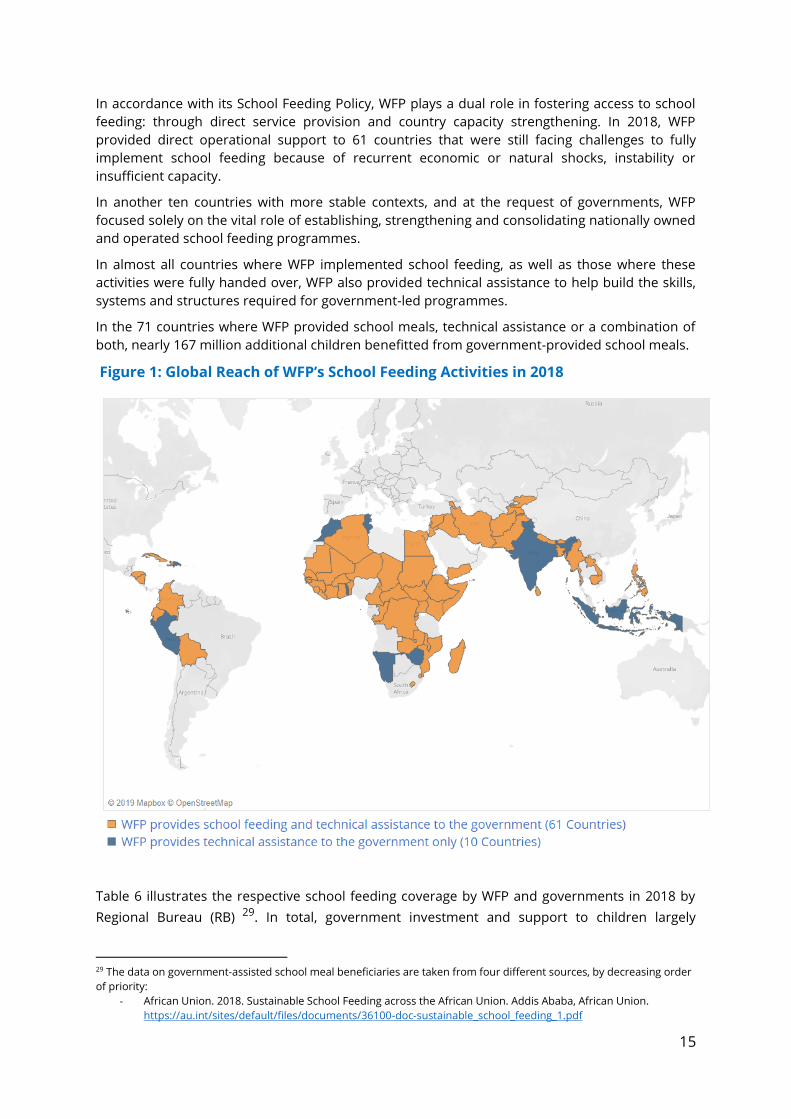
In accordance with its School Feeding Policy, WFP plays a dual role in fostering access to school
feeding: through direct service provision and country capacity strengthening. In 2018, WFP
provided direct operational support to 61 countries that were still facing challenges to fully
implement school feeding because of recurrent economic or natural shocks, instability or
insufficient capacity.
In another ten countries with more stable contexts, and at the request of governments, WFP
focused solely on the vital role of establishing, strengthening and consolidating nationally owned
and operated school feeding programmes.
In almost all countries where WFP implemented school feeding, as well as those where these
activities were fully handed over, WFP also provided technical assistance to help build the skills,
systems and structures required for government-led programmes.
In the 71 countries where WFP provided school meals, technical assistance or a combination of
both, nearly 167 million additional children benefitted from government-provided school meals.
Figure 1: Global Reach of WFP’s School Feeding Activities in 2018
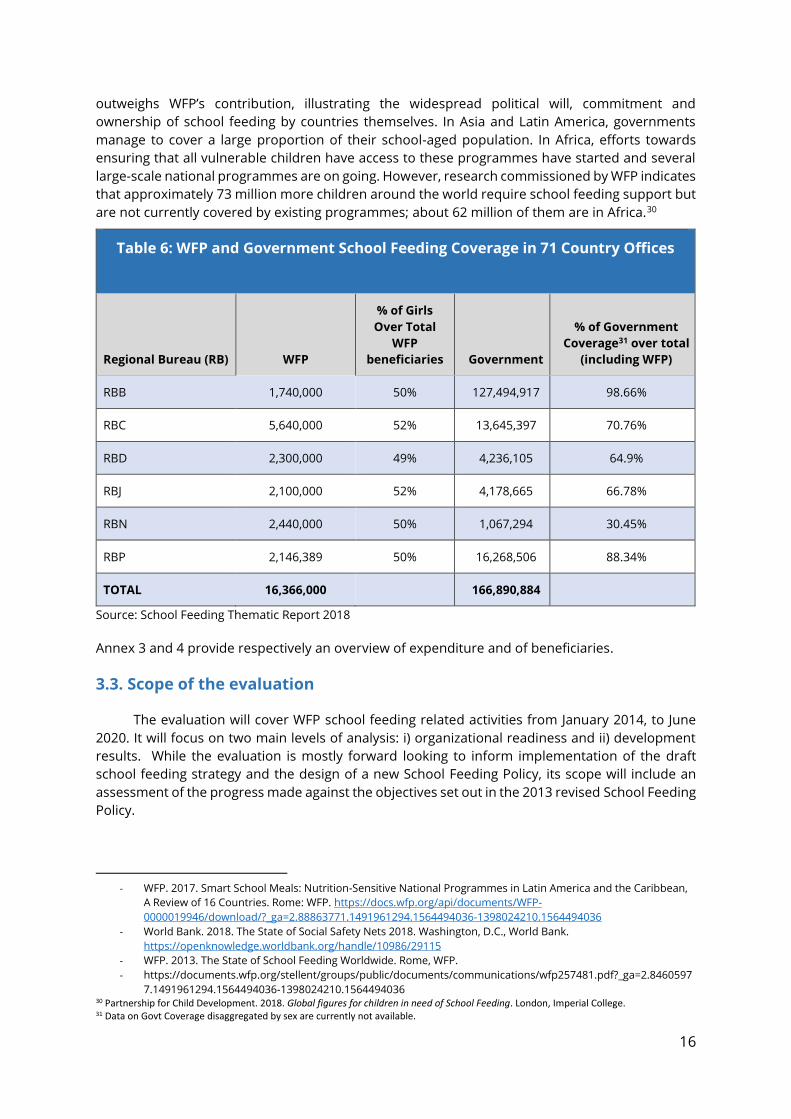
Table 6 illustrates the respective school feeding coverage by WFP and governments in 2018 by
Regional Bureau (RB) 29. In total, government investment and support to children largely
29 The data on government-assisted school meal beneficiaries are taken from four different sources, by decreasing order
of priority:
- African Union. 2018. Sustainable School Feeding across the African Union. Addis Ababa, African Union.
https://au.int/sites/default/files/documents/36100-doc-sustainable_school_feeding_1.pdf
Page 18
16
outweighs WFP’s contribution, illustrating the widespread political will, commitment and
ownership of school feeding by countries themselves. In Asia and Latin America, governments
manage to cover a large proportion of their school-aged population. In Africa, efforts towards
ensuring that all vulnerable children have access to these programmes have started and several
large-scale national programmes are on going. However, research commissioned by WFP indicates
that approximately 73 million more children around the world require school feeding support but
are not currently covered by existing programmes; about 62 million of them are in Africa.30
Table 6: WFP and Government School Feeding Coverage in 71 Country Offices
Regional Bureau (RB) WFP
% of Girls
Over Total
WFP
beneficiaries Government
% of Government
Coverage31 over total
(including WFP)
RBB 1,740,000 50% 127,494,917 98.66%
RBC 5,640,000 52% 13,645,397 70.76%
RBD 2,300,000 49% 4,236,105 64.9%
RBJ 2,100,000 52% 4,178,665 66.78%
RBN 2,440,000 50% 1,067,294 30.45%
RBP 2,146,389 50% 16,268,506 88.34%
TOTAL 16,366,000 166,890,884
Source: School Feeding Thematic Report 2018
Annex 3 and 4 provide respectively an overview of expenditure and of beneficiaries.
3.3. Scope of the evaluation
The evaluation will cover WFP school feeding related activities from January 2014, to June
2020. It will focus on two main levels of analysis: i) organizational readiness and ii) development
results. While the evaluation is mostly forward looking to inform implementation of the draft
school feeding strategy and the design of a new School Feeding Policy, its scope will include an
assessment of the progress made against the objectives set out in the 2013 revised School Feeding
Policy.
- WFP. 2017. Smart School Meals: Nutrition-Sensitive National Programmes in Latin America and the Caribbean,
A Review of 16 Countries. Rome: WFP. https://docs.wfp.org/api/documents/WFP-
0000019946/download/?_ga=2.88863771.1491961294.1564494036-1398024210.1564494036
- World Bank. 2018. The State of Social Safety Nets 2018. Washington, D.C., World Bank.
https://openknowledge.worldbank.org/handle/10986/29115
- WFP. 2013. The State of School Feeding Worldwide. Rome, WFP.
- https://documents.wfp.org/stellent/groups/public/documents/communications/wfp257481.pdf?_ga=2.8460597
7.1491961294.1564494036-1398024210.1564494036 30 Partnership for Child Development. 2018. Global figures for children in need of School Feeding. London, Imperial College. 31 Data on Govt Coverage disaggregated by sex are currently not available.
Page 19
17
From the perspective of organizational readiness, the evaluation will focus on understanding how
WFP is equipped, and on what is needed to successfully support school feeding in different country
contexts, while responding to the opportunities set out in the Agenda 2030. This will include the
following three dimensions: i) school feeding conceptualization and operationalization through
policies, strategies and guidance; ii) processes and systems and their use in the organization; iii)
synergies and adaptability to evolving roles across dynamic development and humanitarian
contexts, to ensure sustainability of school feeding programmes in the framework of national
systems. As illustrated in table 6, school feeding beneficiaries directly reached by WFP are less
than 10% of the total; whilst 90 % are currently covered national programmes. It is therefore crucial
for this evaluation to examine how WFP is engaging with national Governments.
From the perspective of development results, the evaluation will look at the continued relevance
of the 2013 School Feeding Policy and at the extent to which WFP is contributing to positive
outcomes in the areas of education, health and nutrition, social protection and agricultural
production. The assessment of these outcomes will be at the aggregate level and as feasible
considering evaluability challenges and resources available. Gender equality will be a cross cutting
theme in the analysis and whenever available data will be disaggregated by sex. The analysis of
results will largely benefit from a wide body of evaluative evidence already available and will
provide a basis to inform a forward-looking strategic analysis.
The scope of the evaluation will be further elaborated during the inception phase and will be
informed by a detailed evaluability assessment, as part of the overall evaluation design to be
developed by the evaluation team.
Page 20
18
4. Evaluation Approach, Questions and Methodology
4.1. Overview of Evaluation Approach
The evaluation will take a mixed methods approach, using the relevant elements of the existing
policy and strategies to guide the evaluation design in consultation with key internal stakeholders.
The assessment will be based on secondary as well primary data sources, using different data
collection techniques, including: desk review, semi structured interviews, surveys and focus
groups. Systematic data triangulation across different sources and methods will be carried out to
validate findings.
During the inception phase the evaluation team will be expected to develop a detailed
methodological design in line with the proposed approach. The design will be presented in the
inception report and informed by a thorough evaluability assessment. The latter should be based
on desk review of key programming, monitoring and reporting documents and on some scoping
interviews with relevant informants.
A key annex to the inception report will be an evaluation matrix that will constitute the analytical
framework of the evaluation. The selection of informants and site visits should ensure to the
extent possible that all voices are heard. In this connection, it will be very important at the design
stage to conduct a detailed and comprehensive stakeholder mapping and analysis to inform
sampling.
4.2. Evaluability Assessment
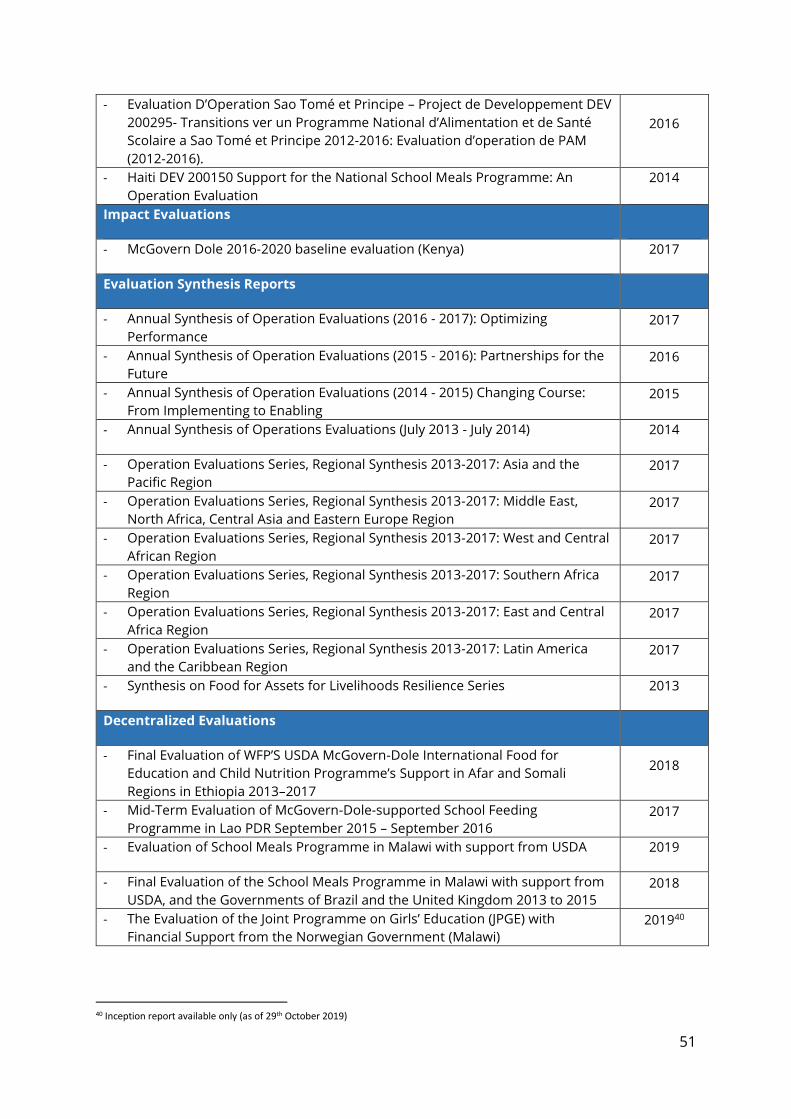
There is a large body of existing evaluations that can be used to provide evidence for the
evaluation. These include centralized evaluations (strategic evaluations, policy evaluations, impact
evaluations, operations evaluations and country portfolio evaluations as well as evaluation
synthesis products) and decentralized evaluations of WFP operations. Annex 6 contains a list of
evaluations that should be covered by the evaluation. Several audits (internal and external) are
also relevant for the evaluation and these are also listed in Annex 8.
Evaluability challenges that have been identified at this stage include: a) data availability and
reliability at the CSPs outcome and output level; b) meaningful data aggregability across countries
and regions, particularly for qualitative data; c) linking resources to results for cost effectiveness
analysis of different delivery modalities; d) statistical representation of the in country missions will
be a limitation for the analysis of results at the country level.; e) quantification and measurement
of advocacy efforts and results may be difficult due to the often intangible nature of the work
related to it.
It should also be acknowledged that there is a discontinuity between the SPR 2014-2017 and 2017-
2021 and related results framework, which impact the environment of measurement and
reporting of the school feeding interventions.
The use of mixed methods, including qualitative inquiry, will contribute to addressing these
limitations. A more detailed evaluability assessment will have to be conducted at the inception
phase and factored into the evaluation design.
4.3. Evaluation Questions
The evaluation will address five broad questions across the different dimensions of analysis. Two
questions are related to the continued relevance and effectiveness of the School Feeding Policy;
two are related to the organizational readiness and one cuts across both dimensions to look at
critical factors to contribute to learning and future direction. The questions listed below will set
Page 21
19
the framework for evaluation matrix to be developed by the evaluation team during the inception
phase, when the sub-questions will also be further elaborated and operationalized in specific lines
of inquiry and indicators.
A) Continued Relevance and Effectiveness of the 2013 School Feeding Policy
1. How relevant is WFP’s School Feeding Policy considering the 2030 Agenda and WFP
current Strategic Plan (2017-2021)?
1.1. Is WFP School Feeding Policy still relevant in light of the draft Strategy and how is it
aligned to WFP Strategic Plan 2017-2021, to the Agenda 2030 and to the emerging
international thinking and practice on school feeding?
1.2. How are WFP school feeding activities aligned to the School Feeding Policy and to the
draft Strategy?
1.3. How relevant are WFP school feeding activities to the regional and sub-regional
organizations thinking and practice?
1.4. To what extent is WFP being able to effectively engage with National Governments
and flexibly respond to evolving priorities and demands in different country settings?
2. To what extent has WFP been able to deliver on the results of the 2013 revised
School Feeding Policy?
2.1. To what extent are WFP supported school feeding programmes contributing to
reducing hunger and to nutrition outcomes among the most vulnerable groups?
2.2. To what extent are WFP supported school feeding programmes contributing to
enhance access to education, particularly for the most vulnerable groups?
2.3. To what extent are WFP supported school feeding programmes contributing to rural
economies and food systems?
2.4. To what extent are WFP supported school feeding programmes contributing to social
cohesion and stability at community level, particularly in humanitarian settings?
B) Organizational readiness to contribute to school feeding-related outcomes.
3. How well is WFP equipped to deliver effective and equitable school feeding
programmes, and to assist Governments to implement school feeding
programmes?
3.1. Is there a clear and coherent yet flexible framework in WFP to advance a school
feeding agenda from conceptualization to integrated programming and measurable
results?
3.2. Are the existing corporate systems, guidance and processes conducive to funding
and staffing tailored to different roles that WFP may play in different country
settings?
3.3. Is WFP able to leverage resources through effective partnership strategies at country,
regional and global level?
3.4. Is WFP able to efficiently and effectively act as a global knowledge broker, including
for south south and triangular cooperation?
Page 22
20
3.5. Are WFP results-based management systems well-equipped to monitor, measure
and report progress on school feeding, including advocacy and capacity
strengthening processes and results?
4. To what extent is WFP capable of focusing on strengthening enabling
environments for national institutions to design, finance and implement
sustainable school feeding programmes?
4.1. To what extent and how is WFP advocating for and engaging in the right partnerships
with national and international actors to position school feeding as a strategic entry
point to contribute to the Agenda 2030?
4.2. To what extent and how is WFP engaging in advocacy efforts to influence policy, legal,
financial, institutional and partnership frameworks for sustainable national school
feeding programmes?
4.3. To what extent and how is WFP focusing on strengthening national and local
institutional capacities for school feeding programmes’ design and
implementation, including targeting, monitoring and evaluation?
4.4. To what extent is WFP developing and implementing effective transition strategies to
ensure time-bound hand over of school feeding programmes to national and local
institutions?
5. What are the key factors contributing to progress against stated objectives and
what are the key lessons that can be learned?
5.1. What are the key factors internal and external to WFP contributing to or challenging
the successful implementation of the new School Feeding Strategy?
5.2. What are the main opportunities and risks in relation to the country, regional and
global contexts?
The sub-questions will be validated and further developed during the inception phase and will be
listed in an evaluation matrix linking each of them to data sources and data collection methods.
4.4. Methodology
The evaluation will employ relevant internationally agreed evaluation criteria including relevance,
efficiency, effectiveness and sustainability. It will also examine the extent to which gender and
equity dimensions are integrated into WFP’s policies, systems and processes. The methodology
should:
• Build on the logic that is the basis of WFP’s policy and strategy framework and its objectives;
• Be geared towards addressing the evaluation questions presented in these ToR
• Take into account the limitations to evaluability pointed out as well as budget and timing
constraints.
The methodology should also demonstrate impartiality and lack of bias by relying on a cross-
section of information sources (e.g. stakeholder groups) and using a mixed methodological
approach (e.g. quantitative, qualitative) to ensure triangulation of information collected through a
variety of means. The evaluation will employ multiple methods of data collection including:
Page 23
21
• Synthesis of evaluations and audits: A systematic review and synthesis of the body of
evaluations, audits and lessons learned documents will be undertaken early in the data
collection process. The synthesis will follow the framework of evaluation questions and
sub-questions. It will be necessary to assess the quality and independence of sources of
information and develop a hierarchy of evidence as necessary. Over the six years covered
by the exercise, it will be important to map the findings against the time periods that they
relate to. The synthesis would take place in advance of the fieldwork and the conduct of
country missions. This will allow key issues to be incorporated in to the design of the
missions’ protocols and associated data collection tools.
• Analysis of WFP administrative data: Analysis of corporate administrative data such as
expenditures, timelines, performance indicators and human resource statistics.
• Desk review of background documents: Desk reviews will cover a wide variety of
background material available. An initial mapping of relevant documents can be found in
Annex.
• Key Informant interviews: These will take place at HQ, regional and country levels as well
as with global and regional partners. The sampling technique to impartially select
stakeholders to be interviewed should be specified in the inception report.
In order to ensure the impartiality and credibility of the evaluation, findings will be systematically
triangulated across different data sources and data collection methods. In line with the mixed
methods approach of the evaluation, triangulation will imply a constructivist approach in the
analysis and interpretation of qualitative information combined with the statistical analysis of
quantitative data.
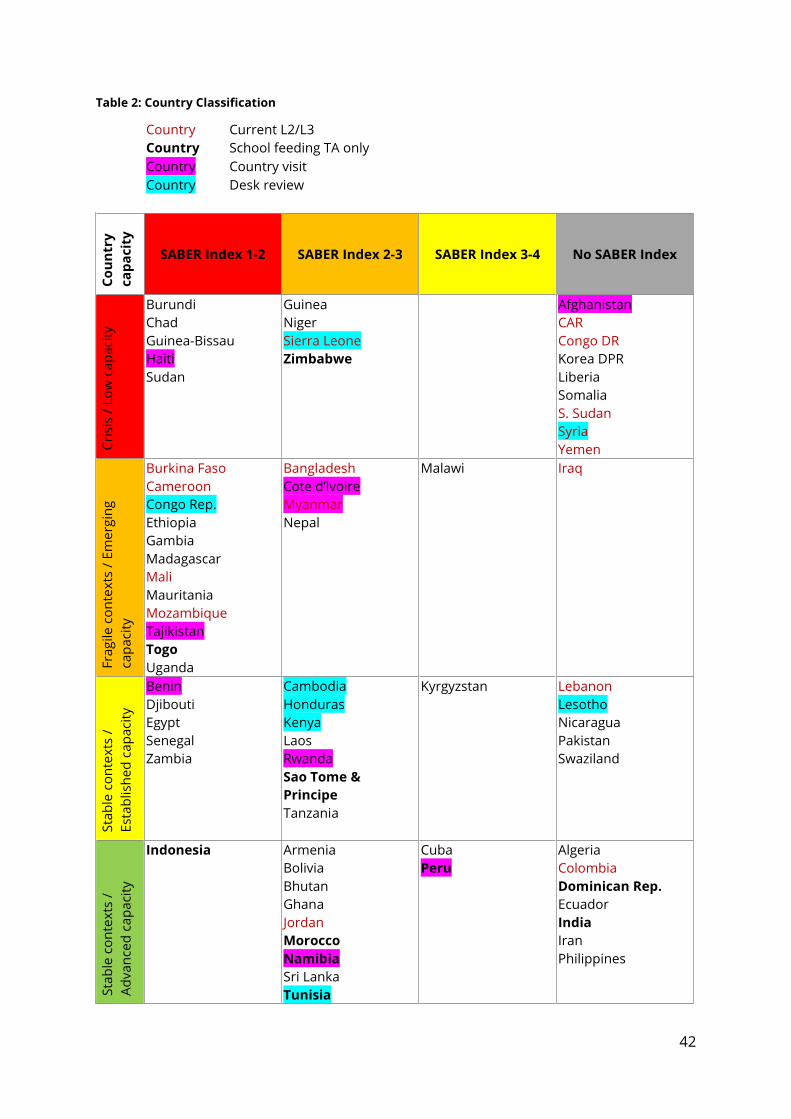
While having a strategic global outlook, the evaluation will zoom into a purposefully selected
number of countries to account for and learn from different contexts, from which logical
generalizations could be drawn. As illustrated in more detailed in Annex 5, selection of
country missions is based on purposeful sampling informed by a combination of variables
related to country context and capacity, volume of WFP operations and evaluation coverage.
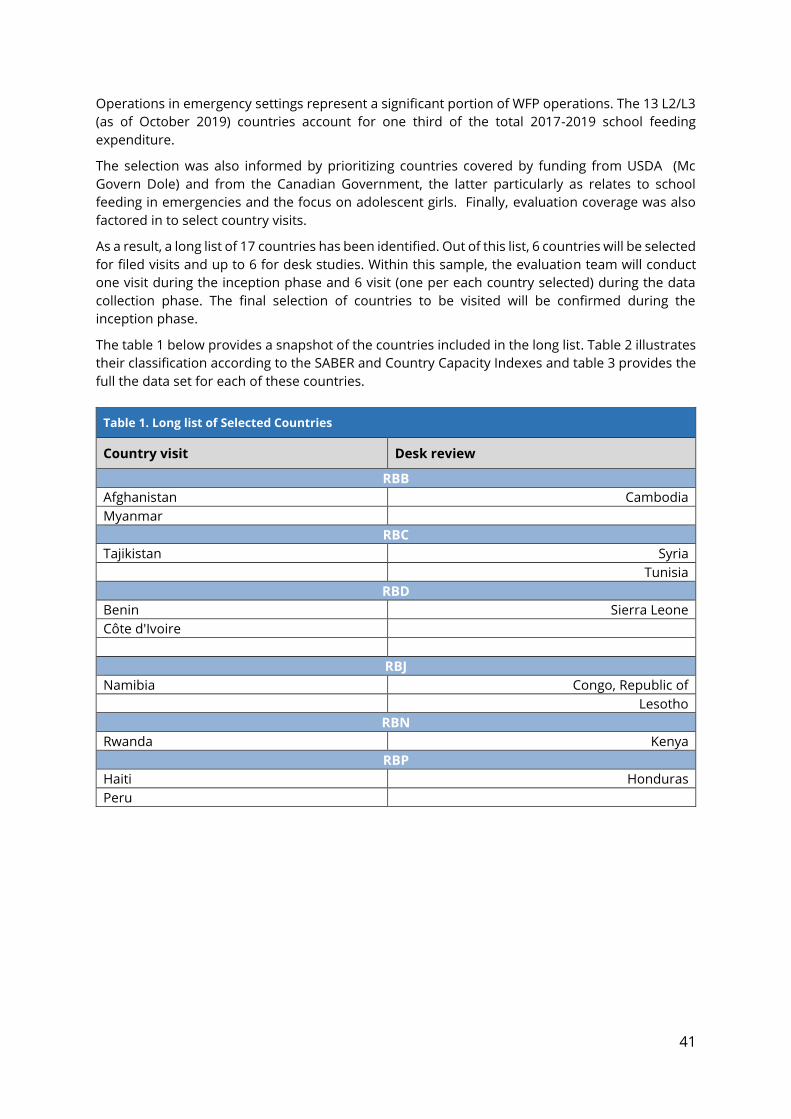
As a result, a long list of 17 countries has been identified. Out of this list, 6 countries will be selected
for filed visits and up to 6 for desk studies. Within this sample, the evaluation team will conduct
one visit during the inception phase and 6 visits (one per each country selected) during the data
collection phase. The final selection of countries to be visited will be confirmed during the
inception phase.
Below is the long list of countries from which the final selection will be derived.32:
Country visit Desk review
RBB
Afghanistan Cambodia
Myanmar
RBC
Tajikistan Syria
Tunisia
RBD
Benin Sierra Leone
Côte d'Ivoire
RBJ
32 For more detail on sampling methodology and country selection see Annex 5.
Page 24
22
Country visit Desk review
Namibia Congo, Republic of
Lesotho
RBN
Rwanda Kenya
RBP
Haiti Honduras
Peru
The methodology may also include case studies focusing on specific topics to be identified during
the inception phase.
4.5. Quality Assurance
WFP’s CEQAS is based on the UNEG norms and standards and good practice of the international
evaluation community. It sets out processes with in-built steps for quality assurance and templates
for evaluation products. It also includes quality assurance of evaluation reports (inception, full and
summary reports) based on standardised checklists. The CEQAS will be systematically applied
during this evaluation and relevant documents provided to the evaluation team.
The evaluation team will be required to ensure the quality of data (validity, consistency and
accuracy) throughout the analytical and reporting phases. The evaluation team leader should
ensure compliance with CEQAS and style guidance (Annex 10). The quality assurance process it is
expected to perform before submitting deliverables to OEV (inception report to the final
evaluation report) should be made clear in the proposal for undertaking the evaluation. In
addition, the proposal should set out the measures to ensure that all team members have
adequately undertaken the document review before the fieldwork and are fully prepared for the
HQ briefing.
There will be two levels of quality assurance used by OEV in the evaluation process, the first by the
evaluation manager and, second by the Director of Evaluation. This quality assurance process does
not interfere with the views and independence of the evaluation team, rather it ensures the report
provides the necessary evidence in a clear and convincing way and draws its conclusions on that
basis.
Page 25
23
5. Organization of the Evaluation
5.1. Phases and Deliverables
In order to present the evaluation to the Executive Board First Regular Session in 2020, the
following timetable will be used. This may be adjusted in the inception phase if fully agreed by
OEV. Table 2 provides an overview of the timeline and Annex 1 provides the timeline in more detail.
Table 2: Timeline summary of the key evaluation milestones
Main Phases Timeline Tasks and Deliverables
1. Preparation September to
December 2019
Scoping meetings in HQ
ToR
Selection of evaluation team and contract
2. Inception January to
March 2020
Inception missions
Team briefing
Inception report
3. Evaluation April to
July 2020
Systematic review of documents
Evaluation missions and data collection
Exit debriefing with HQ and RBs
Analysis
4. Reporting
August to
November
2020
Report drafting
Comments process
Final evaluation report
Learning workshop
5. Executive Board
and follow up.
December 2020
to February
2021
Summary evaluation report editing/evaluation report
formatting
Management response and Executive Board preparation
Executive Board presentation (EB.1/2020)
Dissemination event
5.2. OEV Roles and Responsibilities
This evaluation is managed by OEV. Sergio Lenci, Senior Evaluation Officer has been appointed as
evaluation manager. The evaluation manager is responsible for drafting the ToR; selecting and
contracting the evaluation team; preparing and managing the budget; setting up the internal
reference group and the external advisory group; supporting evaluation design in the inception
phase and organizing inception missions; organizing the team briefing in Headquarters; assisting
in the preparation of the field missions; conducting on going quality assurance of the evaluation
products and consolidating comments from stakeholders on the various evaluation products. The
evaluation manager will be the main interlocutor between the evaluation team and WFP
counterparts to ensure a smooth implementation process.
Page 26
24
5.3. Evaluation Team Composition
Evaluation team members with appropriate evaluation and technical capacities will be hired to
undertake the evaluation. The team leader bears ultimate responsibility for all team outputs,
overall team functioning and client relations.
The team leader position requires a minimum of 15 years’ experience in evaluation, with extensive
experience in strategic-level evaluations. Familiarity with school feeding programmes, experience
of humanitarian and development contexts and of the UN system are essential. The team leader
must also have experience in leading teams, excellent analytical and communication skills (written
and verbal) and demonstrated skills in mixed qualitative and quantitative data collection and
analysis techniques. The primary responsibilities of the team leader will be:
• setting out the methodology and approach in the inception report
• guiding and managing the team during the inception and evaluation phases
• overseeing the preparation of data collection outputs (working papers, country reports, etc) by
other members of the team
• consolidating team members’ inputs to the evaluation products (inception report and the
evaluation report)
• representing the evaluation team in meetings with stakeholders
• delivering the inception report, draft and final evaluation reports (including the Executive
Board summary report) and evaluation tools in line with agreed CEQAS standards and agreed
timelines.
Members of the evaluation team will not have been involved in the design, implementation or
monitoring of any programme for WFP or any of its key collaborating partners nor have any other
conflicts of interest. The evaluators are required to act impartially and respect the UNEG Code of
Conduct and Ethics Guidelines. Proposals submitted by evaluation firms to conduct this evaluation
will be assessed against their procedures in ensuring ethical conduct of their evaluators.
The evaluation team should have strong capacity in conducting global strategic evaluations that
incorporate country-level studies. The team will be multi-disciplinary including extensive
knowledge, skill and expertise in evaluating school feeding related interventions, as well as in the
collection and analysis of both qualitative and quantitative data and information. At least one team
member should have experience with the analysis and synthesis of evaluation reports and be able
to use appropriate software in this process.
The evaluation team must ensure a gender equality and equity focus in all phases of its
implementation. Across the team there must be a strong understanding and experience of the
multilateral development system and of humanitarian principles and institutional architecture.
Between the team members, there should be qualifications in, and considerable experience of the
following technical areas related to school feeding: food and nutrition security; education; gender
equality; social protection; rural development and institutional capacity development.
The team itself should comprise a balance of men and women of mixed cultural backgrounds. A
core team of between 3 to 4 people is expected, including the team leader. When conducting
country studies, core team members should be complemented by national expertise. The team
leader should be able to communicate clearly both verbally and in writing in English. The team
should also have additional language capacities (French and Spanish and possibly Portuguese and
Arabic). The evaluation team members should:
Page 27
25
▪ contribute to the evaluability assessment and the design of the evaluation methodology in
their area of expertise
▪ undertake interviews in headquarters, regional bureaus and with partners
▪ undertake documentary review prior to fieldwork and later as needed
▪ conduct field work to generate additional evidence from a cross-section of stakeholders,
including carrying out site visits, collect and analyse information
▪ participate in team meetings with stakeholders
▪ prepare inputs in their technical area for the evaluation products
▪ contribute to the preparation of the evaluation report.
▪ Support will be provided by OEV to collect and compile relevant documentation not available
in the public domain and undertake analysis of internal data in support of the overall data
collection effort.
5.4. WFP Roles and Responsibilities
WFP stakeholders at country office, regional bureau and headquarters levels are expected to:
provide information necessary to the evaluation; be available to the evaluation team to discuss
the programme, its performance and results; facilitate the evaluation team’s contacts with
stakeholders for country visits, and; set up meetings and field visits, organise for interpretation if
required and provide logistic support during the fieldwork. The evaluation team in the inception
report will present a detailed consultation schedule. To ensure the independence of the
evaluation, WFP employees will not participate in meetings where their presence could bias the
responses of external stakeholders.
5.5. Evaluation governance
WFP colleagues from the key divisions and offices will be asked to be members of the Internal
Reference Group (IRG). IRG members will be responsible for engaging in meetings/workshops for
discussing the inception report and drafts of the evaluation report and summary evaluation
report. A small number of external experts from other UN system entities involved in school-based
health and nutrition initiatives, as well as from academia, research institutes, international NGOs
or foundations will be invited to be members of an Expert Advisory Group (EAG). Members of the
EAG will be requested to review and provide comments on the draft inception and evaluation
reports (or specific parts of them). Attention will be paid to ensure gender balance in the IRG and
EAG. Annex 8 contains a tentative lists of members of the IRG and the EAG will be integrated at
the beginning of the inception phase.
5.6. Communication
Emphasizing transparent and open communication, the evaluation manager will ensure
consultation with stakeholders on each of the key evaluation phases. The evaluation ToR and
relevant research tools will be summarized to better inform stakeholders about the process of the
evaluation and what is expected of them. In all cases the stakeholders’ role is advisory. Briefings
and de-briefings will include participants from country, regional and global levels. Participants
unable to attend a face-to-face meeting will be invited to participate by telephone or
teleconference. A Communication and Learning Plan for the Evaluation can be found in Annex 2.
A more detailed plan for the findings and evaluation report will be drawn up by the evaluation
Page 28
26
manager during the inception phase, based on the operational plan for the evaluation contained
in the inception report.
OEV will make use of a file-sharing platform to assist in communication and file transfer with the
evaluation teams. In addition, regular teleconference and one-to-one telephone communication
between the evaluation manager and the rest of the evaluation team will assist in discussion of
any issue. The main deliverables during the evaluation phase will be produced in English. To the
extent possible, debriefings at the end of the Country missions should be conducted in the
national language. Should translators be required for fieldwork, the evaluation team will make
the necessary arrangements and include the cost in the budget proposal. The team must ensure
the confidentiality of all data collected during the course of the evaluation.
After completion of the fieldwork, OEV will organize an exit de-briefing with internal stakeholders
to discuss the draft evaluation findings (End of June or early July 2020). After the completion of the
evaluation report a learning workshop will be organized to discuss findings, conclusions and
recommendations among a wide range of interested WFP stakeholders (early October 2020). The
Summary Evaluation Report together with Management Response will be presented to WFP’s
Executive Board in all official WFP languages in February 2021.
OEV will ensure dissemination of lessons through the annual evaluation report, presentations in
relevant meetings, WFP internal and external web links. In addition, a specific dissemination event
will be organized to engage with WFP employees and external stakeholders on the evaluation and
facilitate further utilization of the evaluation findings and conclusions. The country offices and
regional bureaux are encouraged to circulate the final evaluation report to external stakeholders.
OEV will explore opportunities to undertake joint learning and communication work with other UN
agencies undertaking similar evaluation exercises, as applicable.
5.7. Budget
The evaluation will be financed from OEV’s Programme Support and Administrative budget.
Page 29
27
Annex 1: Evaluation Timeline
Tentative timeline By Whom
Key Dates
(deadlines)
Phase 1 - Preparation Sep-Dec 2019
Draft ToR sent to OEV for feedback EM 7 October
Draft ToR to OEV/D clearance for circulation to IRG
and to LTA
EM 14 October
Receive WFP feedback EM 28 October
Receive Offers from LTA EM 4 November
Final ToR sent to WFP Stakeholders and uploaded EM 8 November
Assess LTA and Identify winner EM 15 November
Set up of the IRG/EAG EM 13 December
Contracting evaluation team/firm EM + OEV
Admin
team
13 December
Phase 2 - Inception Jan-April 2020
Team preparation prior to HQ briefing (reading
Docs)
Team January
HQ briefing (WFP Rome) EM &
Team
20-23 January
Inception Mission EM & TL 3 to 7 February
Submit Draft inception report (IR) to OEV (after LTA
firm Quality Assurance review)
TL 28 February
OEV Quality Assurance and Feedback EM 5 March
Submit revised draft IR (D1) to OEV TL 19 March
OEV Quality Assurance QA2 23 March
Share IR with IRG and AEG members for their
feedback (2 weeks for comments)
EM 24 March
Deadline for comments IRG, EAG 7 April
OEV Consolidates all comments in matrix and share
them with TL
EM 8 April
Submit revised IR (D2) TL 15 April
Circulate final IR to WFP stakeholders FYI; post a
copy on intranet.
EM 20 April
Phase 3 - Evaluation Phase, including Fieldwork May-June 2020
Fieldwork & other data collection (*). Field visits &
internal briefings with CO and RB (ppt) after each
country visit
Team 20 April to 11
June
Overall debriefing with HQ, RB and COs Staff (ppt) EM&TL 17 June
Page 30
28
Phase 4 - Reporting July-Dec 2020
Submit draft (D0) Evaluation Report (ER) to OEV
(after LTA firm Quality Assurance review)
TL 13 July
OEV comments sent to the team EM 17 July
Submit revised draft ER to OEV TL 31 July
OEV to provide an additional round of comments EM 6 August
Submit revised draft ER (D2) to OEV based on OEV
comments.
TL 20 August
OEV Quality Assurance and Clearance by DoE QA2 26 August
Share ER with IRG and EAG (2 weeks for comments) EM 1 September
Stakeholders’ workshop EM & TL 15 & 16
September
Deadline for comments on ER TL 18 September
OEV consolidate all WFP’s comments (matrix) and
share them with TL
EM 22 September
Submit revised draft ER (D3) TL 29 September
OEV final feedback on ER sent to the team EM 6 October
Submit draft (D0) Summary Evaluation Report (SER) TL 13 October
OEV feedback on SER sent to the team EM 19 October
Submit revised SER TL 26 October
OEV Quality Assurance and DoE clearance to send
SER to Executive Management Group (EMG)
QA 2 6 November
OEV circulates SER to EMG for comments (2 weeks
for comments)
EM 9 November
Deadline for EMG comments EMG 23 November
OEV sends and discusses the comments on the SER
to the team for revision
EM 26 November
Submit final draft ER (with the revised SER) to OEV TL 2 December
Seek Final approval by DoE. Clarify last points/issues
with the team
EM 4 December
Submit approved SER to the EB Secretariat 6 December
Phase 5 - Executive Board (EB) and follow-up
Presentation of Summary Evaluation Report to the
EB
DoE February 2021
.
Page 31
29
Annex 2: Initial Evaluation Communication and Learning Plans33
Internal (WFP) communication plan
When
Evaluation
phase with
month/year
What
Communication
product
To whom
Target
group or
individual
What level
Purpose of
communication
From whom
Lead OEV staff
with
name/position
How
Communication
means
e.g. meeting,
interaction, etc.
Why
Purpose of
communication
Preparation
(Sep-Dec 2019)
TOR (Oct 2019)
Full ToR
ToR summary
OEV, CO, RB,
HQ,
Conceptualization
& Strategic
Evaluation Manager
(EM)
Consultations,
meetings and
written
exchanges
Draft ToR for
comments / Final for
information
Inception (Jan-Mar
2020)
HQ Briefing +
Inception
Mission
Inception Report
(IR)
HQ, RB, CO,
stakeholders
Operational &
Informative
EM Written exchange Draft IR for
comments
Final IR for
information
Field work,
debrief (Apr- Jul
2020)
PPT CO, RB, HQ,
stakeholders
Operational Evaluation Team
Leader (TL)
Meeting /
Teleconference
For information and
verbal feedback
Reporting (July -
Nov 2020)
Draft and Final
Evaluation
Report (ER),
Workshop
CO, RB, HQ,
EAG,
stakeholders
All EM, OEV Director Written exchanges
(+ matrix of
comments on
request) and
Draft ER for written
comments / Final ER
for information
33 To be further developed during the inception phase
Page 32
30
presentations
Learning
workshop (Oct
2020)
PPT CO, RB, HQ Learning EM, OEV Director Workshop Utilization of the
findings and
conclusions of the
evaluation
Follow-up/EB
(Dec-Feb 2021)
Evaluation Brief CO, RB, HQ Informative EM, OEV Director Written exchange Dissemination of
evaluation findings and
conclusions.
Dissemination
event
(March 2021)
PPT CO, RB, HQ Informative EM, OEV Director Event Dissemination of
evaluation findings and
conclusions.
Page 33
31
External communications plan
When
Evaluation phase with
month/year
What
Communication
product
To whom
Target group or
individual
What level
Purpose of
communication
From whom
Lead OEV staff with
name/position
How
Communication means
e.g. meeting,
interaction, etc.
Why
Purpose of
communication
ToR, Oct 2019 Final ToR
ToR summary
Public, UNEG Strategic OEV Websites Public information
IR, March 2020 Final IR Public, UNEG Strategic OEV Websites Public information
Formatted
ER/Translated SER, Nov
2020
Final
Report
(incl. SER)
Public, UNEG Strategic &
Operation
al
OEV, EB Secretariat Websites Public information
Evaluation Brief,
Dec 2020
2-page
Evaluation
Brief
Board
Member &
wider public
Strategic OEV Website Public information
EB, Feb 20211 SER & Mgt Resp Board Member All OEV & RMP Formal presentation For EB consideration
Page 34
32
Annex 3: Overview of Expenditure 2017-2019
Data on school feeding expenditure was compiled and shared by the PDS. It is available for 53
country offices. There are challenges for the reliability of expenditure data for two reasons:
First, the source of the dataset is the COMET database, and the earliest year for which it is available
is 2017 (for a handful of countries that started CSP in 2017); for most countries it is available as of
2018 or 2019 according to the start of their CSP. Additionally, as data was obtained at the
beginning of October 2019, it does not indicate full 2019 expenditure figures. This means that the
expenditure figures presented below (the sum of 2017, 2018 and 2019) are not necessarily
indicative of the scale of WFP interventions in each country, as they sum up expenditure figures at
different points of the CSP cycle (1st, 2nd or 3rd year).
The second reason for concern is the difficulty of determining what constitutes “school feeding”
expenditure. The Corporate Results Framework 2017-2021 introduced activity categories, one of
which is “School meal activities,”34 and this category is used as an indicator of school feeding for
the purpose of calculating expenditure. However, cross-referencing of this activity tag against the
free-text activity descriptions shows that there is some mis-alignment between the two. I.e. a
number of activities which describe “school meal programmes” or “school feeding programmes”
are not categorized as “School meal activities.” Thus, the school meal activity tag serves at best as
a proxy for school feeding expenditure.
34 World Food Programme, Corporate Results Framework (2017–2021)
School feeding expenditure,
375,354,368, 5%
Other expenditure, 6,851,597,683, 95%
School feeding expenditure as a share of total WFP expenditure 2017-2019
Page 35
33
Crisis / Low capacity (13) Fragile contexts /Emerging capacity (16)
Stable contexts /Established capacity (15)
Stable contexts /Advanced capacity (9)
School feeding expenditure 2017-2019 per RB by country
capacity
RBB RBC RBD RBJ RBN RBP
Direct, 374,215,689
TA only, 1,138,679
Total School Feeding Expenditure 2017-2019
by implementation modality
Page 36
34
Capacity building, 26,177,890, 7%
Cargo preference, 5,929,459, 2%
CBT and commodity vouchers, 60,935,904,
16%
Food, 239,427,709, 64%
Implementation, 42,752,805, 11%
Unprogrammed, 130,601, 0%
School Feeding Expenditure 2017-2019 by cost component
Non-emergency, 254,396,373, 68%
L2, 70,407,262, 19%
L3, 50,550,733, 13%
School Feeding Expenditure 2017-2019 by emergency
setting
Page 37
35
Crisis / Low capacity (13) Fragile contexts /Emerging capacity (16)
Stable contexts /Established capacity (15)
Stable contexts /Advanced capacity (9)
School feeding expenditure 2017-2019 per cost component by
country capacity
Capacity building Cargo preference CBT and commodity vouchers
Food Implementation Unprogrammed
Page 38
36
Annex 4: School Feeding Participants by Region and Country Capacity35 ,
2017-2019
School Feeding participants are a sub-set of Tier 1 beneficiaries. “Tier 1 beneficiaries are ’targeted
persons provided with food assistance.’ Tier 1 also incorporates ‘activity supporters’, persons who
receive transfers as incentives to implement WFP programmes.” (source: Beneficiary Counting in
Comet). However, the figures on “feeding participants” reported here were prepared by the PDS
and exclude activity supporters.
35 For an explanation of how Country capacity is calculated please refer to the Notes on data sources and use in Annex 5
0
1,000,000
2,000,000
3,000,000
4,000,000
5,000,000
6,000,000
2016 Feeding participants(Actuals)
2017 Feeding participants(Actuals)
2018 Feeding participants (nooverlap)
Feeding participants by RB 2016-2018
RBB
RBC
RBD
RBJ
RBN
RBP
0
1,000,000
2,000,000
3,000,000
4,000,000
5,000,000
6,000,000
7,000,000
8,000,000
9,000,000
2016 2017 2018
Feeding participants 2016-2018 by country capacity
Crisis / Low capacity
Fragile contexts / Emergingcapacity
Stable contexts / Establishedcapacity
Stable contexts / Advancedcapacity
Page 39
37
Annex 5: Sampling Methodology and Country Selection
1. Notes on Data sources and use
The full dataset consists of 73 countries in which WFP has a school feeding programme. The list is
derived from a dataset of basic indicators on WFP school feeding programmes around the world
prepared by the WFP School Feeding Service (OSF). This was merged with data on country capacity for
school feeding (SABER Index) and data on school feeding expenditure. To this merged dataset were
added data on country income classification (as per World Bank classification), overall country capacity
to deliver on policies and services and evaluation coverage.
SABER-Index is available for 52 countries. The dataset was compiled and shared by the WFP School
Feeding Service (OSF) and it includes also data on WFP operational presence, WFP school feeding
programme status (Funding, Handover, Operational, Protracted, Same, Scale up, TA Only), and the
number of feeding participants (Tier 1 beneficiaries) 2016-2018.
“The Systems Approach for Better Education Results (SABER) is a World Bank led initiative, of which
WFP is a partner, to collect and disseminate comparative data and knowledge on education policies,
to help countries systematically evaluate and strengthen their education systems.”36
SABER categorizes country capacity as Latent, Emerging, Established or Advanced across five
dimensions:
1. Policy Frameworks:37
- to what extent national level policies and strategies recognize school feeding as an
education or social protection intervention,
- to what extent there is an adequate technical policy dedicated to school feeding
2. Financial Capacity;
- the extent of budgeting and funding of school feeding from the national budgets
3. Institutional Capacity and Coordination
- the extent of partnerships and inter-sector coordination of school feeding at national level
- the strength of management accountability structures in the national school feeding
management unit and in schools
4. Design and Implementation
- whether there is a functional M&E system for quality assurance of school feeding
programme
- adequate targeting criteria
- adequate food modalities, food safety and nutrition requirements
- sustainable procurement and logistics with preference for local procurement
5. Community roles -reaching beyond schools
- the extent of community participation in the school feeding programme (in cash, labour, or
in-kind contributions)
The SABER corporate index is derived from this classification by assigning a score of 1 (latent), 2
(emerging), 3 (established) or 4 (advanced) for each dimension and taking their arithmetic mean.
Data on the overall country capacity to deliver on policies and services comes from the WFP 2019-
2030 draft School Feeding Strategy.
36 WFP 2017-2021 Programme Indicator Compendium (April 2019 update) 37 SABER School Feeding Rubric
Page 40
38
The country capacity categories were determined by aggregating 1. Governance Index (World Bank);
2. Gross National Income (GNI) Index (World Bank) and 3. Fragile States Index (Fund for Peace) with
equal weighting.38
The draft strategy then maps the four categories onto the proposed WFP strategic roles in school
feeding as follows:
❶ Providing
operational support
❷Consolidating
national programmes ❸Knowledge sharing
Crisis /
Low capacity
Fragile contexts /
Emerging capacity
Stable contexts /
Established capacity
Stable contexts /
Advanced capacity
Data on school feeding expenditure was compiled and shared by the OSF. It is available for 53 country
offices. There are challenges for the reliability of expenditure data for two reasons:
First, the source of the dataset is the COMET database, and the earliest year for which it is available is
2017 (for a handful of countries that started CSP in 2017); for most countries it is available as of 2018
or 2019 according to the start of their CSP. Additionally, as data was obtained at the beginning of
October 2019, it does not indicate full 2019 expenditure figures. This means that the expenditure
figures presented below (the sum of 2017, 2018 and 2019) are not necessarily indicative of the scale
of WFP interventions in each country, as they sum up expenditure figures at different points of the
CSP cycle (1st, 2nd or 3rd year).
The second reason for concern is the difficulty of determining what constitutes “school feeding”
expenditure. The Corporate Results Framework 2017-2021 introduced activity categories, one of
which is “School meal activities,”39 and this category is used as an indicator of school feeding for the
purpose of calculating expenditure. However, cross-referencing of this activity tag against the free-
text activity descriptions shows that there is some mis-alignment between the two. I.e. a number of
activities which describe “school meal programmes” or “school feeding programmes” are not
categorized as “School meal activities.” Thus, the school meal activity tag serves at best as a proxy for
school feeding expenditure.
38 World Food Programme, School Feeding Strategy 2019-2030 (draft - for consultation) 39 World Food Programme, Corporate Results Framework (2017–2021)
Page 41
39
2 Method and Criteria for Country selection.
The selection of countries was based on a purposeful sampling approach. The criteria used include
the following:
1. Overall country capacity to deliver on policies and services
2. SABER-SF Corporate Index
3. Type of WFP SF programme
4. Emergency setting
5. Nutritional situation
6. School enrolment
7. Gender discrepancy between enrolment rates
8. Evaluation coverage
9. Key donors contribution
To operationalize this selection process, countries were classified primarily according to their
overall capacity and the SABER corporate Index. While SABER Index and the country capacity
variables are composed of related variables measuring policy and financial capacity, the
correlation between the two is not strong; countries with similar values of the SABER-SF Index
appear across the country capacity categories. Therefore, both are used to categorize countries.
Further to this, a number of countries are missing the SABER-SF Index; these are treated as
another category, thus creating a 4x4 matrix of 16 cells to serve as the starting point for the
selection process.
The country capacity variable is an especially important measure because it captures a wealth of
information about multiple dimensions relevant to school feeding. Figure 1 below illustrates how
the country capacity categories reflect the nutrition and food security dimension within countries.
Higher country capacity categories are associated with much lower average prevalence of
undernourishment (SDG indicator 2.1.1.), lower prevalence of severe food insecurity in adult
population (SDG indicator 2.1.2.) and lower proportion of children moderately or severely stunted
(SDG indicator 2.2.1.); higher country capacity categories are weakly associated also with higher
proportion of children moderately or severely overweight and lower proportion of children
moderately or severely wasted (SDG indicator 2.2.2.)
0.005.00
10.0015.0020.0025.0030.0035.0040.0045.0050.00
SDG 2.1.1 Prevalenceof undernourishment
(%)
SDG 2.1.2 Prevalenceof severe food
insecurity in adultpopulation (%)
SDG 2.2.1 Proportionof children
moderately orseverely stunted
SDG 2.2.2 Proportionof children
moderately orseverely overweight
SDG 2.2.2 Proportionof children
moderately orseverely wasted
Figure 1. SDG 2 indicator overview by country capacity
Crisis / Low capacity Fragile contexts / Emerging capacity
Stable contexts / Established capacity Stable contexts / Advanced capacity
Page 42
40
Figures 2 and 3 below further show how the country capacity categories capture variation among
countries in education. Countries with established and advanced capacity have higher rates of
school enrolment and enrolment rates for girls tend to be higher than for boys. This association
is more pronounced in secondary school enrolment rates than in primary school enrolment rates.
The next criterion of selection is a measure of WFP engagement with each country. It is a simple
indicator of whether WFP is providing school feeding services directly or only technical assistance
to the government. WFP provides technical assistance only in 10 of the 73 countries in which it has
a school feeding programme. The expenditure on these programmes is less than 1% of total
expenditure from 2017 to 2019, but given that these programmes represent a different mode of
engagement with the country governments, they are taken into consideration as a separate
category.
0.00
10.00
20.00
30.00
40.00
50.00
60.00
70.00
80.00
90.00
100.00
Primary school net enrollment rate,overall
Secondary school net enrollment rate,overall
Figure 2 Average primary and secondary school enrolment (%) by country capacity
Crisis / Low capacity
Fragile contexts / Emergingcapacity
Stable contexts /Established capacity
Stable contexts / Advancedcapacity
-10.00
-8.00
-6.00
-4.00
-2.00
0.00
2.00
4.00
6.00
8.00
10.00
Primary school net enrollment rate, difference: girls-boys
Secondary school net enrollment rate, difference:girls-boys
Figure 3 Difference in primary and secondary school enrolment rates (girls-boys) by country capacity
Crisis / Low capacity Fragile contexts / Emerging capacity
Stable contexts / Established capacity Stable contexts / Advanced capacity
Page 43
41
Operations in emergency settings represent a significant portion of WFP operations. The 13 L2/L3
(as of October 2019) countries account for one third of the total 2017-2019 school feeding
expenditure.
The selection was also informed by prioritizing countries covered by funding from USDA (Mc
Govern Dole) and from the Canadian Government, the latter particularly as relates to school
feeding in emergencies and the focus on adolescent girls. Finally, evaluation coverage was also
factored in to select country visits.
As a result, a long list of 17 countries has been identified. Out of this list, 6 countries will be selected
for filed visits and up to 6 for desk studies. Within this sample, the evaluation team will conduct
one visit during the inception phase and 6 visit (one per each country selected) during the data
collection phase. The final selection of countries to be visited will be confirmed during the
inception phase.
The table 1 below provides a snapshot of the countries included in the long list. Table 2 illustrates
their classification according to the SABER and Country Capacity Indexes and table 3 provides the
full the data set for each of these countries.
Table 1. Long list of Selected Countries
Country visit Desk review
RBB
Afghanistan Cambodia
Myanmar
RBC
Tajikistan Syria
Tunisia
RBD
Benin Sierra Leone
Côte d'Ivoire
RBJ
Namibia Congo, Republic of
Lesotho
RBN
Rwanda Kenya
RBP
Haiti Honduras
Peru
Page 44
42
Table 2: Country Classification
Country Current L2/L3
Country School feeding TA only
Country Country visit
Country Desk review
Co
un
try
ca
pa
cit
y
SABER Index 1-2 SABER Index 2-3 SABER Index 3-4 No SABER Index
Cri
sis
/ Lo
w c
ap
aci
ty
Burundi
Chad
Guinea-Bissau
Haiti
Sudan
Guinea
Niger
Sierra Leone
Zimbabwe
Afghanistan
CAR
Congo DR
Korea DPR
Liberia
Somalia
S. Sudan
Syria
Yemen
Fra
gile
co
nte
xts
/ E
me
rgin
g
cap
aci
ty
Burkina Faso
Cameroon
Congo Rep.
Ethiopia
Gambia
Madagascar
Mali
Mauritania
Mozambique
Tajikistan
Togo
Uganda
Bangladesh
Cote d’Ivoire
Myanmar
Nepal
Malawi Iraq
Sta
ble
co
nte
xts
/
Est
ab
lish
ed
ca
pa
city
Benin
Djibouti
Egypt
Senegal
Zambia
Cambodia
Honduras
Kenya
Laos
Rwanda
Sao Tome &
Principe
Tanzania
Kyrgyzstan Lebanon
Lesotho
Nicaragua
Pakistan
Swaziland
Sta
ble
co
nte
xts
/
Ad
va
nce
d c
ap
aci
ty
Indonesia Armenia
Bolivia
Bhutan
Ghana
Jordan
Morocco
Namibia
Sri Lanka
Tunisia
Cuba
Peru
Algeria
Colombia
Dominican Rep.
Ecuador
India
Iran
Philippines
Page 45
43
Table 3: Country Selection Data Set
Co
un
try O
ffic
e
Ca
pa
city
to
de
live
r o
n
po
lici
es
an
d s
erv
ice
s
SA
BE
R I
nd
ex (
corp
ora
te
form
ula
)
SF P
rofi
le
L2
/L3
(O
cto
be
r 2
01
9)
SD
G 2
.2.1
Pro
po
rtio
n o
f
child
ren
mo
de
rate
ly o
r
seve
rely
stu
nte
d
SD
G 2
.2.2
Pro
po
rtio
n o
f
child
ren
mo
de
rate
ly o
r
seve
rely
ove
rwe
igh
t
SD
G 2
.2.2
Pro
po
rtio
n o
f
child
ren
mo
de
rate
ly o
r
seve
rely
wa
ste
d
SD
G 2
.1.1
Pre
va
len
ce o
f
un
de
rno
uri
shm
en
t (%
)
SD
G 2
.1.2
Pre
va
len
ce o
f
seve
re f
oo
d in
secu
rity
in
ad
ult
po
pu
lati
on
(%
) P
rim
ary
sch
oo
l n
et
en
rollm
en
t ra
te, o
ve
rall
Pri
ma
ry s
cho
ol n
et
en
rollm
en
t ra
te, g
irls
Pri
ma
ry s
cho
ol n
et
en
rollm
en
t ra
te, b
oys
Pri
ma
ry s
cho
ol n
et
en
rollm
en
t ra
te, d
iffe
ren
ce:
gir
ls-b
oys
Se
con
da
ry s
cho
ol n
et
en
rollm
en
t ra
te, o
ve
rall
Se
con
da
ry s
cho
ol n
et
en
rollm
en
t ra
te, g
irls
Se
con
da
ry s
cho
ol n
et
en
rollm
en
t ra
te, b
oys
Se
con
da
ry s
cho
ol n
et
en
rollm
en
t ra
te, d
iffe
ren
ce:
gir
ls-b
oys
La
rge
st S
F d
on
or
20
13
-20
18
CP
E/C
SP
E
PE
/SE
/CE
E
DE
s th
em
ati
c e
va
lua
tio
ns
Au
dit
s
RBB
Cambodia
Stable
contexts /
Established
capacity
2.4
(Jan 2014) Direct 32.4 2.23 9.84 18.5 14.4 90.27 90.19 90.33 -0.14 USA
CPE
2017
Safety Nets
(Country
Visit)
School
feeding
2014,
2016,
2017
Myanmar
Fragile
contexts /
Emerging
capacity
2.0 (Jan
2017) Direct L2 29.4 1.51 6.63 10.5 NA 97.66 59.62 62.02 57.24 4.78 Australia
2015,
2016,
2020
Pakistan
Stable
contexts /
Established
capacity
TA Only
–
subject
to
Funding
37.6 2.5 7.1 20.5 NA 67.70 61.61 73.37 -11.76 38.53 36.38 40.51 -4.12 Australia
Resilience
Hum
Protection
(Desk
study)
Funding of
WFP work
2014,
2016
RBC
Page 46
44
Syria Crisis / Low
capacity Direct L3 NA NA 67.96 67.04 68.85 -1.81 48.50 48.08 48.90 -0.82
European
Commission
CSPE
2019
Syria + 5 L3
Hum
Principles
(desk
study)
2014,
2015,
2017,
2018,
2019
Tajikistan
Fragile
contexts /
Emerging
capacity
1.4 (April
2015) Direct 17.5 3.33 5.57 NA 7.8 98.29 96.01 97.14 -1.13 Russian
Federation 2014
Tunisia
Stable
contexts /
Advanced
capacity
2.2 (April
2014) TA only 4.9 NA 97.80 Italy
School
feeding
2015,
2018
RBD
Benin
Stable
contexts /
Established
capacity
1.8 (April
2017) Direct 32.2 1.90 5 10.4 NA 97.21 46.58 39.81 53.18 -13.37 Benin
School
feeding
Côte d'Ivoire
Fragile
contexts /
Emerging
capacity
2.6 (May
2016) Direct 21.6 1.47 6.05 20.7 NA 90.33 86.61 94.02 -7.42 40.20 35.06 45.34 -10.28 USA
2015,
2019 (28
Oct -
8Nov)
Sierra Leone Crisis / Low
capacity
2.0 (Aug.
2018) Direct 37.8 8.75 9.46 25.5 62.2 98.11 95.50 94.74 0.75 41.77 41.01 42.52 -1.51 Canada
2015,
2016
RBJ
Congo, Rep.
Fragile
contexts /
Emerging
capacity
1.6 (June
2014) Direct 21.2 5.91 8.17 37.5 NA Canada
CPE
2013
People
Strategy
(Country
Visit)
2015,
2016
Lesotho
Stable
contexts /
Established
capacity
Direct 33.4 7.48 2.85 12.8 50.1 93.31 93.39 93.23 0.16 41.35 50.03 32.73 17.29 Lesotho
Safety Nets
(Desk
study)
School
feeding
2015,
2018
Page 47
45
Namibia
Stable
contexts /
Advanced
capacity
2.4 (July
2014) TA only 22.7 4.00 7.14 25.4 41.4 Namibia
CSP Pilots
(Desk
study),
Capacity
Develop.
Policy
Joint
eval. of
the
national
SF prog.
RBN
Kenya CO
Stable
contexts /
Established
capacity
2.8 (Dec.
2015) Direct 26.2 4.14 4.18 24.2 31.8 USA
CPE
2011
Resilience
Safety Nets
Desk study
CSP Pilots
(Country
visit)
People
Strategy IR
mission
School
feeding
2014,
2015,
2016,
2017,
2018
Rwanda
Stable
contexts /
Established
capacity
2.2 (Dec.
2011) Direct 36.9 5.55 1.96 36.1 NA 94.79 95.14 94.44 0.70 35.87 38.79 32.93 5.86 USA
CPE
2011
Gender
Policy
(Country
Visit)
2016,
2017
RBP
Haiti Crisis / Low
capacity
1.4 (Aug.
2015) Direct 21.9 3.37 3.72 45.8 NA USA
CPE
2011
Funding of
WFP Work
School
feeding
2014,
2015,
2016,
2017,
2018
Honduras
Stable
contexts /
Established
capacity
2.2 (Apr.
2015) Direct 15.3 NA 80.09 80.93 79.29 1.63 43.78 46.72 40.95 5.77
Private
donors
CSPE
2020
(plan)
School
feeding
Progr.
& Cap.
Dev.
2014,
2015,
2016,
2020
Page 48
46
Peru
Stable
contexts /
Advanced
capacity
3.2 (June
2015) TA only 12.9 8.04 0.52 8.8 NA 95.65 93.05 92.43 0.63 89.31 87.71 90.92 -3.21
UN Other
Funds and
Agencies
(excl. CERF)
Page 49
47
Annex 6: Key Background Documentation
Folder name / File name Date
WFP documents
General Rules and Financial Regulations
Organization Chart
WFP Annual Report 2017
WFP Global Presence
Strategic Plan
2008-2013
2014-2017
2008
2014
Integrated Road Map (IRM) Four Pillars
1. Strategic Plan
WFP Strategic Plan 2017-2021 2016
2. Policy on Country Strategic Plans
Policy on Country Strategic Plans (2017-2021) 2016
3. Financial Framework Review
Financial Framework Review (2017-2021) 2016
4. Corporate Results Framework
Corporate Results Framework (2017-2021) 2016
Relevant Policy and Strategy Documents
WFP School Feeding Policy 2009
WFP Revised School Feeding Policy 2013
Pro-Smallholder Food Assistance: A Strategy for Boosting Smallholder Resilience
and Market Access Worldwide 2017
Nutrition Policy 2012
2017
Unlocking WFP’s potential. Guidance for nutrition-sensitive
programming 2017
Minimum Standards for Nutrition in Emergency Preparedness and Response (NIE
Minimum Standards) 2017
Supply Chain Strategy 2017-2021 2017
Gender Action Plan 2015-2020 2017
Update on Gender Policy EB.A 2018 2018
Gender Policy 2015-2020 2014
Gender Transformation Programme Office Guide
Gender Toolkit
2017
2018
Relevant Studies, Reports, and Other Background Materials
State of School Feeding Worldwide 2013
School Feeding Handbook 2017
Food and Nutrition Handbook 2018
Infographic on WFP School Meals in 2016 2016
Page 50
48
Infographic on WFP School Meals in 2017 2017
Infographic on WFP School Meals in 2018 2018
Case Study: Botswana National School Feeding Programme 2016
Case Study: Brazil - National School Feeding Programme 2016
Case Study: Kenya Home-Grown School Meals Programme 2017
How School Meals Contribute to the SDGs - A Collection of Evidence 2017
Two-Pager on Home Grown School Meals 2017
Two-Pager on School Meals and Education 2016
Two-Pager on the School Meals Investment Case 2016
Rethinking School Feeding - Social Safety Nets, Child Development, and the
Education Sector 2009
Home-Grown School Feeding - A Framework to Link School Feeding with Local
Agricultural Production 2009
Home-Grown School Feeding Resource Framework 2018
Infrastructure for School Feeding 2015
Nutrition-Sensitive landscape review findings report 2016
Smart School Meals - Nutrition-Sensitive National Programmes in Latin America
and the Caribbean - A Review of 16 Countries 2017
The Impact of School Feeding Programmes 2019
Feed Minds, Change Lives: school Feeding, the Millennium development goals and
girls’ empowerment 2014
The State of Food Security and Nutrition in the World 2018
Nutrition Guidelines and Standards for School Meals 2019
The potential of cash-based interventions to promote gender equality and
women’s empowerment 2019
UN and other external documents
2030 Agenda 2015
World Humanitarian Summit – Commitment to Action 2016
Quadrennial comprehensive policy review of operational activities for
development of the United Nations system 2016
SG Report on UN Reform 2017
UNHCR Policy on Emergency Preparedness and Response 2017
Global School Feeding Sourcebook 2016
Making Evaluation Work for the Achievement of SDG 4 Target 5: Equality and
Inclusion in Education
2019
Page 51
49
Annex 7: Summary and list of documents for systematic review
(a) Summary of Documents (year of publication)
Type of Document Total
Strategic Evaluations: providing balanced coverage of WFP’s core planning
instruments, including Strategic Plan elements and related strategies 6
Policy Evaluations: undertaken 4–6 years after implementation starts 8
Country Portfolio Evaluations: Assess the strategic positioning, performance and
results of all of WFP’s work in a country or region 4
Corporate Emergency Evaluations: Assess corporate emergency responses, with
particular attention to humanitarian context and principles, and the coverage,
coherence and connectedness of the response
2
Operations Evaluations Assess the appropriateness, performance and results of
individual operations, helping to embed evaluation planning and use of results in
the programme cycle
2
Impact Evaluations 1
Evaluation Synthesis Reports 11
Decentralized Evaluations 29
Relevant evaluations and assessments by other parties 29
Audits 10
Lessons learned 3
Total 105
Page 52
50
(b) Tentative list of evaluations, audits and lessons learned documents
Strategic Evaluations
- WFP's Capacity to Respond to Emergencies 2020
- Strategic Evaluation of WFP's Support for Enhanced Resilience 2019
- Strategic Evaluation of the Country Strategic Plans Pilots 2018
- Strategic Plan 2014-2016 Evaluability Assessment 2016
- Strategic Evaluation of REACH 2015
- Strategic Evaluation of the food security cluster 2014
Policy Evaluations
- WFP's School Feeding Policy: A Policy Evaluation 2011
- Update of WFP's Safety Nets Policy 2019
- Evaluation of WFP Policy on Capacity Development 2009-2015 2017
- Evaluation of the WFP Corporate Partnership Strategy (2014-2017) 2017
- WFP’s 2012 Nutrition Policy: A Policy Evaluation 2015
- WFP's Cash and Voucher Policy: A Policy Evaluation 2014
- Evaluation of WFP’s 2009 Gender Policy. This Time Around? 2013
- Gender Policy Evaluation (forthcoming) 2020
Country Portfolio Evaluations/Country Strategic Plan Evaluations
- Ethiopia: An evaluation of WFP’s Portfolio (2012-2017). 2019
- Sri Lanka: An evaluation of WFP’s portfolio (2011-2015) 2017
- South Sudan: An Evaluation of WFP’s portfolio (2011-2016). 2017
- Country Portfolio Evaluation. United Republic of Tanzania: An evaluation of
WFP’s portfolio (2011– 2014).
2015
Corporates Emergency Evaluation
- WFP’s Regional Response to the Syrian Crisis (forthcoming) 2018
- WFP’s Corporate Emergency Response in NE Nigeria (forthcoming) 2018
Operations Evaluations
Page 53
51
- Evaluation D’Operation Sao Tomé et Principe – Project de Developpement DEV
200295- Transitions ver un Programme National d’Alimentation et de Santé
Scolaire a Sao Tomé et Principe 2012-2016: Evaluation d’operation de PAM
(2012-2016).
2016
- Haiti DEV 200150 Support for the National School Meals Programme: An
Operation Evaluation
2014
Impact Evaluations
- McGovern Dole 2016-2020 baseline evaluation (Kenya) 2017
Evaluation Synthesis Reports
- Annual Synthesis of Operation Evaluations (2016 - 2017): Optimizing
Performance
2017
- Annual Synthesis of Operation Evaluations (2015 - 2016): Partnerships for the
Future
2016
- Annual Synthesis of Operation Evaluations (2014 - 2015) Changing Course:
From Implementing to Enabling
2015
- Annual Synthesis of Operations Evaluations (July 2013 - July 2014) 2014
- Operation Evaluations Series, Regional Synthesis 2013-2017: Asia and the
Pacific Region
2017
- Operation Evaluations Series, Regional Synthesis 2013-2017: Middle East,
North Africa, Central Asia and Eastern Europe Region
2017
- Operation Evaluations Series, Regional Synthesis 2013-2017: West and Central
African Region
2017
- Operation Evaluations Series, Regional Synthesis 2013-2017: Southern Africa
Region
2017
- Operation Evaluations Series, Regional Synthesis 2013-2017: East and Central
Africa Region
2017
- Operation Evaluations Series, Regional Synthesis 2013-2017: Latin America
and the Caribbean Region
2017
- Synthesis on Food for Assets for Livelihoods Resilience Series 2013
Decentralized Evaluations
- Final Evaluation of WFP’S USDA McGovern-Dole International Food for
Education and Child Nutrition Programme’s Support in Afar and Somali
Regions in Ethiopia 2013–2017
2018
- Mid-Term Evaluation of McGovern-Dole-supported School Feeding
Programme in Lao PDR September 2015 – September 2016
2017
- Evaluation of School Meals Programme in Malawi with support from USDA 2019
- Final Evaluation of the School Meals Programme in Malawi with support from
USDA, and the Governments of Brazil and the United Kingdom 2013 to 2015
2018
- The Evaluation of the Joint Programme on Girls’ Education (JPGE) with
Financial Support from the Norwegian Government (Malawi)
201940
40 Inception report available only (as of 29th October 2019)
Page 54
52
- Evaluation of the Eswatini National School Feeding Programme (2010 -2018)
(forthcoming)
201941
- Mid-Term Evaluation of McGovern-Dole-supported School Feeding
Programme in Nepal January 2015 – September 2016
2017
- Evaluation decentralisee de la modalite transfert monetaire utilisee dans le
programme de cantines scolaires appuye par la PAM au Senegal
2018
- Final Evaluation of McGovern-Dole supported School Feeding Programme in
Bangladesh (2015-2017)
2018
- Mid-Term McGovern Dole School Feeding Programme Evaluation (2015-2017)
(Bangladesh)
2017
- Mid-term McGovern Dole School Feeding Programme Evaluation (2018 - 2020)
(Bangladesh)
2019
- Baseline McGovern Dole School Feeding Programme Evaluation (2018 - 2022)
(Bangladesh)
2018
- PAA Africa programme in Senegal’s Kédougou region 2017
- Final evaluation of the World Food Programme USDA/McGovern-Dole
International Food for Education and Child Nutrition Programme (FFE 615-
2013/041/00) in Kenya (Decentralized Evaluation).
2017
- Endline Evaluation of United States Department of Agriculture (USDA)
McGovern-Dole Grant Food for Education (FFE) Programme for WFP Cambodia
2013-2016
2017
- World Food Programme McGovern-Dole International Food for Education and
Child Nutrition Program (FFE 699-2013/036-00-B) in Liberia.
2017
- USDA Mc-Govern Dole FY14 End-Line Evaluation in Lao PDR. 2017
- An Evaluation of the 2012-2015 Local Food-Based School Meal Programme. 2016
- Gambia DEV 200327: Establishing the Foundation for a Nationally Owned
Sustainable School Feeding in the Gambia
2018
- Evaluation of the National School Feeding Programme in Lesotho, in
consultation with the Lesotho Ministry of Education and Training 2007-2017.
2018
- Evaluación Final del Programa de País del PMA en el Estado Plurinacional de
Bolivia
2018
- Évaluation des programmes intégrés de cantines scolaires financés par
l’Ambassade des Pays Bas (provinces Bubanza, Bujumbura rural et Cibitoke) et
par l’Union européenne (province Gitega) et mis en oeuvre par le PAM au
Burundi 2016 à 2018
2019
- Activités du PAM de renforcement des capacités pour l’amélioration du
Programme National d’Alimentation Scolaire en Tunisie de 2016 à 2018
2019
- Évaluation des activités de renforcement des capacités institutionnelles dans
le domaine de l’alimentation scolaire au Togo 2016 - 2018
2019
- Evaluation of WFP Support to National School Feeding Programme (Namibia) 2020
- Final McGovern Dole School Feeding Programme Evaluation (2014-2016)
combined with baseline (2017 - 2020) (Nepal)
2019
- Evaluation of McGovern Dole Funded School Feeding Programme (Baseline)
(Congo, Republic of)
2018
41 Not available (29th October 2019)
Page 55
53
- McGovern Dole evaluation of school feeding (Haiti) 2019
- School Feeding Programme & Capacity Development (Honduras) 2020
Relevant evaluations and assessments by other parties
- Education in Emergencies and Protracted Crises: Towards a Strengthened
Response
2015
- UNICEF: Evaluation of No Lost Generation/ “Min-Ila” 2018
- MOPAN – WFP 2018
2013
- FAFO: Rethinking emergency school feeding: A child-centred approach 2017
- Food Insecurity and Violent Conflict: Causes, Consequences, and Addressing
the Challenges. Occasional Paper
2011
- UNICEF: School Feeding or General Food Distribution? Quasi-experimental
evidence on the education impacts of emergency food assistance during
conflict in Mali
2018
- 3ie: The impact of food assistance on food insecure populations during
conflict in Mali
2018
- GPE: Country-level Evaluations - Synthesis Report, Fiscal Year 2018 2019
- NORAD: Evaluation of Norwegian Multilateral Support to Basic Education:
Ethiopia Case Study
2015
- NORAD: Evaluation of Norwegian Multilateral Support to Basic Education:
Malawi Case Study
2015
- NORAD: Evaluation of Norwegian Multilateral Support to Basic Education:
Madagascar Case Study
2015
- ONE: A Growing Opportunity: Measuring Investments in African Agriculture 2013
- PCD, NEPAD, University of Pretoria: Case Study of the National School
Nutrition Programme in South Africa
2013
- Young Lives: Do Boys Eat Better than Girls in India? 2016
- World Bank: Do School Feeding Programs Help Children? 2012
- CCGA: Girls Grow: A Vital Force in Rural Economies 2011
- IZA: School Feeding and Learning Achievement, Evidence from India's Midday
Meal Program
2016
- FIU: Comparison of Two School Feeding Programmes in Ghana, WA 2016
- HSB, Ghana IMPA: Ghana School Feeding Program: Re-Tooling for A
Sustainable Future
2011
- WB: Impact Evaluation of School Feeding in Lao 2011
- HGSF, PCD: Examining the costs and cost-efficiency of the Dubai Cares GAIN-
Assisted School Nutrition Project in Bangladesh
2013
Page 56
54
- Masset & Gelli: Improving community development by linking
agriculture, nutrition and education: design of a randomised trial of
“home-grown” school feeding in Mali
2013
- WFP, PCD, NEPAD: Namibian School Feeding Case Study 2012
- WB: Social Safety Nets in Fragile States: A Community-Based School Feeding
Program in Togo
2011
- UNDP-IPC – Structured Demand and Smallholder Farmers in Brazil 2013
- Uwameiye & Salami: Assessment of the Impact of the UNICEF Supported
School Feeding Programme on Attendance of Pupils in Federal Capital
Territory
2013
- FAO: Food Security and School Nutrition in Cabo Verde 2014
- WHO: Pilot project of the Nutrition-Friendly School Initiative (NFSI) in
Ouagadougou, Burkina Faso and Cotonou, Benin, in West Africa
2014
- External WFP Audits:
- Report of the External Auditor on food-related losses WFP/EB.A/2018/6-G/1 2018
- Report of the External Auditor on Changes in Human Resources 2017
- Report of the External Auditor on Decentralization 2017
- Report of the External Auditor on Food Procurement in WFP 2014
- Report of the External Auditor on Management of Corporate Emergencies 2015
- Report of the External Auditor on the School Feeding Programme 2016
- Report of the External Auditor on use of Cash and Vouchers 2013
- Report of The External Auditor on Warehouse Management 2016
- Report of The External Auditor on Working with Cooperating Partners 2013
- Report of The External Auditor on United Nations Humanitarian Response
Depot 2014
- Lessons Learned – School Feeding
- Learning from Experience - Good Practices From 45 Years of School Feeding 2010
- Learning from Evaluations of School Feeding: a Synthesis of Impact
Evaluations
2012
- Successes and Challenges of Implementing USDA McGovern-Dole Funded
Food for Education Programmes in the Asia/Pacific Region 2013-2018
2019
Page 57
55
Annex 8: Office of Evaluation Guidance
OEV Central Evaluation Quality Assurance System (CEQAS) – Strategic Evaluations
I. Guidance for process and content
II. Template for ToR
III. Quality Checklist for ToR
IV. Template for Inception Report
V. Quality Checklist for Inception Report
VI. Template for Evaluation Report
VII. Quality Checklist for Evaluation Report
VIII. Template for Summary Evaluation Report
IX. Quality Checklist for Summary Evaluation Report
OEV Style guides
Report style guide
Supplementary editorial standards for evaluation reports
Page 58
56
Annex 9: Members of the Internal Reference Group (IRG)
The following units will be asked to identify members for the IRG.
Chief of Staff
Operations Management Department
Regional Bureau Bangkok
Regional Bureau Cairo
Regional Bureau Dakar
Regional Bureau Johannesburg
Regional Bureau Nairobi
Regional Bureau Panama
Assistant Executive Director
Programme and Policy Development Department
Smallholder Agricultural Market Support
Safety Nets and Social Protection Unit
School Feeding
Nutrition
Gender
Cash Based Transfer
Assistant Executive Director
Partnerships Department
Government Partnership
Assistant Executive Director & Chief Financial Officer
Resource Management Department
Budget and Programming
Performance Management and Reporting