27
Development Framework Strategic Housing Market Assessment Conclusions December 2010 East Staffordshire Borough Council Local Development Framework

Development Framework
Strategic Housing Market Assessment Conclusions
December 2010
East Staffordshire Borough Council
Local Development Framework


2Introduction13Housing Need24Stage 1: Current housing need35Stage 2: Future need46Stage 3: Affordable housing supply57Stage 4: The housing requirements of households in need6 7Choices within the existing affordable housing stock (Step
4.1)
7Requirement for affordable dwellings of different sizes (Step4.2)
11The private rented sector (Step 4.3)
12Stage 5: Bringing the evidence together7 12Estimate of net annual housing need (Step 5.1)15Key issues for future policy/strategy (Step 5.2)16Joining up across the assessment (Step 5.3)17Housing Need by Housing Market Area20Housing Mix21Affordable Housing Mix
23The housing requirements of specific household groups8
Strategic Housing Market Assessment Conclusions
Contents

This paper provides the evidence of:
how much affordable housing is needed in East Staffordshire, andwhat housing is needed for specific household groups
Government Guidance recommends that plan-wide housing need be assessed by means of a StrategicHousing Market Assessment (SHMA) in place of a Housing Need Survey. In accordance with thisrecommendation, the following documents comprise the Strategic Housing Market Assessment for EastStaffordshire:
a. A sub-regional SHMA carried out by consultants Outside in 2007(1);b. Development of the SHMA evidence base in 2009 led by Stoke City Council(2)
c. As part of this work, a report by Consultants Nevin Leather Associates (NLA) in 2009which includes additional assessment of sub-regional housing need(3), and
d. This paper which updates and brings the above evidence together.
1 West Midlands North Housing Market Area Strategic Housing Market Assessment 2007 FinalReport, Outside Consultants, April 2008
2 Housing Market Analysis North Housing Market Area 2009/10, Stoke on Trent City Council, March2010
3 Developing a Sub regional Housing Strategy in the North Housing Market Area: Evidence, Issuesand Common Policy Areas, Nevin Leather Associates, December 2009
Strategic Housing Market Assessment Conclusions2
1 Introduction

Housing need is defined by the Government Guidance as “the quantity of housing required for householdswho are unable to access suitable housing without financial assistance”.
Hence housing need has a specific meaning and it does not mean the total amount of new housingneeded. The methodology for calculating housing need is laid down in the Government Strategic HousingMarket Assessments Practice Guidance.
Stages 1, 2 and 3 of this methodology were carried out by consultants Nevin Leather Associates (NLA).Since their report the Council has updated some of the data, and this is described below together withStages 4 and 5.
The methodology dictates that housing need is calculated to include housing for all households whocannot afford to purchase suitable entry level market housing, which is defined as housing for sale atthe lower quartile price.
The need for affordable housing is derived from but is not the same as housing need. This is becausehousing need includes housing for households which can afford to rent suitable market housing (privaterented housing) or to purchase suitable market housing at below the lower quartile price (low cost markethousing), and these households do not need affordable housing.
Affordable housing is defined by Planning Guidance as housing for specific households whose needsare not met by the market. Affordable housing does not just mean social rented housing, it also includesother forms of sub-market (intermediate) housing including shared ownership and rent to shared ownership.Shared equity housing is sometimes counted as affordable housing but it does not meet the PlanningGuidance affordable housing criteria.
The general approach taken in applying the methodology is that the following Housing Register applicantshave been excluded from calculations:
Applicants who are not East Staffordshire residents, since the Council has not been askedby neighbouring districts to consider meeting need from within their areas;Existing social tenants, since they do not affect total net housing need. This is a differentapproach to that set out in the Government Guidance, but the Council believes it gives atruer picture of need and supply. The needs of existing social tenants have however beentaken into account in the assessment of what sizes of housing are needed to meet housingneed.
3Strategic Housing Market Assessment Conclusions
Housing Need 2

Current housing need is the ‘backlog’ amount of housing need at a point in time.
One component of NLA’s need calculation is derived from the Housing Register, and this componenthas been re-calculated based on the numbers of applicants on the Housing Register at the end ofSeptember 2009. The total number of households on the Housing Register at that point was 2207(4)ofwhom 353 were not East Staffordshire residents and a further 428 were existing social tenants, leaving1425 to be included in the calculation.
At the end of September 2009 there were 2 homeless households in temporary accommodation.
Including these updated inputs in the NLA calculation gives the following results:
Table 1: Current housing need
Grosscurrenthousingneed
%needingaffordablehousing
Adjustedbacklogneed
Grossbacklogneed
OvercrowdedConcealedHomelessHousingRegister
exc nonresidents
andsocialtenants
88%Derived byNLA fromincomesdata
Adjustedusing aratio
derivedby NLAfrom
1425
+
2
+
From the EastStaffordshirePrivate Sector
HousingCondition
Survey 2008
Calculatedby NLA
using 2006based
householdprojectionspublished byGovernmentin 2009
Asexplainedin the 3rdparagraphabove
Asexplainedin the 2ndparagraphabove
of 2058
Survey ofEnglishHousingdata
300
+
1391
180188%20583118139130021425
4 This compares to an average during 2009-10 of 2211 and an average over 2007-2010 (excludingmonths when the annual review was not up to date) of 2163. Hence the end of September 2009figure was not untypical.
Strategic Housing Market Assessment Conclusions4
3Stage 1: Current housing need

NLA use the average number of new Housing Register applicants as the measure of Existing householdscoming into need. The updated average over the last 2 years is 1529. Excluded applicants (existingsocial tenants and applicants who are not East Staffordshire residents as explained in section 2 above)typically make up 35% of the total, leaving 65% to be used in the calculation. 65% of 1529 is 994.
In addition, the Council believes there is an overlap between Newly forming households and HousingRegister applicants, since clearly some applicants will be newly forming households. Housing applicationsand the Housing Register do not identify newly forming households, but the best proxy for this is theproportion of applicants who are currently Lodging with parents, which is 21%(5). Hence a 21% discountis applied to 994 to give 785 as the number of Existing households coming into need.
Including these updated inputs in the NLA calculation gives the following results
Table 2: Future housing need
Totalnewlyarisingneed pa
Housingneed
number
Housingneed %
Existinghouseholdscoming in to
need
Housingneed
number
Housingneed %
Newly forminghouseholds
57241% of785
Derived byNLA fromincomesdata
As explained inthe aboveparagraphs
62%
of 929
Derived byNLA fromincomesdata
Calculated by NLAfrom 2006 based
householdprojections
+
323published byGovernment in
2009
89532341%78557262%929
5 Based on applicants on the Register who applied in the 12 month period to September 2009
5Strategic Housing Market Assessment Conclusions
Stage 2: Future need 4

Since existing social tenants have been excluded from the calculation of need the number of affordabledwellings occupied by households in need is zero.
Affordable housing supply includes new affordable housing already in the pipeline. Between September2009 (the point at which current housing need was calculated) andMarch 2010 a total of 90 new affordablehousing units were built or acquired, including 20 shared equity homes. A further 305 units are underconstruction or funded, including 131 shared equity homes and 67 Extra-Care homes. The Council isnot aware of any Housing Association plans to take existing units out of management(6). Hence the totalnew affordable housing stock to be included in the calculations totals 395 units.
The annual supply of social rented housing arises from re-lets – previously rented homes which becomevacant and are let to new tenants. The number of re-lets fell significantly in 2009-10 because of fewertenants dying, fewer evictions, fewer homes being abandoned by tenants and fewer tenants moving outof the district. This means that the annual average number of re-lets over the last 3 years was 528, andthis is used as likely future supply.
However this number includes lets to existing social tenants which do not meet need and which thereforeneed to be excluded:
Table 3: Future annual supply of social rented housing re-lets
Average2009-102008-92007-8
528438579567Total re-lets
210169269192Re-lets to existing social tenants
318269310375Re-lets to households in need
Source: CORE
The annual supply of intermediate affordable housing arises when shared ownership homes are re-sold.Unfortunately the data source for this information (CORE) is incomplete. There are around 350 sharedownership dwellings in East Staffordshire, and available evidence(7) suggests that around 5% of thesemay become available each year, providing annual supply of 18 units.
6 This was written before the Council became aware of the possible closure of Elizabeth Court inWinshill. However at the time of writing it is still not clear whether this scheme will close and henceit is not appropriate to allow for its closure in the calculation.
7 Research to Identify the Role of the Intermediate Housing Market in the West Midlands Region,Final Report, Housing Vision Consultancy, July 2010
Strategic Housing Market Assessment Conclusions6
5Stage 3: Affordable housing supply
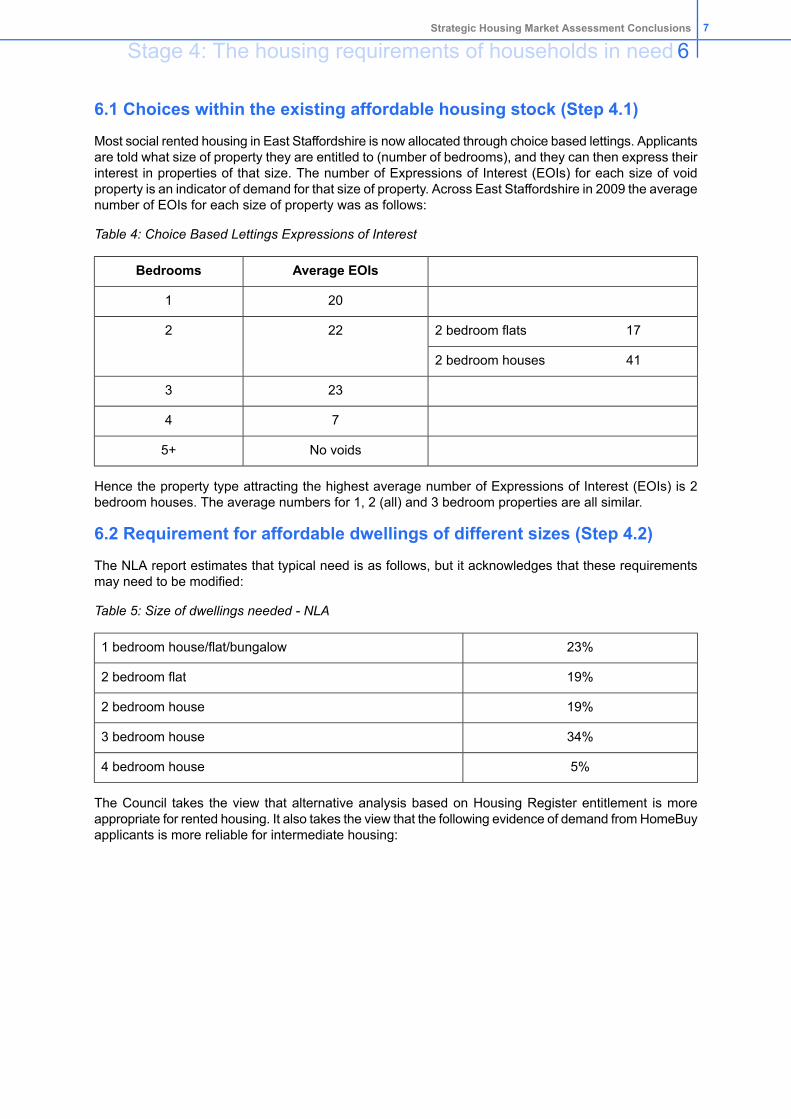
6.1 Choices within the existing affordable housing stock (Step 4.1)
Most social rented housing in East Staffordshire is now allocated through choice based lettings. Applicantsare told what size of property they are entitled to (number of bedrooms), and they can then express theirinterest in properties of that size. The number of Expressions of Interest (EOIs) for each size of voidproperty is an indicator of demand for that size of property. Across East Staffordshire in 2009 the averagenumber of EOIs for each size of property was as follows:
Table 4: Choice Based Lettings Expressions of Interest
Average EOIsBedrooms
201
2 bedroom flats 17222
2 bedroom houses 41
233
74
No voids5+
Hence the property type attracting the highest average number of Expressions of Interest (EOIs) is 2bedroom houses. The average numbers for 1, 2 (all) and 3 bedroom properties are all similar.
6.2 Requirement for affordable dwellings of different sizes (Step 4.2)
The NLA report estimates that typical need is as follows, but it acknowledges that these requirementsmay need to be modified:
Table 5: Size of dwellings needed - NLA
23%1 bedroom house/flat/bungalow
19%2 bedroom flat
19%2 bedroom house
34%3 bedroom house
5%4 bedroom house
The Council takes the view that alternative analysis based on Housing Register entitlement is moreappropriate for rented housing. It also takes the view that the following evidence of demand fromHomeBuyapplicants is more reliable for intermediate housing:
7Strategic Housing Market Assessment Conclusions
Stage 4: The housing requirements of households in need 6

Table 6: Size of intermediate dwellings needed – HomeBuy applicants(8)
West MidlandsStaffordshire &Shropshire
8%8%1 bedroom home
50%47%2 bedroom home
39%41%3 bedroom house
3%3%4 bedroom house
0.4%0.2%5 bedroom house
The sizes of properties needed by housing register applicants(9) as determined by their entitlement andpriority under the Council’s current allocations scheme are as follows. This evidence implies that it is 1and 2 bedroom affordable housing which is most needed. However the Housing Register does not recordall housing need:
Table 7: Housing Register need by size and priority
Band 4Band 3Band 2Band 1(10)All
48%46%41%53%50%1 bedroom house/flat/bungalow
35%37%41%32%35%2 bedroom house/flat
15%12%9%6%9%3 bedroom house
2%4%6%0%4%4 bedroom house
0%1%4%9%1%5+ bedroom house
The Council carried out a Larger Homes Survey in March 2010 to establish whether there was hiddenneed for larger housing. Residents who were not registered on the Housing Register were asked toidentify their need for larger homes. The results demonstrate a very small hidden need, and the Councilis confident that the need calculations are sufficient to capture this level of hidden need.
8 HomeBuy data quoted in Research to Identify the Role of the Intermediate Housing Market in theWest Midlands Region, Final Report, Housing Vision Consultancy, July 2010
9 Derived from the Housing Register at the end of September 200910 Excluding applicants who are in Band 1 because of under-occupation
Strategic Housing Market Assessment Conclusions8
6Stage 4: The housing requirements of households in need

Table 8: Larger Homes Survey
Shared OwnershipSocial rented
12 bedroom
23 bedroom
154 bedroom
115 bedroom
26 bedroom
17 bedroom
128 bedroom
314Total
Bringing the evidence together the following tables show the requirements by size to meet Gross CurrentHousing Need and Total Newly Arising Housing Need. The need is split into need for affordable rentedand intermediate housing in accordance with the NLA report which found that 22% of need could be metwith intermediate housing with 78% needing affordable rented housing. The need for 2-bedroom affordablerented homes is split between flats and houses based on the finding that 54% of Housing Registerapplicants entitled to 2 bedrooms prefer a house rather than a flat(11):
Table 9: Gross current housing need by tenure and size
TotalIntermediateRented
579325471 bedroom house/flat/bungalow
256981582 bedroom flat
357992582 bedroom house
3171531643 bedroom house
213132004 bedroom house
792775+ bedroom house
18013961405Total
11 Strategic Housing Market Assessment 2007 Final Report, Outside Consultants, April 2008
9Strategic Housing Market Assessment Conclusions
Stage 4: The housing requirements of households in need 6

Table 10: Gross future housing need by tenure and size
TotalIntermediateRented
448164321 bedroom
13649872 bedroom flat
14749982 bedroom house
14076643 bedroom house
206144 bedroom house
5155+ bedroom house
895197698Total
The 22% of need which can be met by intermediate housing is households able to afford between 75%and 99% of lower quartile prices(12). To ensure that it can meet all this need, intermediate housing needsto cost no more than 75% of lower quartile price purchase. This equates to shared ownership where theinitial equity share is around 58%, rounded to 60%.
The following table shows annual supply of social rented properties from re-lets by size (excluding homesnewly built or acquired and homes let to existing social tenants) to indicate likely future supply:
Table 11: Annual Affordable Housing supply from social rented housing re-lets
Average2009-102008-92007-8
58%27%867189991 bedroom/bedsit
30%9785104101Supported
30%23%746466922 bedroomflat
7%22239342 bedroomhouse
12%1%20413 bedroomflat
11%352137473 bedroomhouse
1%1%25114 bedroomhouse
0%0%00005+ bedroomhouse
100%100%318269310375Total
Source: CORE
12 Developing a Sub regional Housing Strategy in the North Housing Market Area: Evidence, Issuesand Common Policy Areas, December 2009.
Strategic Housing Market Assessment Conclusions10
6Stage 4: The housing requirements of households in need

Table 12: Annual Affordable Housing supply from intermediate housing re-sales
11 bedroom
42 bedroom flat
72 bedroom house
63 bedroom house
6.3 The private rented sector (Step 4.3)
Research published in 2007(13) estimated that there were 1918 private rented dwellings in EastStaffordshire. However in February 2010 there were 2690 private rented sector tenants in EastStaffordshire in receipt of Housing Benefit and hence at least this number of private rented dwellings.The Council’s 2008 House Condition Survey (14)estimated that there were 4773 private rented dwellingsacross the Borough.
The Council asked NLA to carry out some supplementary work to estimate the extent of private rentedsupply which might be able to meet housing need. Their estimate is that maximum potential supply is602 dwellings pa.
13 The Cambridge Centre for Housing and Planning Research 2007 quoted inHousing Market AnalysisNorth Housing Market Area 2009/10, Stoke on TrentCity Council, March 2010
14 Private Sector House Condition Survey 2008, David Adamson & Partners, December 2008
11Strategic Housing Market Assessment Conclusions
Stage 4: The housing requirements of households in need 6

7.1 Estimate of net annual housing need (Step 5.1)
In accordance with the government guidance net annual housing need is calculated as follows:
Table 13: Net Annual Housing Need
1801Gross Current Housing Need (Table 1)
395Total affordable housing stock available (Paragraph 16)
1406Net Current Housing Need (1801-395)
281Quota of Net Current Housing Need to be addressed pa to clear the backlogin 5 years (1405/5)
895Newly arising Housing Need pa (Table 2)
1176Gross annual Housing Need (281+895)
336Future annual supply of Affordable Housing (Table 3 and paragraph 19)
840Net annual Housing Need (1176-336)
The following tables show this need by tenure and size.
Table 14: Net current Housing Need which can be met by rented housing
CBA
Net current need forrented housing (A-B)
Social rentedpipeline supply
Gross current need forby rented housing
495525471 bedroom
111471582 bedroom flat
228302582 bedroom house
101631643 bedroom house
19822004 bedroom house
770775+ bedroom house
12111941405Total
Strategic Housing Market Assessment Conclusions12
7Stage 5: Bringing the evidence together

Table 15: Net annual Housing Need which can be met by rented housing
HGFED
Net annualneed forrentedhousing
Projectedannual socialrented supply
Total annualneed for
rented housing
(D+E)
Newly arisingannual needfor rentedhousing
Annual quotato meet netcurrent need
(C/5)(F-G)
348183531432991 bedroom
357410987222 bedroom flat
1212214398462 bedroom house
47378464203 bedroom house
5125314404 bedroom house
200205155+ bedroom house
622318940698242Total
Table 16: Net current Housing Need which can be met by intermediate housing
CBA
Net current need whichcan be met by
intermediate housing
Intermediatepipeline supply
Gross current needwhich can be met byintermediate housing
(A-B)
320321 bedroom
395982 bedroom flat
99992 bedroom house
521011533 bedroom house
85134 bedroom house
225+ bedroom house
195201396Total
13Strategic Housing Market Assessment Conclusions
Stage 5: Bringing the evidence together 7
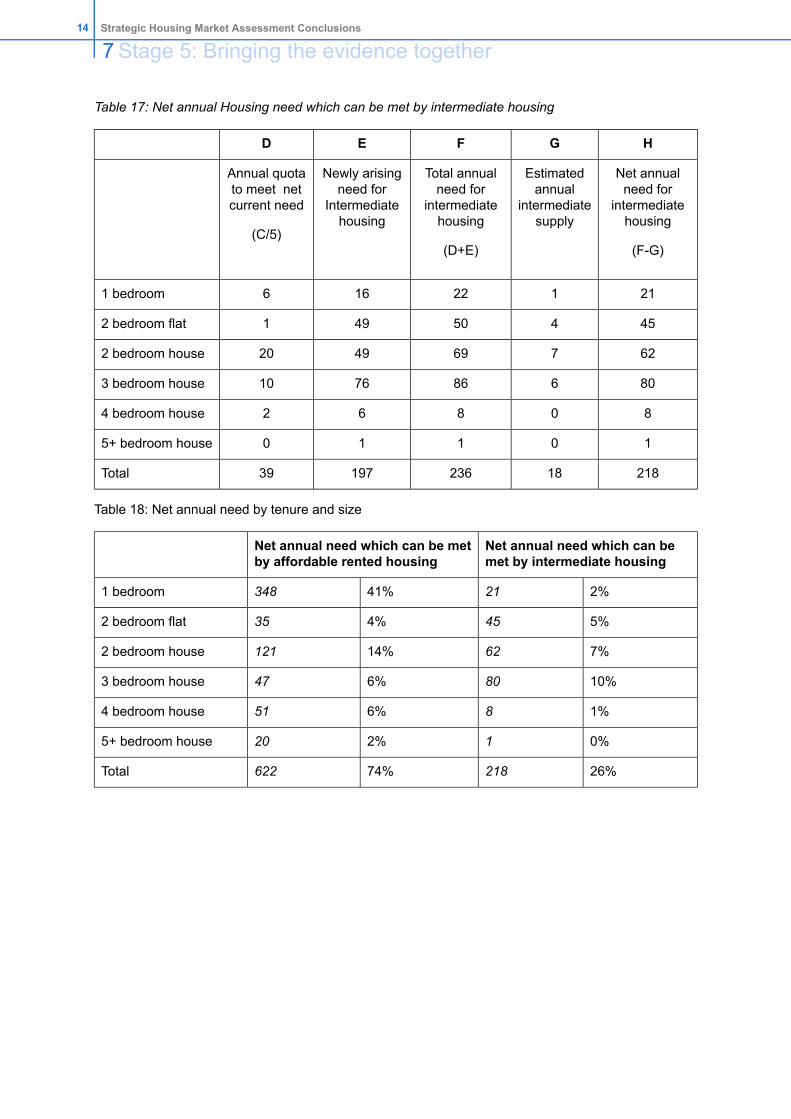
Table 17: Net annual Housing need which can be met by intermediate housing
HGFED
Net annualneed for
intermediatehousing
Estimatedannual
intermediatesupply
Total annualneed for
intermediatehousing
Newly arisingneed for
Intermediatehousing
Annual quotato meet netcurrent need
(C/5)(F-G)(D+E)
211221661 bedroom
454504912 bedroom flat
6276949202 bedroom house
8068676103 bedroom house
808624 bedroom house
101105+ bedroom house
2181823619739Total
Table 18: Net annual need by tenure and size
Net annual need which can bemet by intermediate housing
Net annual need which can be metby affordable rented housing
2%2141%3481 bedroom
5%454%352 bedroom flat
7%6214%1212 bedroom house
10%806%473 bedroom house
1%86%514 bedroom house
0%12%205+ bedroom house
26%21874%622Total
Strategic Housing Market Assessment Conclusions14
7Stage 5: Bringing the evidence together

7.2 Key issues for future policy/strategy (Step 5.2)
Reasons for housing need
It is estimated that current households in housing need are experiencing the following problems. Thepercentages do not total 100 because there is overlap between overcrowding and other categories ofneed:
Table 19: Reasons for Housing Need
47%Overcrowding
9%Homeless or insecure tenure
17%Concealed households
7%Unsatisfactory owner-occupied housing
37%Unsatisfactory rented housing
Sizes of dwellings required to meet housing need
Tables 14-18 above demonstrate the sizes of homes which the Council calculates to be needed accordingto the Government methodology.
It is notable that the average number of Expressions of Interest for 1 bedroom social rented homes (Table5) is lower than for other sizes of home, even though Table 18 indicates a far larger shortage of 1 bedroomhomes. It is clear than many households with a need for 1 bedroom do not continue to express interestin social rented properties. The Council infers from this that they are successful at finding alternativeaccommodation in the private rented sector.
Conversely, Expressions of Interest for 2 and 3 bedroom homes are higher than those for 1 bedroomhomes even though Table 18 indicates a smaller comparable shortage. It is therefore clear that the needfor these homes translates consistently into demand. This implies that applicants entitled to this manybedrooms are less likely to find satisfactory accommodation in the private rented sector. This is likely tobe because of affordability and tenure; it is families who are entitled to 2 or more bedrooms, families arelikely to seek security of tenure because of schooling, and the private rented sector does not typicallyprovide security of tenure because the overwhelming majority of properties in the private rented sectorare let on 6 month assured shorthold tenancies.
Current use of the private rented sector by households in need
40% of current housing register applicants are renting in the private rented sector. The House ConditionSurvey estimated that there were 388 overcrowded households in the private rented sector. Using thisinformation it is calculated that of the households in current housing need at the end of September 2009,884 (49%) were in the private rented sector.
The estimated size of the private rented sector in East Staffordshire is 4773 dwellings (section 6.3).
Bringing these two pieces of evidence together it can be concluded that 884 of 4773 households (18.5%)were housed in the private rented sector but still needed affordable housing. It can be inferred from thisthat 81.5% of private rented supply contributes to meeting housing need.
15Strategic Housing Market Assessment Conclusions
Stage 5: Bringing the evidence together 7

7.3 Joining up across the assessment (Step 5.3)
Other Councils have not asked East Staffordshire to contribute to meeting housing need arising in theirdistricts. The Council therefore seeks to meet the need arising within East Staffordshire only.
Low cost market supply
The supplementary work which the Council asked NLA to carry out also looked at potential low costmarket supply – supply at below lower quartile prices. NLA calculated this as 83 units pa based on2009-10 turnover and 25% of properties at below lower quartile prices being available to meet need.However the Council believes that 100% of properties at below lower quartile prices can contribute tomeeting need. The average turnover over the last 3 years is 427 sales and the Council believes this isa realistic projection.
Low cost market supply can meet need which would otherwise have to be met by intermediate housing.However it is very unlikely that households needing rented housing will be able to secure the finance tobuy low cost market housing and hence it does not help meet the need for rented housing.
The following table shows that low cost market supply occurs overwhelmingly in Burton but also inUttoxeter and other parts of the borough.
Table 20: Low cost market supply
Averagesales
200920082007
-£100,000£104,999£110,000Lower Quartile Price East Staffs
367232292578Sales in Burton below this price
39372950Sales in Uttoxeter below this price
21191529Sales in other parts of EastStaffordshire below this price
427288336657Total lower quartile sales
Source: Land Registry
Economic context
The NLA report includes sensitivity testing of a number of different economic scenarios. It reports risingemployment levels and falling worklessness between 1999 and 2008. However more recent researchfor the West Midlands Regional Assembly(15) reports that:
East Staffordshire is likely to see a substantial increase in unemployment following recentjob losses within the automotive and brewing sectorsThat the demand for rented housing in East Staffordshire could increase as a resultThat it is possible that East Staffordshire will experience particular problems with housingaffordability because of job lossesThat this may increase the need to increase the quota of social housing on new housingdevelopments.
If the local economy remains depressed, whilst this is likely to reduce the price of market housing, anyresulting reduction in need is likely to be offset by increased need arising from higher unemploymentand falling household incomes. Hence it is logical to conclude that the level of housing need is unlikelyto fall over the coming years.
15 Implications of Market Conditions for West Midlands Housing Markets and Regional Housing Policy,Ecotec and GVA Grimley, June 2009
Strategic Housing Market Assessment Conclusions16
7Stage 5: Bringing the evidence together

7.4 Housing Need by Housing Market Area
Four local housing market areas have been identified within the borough of East Staffordshire. The EastStaffordshire wards in each of these areas are as follows (16):
Burton and Surrounds: Burton wards including Branston and Stretton;Rural East: Crown, Needwood, Rolleston on Dove, Tutbury & Outwoods, Yoxall, plusUttoxeter wards Heath and Town;Rural North; Abbey, Churnet and Weaver;Rural West; Bagots.
Uttoxeter lies within the Rural East area but because it is distinct place and the borough’s second largesttown it is dealt with separately in the following analysis.
These local housing market areas are shown below in Figure 1. The Rural North and Rural West areasalso stretch into other districts, but the analysis below is for the areas within East Staffordshire only.
16 Strategic Housing Market Assessment North Housing Market Area Update 2009, Stoke City Council,(not yet published). That report and the NLA report use different names for the housing marketareas as follows: Rural East = Rural Suburbs East Staffordshire; Rural North = Rural EastStaffordshire; Rural West = Rural Stafford West.
17Strategic Housing Market Assessment Conclusions
Stage 5: Bringing the evidence together 7
Figure 1 Local Housing Market Areas
Strategic Housing Market Assessment Conclusions18
7Stage 5: Bringing the evidence together

NLA calculated that net annual housing need occurred in each of these housing market areas. Applyingtheir distribution of need to the revised (reduced) total amount of need indicates the following levels ofneed in each area:
Table 21: Net Annual Housing Need by Housing Market Area
Net Need paProportion of NeedHousing Market Area
51261%Burton and Surrounds
10112%Uttoxeter
15118%Rural East (not including Uttoxeter)
597%Rural North
172%Rural West
840100%
Hence the evidence indicates the need for affordable housing throughout the borough.
The following table shows choice based lettings expressions of interest by area. It indicates that in Burtonthe biggest demand for social rented housing is for 2 bedroom houses, 1 bedroom flats, and 3 bedroomhouses. In Uttoxeter and the rest of the Rural East area the biggest demand is for 2 and 3 bedroomhouses. The data for the Rural North and Rural West housing market areas is not sufficient to enableconclusions to be drawn.
Table 22: Expressions of Interest by Housing Market Area during 2009
Rural WestRural NorthRural EastUttoxeterBurton &Surrounds
Property
EOIsVoidsEOIsVoidsEOIsVoidsEOIsVoidsEOIsVoidsTypeBedrooms
n/a06149122613Bungalow1
n/a01611551125108Flat/bedsit1
41n/a01036345Bungalow2
n/a06420412111890Flat2
n/a0n/a03733744233House2
n/a017129102062366House3
n/a0n/a07143161House4
The Council is having a programme of Parish Housing Needs Surveys carried out in rural parishes byMidlands Rural Housing. These surveys demonstrate the specific needs within a rural parish at a pointin time. They therefore provide evidence to justify affordable housing development on rural exceptionsites. However they do not capture newly arising housing need and hence are not a sufficient measureof the on-going need for affordable housing in rural areas.
19Strategic Housing Market Assessment Conclusions
Stage 5: Bringing the evidence together 7

7.5 Housing Mix
On the basis of the calculations above it is judged that private rented supply meets the needs of 490 ofthe 622 households needing rented housing pa (602 x 81.5% = 490) and therefore 131 new social renteddwellings are needed pa.
Housing need in Burton and Uttoxeter which can be met by intermediate housing is calculated to be 133and 26 dwellings pa respectively, and hence it is assumed that low cost market supply completely meetsthis need (Table 20) (except for Extra-Care housing). The need in the rest of the Borough is for 59dwellings pa, and hence an average low cost market supply of 21 dwellings (Table 20) leaves a needfor 38 new intermediate affordable dwellings pa. Hence low cost market supply towards need totals 180(133+26+21).
The number of new affordable homes needed pa is therefore 169:
Table 23: Annual need for new affordable housing
Total
840Housing need pa (Table 13)
622Need which can be met by rented housing (Table 15)
490Assumed to be met by the private rented sector (Paragraph 55)
131New social rented housing needed (622-490)
218Need which can be met by intermediate housing (Table 17)
180Assumed to be met by low cost market housing (Paragraph 56)
38New intermediate housing needed (218-180)
169Total new affordable housing needed pa (131+38)
It is now expected that 13,000 new homes will not be achievable until 2031 (25 years from 2006). Thisis consistent with the latest 2008 household projections which predict a slower rate of household growththan previous projections; see Table 24 below. This implies an average 520 completions pa. From 2006to 2010 there was a shortfall of 276 completions which needs to be made up by 2031 (over 21 years),an average additional 13 completions pa. Hence projected average completions pa to 2031 are 533. Itis estimated using the Strategic Housing Land Availability Assessment that an average 520 of thesedwellings will be built on sites over the threshold for requiring affordable housing of 25 dwellings. 169affordable homes are 32.5% of 520. This implies an affordable housing contribution of 30% on sitesabove the threshold, subject to this being viable.
Table 24: Projected Household Growth East Staffordshire
2033202820232018201320082006
57555350484545Population 000s
121085300Cumulative
Source: ONS 2008 based Household Projections
Strategic Housing Market Assessment Conclusions20
7Stage 5: Bringing the evidence together

7.6 Affordable Housing Mix
[This section does not apply to Extra-Care housing developments; see Section 8]
The mix of new on-site social rented housing needed is as follows. The need for homes with 4+ bedroomsarises from overcrowded households, principally in the owner-occupied sector, and it is believed unlikelythat many of these households would take up social rented housing, hence the lower contributionstowards the need for these sizes of homes. There is substantial need for accessible 2-bedroom homes(see Section 8 below).
Table 25: Mix of new social rented housing
Contribution of socialrented housing towardsmeeting the need for
rented housing
Resulting socialrented supply
New on-site socialrented housing
41%
47%0%1 bedroom
21%0%2 bedroom flat
10%2 bedroom accessible home
45%17%60%2 bedroom house
52%11%10%3 bedroom house
24%3%15%4 bedroom house
18%1%5%5+ bedroom house
41%100%100%
The needed mix of new intermediate housing is calculated to be as follows:
Table 26: Mix of new intermediate housing needed
10%1 bedroom
20%2 bedroom flat
25%2 bedroom house
40%3 bedroom house
5%4 bedroom house
0%5+ bedroom house
100%
As explained above intermediate housing is not needed in Burton and Uttoxeter and hence the affordablehousing sought in these areas is entirely social rented housing.
In other parts of the borough, the mix of affordable housing will need to include the affordable housingwhich the Council has accepted as being justified by a local housing needs survey or Choice BasedLettings and/or Housing Register evidence. Other on-site affordable housing should be intermediatehousing since this is what is most needed in rural areas.
The intermediate affordable housing needed is housing outside of Burton and Uttoxeter. The lowerquartile price outside of Burton is around 24% higher than the lower quartile price in the borough as awhole. This means that to ensure that intermediate housing is able to meet the need of all target
21Strategic Housing Market Assessment Conclusions
Stage 5: Bringing the evidence together 7

households it needs to be available at 60% of market prices outside of Burton and Uttoxeter rather thanthe 75% indicated above (section 6.2). This equates to a 47% shared ownership share. It is thereforeappropriate for the value of shared ownership housing to be based on a 50% initial share and to requirerecycling of proceeds above the 50% into alternative affordable housing. However it is sensible to allowinitial sale shares to range between 25% and 75% in line with standard Homes and Communities Agencypractice.
Strategic Housing Market Assessment Conclusions22
7Stage 5: Bringing the evidence together

Older People
The latest household projections predict that 92% of household growth in East Staffordshire will be madeup of households comprising people over the age of 65.
Table 27:East Staffordshire projected household growth by age group
Total85+75-8465-7455-6445-5435-4425-34Under25Age group
45156413951Householdsin 2008
(thousands) 100%2%11%13%9%29%20%11%2%
27%71%
575810413961Householdsin 2033
(thousands) 100%9%14%18%7%23%16%11%2%
40%58%
1243400010Change2008 - 2033 27%400%60%67%0%0%0%20%0%
100%
33%25%33%0%0%0%8%0%% ofchange 92%8%
Source: ONS 2008-based Household Projections
This does not mean that 92% of new housing should be housing for the elderly, since the elderly arealready housed and many will stay in their current homes. Hence new housing will be needed for newlyforming households and existing households wanting to move who will find fewer existing dwellingsbecoming available.
None-the-less this evidence does support and reinforce the Council’s Housing Strategy conclusion thatthe biggest component of new housing demand within the Borough is likely to be for housing suitablefor people aged over 65. This larger group of older people will range from those who are very active,through those needing some level of support, to those needing a high level of care, at different stagesof their lives. The ways in which this range of needs can be met are rapidly changing, and the choicesopen to residents in this age group are being widened.
The Housing Strategy concludes that:
Most older people will want to live in normal housing.This is being promoted by the County Council’s Staffordshire Cares programme whichinvolves closing obsolete accommodation.Older people often live in larger properties than they need and opportunities for them to‘down-size’ are needed.This said older people generally want a second bedroom.Most will want to stay in their home as their mobility becomes more difficult.Some will want housing which is specifically designed for older people e.g providing smallgardens with raised beds and storage for mobility scooters with power for recharging.Some older people will need ‘Extra-Care’ housing - their own home within a complexwhere they can receive care.Some older people will like to live alongside other older people.
23Strategic Housing Market Assessment Conclusions
The housing requirements of specific household groups 8

People with disabilities
In 2006 Staffordshire County Council knew of 625 people in East Staffordshire with a physical disabilitywho needed an adapted home. Many of these people will want an adaptation so they can stay in theirexisting home, but some may be willing to move and the Borough Council is considering whether it canencourage a market in adapted homes for sale. A change to the Housing Allocations Policy shouldencourage tenants of social rented homes which are adapted to make them available for others if theyno longer need the adaptations.
The County Council also knew of 186 people with a learning disability who needed new housing, and145 people with mental health distress who needed new housing (17).The County Council is carrying outa project to increase housing options for these groups.
In October 2010 there were 85 applicants on the Housing Register needing an accessible home, of whom73 needed one or two bedrooms. This evidence indicates the need for a proportion of new social rentedhousing to be accessible homes.
Extra-Care Housing
It is projected that over 800 Extra-Care dwellings will be needed in East Staffordshire by 2020 and over1100 by 2030 (18). This equates to an additional 700 dwellings by 2020 and a further 300 by 2030.
Table 28: Need for Extra-Care Housing by 2020
TotalOwnedRented
842573269Projected need by 2020
2929Existing - Barton Mews
3838Existing - Highfield Court
671552Under construction - Chestnut Grange
1344490Total existing and under construction
708529179New Extra-Care dwellings needed by 2020
100%75%25%
It is estimated on the basis of property prices that one third of owned Extra-Care homes will need to beshared ownership. Hence the tenure mix needed in Extra-Care housing is 25% social rented, 25% sharedownership and 50% market housing. Clearly this will only be achievable if grant funding is available.
BME Households
Analysis of the Housing Register has revealed that 18.2% of applicants for social rented housing areBME compared to an estimated 8.9% of the population (19). This suggests that Housing Need is clearlymore prevalent amongst the BME population. BME applicants on the Housing Register need housing ofall sizes.
There is anecdotal evidence that BME households facing overcrowding fail to join the Housing Registerbecause of the small number of larger properties which become available and hence the low chance ofsecuring a suitable home. However the Larger Homes Survey did not evidence such a need despitetargeting of BME communities.
Hence the need calculations above are believed to capture the needs of BME households.
17 Vulnerable Adults Housing Strategy Consultation Draft, Staffordshire County Council 200618 “The Best of BothWorlds” Staffordshire FlexiCare Housing Strategy 2010-2015 v1.00, Staffordshire
County Council 201019 Table 34, Housing Strategy Review informing the Housing Strategy 2009-2014
Strategic Housing Market Assessment Conclusions24
8 The housing requirements of specific household groups

First Time Buyers
Low cost market supply is believed to be sufficient to meet the needs of first time buyers in Burton andUttoxeter. Intermediate housing will meet the needs of first time buyers in the rest of the borough.
Gypsies and Travellers
TheGypsy and Traveller Accommodation Assessment (GTAA) carried out for the Council in 2007 identifiedan indicative need for new pitches. However, this need was calculated on the basis of:
An average 7 unauthorised encampments pa. The number of encampments since thenhas been far lower than this, and encampments have involved a single group of travellers.Interviewing only 2 out of 17 households on the existing permanent residential site in EastStaffordshire and relying overwhelmingly on interviews in Stafford and Stoke where needsmay be different.
The GTAA findings therefore need updating to better inform future housing and planning policy.
25Strategic Housing Market Assessment Conclusions
The housing requirements of specific household groups 8


