42
Washoe County Current Period: April 1 – June 30, 2016 Prior Period: January 1 – March 31, 2016 August 10, 2016 Strategic Plan Review and Action Plan RS-08349-12
| Date post: | 29-Apr-2018 |
| Category: |
Documents |
| Upload: | duonghuong |
| View: | 218 times |
| Download: | 2 times |

Washoe CountyCurrent Period: April 1 – June 30, 2016Prior Period: January 1 – March 31, 2016
August 10, 2016
Strategic Plan Review and Action Plan
RS-08349-12
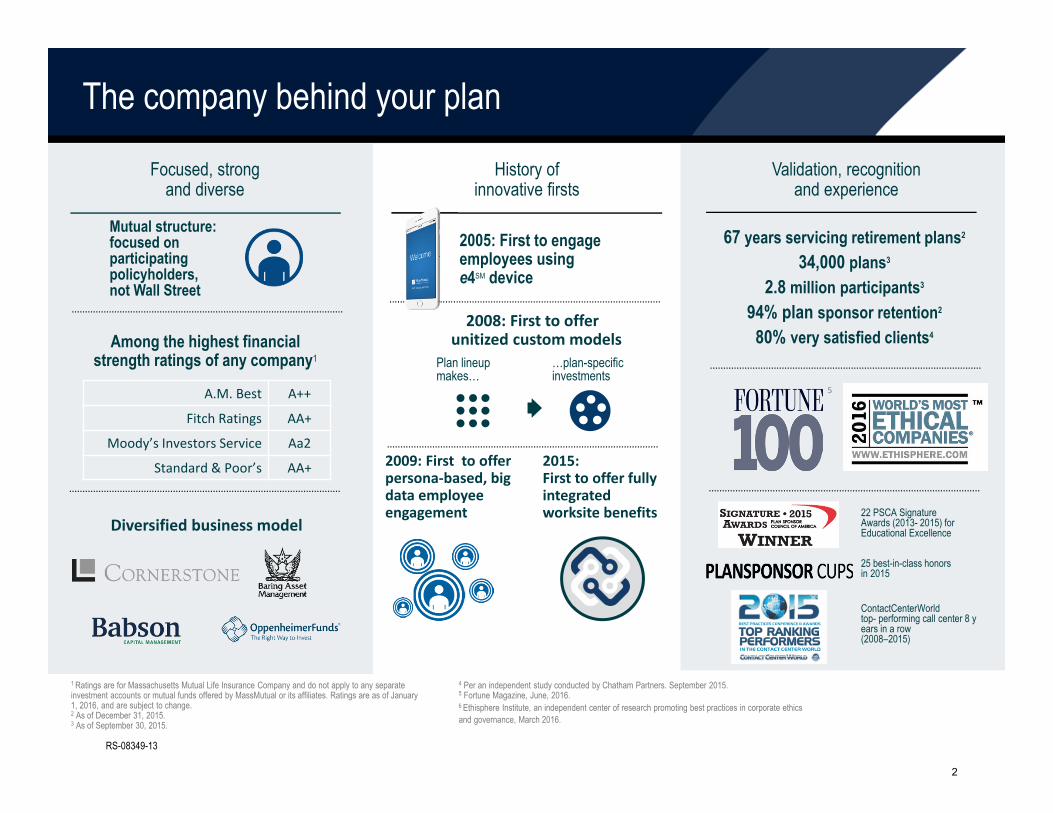
The company behind your plan
Financial Strength*
Focused on using our resources to address our customer needs
160+ Years Ranked No.94 on Fortune 500 List** $639 Billion in assets
under management as of 12/31/2013***
Diversified business model
Mutual structure: focused on participating policyholders, not Wall Street
Focused, strong and diverse
Among the highest financial strength ratings of any company1
A.M. Best A++
Fitch Ratings AA+
Moody’s Investors Service Aa2
Standard & Poor’s AA+
History of innovative firsts
Plan lineup makes…
…plan-specific investments
2008: First to offer unitized custom models
2005: First to engage employees using e4SM device
2015: First to offer fully integrated worksite benefits
2009: First to offerpersona‐based, big data employee engagement
Validation, recognition and experience
5
ContactCenterWorld top- performing call center 8 years in a row(2008–2015)
RS-08349-13
1 Ratings are for Massachusetts Mutual Life Insurance Company and do not apply to any separate investment accounts or mutual funds offered by MassMutual or its affiliates. Ratings are as of January 1, 2016, and are subject to change.2 As of December 31, 2015.3 As of September 30, 2015.
4 Per an independent study conducted by Chatham Partners. September 2015.5 Fortune Magazine, June, 2016.6 Ethisphere Institute, an independent center of research promoting best practices in corporate ethics and governance, March 2016.
67 years servicing retirement plans2
34,000 plans3
2.8 million participants3
94% plan sponsor retention2
80% very satisfied clients4
22 PSCA Signature Awards (2013- 2015) forEducational Excellence
25 best-in-class honors in 2015
2
Executive Summary
RS-39164-00
3
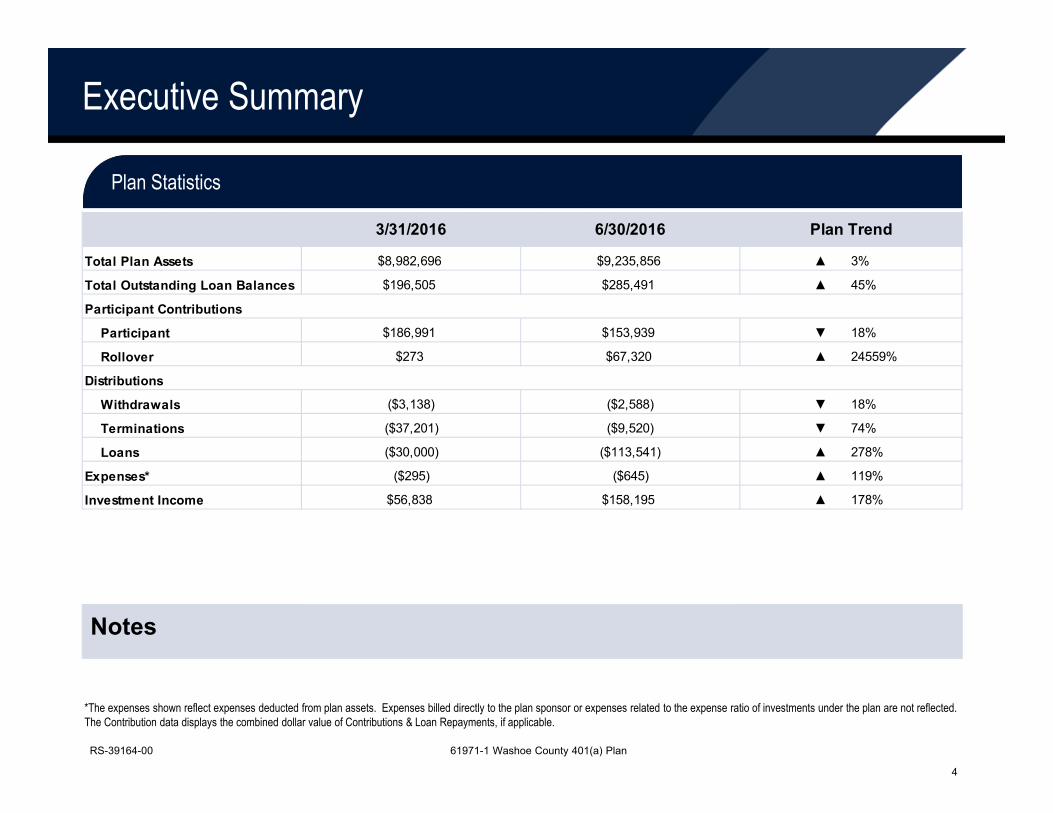
Plan Statistics
RS-39164-00
Executive Summary
*The expenses shown reflect expenses deducted from plan assets. Expenses billed directly to the plan sponsor or expenses related to the expense ratio of investments under the plan are not reflected.The Contribution data displays the combined dollar value of Contributions & Loan Repayments, if applicable.
61971-1 Washoe County 401(a) Plan
Notes
3/31/2016 6/30/2016 Plan Trend
Total Plan Assets $8,982,696 $9,235,856 ▲ 3%
Total Outstanding Loan Balances $196,505 $285,491 ▲ 45%
Participant Contributions
Participant $186,991 $153,939 ▼ 18%
Rollover $273 $67,320 ▲ 24559%
Distributions
Withdrawals ($3,138) ($2,588) ▼ 18%
Terminations ($37,201) ($9,520) ▼ 74%
Loans ($30,000) ($113,541) ▲ 278%
Expenses* ($295) ($645) ▲ 119%
Investment Income $56,838 $158,195 ▲ 178%
Notes
4
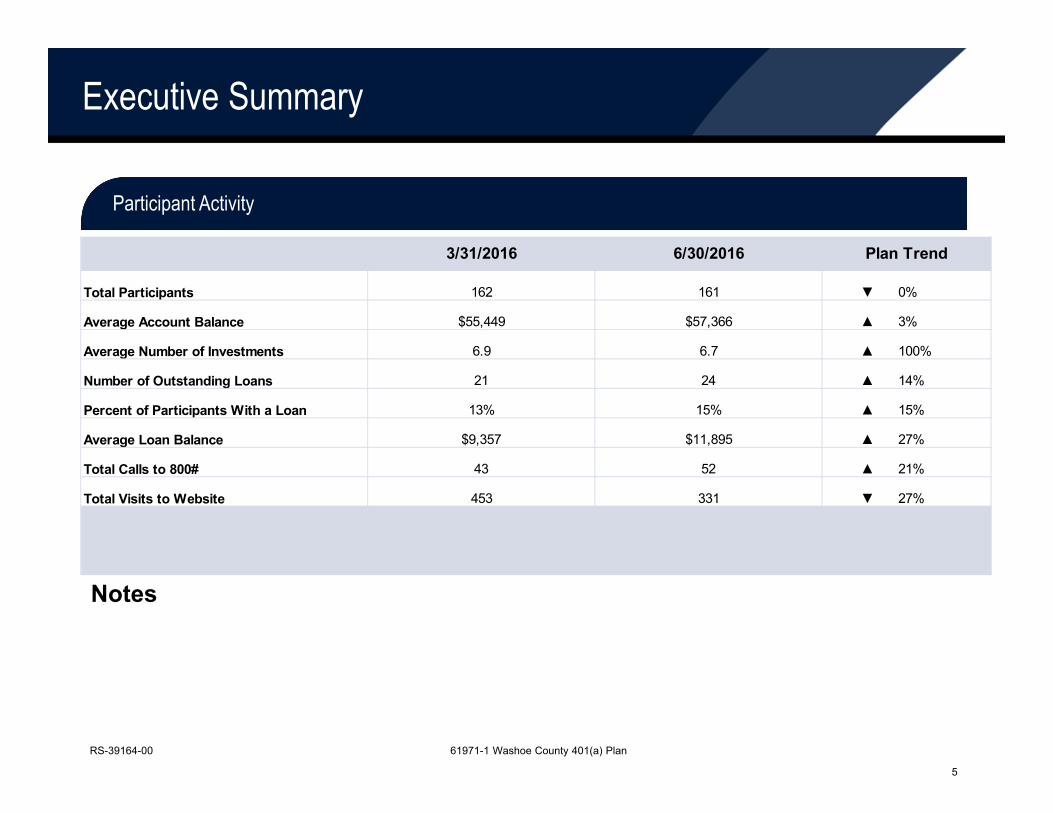
3/31/2016 6/30/2016 Plan Trend
Total Participants 162 161 ▼ 0%
Average Account Balance $55,449 $57,366 ▲ 3%
Average Number of Investments 6.9 6.7 ▲ 100%
Number of Outstanding Loans 21 24 ▲ 14%
Percent of Participants With a Loan 13% 15% ▲ 15%
Average Loan Balance $9,357 $11,895 ▲ 27%
Total Calls to 800# 43 52 ▲ 21%
Total Visits to Website 453 331 ▼ 27%
RS-39164-00
Executive Summary
Participant Activity
61971-1 Washoe County 401(a) Plan
Notes
5

Participant InformationHelping to prepare your employees for retirement
RS-08365-06
6

*Source: Hewitt Associates 2015 Universe Benchmarks Report
Number of options held by participants
Percentage of participants in one option by asset category group
Percentage of participants in one option in most utilized
asset category group by age
N/A N/A 40N/A N/A 6.7 5.3
Period Ending6/30/2014
Period Ending6/30/2015
Period Ending6/30/2016
IndustryAverage *
N/ANumber of participants in one optionAverage number of options
Participant Diversification April 01, 2016 through June 30, 2016
RS-08365-06
Stable Value Large Cap Equity
94%
6%25%
7%
6%
9%
53%
12345+
3% 9%
15%
26%
47%
Under Age 30Age 30 - 39Age 40 - 49Age 50 - 59Age 60 and over
61971-1 Washoe County 401(a) Plan
7
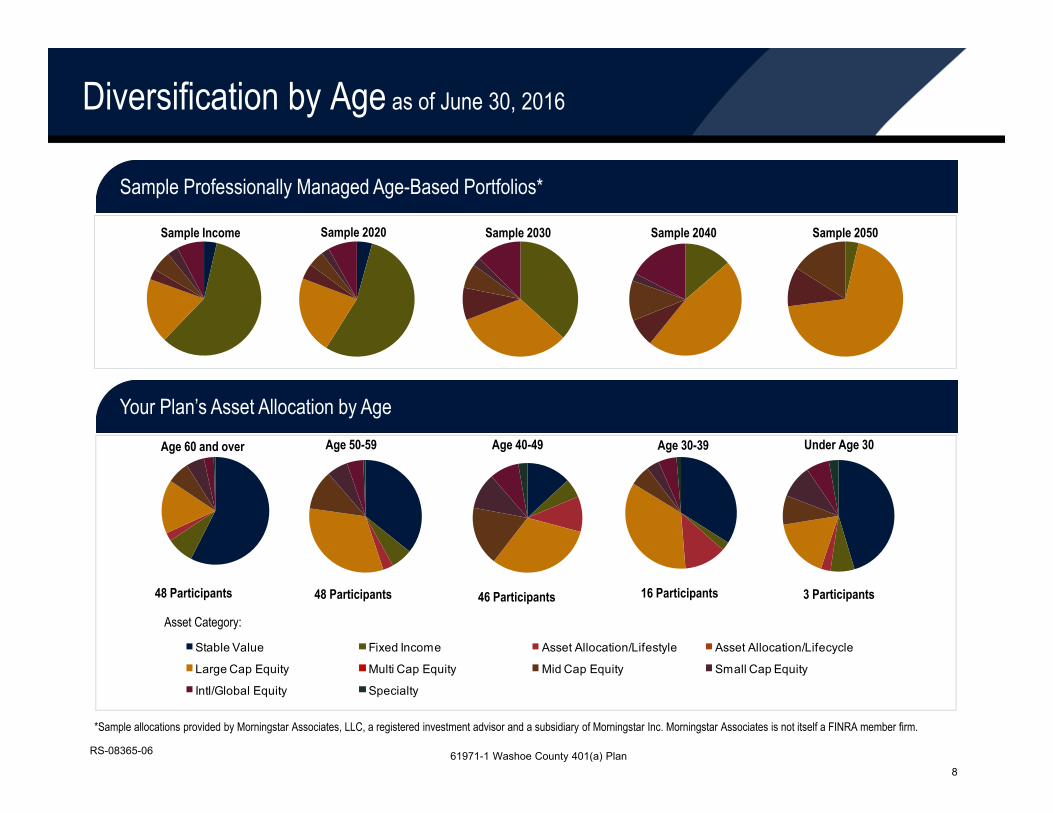
Stable Value Fixed Income Asset Allocation/Lifestyle Asset Allocation/Lifecycle
Large Cap Equity Multi Cap Equity Mid Cap Equity Small Cap Equity
Intl/Global Equity Specialty
Your Plan’s Asset Allocation by Age
Sample Income Sample 2050Sample 2040Sample 2030Sample 2020
Age 60 and over
48 Participants
Age 50-59 Age 40-49 Age 30-39 Under Age 30
48 Participants 46 Participants 16 Participants 3 Participants
Asset Category:
Diversification by Age as of June 30, 2016
Sample Professionally Managed Age-Based Portfolios*
*Sample allocations provided by Morningstar Associates, LLC, a registered investment advisor and a subsidiary of Morningstar Inc. Morningstar Associates is not itself a FINRA member firm.
61971-1 Washoe County 401(a) PlanRS-08365-06
8

401(a) Plan Balances by Investment
Asset Allocation
RS-08365-06
*Due to rounding, percentages may not total 100 percent.**The expenses shown reflect expenses deducted from plan assets. Does not include expenses billed directly to the plan sponsor or expenses related to the expense ratio of investments under the plan.
61971-1 Washoe County 401(a) Plan
Investment Options Balances as of Percentage* Balances as of 3/31/2016 6/30/2016
Guaranteed Interest OF 41564 $3,379,066 37.62% $37,351 $5,792 $104,011 ($73,711) ($374) $33,536 $3,485,671 37.74%
Hartford Total Return Bond HLS Fund $381,953 4.25% $5,007 $3,612 $8,075 ($311) $0 $10,314 $408,649 4.42%
PIMCO High Yield Fund $152,640 1.70% $2,323 $401 ($12,161) ($1,059) $0 $4,875 $147,019 1.59%
PIMCO Foreign Bond Fund $63,347 0.71% $798 $317 ($14,228) $0 $0 $1,796 $52,031 0.56%
American Funds Balanced Fund $357,156 3.98% $4,411 $430 $86 ($38) ($1) $11,551 $373,594 4.05%
Deutsche Real Assets Fund $40,913 0.46% $504 $145 ($4,212) $0 $0 $2,251 $39,601 0.43%
American Century Equity Income Fund $678,002 7.55% $6,364 $1,105 ($9,741) ($2,258) ($5) $43,267 $716,734 7.76%
Hartford Capital Apprec HLS Fd $765,757 8.52% $8,227 $2,524 ($21,763) ($2,570) ($61) $11,290 $763,403 8.27%
Vanguard Institutional Index Fund $495,246 5.51% $18,559 $2,317 ($736) ($2,471) ($7) $12,449 $525,357 5.69%
American Funds Grth Fund of America $505,166 5.62% $12,778 $2,484 ($5,478) ($1,294) ($4) $15,030 $528,682 5.72%
Hotchkis and Wiley Mid Cap Val Fd $292,867 3.26% $38,031 $976 ($4,788) ($19,899) ($64) ($9,880) $297,243 3.22%
Vanguard Mid Cap Index Fund $97,831 1.09% $5,004 $914 ($2,388) ($33) ($1) $2,364 $103,692 1.12%
Hartford MidCap HLS Fund $614,766 6.84% $4,778 $941 ($13,081) ($833) ($2) $15,064 $621,633 6.73%
AMG Managers Sky line Special Eq Fd $259,957 2.89% $2,859 $864 ($1,347) ($415) ($1) ($7,620) $254,297 2.75%
Vanguard Small Cap Index Fund $84,956 0.95% $2,964 $500 ($3,603) $0 $0 $3,373 $88,190 0.95%
Hartford Small Company HLS Fund $271,078 3.02% $2,946 $950 ($7,279) ($28) $0 $9,380 $277,047 3.00%
Amer Funds EuroPacific Grow th Fund $331,042 3.69% $37,315 $1,967 ($5,669) ($19,480) ($120) ($609) $344,446 3.73%
DFA Intl Small Cap Value Prtfl Fd $119,642 1.33% $2,278 $536 ($3,957) ($425) ($1) ($4,558) $113,515 1.23%
Plan Activity April 01, 2016 through June 30, 2016Expenses** Investment
IncomePercentage*Contributions Other Activity Transfers Distributions
9

401(a) Plan Balances by Investment
Asset Allocation
RS-08365-06
*Due to rounding, percentages may not total 100 percent.**The expenses shown reflect expenses deducted from plan assets. Does not include expenses billed directly to the plan sponsor or expenses related to the expense ratio of investments under the plan.
61971-1 Washoe County 401(a) Plan
Investment Options Balances as of Percentage* Balances as of 3/31/2016 6/30/2016
Lazard Emerging Markets Fund $91,311 1.02% $1,647 $339 ($1,743) ($824) ($2) $4,325 $95,052 1.03%
Total $8,982,696 100% $194,143 $27,117 ---- ($125,649) ($645) $158,196 $9,235,857 100%
Plan Activity April 01, 2016 through June 30, 2016Expenses** Investment
IncomePercentage*Contributions Other Activity Transfers Distributions
10

Balances by Age as of June 30, 2016
Asset Category: Total All Ages
Stable Value $2,061 $68,801 $233,933 $1,610,883 $1,569,992 $3,485,670Fixed Income $316 $5,159 $101,342 $278,774 $222,107 $607,698Asset Allocation/Lifestyle $127 $24,701 $187,232 $132,937 $68,200 $413,197Asset Allocation/Lifecycle $0 $0 $0 $0 $0 $0Large Cap Equity $785 $70,800 $561,871 $1,459,789 $440,930 $2,534,175Multi Cap Equity $0 $0 $0 $0 $0 $0Mid Cap Equity $385 $12,088 $312,700 $513,455 $183,941 $1,022,569Small Cap Equity $435 $7,474 $192,175 $270,877 $148,573 $619,534Intl/Global Equity $303 $10,736 $154,413 $212,256 $80,254 $457,962Specialty $128 $2,676 $48,699 $28,992 $14,558 $95,053
0%
10%
20%
30%
40%
50%
60%
70%
Under age 30 Age 30-39 Age 40-49 Age 50-59 Age 60 & Over
Age Under age 30 Age 30-39 Age 40-49 Age 50-59 Age 60 and Over Total
Number of Participants 3 16 46 48 48 161
Group Balance $4,541 $202,435 $1,792,364 $4,507,962 $2,728,555 $9,235,857
Average Account Balance $1,514 $12,652 $38,964 $93,916 $56,845 $57,366
61971-1 Washoe County 401(a) PlanRS-08365-06
11
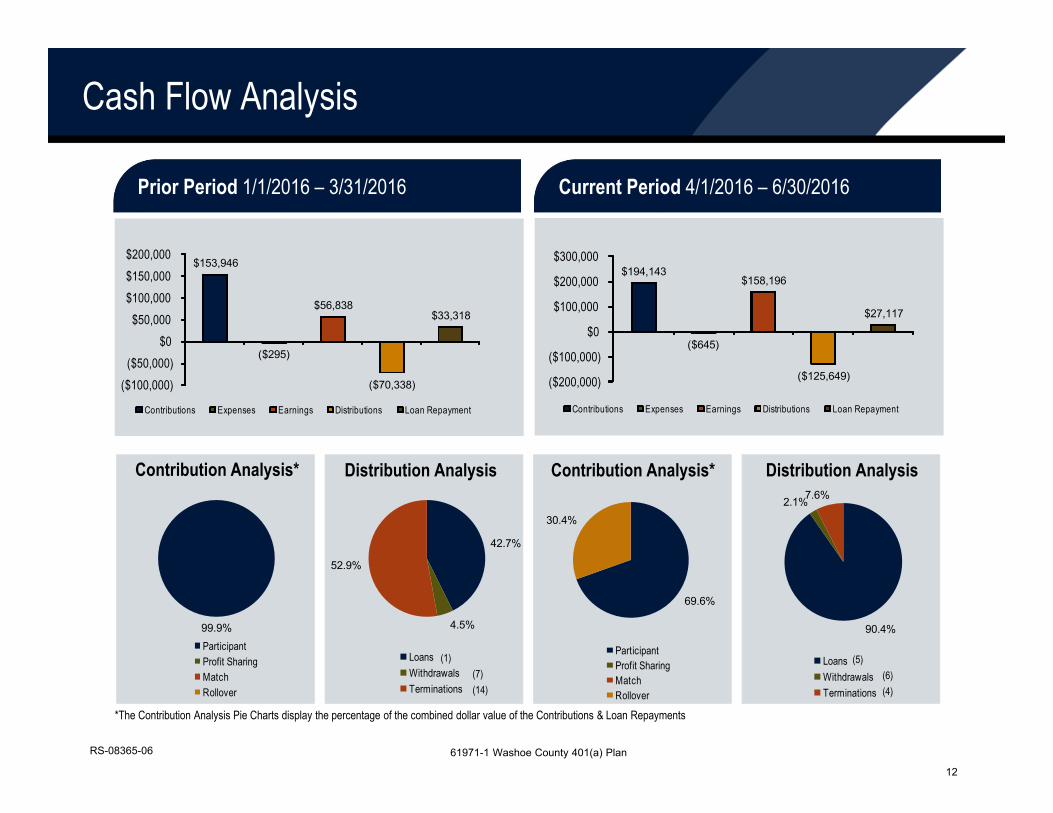
Current Period 4/1/2016 – 6/30/2016Prior Period 1/1/2016 – 3/31/2016
Cash Flow Analysis
*The Contribution Analysis Pie Charts display the percentage of the combined dollar value of the Contributions & Loan Repayments
Contribution Analysis* Distribution Analysis Contribution Analysis* Distribution Analysis
RS-08365-06
$153,946
($295)
$56,838
($70,338)
$33,318
($100,000)($50,000)
$0 $50,000
$100,000 $150,000 $200,000
Contributions Expenses Earnings Distributions Loan Repayment
$194,143
($645)
$158,196
($125,649)
$27,117
($200,000)
($100,000)
$0
$100,000
$200,000
$300,000
Contributions Expenses Earnings Distributions Loan Repayment
99.9%
ParticipantProfit SharingMatchRollover
69.6%
30.4%
ParticipantProfit SharingMatchRollover
42.7%
4.5%
52.9%
LoansWithdrawalsTerminations
90.4%
2.1%7.6%
LoansWithdrawalsTerminations
(1)(7)(14) (4)
(6)(5)
61971-1 Washoe County 401(a) Plan
12

Total Investment Balance as of June 30, 2016
Participant Demographics
*The investment selection percentages reflect participants with an active status. Due to rounding the percentages may not total 100%.Contracts with multiple plans may result in participants maintaining balances in more than one plan.
61971-1 Washoe County 401(a) Plan
Investment OptionsActive Beneficiary Retired Terminated QDRO
Participants in Option as of
Participants in Option as of
Investment Selection Percentage*
3/31/2016 6/30/2016Guaranteed Interest OF 41564 $3,188,883 $0 $296,572 $215 $0 110 114 35.3%
Hartford Total Return Bond HLS Fund $325,632 $0 $49,715 $33,302 $0 55 52 3.8%
PIMCO High Yield Fund $126,015 $0 $21,004 $0 $0 47 44 2.6%
PIMCO Foreign Bond Fund $52,031 $0 $0 $0 $0 23 20 0.7%
American Funds Balanced Fund $372,826 $0 $0 $769 $0 28 28 6.5%
Deutsche Real Assets Fund $39,601 $0 $0 $0 $0 17 16 0.7%
American Century Equity Income Fund $659,161 $0 $921 $56,652 $0 72 68 4.6%
Hartford Capital Apprec HLS Fd $707,827 $0 $1,407 $54,169 $0 82 76 6.9%
Vanguard Institutional Index Fund $506,659 $0 $12,849 $5,849 $0 55 55 8.0%
American Funds Grth Fund of America $506,332 $0 $21,840 $509 $0 80 78 6.4%
Hotchkis and Wiley Mid Cap Val Fd $275,587 $0 $3,543 $18,112 $0 66 63 3.8%
Vanguard Mid Cap Index Fund $102,969 $0 $0 $723 $0 36 35 1.6%
Hartford MidCap HLS Fund $592,378 $0 $5,838 $23,417 $0 95 91 5.6%
AMG Managers Skyline Special Eq Fd $201,192 $0 $13,781 $39,324 $0 74 71 3.1%
Vanguard Small Cap Index Fund $87,375 $0 $0 $815 $0 42 40 1.2%
Total Participants 161: 147 Active, 0 Beneficiary, 9 Retired, 5 Terminated, 0 QDRO
PARTICIPANTS
RS-08365-06
13

Total Investment Balance as of June 30, 2016
Participant Demographics
*The investment selection percentages reflect participants with an active status. Due to rounding the percentages may not total 100%.Contracts with multiple plans may result in participants maintaining balances in more than one plan.
61971-1 Washoe County 401(a) Plan
Investment OptionsActive Beneficiary Retired Terminated QDRO
Participants in Option as of
Participants in Option as of
Investment Selection Percentage*
3/31/2016 6/30/2016Hartford Small Company HLS Fund $276,282 $0 $519 $246 $0 70 64 2.3%
Amer Funds EuroPacif ic Grow th Fund $307,846 $0 $31,840 $4,760 $0 66 63 3.7%
DFA Intl Small Cap Value Prtfl Fd $113,049 $0 $0 $466 $0 43 40 1.8%
Lazard Emerging Markets Fund $94,694 $0 $0 $358 $0 38 37 1.4%
Total $8,536,340 $0 $459,831 $239,686 $0 ----- ----- 100%
0 0
0 0
0 0
0 0
0 0
0 0
0 0
0 0
0 0
0 0
Total Participants 161: 147 Active, 0 Beneficiary, 9 Retired, 5 Terminated, 0 QDRO
PARTICIPANTS
RS-08365-06
14

RS-08369-07
Service OverviewMaking it easier to administer your plan
15
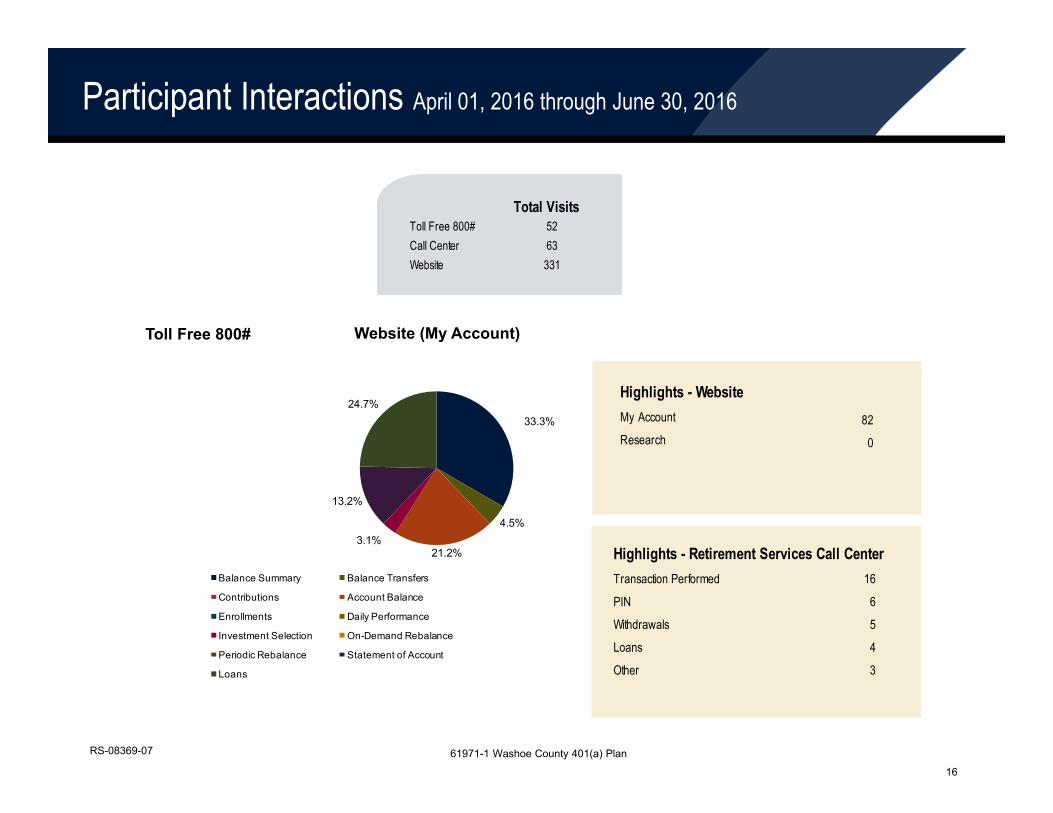
Participant Interactions April 01, 2016 through June 30, 2016
Website (My Account)Toll Free 800#
RS-08369-07
33.3%
4.5%
21.2%3.1%
13.2%
24.7%
Total VisitsToll Free 800# 52Call Center 63Website 331
Highlights - Retirement Services Call CenterTransaction Performed 16
PIN 6
Withdrawals 5
Loans 4
Other 3
Highlights - WebsiteMy Account 82Research 0
61971-1 Washoe County 401(a) Plan
Balance Summary Balance Transfers
Contributions Account Balance
Enrollments Daily Performance
Investment Selection On-Demand Rebalance
Periodic Rebalance Statement of Account
Loans
16
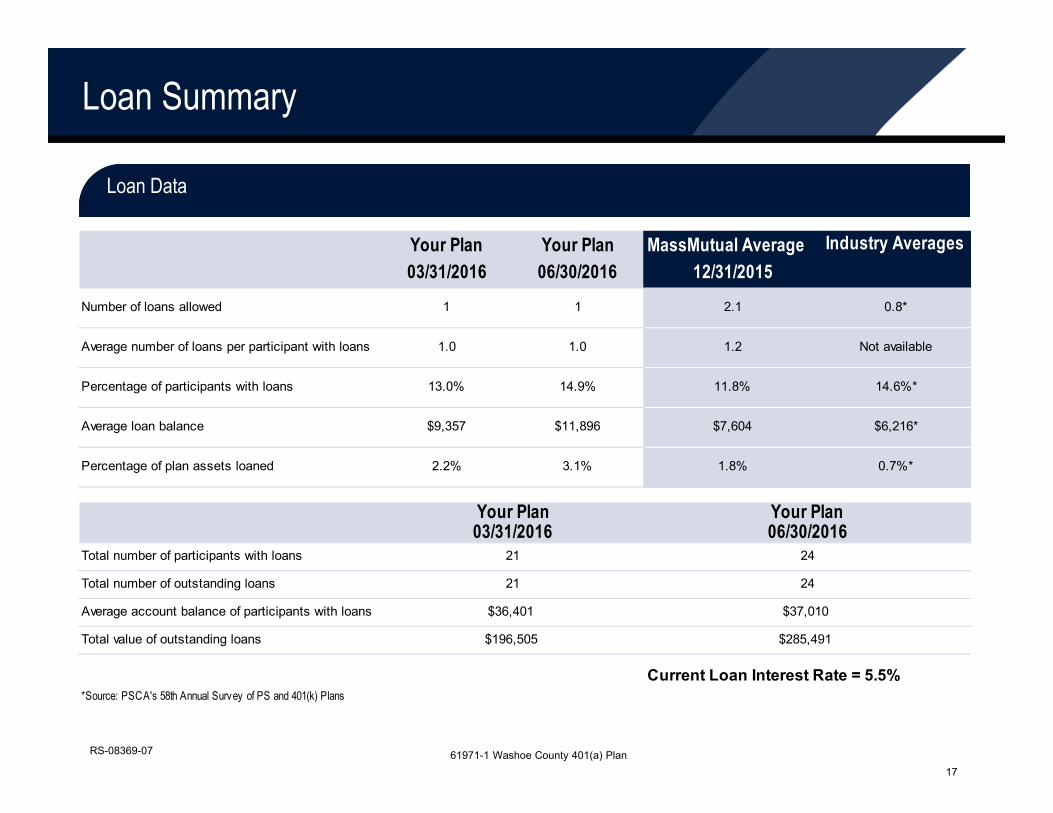
Loan Summary
Loan Data
RS-08369-07 61971-1 Washoe County 401(a) Plan
Your Plan Your Plan MassMutual Average Industry Averages03/31/2016 06/30/2016 12/31/2015
Number of loans allowed 1 1 2.1 0.8*
Average number of loans per participant with loans 1.0 1.0 1.2 Not available
Percentage of participants with loans 13.0% 14.9% 11.8% 14.6%*
Average loan balance $9,357 $11,896 $7,604 $6,216*
Percentage of plan assets loaned 2.2% 3.1% 1.8% 0.7%*
Total number of participants with loans
Total number of outstanding loans
Average account balance of participants with loans
Total value of outstanding loans
Your Plan
24
$37,010
21 24
Your Plan
21
03/31/2016 06/30/2016
Current Loan Interest Rate = 5.5%
$36,401
*Source: PSCA's 58th Annual Survey of PS and 401(k) Plans
$196,505 $285,491
17

18
©2015 Massachusetts Mutual Life Insurance Company, Springfield, MA. All rights reserved. www.massmutual.com. MassMutual Financial Group is a marketing name for Massachusetts Mutual Life Insurance Company (MassMutual) and its affiliated companies and sales representatives.
RS-08374-12
18

Washoe CountyCurrent Period: April 1 – June 30, 2016Prior Period: January 1 – March 31, 2016
August 10, 2016
Strategic Plan Review and Action Plan
RS-08349-12

The company behind your plan
Financial Strength*
Focused on using our resources to address our customer needs
160+ Years Ranked No.94 on Fortune 500 List** $639 Billion in assets
under management as of 12/31/2013***
Diversified business model
Mutual structure: focused on participating policyholders, not Wall Street
Focused, strong and diverse
Among the highest financial strength ratings of any company1
A.M. Best A++
Fitch Ratings AA+
Moody’s Investors Service Aa2
Standard & Poor’s AA+
History of innovative firsts
Plan lineup makes…
…plan-specific investments
2008: First to offer unitized custom models
2005: First to engage employees using e4SM device
2015: First to offer fully integrated worksite benefits
2009: First to offerpersona‐based, big data employee engagement
Validation, recognition and experience
5
ContactCenterWorld top- performing call center 8 years in a row(2008–2015)
RS-08349-13
1 Ratings are for Massachusetts Mutual Life Insurance Company and do not apply to any separate investment accounts or mutual funds offered by MassMutual or its affiliates. Ratings are as of January 1, 2016, and are subject to change.2 As of December 31, 2015.3 As of September 30, 2015.
4 Per an independent study conducted by Chatham Partners. September 2015.5 Fortune Magazine, June, 2016.6 Ethisphere Institute, an independent center of research promoting best practices in corporate ethics and governance, March 2016.
67 years servicing retirement plans2
34,000 plans3
2.8 million participants3
94% plan sponsor retention2
80% very satisfied clients4
22 PSCA Signature Awards (2013- 2015) forEducational Excellence
25 best-in-class honors in 2015
2

Executive Summary
RS-39164-00
3

Plan Statistics
RS-39164-00
Executive Summary
*The expenses shown reflect expenses deducted from plan assets. Expenses billed directly to the plan sponsor or expenses related to the expense ratio of investments under the plan are not reflected. The Contribution data displays the combined dollar value of Contributions & Loan Repayments, if applicable.
61971-2 Washoe County Deferred Compensation Plan
Notes
3/31/2016 6/30/2016 Plan Trend
Total Plan Assets $131,560,339 $133,592,234 ▲ 2%
Total Outstanding Loan Balances $2,559,970 $2,623,640 ▲ 2%
Participant Contributions
Participant $2,751,014 $2,135,254 ▼ 22%
Rollover $345,680 $144,491 ▼ 58%
Transferred Assets $0 $3,799 ▲ 100%
Distributions
Withdrawals ($1,119,207) ($1,264,526) ▲ 13%
Terminations ($2,187,967) ($745,280) ▼ 66%
Loans ($293,884) ($337,085) ▲ 15%
Expenses* ($3,345) ($3,985) ▲ 19%
Investment Income $505,238 $2,095,833 ▲ 315%
Notes
4

3/31/2016 6/30/2016 Plan Trend
Total Participants 2,118 2,122 ▲ 0%
Average Account Balance $62,115 $62,956 ▲ 1%
Average Number of Investments 6.7 6.6 ▲ 100%
Number of Outstanding Loans 275 282 ▲ 3%
Percent of Participants With a Loan 13% 13% ◄ ► 0%
Average Loan Balance $9,309 $9,304 ▼ 0%
Total Calls to 800# 473 341 ▼ 28%
Total Visits to Website 4,915 4,147 ▼ 16%
RS-39164-00
Executive Summary
Participant Activity
61971-2 Washoe County Deferred Compensation Plan
Notes
5

Participant InformationHelping to prepare your employees for retirement
RS-08365-06
6

*Source: Hewitt Associates 2015 Universe Benchmarks Report
Number of options held by participants
Percentage of participants in one option by asset category group
Percentage of participants in one option in most utilized
asset category group by age
N/A N/A 565N/A N/A 6.6 5.3
Period Ending6/30/2014
Period Ending6/30/2015
Period Ending6/30/2016
IndustryAverage *
N/ANumber of participants in one optionAverage number of options
Participant Diversification April 01, 2016 through June 30, 2016
RS-08365-06
Stable Value Fix ed IncomeLarge Cap Equity Mid Cap EquitySmall Cap Equity Intl/Global Equity
92%
7%
27%
8%
6%7%
53%
12345+
3% 8%
15%
24%
50%
Under Age 30Age 30 - 39Age 40 - 49Age 50 - 59Age 60 and over
61971-2 Washoe County Deferred Compensation Plan
7
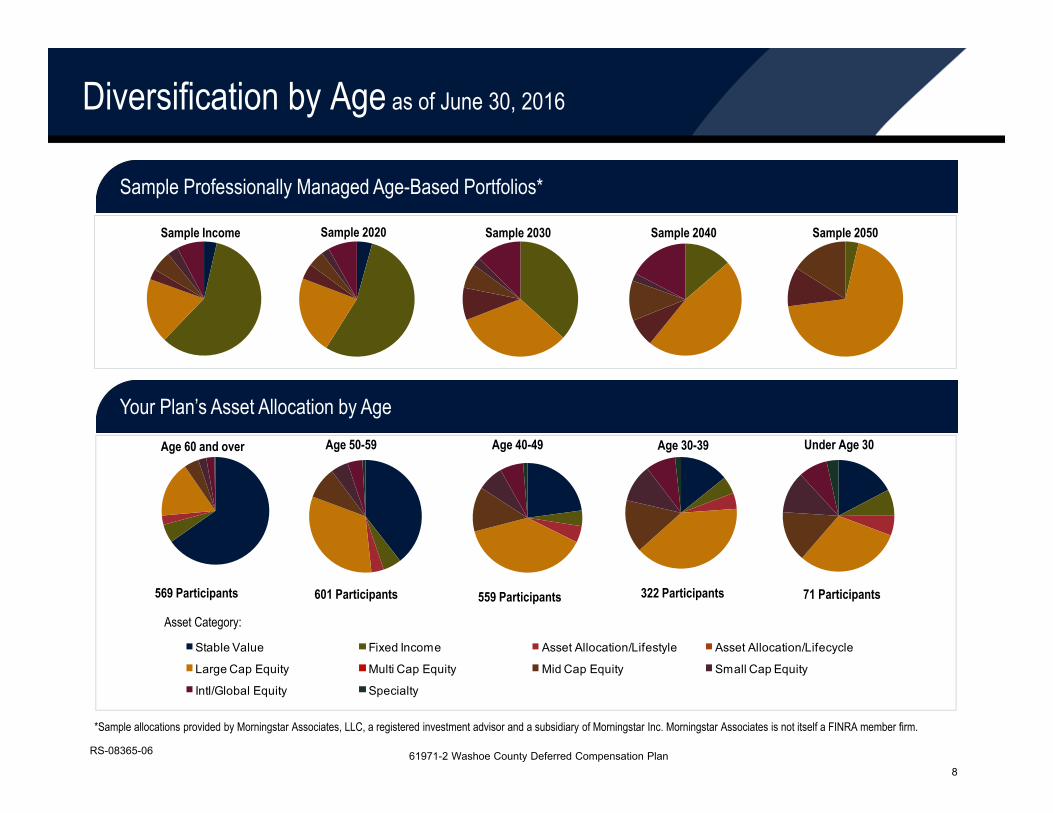
Stable Value Fixed Income Asset Allocation/Lifestyle Asset Allocation/Lifecycle
Large Cap Equity Multi Cap Equity Mid Cap Equity Small Cap Equity
Intl/Global Equity Specialty
Your Plan’s Asset Allocation by Age
Sample Income Sample 2050Sample 2040Sample 2030Sample 2020
Age 60 and over
569 Participants
Age 50-59 Age 40-49 Age 30-39 Under Age 30
601 Participants 559 Participants 322 Participants 71 Participants
Asset Category:
Diversification by Age as of June 30, 2016
Sample Professionally Managed Age-Based Portfolios*
*Sample allocations provided by Morningstar Associates, LLC, a registered investment advisor and a subsidiary of Morningstar Inc. Morningstar Associates is not itself a FINRA member firm.
61971-2 Washoe County Deferred Compensation PlanRS-08365-06
8

457 Plan Balances by Investment
Asset Allocation
RS-08365-06
*Due to rounding, percentages may not total 100 percent.**The expenses shown reflect expenses deducted from plan assets. Does not include expenses billed directly to the plan sponsor or expenses related to the expense ratio of investments under the plan.
61971-2 Washoe County Deferred Compensation Plan
Investment Options Balances as of Percentage* Balances as of 3/31/2016 6/30/2016
Guaranteed Interest OF 41564 $60,382,437 45.90% $750,706 $83,338 $1,598,729 ($892,793) ($1,181) $598,780 $62,520,016 46.80%
Hartford Total Return Bond HLS Fund $4,323,598 3.29% $59,138 $6,200 ($207,971) ($96,269) ($70) $111,463 $4,196,089 3.14%
PIMCO High Yield Fund $2,098,259 1.59% $32,114 $3,351 ($102,912) ($54,509) ($46) $66,251 $2,042,508 1.53%
PIMCO Foreign Bond Fund $866,193 0.66% $19,980 $1,246 ($66,477) ($11,247) ($34) $26,848 $836,510 0.63%
American Funds Balanced Fund $3,920,149 2.98% $64,040 $13,335 $133,917 ($73,450) ($142) $128,313 $4,186,162 3.13%
Deutsche Real Assets Fund $519,202 0.39% $13,240 $1,110 ($67,173) ($12,302) ($25) $27,155 $481,207 0.36%
American Century Equity Income Fund $6,138,756 4.67% $101,665 $19,374 $139,126 ($131,875) ($340) $397,706 $6,664,412 4.99%
Hartford Capital Apprec HLS Fd $12,448,551 9.46% $142,248 $38,051 ($558,834) ($242,234) ($496) $189,062 $12,016,348 8.99%
Vanguard Institutional Index Fund $6,056,291 4.60% $130,724 $24,013 $397,955 ($159,801) ($263) $156,806 $6,605,724 4.94%
American Funds Grth Fund of America $10,548,630 8.02% $176,794 $32,481 ($236,958) ($194,086) ($285) $308,655 $10,635,231 7.96%
Hotchkis and Wiley Mid Cap Val Fd $3,447,333 2.62% $58,716 $11,964 ($88,762) ($73,736) ($117) ($122,906) $3,232,491 2.42%
Vanguard Mid Cap Index Fund $1,214,290 0.92% $45,012 $5,471 ($88,175) ($43,254) ($87) $27,937 $1,161,195 0.87%
Hartford MidCap HLS Fund $6,447,091 4.90% $116,125 $21,353 ($284,311) ($94,259) ($280) $159,057 $6,364,776 4.76%
AMG Managers Sky line Special Eq Fd $2,901,556 2.21% $42,777 $9,805 ($37,795) ($82,632) ($199) ($84,032) $2,749,480 2.06%
Vanguard Small Cap Index Fund $1,046,959 0.80% $33,435 $2,984 ($29,773) ($24,258) ($37) $41,351 $1,070,661 0.80%
Hartford Small Company HLS Fund $2,424,559 1.84% $57,472 $9,518 ($216,827) ($22,499) ($106) $80,334 $2,332,450 1.75%
Amer Funds EuroPacific Grow th Fund $4,366,920 3.32% $72,863 $18,095 ($172,532) ($70,586) ($179) ($10,372) $4,204,210 3.15%
DFA Intl Small Cap Value Prtfl Fd $1,454,430 1.11% $32,544 $4,380 ($90,422) ($52,761) ($63) ($51,740) $1,296,368 0.97%
Plan Activity April 01, 2016 through June 30, 2016Expenses** Investment
IncomePercentage*Contributions Other Activity Transfers Distributions
9

457 Plan Balances by Investment
Asset Allocation
RS-08365-06
*Due to rounding, percentages may not total 100 percent.**The expenses shown reflect expenses deducted from plan assets. Does not include expenses billed directly to the plan sponsor or expenses related to the expense ratio of investments under the plan.
61971-2 Washoe County Deferred Compensation Plan
Investment Options Balances as of Percentage* Balances as of 3/31/2016 6/30/2016
Lazard Emerging Markets Fund $955,135 0.73% $28,489 $2,786 ($20,802) ($14,341) ($34) $45,163 $996,396 0.75%
Total $131,560,339 100% $1,978,084 $308,854 ---- ($2,346,891) ($3,985) $2,095,833 $133,592,234 100%
Plan Activity April 01, 2016 through June 30, 2016Expenses** Investment
IncomePercentage*Contributions Other Activity Transfers Distributions
10

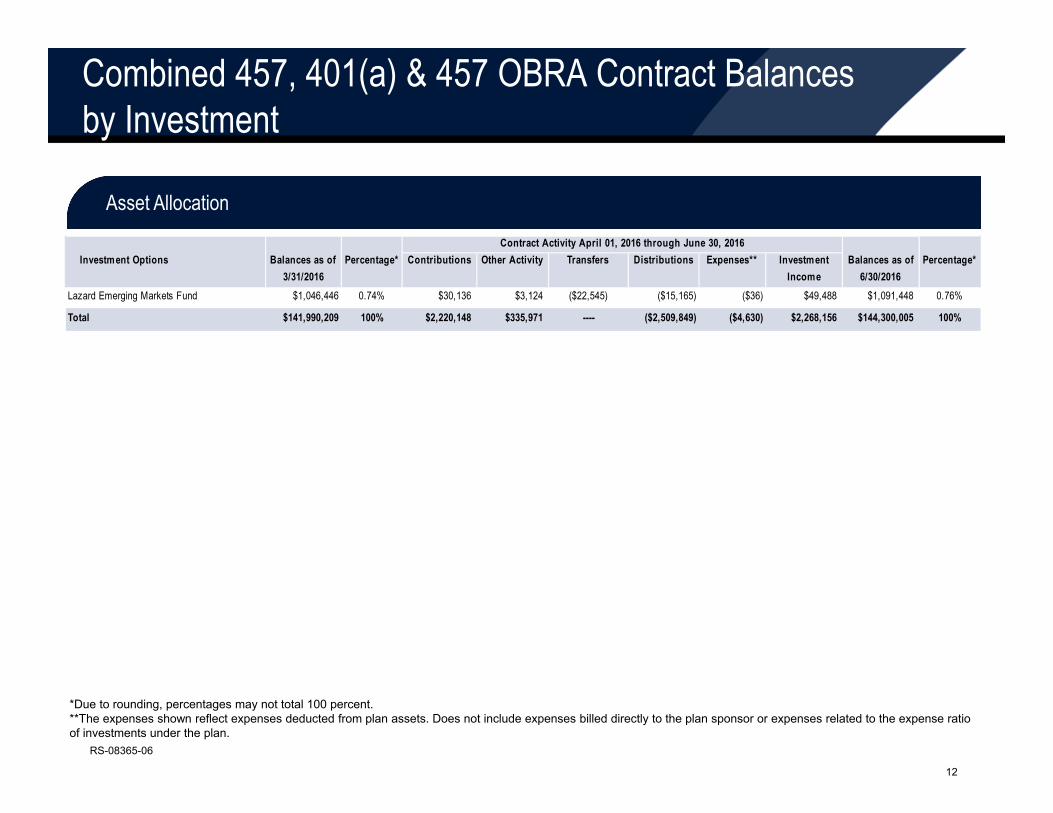
Combined 457, 401(a) & 457 OBRA Contract Balances by Investment
Asset Allocation
RS-08365-06
*Due to rounding, percentages may not total 100 percent.**The expenses shown reflect expenses deducted from plan assets. Does not include expenses billed directly to the plan sponsor or expenses related to the expense ratio of investments under the plan.
Investment Options Balances as of Percentage* Balances as of 3/31/2016 6/30/2016
Guaranteed Interest OF 41564 $65,208,677 45.92% $835,978 $89,130 $1,702,740 ($1,003,813) ($1,556) $646,445 $67,477,601 46.76%
Hartford Total Return Bond HLS Fund $4,705,551 3.31% $64,145 $9,812 ($199,896) ($96,580) ($70) $121,777 $4,604,738 3.19%
PIMCO High Yield Fund $2,250,899 1.59% $34,437 $3,753 ($115,073) ($55,568) ($46) $71,126 $2,189,528 1.52%
PIMCO Foreign Bond Fund $929,540 0.65% $20,779 $1,564 ($80,704) ($11,247) ($34) $28,644 $888,541 0.62%
American Funds Balanced Fund $4,277,305 3.01% $68,451 $13,765 $134,003 ($73,488) ($143) $139,863 $4,559,756 3.16%
Deutsche Real Assets Fund $560,115 0.39% $13,744 $1,255 ($71,385) ($12,302) ($25) $29,407 $520,808 0.36%
American Century Equity Income Fund $6,816,758 4.80% $108,029 $20,479 $129,385 ($134,132) ($346) $440,973 $7,381,146 5.12%
Hartford Capital Apprec HLS Fd $13,214,308 9.31% $150,474 $40,576 ($580,597) ($244,804) ($557) $200,351 $12,779,751 8.86%
Vanguard Institutional Index Fund $6,551,538 4.61% $149,282 $26,330 $397,219 ($162,272) ($270) $169,254 $7,131,081 4.94%
American Funds Grth Fund of America $11,053,796 7.78% $189,573 $34,965 ($242,436) ($195,380) ($289) $323,685 $11,163,913 7.74%
Hotchkis and Wiley Mid Cap Val Fd $3,740,200 2.63% $96,747 $12,939 ($93,550) ($93,635) ($182) ($132,786) $3,529,733 2.45%
Vanguard Mid Cap Index Fund $1,312,121 0.92% $50,017 $6,385 ($90,563) ($43,286) ($87) $30,301 $1,264,887 0.88%
Hartford MidCap HLS Fund $7,061,857 4.97% $120,903 $22,294 ($297,392) ($95,092) ($282) $174,122 $6,986,409 4.84%
AMG Managers Sky line Special Eq Fd $3,161,513 2.23% $45,636 $10,670 ($39,142) ($83,047) ($200) ($91,652) $3,003,777 2.08%
Vanguard Small Cap Index Fund $1,131,915 0.80% $36,400 $3,484 ($33,376) ($24,258) ($37) $44,724 $1,158,851 0.80%
Hartford Small Company HLS Fund $2,695,637 1.90% $60,418 $10,468 ($224,106) ($22,526) ($106) $89,714 $2,609,497 1.81%
Amer Funds EuroPacific Grow th Fund $4,697,962 3.31% $110,178 $20,062 ($178,201) ($90,066) ($299) ($10,981) $4,548,656 3.15%
DFA Intl Small Cap Value Prtfl Fd $1,574,071 1.11% $34,822 $4,916 ($94,379) ($53,185) ($64) ($56,298) $1,409,883 0.98%
Contract Activity April 01, 2016 through June 30, 2016Expenses** Investment
IncomePercentage*Contributions Other Activity Transfers Distributions
11
Combined 457, 401(a) & 457 OBRA Contract Balances by Investment
Asset Allocation
RS-08365-06
*Due to rounding, percentages may not total 100 percent.**The expenses shown reflect expenses deducted from plan assets. Does not include expenses billed directly to the plan sponsor or expenses related to the expense ratio of investments under the plan.
Investment Options Balances as of Percentage* Balances as of 3/31/2016 6/30/2016
Lazard Emerging Markets Fund $1,046,446 0.74% $30,136 $3,124 ($22,545) ($15,165) ($36) $49,488 $1,091,448 0.76%
Total $141,990,209 100% $2,220,148 $335,971 ---- ($2,509,849) ($4,630) $2,268,156 $144,300,005 100%
Contract Activity April 01, 2016 through June 30, 2016Expenses** Investment
IncomePercentage*Contributions Other Activity Transfers Distributions
12

Balances by Age as of June 30, 2016
Asset Category: Total All Ages
Stable Value $59,968 $814,590 $5,265,747 $18,002,729 $38,376,981 $62,520,015Fixed Income $26,453 $289,382 $1,062,770 $2,412,783 $3,283,719 $7,075,107Asset Allocation/Lifestyle $19,913 $264,499 $1,125,224 $1,624,180 $1,633,552 $4,667,368Asset Allocation/Lifecycle $0 $0 $0 $0 $0 $0Large Cap Equity $105,987 $2,265,993 $8,914,757 $14,765,777 $9,869,201 $35,921,715Multi Cap Equity $0 $0 $0 $0 $0 $0Mid Cap Equity $50,840 $876,915 $3,041,550 $4,175,763 $2,613,393 $10,758,461Small Cap Equity $41,814 $632,072 $1,765,183 $2,284,706 $1,428,816 $6,152,591Intl/Global Equity $28,950 $495,026 $1,590,733 $1,951,465 $1,434,403 $5,500,577Specialty $12,034 $98,745 $300,828 $406,596 $178,192 $996,395
0%
10%
20%
30%
40%
50%
60%
70%
Under age 30 Age 30-39 Age 40-49 Age 50-59 Age 60 & Over
Age Under age 30 Age 30-39 Age 40-49 Age 50-59 Age 60 and Over Total
Number of Participants 71 322 559 601 569 2,122
Group Balance $345,959 $5,737,223 $23,066,794 $45,623,999 $58,818,258 $133,592,233
Average Account Balance $4,873 $17,817 $41,264 $75,913 $103,371 $62,956
61971-2 Washoe County Deferred Compensation PlanRS-08365-06
13
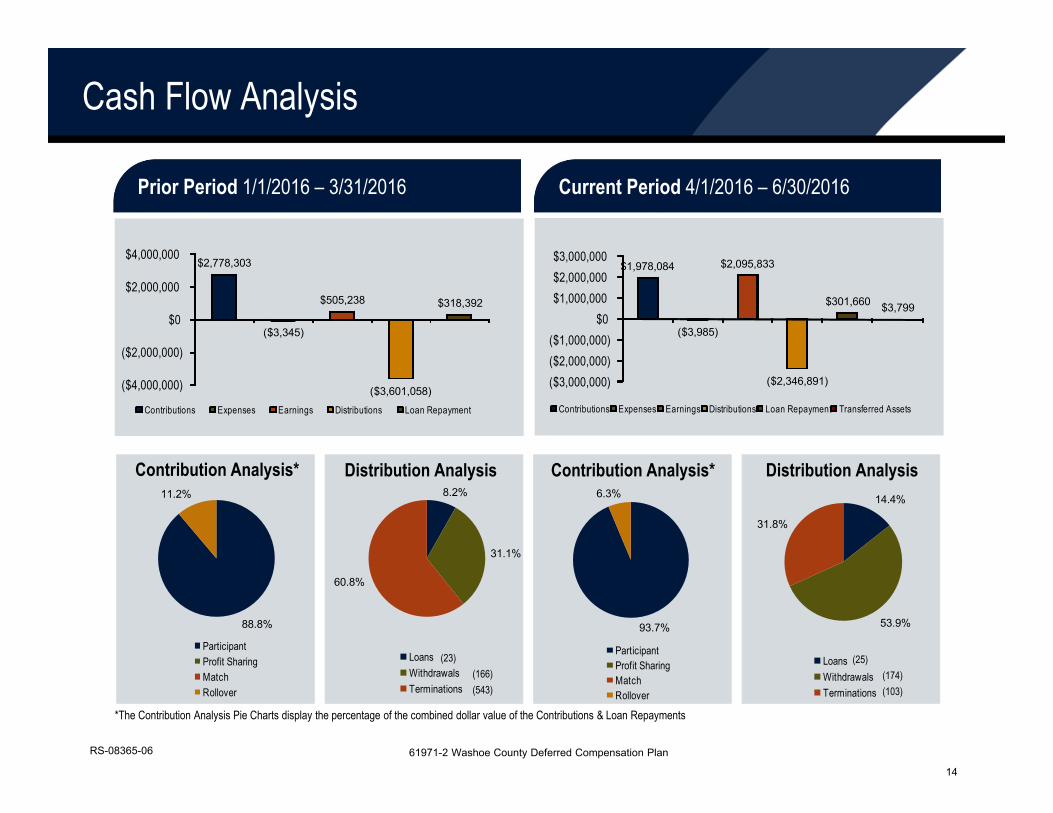
Current Period 4/1/2016 – 6/30/2016Prior Period 1/1/2016 – 3/31/2016
Cash Flow Analysis
*The Contribution Analysis Pie Charts display the percentage of the combined dollar value of the Contributions & Loan Repayments
Contribution Analysis* Distribution Analysis Contribution Analysis* Distribution Analysis
RS-08365-06
$2,778,303
($3,345)
$505,238
($3,601,058)
$318,392
($4,000,000)
($2,000,000)
$0
$2,000,000
$4,000,000
Contributions Expenses Earnings Distributions Loan Repayment
$1,978,084
($3,985)
$2,095,833
($2,346,891)
$301,660 $3,799
($3,000,000)($2,000,000)($1,000,000)
$0 $1,000,000 $2,000,000 $3,000,000
Contributions Expenses Earnings Distributions Loan Repayment Transferred Assets
88.8%
11.2%
ParticipantProfit SharingMatchRollover
93.7%
6.3%
ParticipantProfit SharingMatchRollover
8.2%
31.1%
60.8%
LoansWithdrawalsTerminations
14.4%
53.9%
31.8%
LoansWithdrawalsTerminations
(23)(166)(543) (103)
(174)(25)
61971-2 Washoe County Deferred Compensation Plan
14
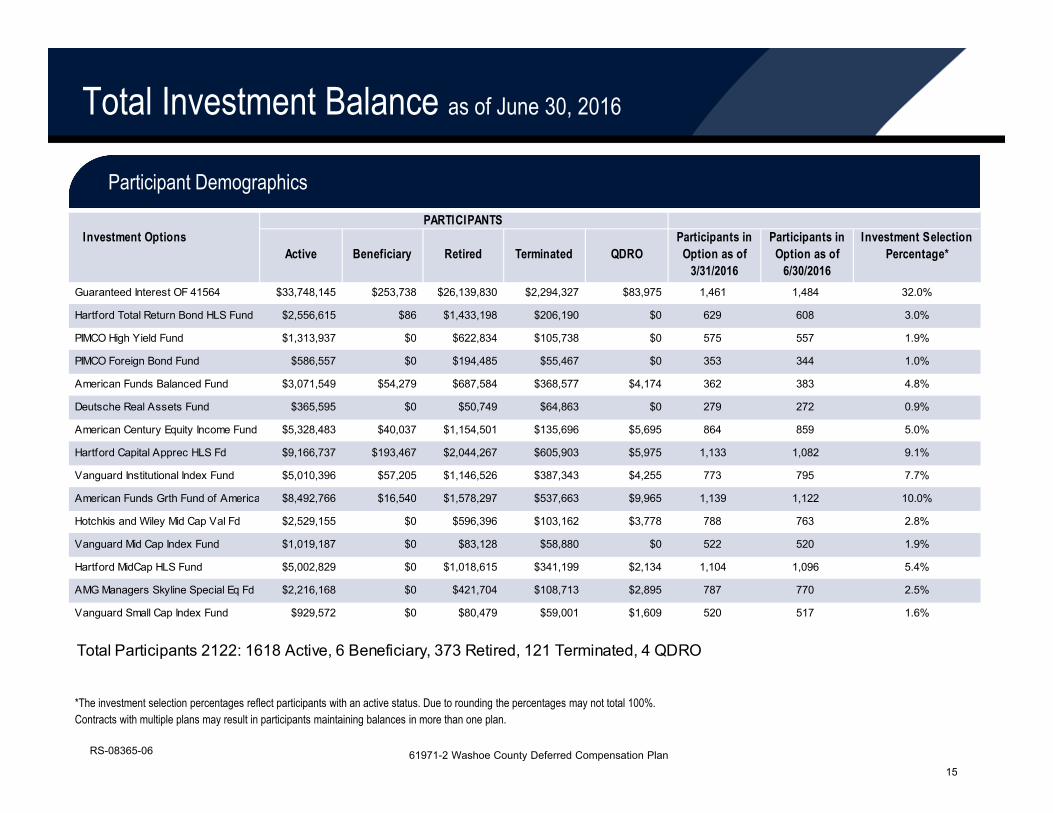
Total Investment Balance as of June 30, 2016
Participant Demographics
*The investment selection percentages reflect participants with an active status. Due to rounding the percentages may not total 100%.Contracts with multiple plans may result in participants maintaining balances in more than one plan.
61971-2 Washoe County Deferred Compensation Plan
Investment OptionsActive Beneficiary Retired Terminated QDRO
Participants in Option as of
Participants in Option as of
Investment Selection Percentage*
3/31/2016 6/30/2016Guaranteed Interest OF 41564 $33,748,145 $253,738 $26,139,830 $2,294,327 $83,975 1,461 1,484 32.0%
Hartford Total Return Bond HLS Fund $2,556,615 $86 $1,433,198 $206,190 $0 629 608 3.0%
PIMCO High Yield Fund $1,313,937 $0 $622,834 $105,738 $0 575 557 1.9%
PIMCO Foreign Bond Fund $586,557 $0 $194,485 $55,467 $0 353 344 1.0%
American Funds Balanced Fund $3,071,549 $54,279 $687,584 $368,577 $4,174 362 383 4.8%
Deutsche Real Assets Fund $365,595 $0 $50,749 $64,863 $0 279 272 0.9%
American Century Equity Income Fund $5,328,483 $40,037 $1,154,501 $135,696 $5,695 864 859 5.0%
Hartford Capital Apprec HLS Fd $9,166,737 $193,467 $2,044,267 $605,903 $5,975 1,133 1,082 9.1%
Vanguard Institutional Index Fund $5,010,396 $57,205 $1,146,526 $387,343 $4,255 773 795 7.7%
American Funds Grth Fund of America $8,492,766 $16,540 $1,578,297 $537,663 $9,965 1,139 1,122 10.0%
Hotchkis and Wiley Mid Cap Val Fd $2,529,155 $0 $596,396 $103,162 $3,778 788 763 2.8%
Vanguard Mid Cap Index Fund $1,019,187 $0 $83,128 $58,880 $0 522 520 1.9%
Hartford MidCap HLS Fund $5,002,829 $0 $1,018,615 $341,199 $2,134 1,104 1,096 5.4%
AMG Managers Skyline Special Eq Fd $2,216,168 $0 $421,704 $108,713 $2,895 787 770 2.5%
Vanguard Small Cap Index Fund $929,572 $0 $80,479 $59,001 $1,609 520 517 1.6%
Total Participants 2122: 1618 Active, 6 Beneficiary, 373 Retired, 121 Terminated, 4 QDRO
PARTICIPANTS
RS-08365-06
15

Total Investment Balance as of June 30, 2016
Participant Demographics
*The investment selection percentages reflect participants with an active status. Due to rounding the percentages may not total 100%.Contracts with multiple plans may result in participants maintaining balances in more than one plan.
61971-2 Washoe County Deferred Compensation Plan
Investment OptionsActive Beneficiary Retired Terminated QDRO
Participants in Option as of
Participants in Option as of
Investment Selection Percentage*
3/31/2016 6/30/2016Hartford Small Company HLS Fund $1,917,015 $0 $281,599 $132,077 $1,760 837 796 2.6%
Amer Funds EuroPacif ic Grow th Fund $3,116,268 $15,485 $828,050 $242,086 $2,321 893 865 4.6%
DFA Intl Small Cap Value Prtfl Fd $1,055,025 $0 $179,837 $58,712 $2,793 559 539 1.6%
Lazard Emerging Markets Fund $793,002 $0 $146,743 $53,959 $2,692 488 483 1.4%
Total $88,219,001 $630,836 $38,688,821 $5,919,555 $134,021 ----- ----- 100%
0 0
0 0
0 0
0 0
0 0
0 0
0 0
0 0
0 0
0 0
Total Participants 2122: 1618 Active, 6 Beneficiary, 373 Retired, 121 Terminated, 4 QDRO
PARTICIPANTS
RS-08365-06
16

RS-08369-07
Service OverviewMaking it easier to administer your plan
17
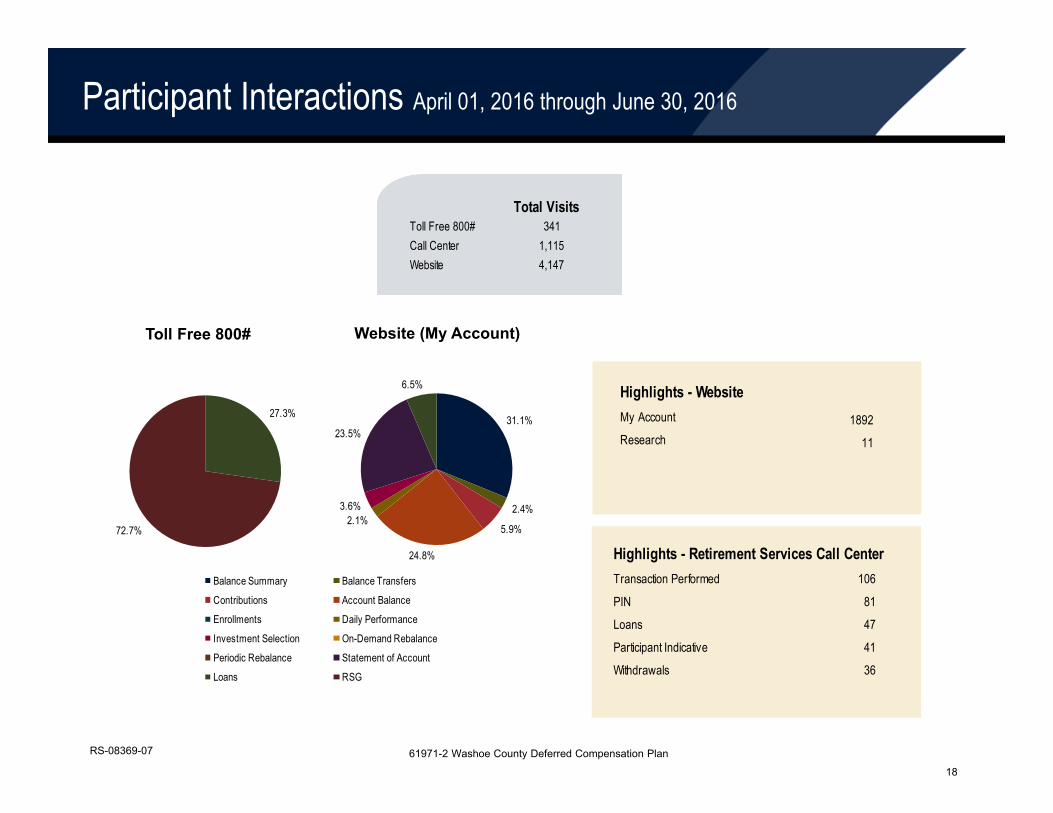
Participant Interactions April 01, 2016 through June 30, 2016
Website (My Account)Toll Free 800#
RS-08369-07
27.3%
72.7%
31.1%
2.4%
5.9%
24.8%
2.1%3.6%
23.5%
6.5%
Total VisitsToll Free 800# 341Call Center 1,115Website 4,147
Highlights - Retirement Services Call CenterTransaction Performed 106
PIN 81
Loans 47
Participant Indicative 41
Withdrawals 36
Highlights - WebsiteMy Account 1892Research 11
61971-2 Washoe County Deferred Compensation Plan
Balance Summary Balance Transfers
Contributions Account Balance
Enrollments Daily Performance
Investment Selection On-Demand Rebalance
Periodic Rebalance Statement of Account
Loans RSG
18
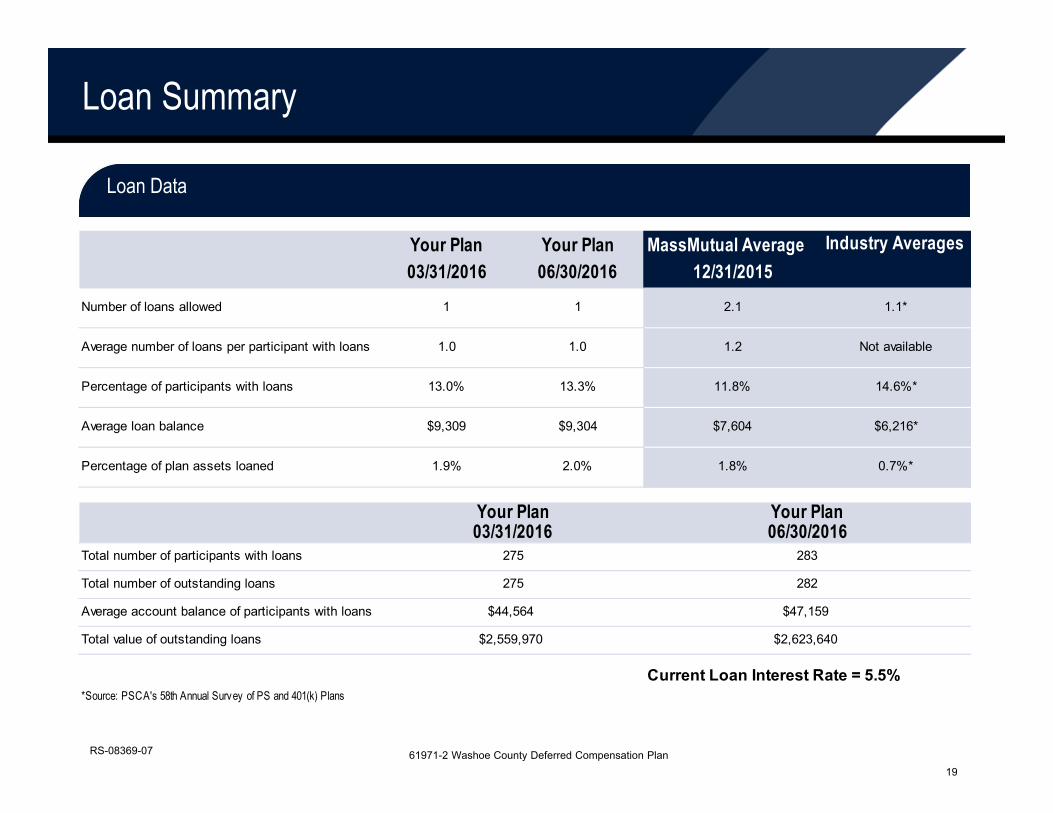
Loan Summary
Loan Data
RS-08369-07 61971-2 Washoe County Deferred Compensation Plan
Your Plan Your Plan MassMutual Average Industry Averages03/31/2016 06/30/2016 12/31/2015
Number of loans allowed 1 1 2.1 1.1*
Average number of loans per participant with loans 1.0 1.0 1.2 Not available
Percentage of participants with loans 13.0% 13.3% 11.8% 14.6%*
Average loan balance $9,309 $9,304 $7,604 $6,216*
Percentage of plan assets loaned 1.9% 2.0% 1.8% 0.7%*
Total number of participants with loans
Total number of outstanding loans
Average account balance of participants with loans
Total value of outstanding loans
Your Plan
282
$47,159
275 283
Your Plan
275
03/31/2016 06/30/2016
Current Loan Interest Rate = 5.5%
$44,564
*Source: PSCA's 58th Annual Survey of PS and 401(k) Plans
$2,559,970 $2,623,640
19

Onsite visitsGroup MeetingAttendees
Individual MeetingAttendees
Total Meetings 38 567 380
Human touch
Give me a live coach
Diagnose: The MassMutual RetireSmartSM
Ready Tool
Prescribe: targeted messages, meetings
One‐to‐one messaging
2016 Onsite meeting results through June 30
RS-08374-14
Animal Control (2)Council Chambers Courts (4)District Attorney (5)Human Resources (12)Sheriffs (7)Social Services (6)Social Services Moana
Days on site (38 total): through 6‐30‐16
20

Human touch
Give me a live coach
Diagnose: The MassMutual RetireSmartSM
Ready Tool
Prescribe: targeted messages, meetings
One‐to‐one messaging
2016 Onsite meeting results as of April 30
RS-08374-14
Key TermsAttendance: # of total participant interactions (does not include employees that are NOT in the plan)Participants: # of unique employees who are enrolled in the planActions: # of enrollments, deferral increases, roll‐ins referrals, passive account consolidations, investment allocation changesAction Ratio: # of actions/# of participantsAUM Actions: # of Asset Under Management Actions (ISP & deferral increases)Pre‐Meetings: participant interactions prior to plan transitionE4: “Electronic Enhance Education Experience” group meeting using smart deviceReferral: Roll‐Ins leadsISP: Investment changesDeferral: Contribution increasesPAC: “Passive Account Consolidation” a roll‐in that occurs as an indirect result of a participant meetingCash Flow: Assigned dollar value based on participant actions
21

22
©2015 Massachusetts Mutual Life Insurance Company, Springfield, MA. All rights reserved. www.massmutual.com. MassMutual Financial Group is a marketing name for Massachusetts Mutual Life Insurance Company (MassMutual) and its affiliated companies and sales representatives.
RS-08374-12
22

Group Meeting Results 2nd Quarter 2015 2nd Quarter 2016 2016 YTD TotalsMeetings 34 20 38Attendees 130 340 567457 Enrollments* 44 26 73401(a) Enrollments** 1 0 5One on One Counseling Sessions 302 148 380
Rollover Results 2nd Quarter 2015 2nd Quarter 2016 2016 YTD TotalsRollovers In 11 16 32Dollars from Rollovers In $223,338.92 $175,686.69 $673,790.57Rollovers Out 17 17 32Dollars from Rollovers Out $1,692,473.43 $507,301.33 $1,828,223.70PERS Purchases 23 20 43Dollars from PERS Purchases $1,167,762.94 $923,572.35 $1,835,106.47
401(a) & 457 Loan Results 2nd Quarter 2015 2nd Quarter 2016 2016 YTD Totals401(a) Applications Processed 2 5 6Dollars from Applications Processed $48,000.00 $113,541.09 $143,541.09457 Applications Processed 31 26 49Dollars from Applications Processed $438,779.16 $338,585.00 $632,468.84
Hardship Results 2nd Quarter 2015 2nd Quarter 2016 2016 YTD TotalsHardship Applications Approved 2 3 3Dollars from Approved Applications $11,022.00 $5,900.40 $5,900.40
401(a) & 457 Fund & Age Average Results 2nd Quarter 2015 2nd Quarter 2016 Participants in 457 Plan 2,069 2,122Participants in 401(a) Plan 158 161457 Assets as of 6-30-2016 Including Loan Assets $133,942,178.68 $133,592,234.17401(a) Assets as of 6-30-2016 Including Loan Assets $9,109,496.81 $9,235,857.48Average 457 Participant Balance $64,737.64 $62,955.81Average 401(a) Participant Balance $57,655.04 $57,365.57
ROTH Results 2nd Quarter 2015 2nd Quarter 2016 Participants with a Roth Balance 166 187Assets in Roth $1,341,605.29 $1,690,325.88
*Revised 1Q 2016 457 New Enrollments to 47 from originally reported 26**Revised 1Q 2016 401(a) New Enrollments to 5 from originally reported 2
Washoe County 2nd Quarter 2016 Summary Sheet