+ All Categories
Home > Documents > Strategic Process Control Technologies, LLC

Strategic Process Control Technologies, LLC

Date post: 04-Feb-2022
Category:
Upload: others
View: 9 times
Download: 0 times
Share this document with a friend
25
Strategic Process Control Technologies, LLC SPC WWW.SPCTECHLLC.COM 2007 © SPCTech, All Rights Reserved Building Calibrations from Knowledge: Applying Synthetic Calibration Techniques for Efficient Method Development and Realistic Robustness Testing Robert P. Cogdill IFPAC 2007 Life Cycle Management of Analyzer and Method Reliability 31 January 2007, Baltimore MD SPC Technologies, LLC
Transcript

Strategic Process Control Technologies, LLC

SPCWWW.SPCTECHLLC.COM 2007 © SPCTech, All Rights Reserved

Building Calibrations from Knowledge:

Applying Synthetic Calibration Techniques for Efficient Method Development and Realistic Robustness Testing

Robert P. Cogdill

IFPAC 2007Life Cycle Management of Analyzer and Method Reliability

31 January 2007, Baltimore MD

SPCTechnologies, LLC

2SPCWWW.SPCTECHLLC.COM 2007 © SPCTech, All Rights Reserved

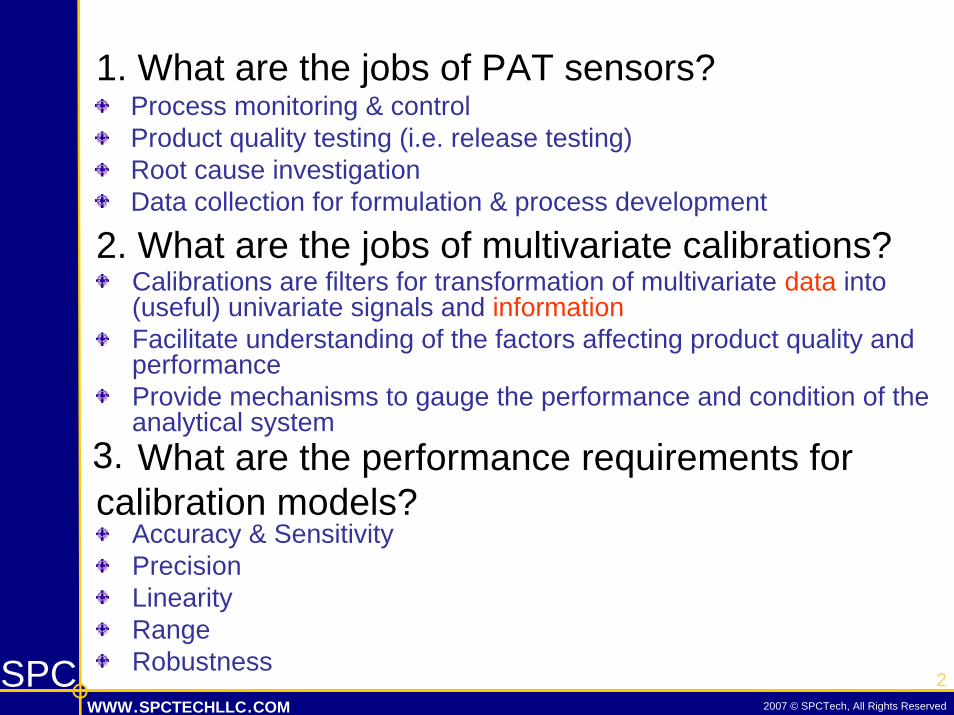
Process monitoring & controlProduct quality testing (i.e. release testing)Root cause investigationData collection for formulation & process development

2. What are the jobs of multivariate calibrations?Calibrations are filters for transformation of multivariate data into (useful) univariate signals and informationFacilitate understanding of the factors affecting product quality and performanceProvide mechanisms to gauge the performance and condition of theanalytical system

3. What are the performance requirements for calibration models?

Accuracy & SensitivityPrecisionLinearityRangeRobustness

1. What are the jobs of PAT sensors?

3.

3SPCWWW.SPCTECHLLC.COM 2007 © SPCTech, All Rights Reserved

The “main effects” of calibration dataset design on performance:

The Spectroscopic “Universe”

Synthetic Calibration

Lab-Scale/DOE

BatchSpectraP

hysi

cal V

aria

tion

Composition Variation

Accuracy, Sensitivity, Linearity, Range

Precision,Robustness

4SPCWWW.SPCTECHLLC.COM 2007 © SPCTech, All Rights Reserved

What are the most important factors in NIR calibration data?

Calibration Spectra

=Pure-ComponentVariation +

Baseline/PhysicalFactors

InstrumentNoise+

5SPCWWW.SPCTECHLLC.COM 2007 © SPCTech, All Rights Reserved

What are the most important factors in NIR calibration data?

Calibration Spectra

Pure-ComponentVariation

Baseline/PhysicalFactors

InstrumentNoise

=

+ +

6SPCWWW.SPCTECHLLC.COM 2007 © SPCTech, All Rights Reserved

Calibration Development Flow Path

Feasibility Tests

DOE Calibration

Validation

Deployment

ModelUpdate

Current MethodDevelopment Path:

Feasibility Tests

Efficient Calibration

Deployment

Validation

ModelUpdate

Efficient CalibrationDevelopment Path:

7SPCWWW.SPCTECHLLC.COM 2007 © SPCTech, All Rights Reserved

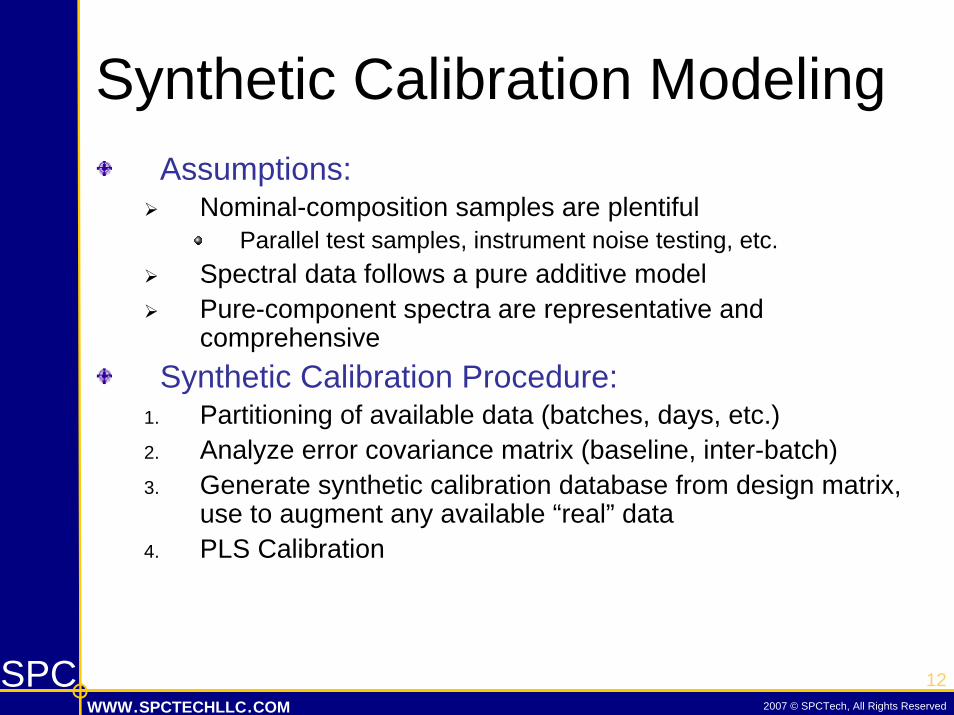
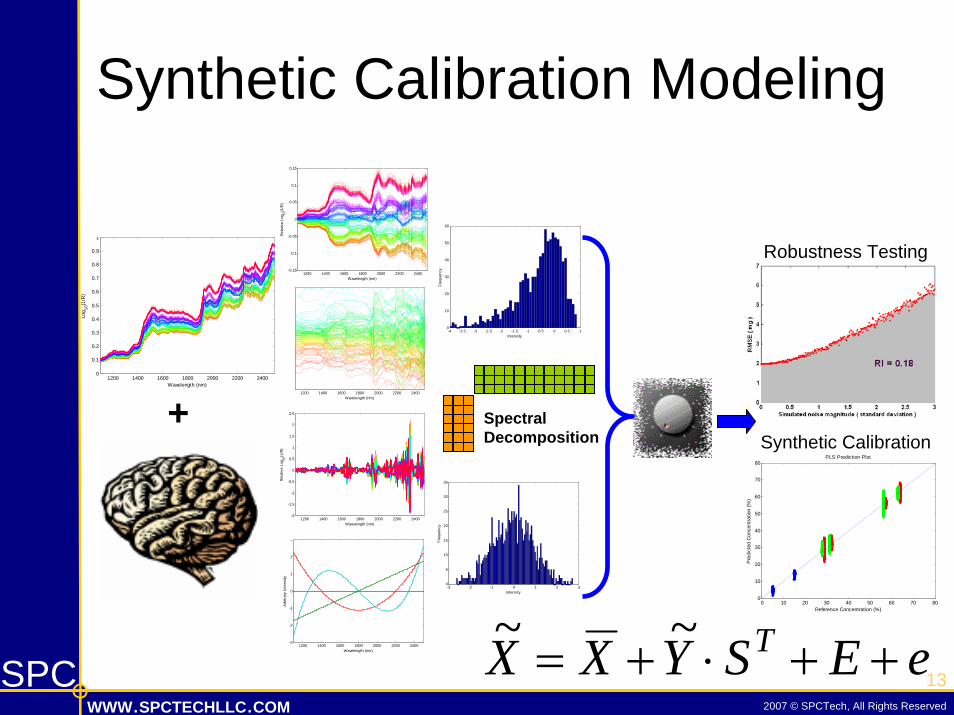
Synthetic Calibration ModelingPure-component methods have demonstrated the utility of a priori information in the pure-component spectraThe ideal pure-component estimation method would be:

easily deployed using common software routinesaccurate on an absolute basisFlexible enough to accommodate update information

If the error covariance matrix can be estimated, it should be possible to create a synthetic calibration databasewhich accurately reflects true expected variation, therefore allowing calibration without standards

In many respects,synthetic calibration represents the “holy grail” for NIR calibration

8SPCWWW.SPCTECHLLC.COM 2007 © SPCTech, All Rights Reserved

Case Study: NIR Analysis of Intact Tablets

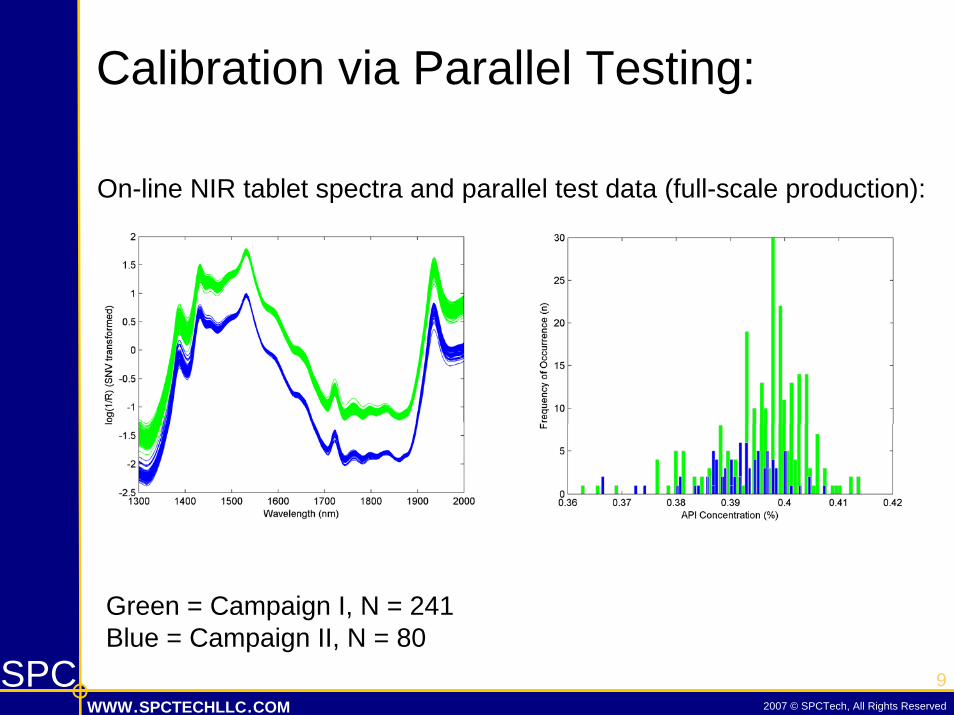
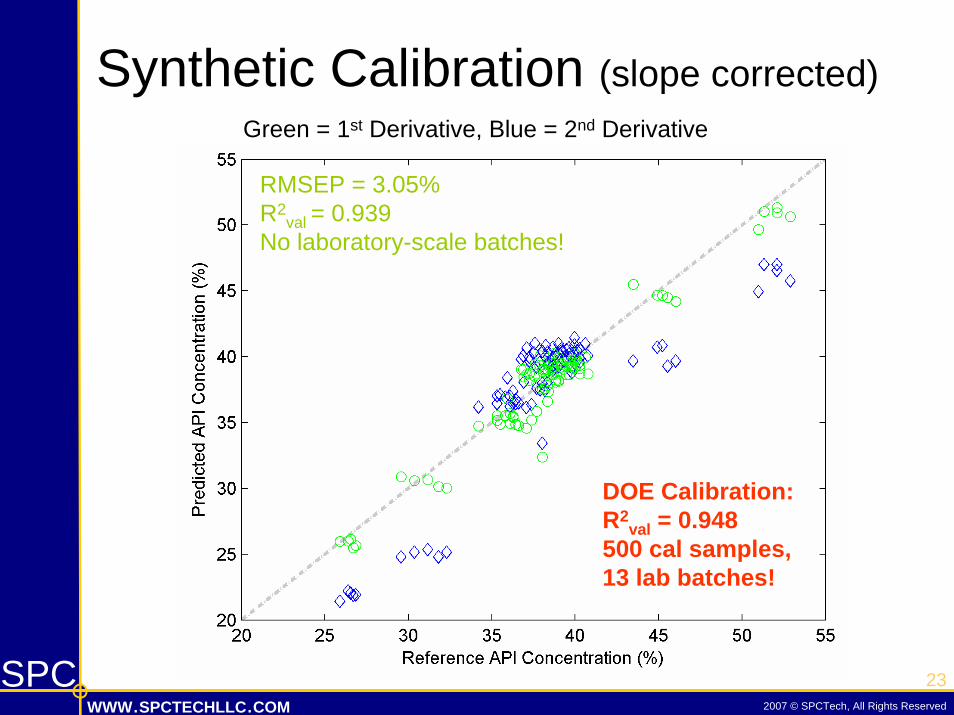
Objective: Generate a NIR calibration model suitable for process control & real-time release using only production-scale tablets (no “designer” or DOE tablets)

Calibration Data:NIR spectra and reference chemistry data from parallel testing during two full-scale production campaigns: 321 TabletsInstrument precision estimate: 3 tablets scanned 10 times without repositioningLong-term instrument stability: 12 tablets scanned periodically during one year (no reference data)Raw material pure-component scans

Validation Data:90 production- and laboratory-scale tablets having extreme concentration variation

9SPCWWW.SPCTECHLLC.COM 2007 © SPCTech, All Rights Reserved

Green = Campaign I, N = 241Blue = Campaign II, N = 80

On-line NIR tablet spectra and parallel test data (full-scale production):

Calibration via Parallel Testing:

10SPCWWW.SPCTECHLLC.COM 2007 © SPCTech, All Rights Reserved

Green = 1st Derivative, Blue = 2nd DerivativeRegression Coefficients

- Form of regression vectors suggests poor-generalization capability- Many non-specific features

Calibration via Parallel Testing:

11SPCWWW.SPCTECHLLC.COM 2007 © SPCTech, All Rights Reserved

25 30 35 40 45 50 5534

35

36

37

38

39

40

Reference API Concentration (%)

Pre

dict

ed A

PI C

once

ntra

tion

(%)

Green = 1st Derivative, Blue = 2nd Derivative

- Calibration is apparently sensitive, but robustness is questionable- Slope is completely under-estimated

Calibration via Parallel Testing:

12SPCWWW.SPCTECHLLC.COM 2007 © SPCTech, All Rights Reserved

Synthetic Calibration ModelingAssumptions:

Nominal-composition samples are plentifulParallel test samples, instrument noise testing, etc.

Spectral data follows a pure additive modelPure-component spectra are representative and comprehensive

Synthetic Calibration Procedure:1. Partitioning of available data (batches, days, etc.)2. Analyze error covariance matrix (baseline, inter-batch)3. Generate synthetic calibration database from design matrix,

use to augment any available “real” data4. PLS Calibration

13SPCWWW.SPCTECHLLC.COM 2007 © SPCTech, All Rights Reserved

0 10 20 30 40 50 60 70 800

10

20

30

40

50

60

70

80

Reference Concentration (%)

Pre

dict

ed C

once

ntra

tion

(%)

PLS Prediction Plot

Robustness Testing

Synthetic Calibration

Synthetic Calibration Modeling

1200 1400 1600 1800 2000 2200 2400-3

-2

-1

0

1

2

3

Wavelength (nm)

Arb

itrar

y In

tens

ity

1200 1400 1600 1800 2000 2200 2400-0.15

-0.1

-0.05

0

0.05

0.1

0.15

Wavelength (nm)R

elat

ive

Log 10

(1/R

)

1200 1400 1600 1800 2000 2200 2400-2

-1.5

-1

-0.5

0

0.5

1

1.5

2

2.5

Wavelength (nm)

Rel

ativ

e Lo

g 10(1

/R)

1200 1400 1600 1800 2000 2200 2400Wavelength (nm)

1200 1400 1600 1800 2000 2200 24000

0.1

0.2

0.3

0.4

0.5

0.6

0.7

0.8

0.9

1

Wavelength (nm)

Log 10

(1/R

)

+

-4 -3.5 -3 -2.5 -2 -1.5 -1 -0.5 0 0.5 10

10

20

30

40

50

60

Intensity

Freq

uenc

y

-3 -2 -1 0 1 2 30

5

10

15

20

25

30

35

Intensity

Freq

uenc

y

SpectralDecomposition

eESY~XX~ T ++⋅+=

14SPCWWW.SPCTECHLLC.COM 2007 © SPCTech, All Rights Reserved

Synthetic Cal. Parameters Effects Table (effect on Val R2):

15SPCWWW.SPCTECHLLC.COM 2007 © SPCTech, All Rights Reserved

Comparison of Real and Synthetic NIR Spectra:

Real Calibration Spectra Synthetic Calibration Spectra

Shape Errors

16SPCWWW.SPCTECHLLC.COM 2007 © SPCTech, All Rights Reserved

Optimization StatisticsGreen = 1st Derivative, Blue = 2nd Derivative

RMSE R2

S/N Sensitivity

17SPCWWW.SPCTECHLLC.COM 2007 © SPCTech, All Rights Reserved

Synthetic Model CoefficientsGreen = 1st Derivative, Blue = 2nd Derivative

Regression Coefficients

18SPCWWW.SPCTECHLLC.COM 2007 © SPCTech, All Rights Reserved

Estimation of Slope Correction Factor

Can slope/bias correction factors be reliably estimated using only parallel test data?

NO

Green = 1st Derivative, Blue = 2nd Derivative

19SPCWWW.SPCTECHLLC.COM 2007 © SPCTech, All Rights Reserved

Estimation of Slope Correction Factor

Calculation of slope coefficient:

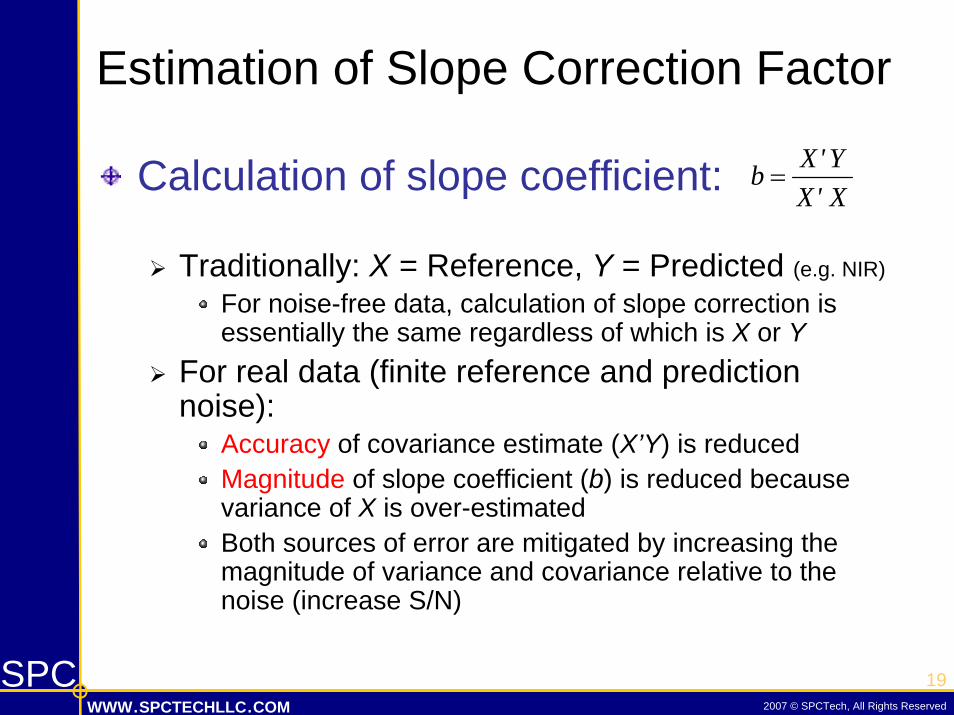
Traditionally: X = Reference, Y = Predicted (e.g. NIR)

For noise-free data, calculation of slope correction is essentially the same regardless of which is X or Y

For real data (finite reference and prediction noise):

Accuracy of covariance estimate (X’Y) is reducedMagnitude of slope coefficient (b) is reduced because variance of X is over-estimatedBoth sources of error are mitigated by increasing the magnitude of variance and covariance relative to the noise (increase S/N)

X'XY'Xb =

20SPCWWW.SPCTECHLLC.COM 2007 © SPCTech, All Rights Reserved

Estimation of Slope Correction FactorIf the precision of the methods is known with confidence, the slope estimate can be corrected: ( )

( )X'XY'Xb

precision

NIR

σσ

=

R2 = 0.962RMSE = 0.054

21SPCWWW.SPCTECHLLC.COM 2007 © SPCTech, All Rights Reserved

Estimation of Slope Correction Factor

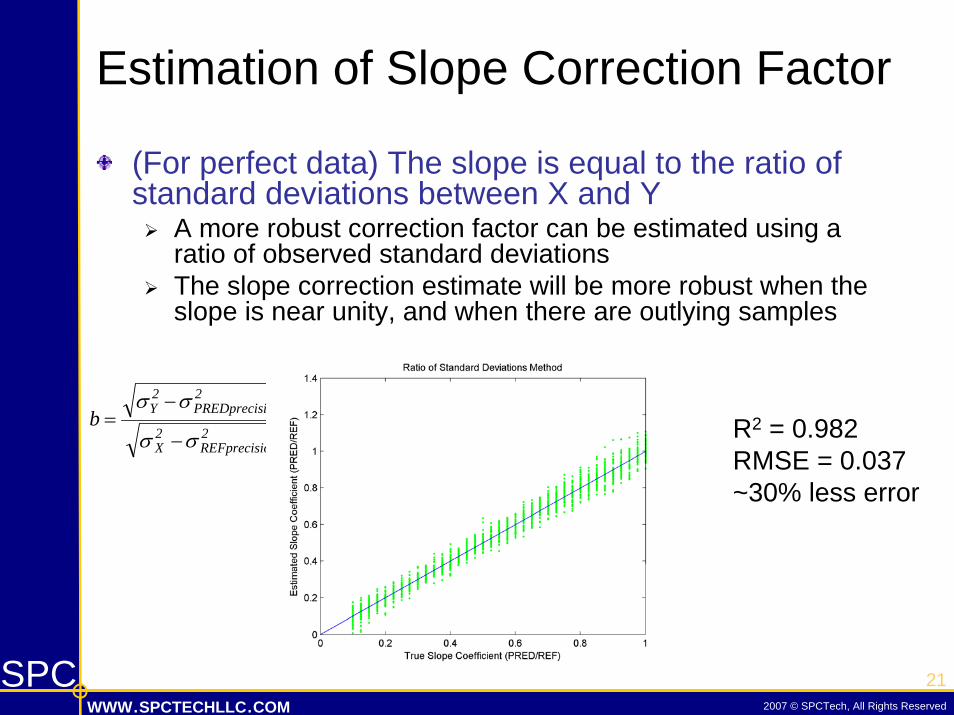
(For perfect data) The slope is equal to the ratio of standard deviations between X and Y

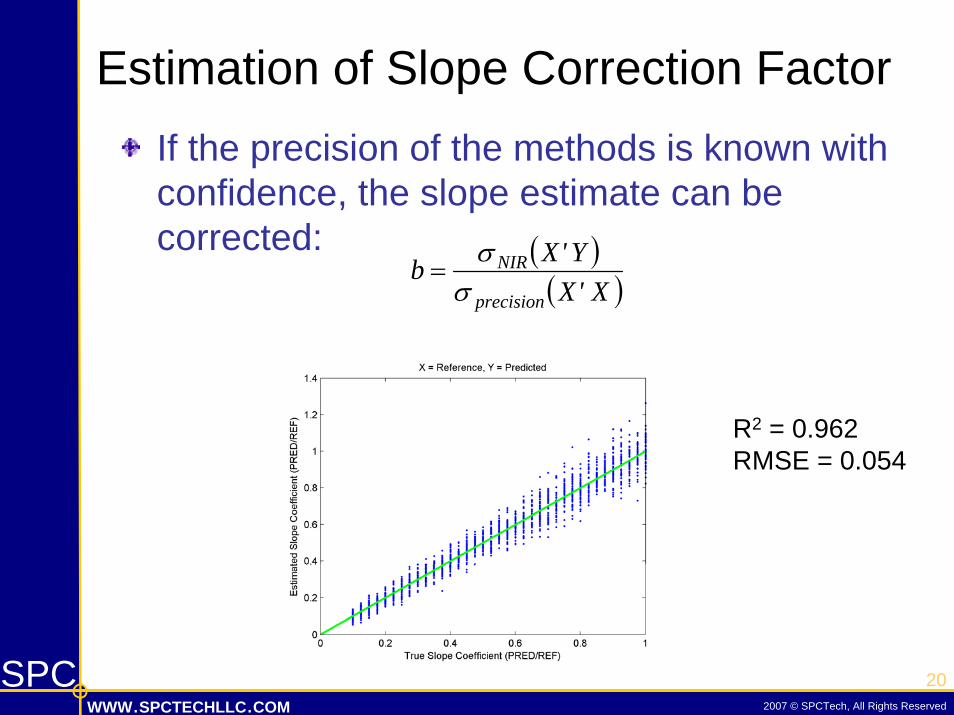
A more robust correction factor can be estimated using a ratio of observed standard deviations The slope correction estimate will be more robust when the slope is near unity, and when there are outlying samples

2onREFprecisi

2X

2ionPREDprecis

2Yb

σσ

σσ

−= R2 = 0.982

RMSE = 0.037~30% less error

22SPCWWW.SPCTECHLLC.COM 2007 © SPCTech, All Rights Reserved

Estimation of Slope Correction Factor

Can slope/bias correction factors be reliably estimated using only parallel test data? (Note: Not corrected for precision)

Maybe

23SPCWWW.SPCTECHLLC.COM 2007 © SPCTech, All Rights Reserved

Synthetic Calibration (slope corrected)Green = 1st Derivative, Blue = 2nd Derivative

RMSEP = 3.05%R2

val = 0.939No laboratory-scale batches!

DOE Calibration:R2

val = 0.948500 cal samples, 13 lab batches!

24SPCWWW.SPCTECHLLC.COM 2007 © SPCTech, All Rights Reserved

SummarySynthetic calibration has been applied successfully for NIR monitoring of multi-component blending and intact tablet analysis

Publication of results is in process…Synthetic calibration was used to produce a sensitive, linear calibration model using zero high-leverage reference samples

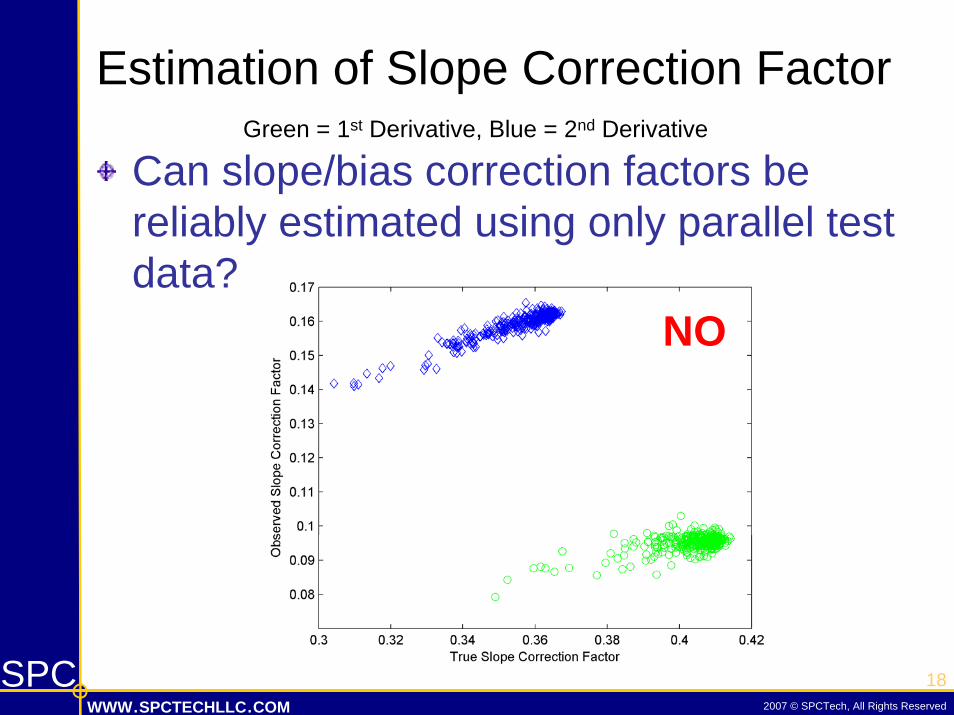
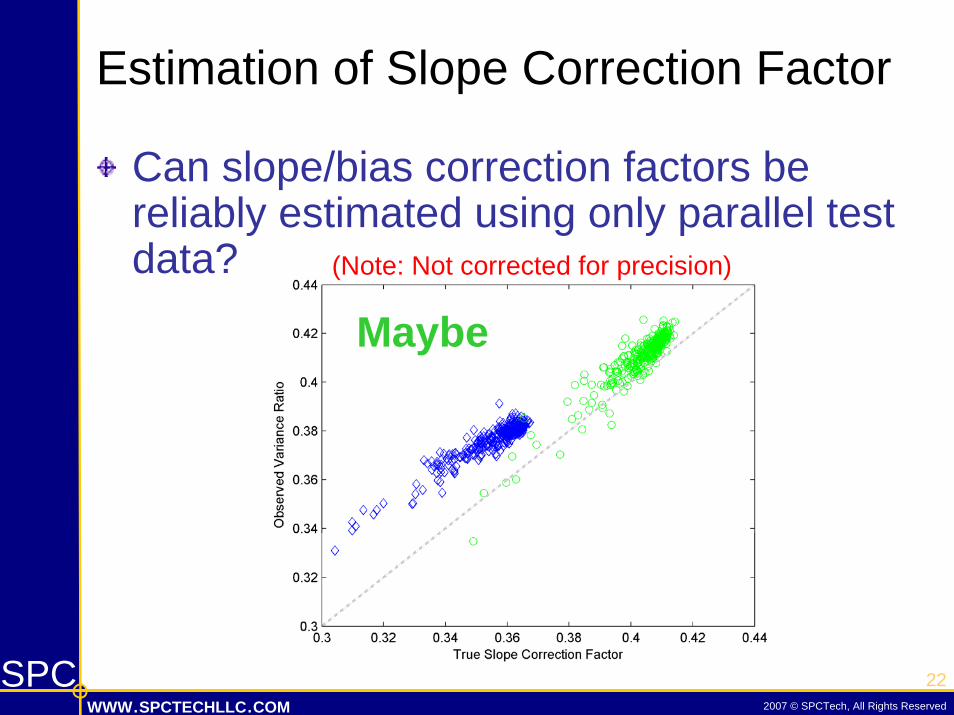
By correcting for measurement precision, parallel testing data may be used to estimate slope and bias coefficients for process controlcalibrations

Synthetic calibration should be considered as an extension of current efforts in efficient calibration

PCP, NAS, GLS, maximum-likelihood weighting, direct orthogonalization, etc.

Synthetic calibration can be applied incrementally, and is not an “all or nothing solution”

Use synthetic calibration to create a “starter model” to “cherry pick”production samples for validationAugment synthetic calibration with process development or parallel test data

25SPCWWW.SPCTECHLLC.COM 2007 © SPCTech, All Rights Reserved

Thank You!

Richard CreekmoreThorsten Herkert

Carl A. AndersonJames K. Drennen, III

Gert Thurau & Steve Jacobs (session chairmen)


Recommended