Strategies for making the dryland systems more resilient in a changing climate scenario Prof. Dr. Anthony Whitbread, Georg-August-University Göttingen, Germany Crop Production Systems in the Tropics Formerly: CSIRO Ecosystems Science, Adelaide, South Australia
Transcript
Strategies for making the dryland systems more resilient in a changing climate scenario
Prof. Dr. Anthony Whitbread, Georg-August-University Göttingen, GermanyCrop Production Systems in the Tropics
Formerly: CSIRO Ecosystems Science, Adelaide, South Australia
Content of seminar
• Overview on my department in Göttingen• Define the Drylands and the challenges they face• Discuss some challenges to building resilience in the Drylands• Define some strategies I have been involved in for building resilience• Outline some of the key tools and methodologies that I believe need to
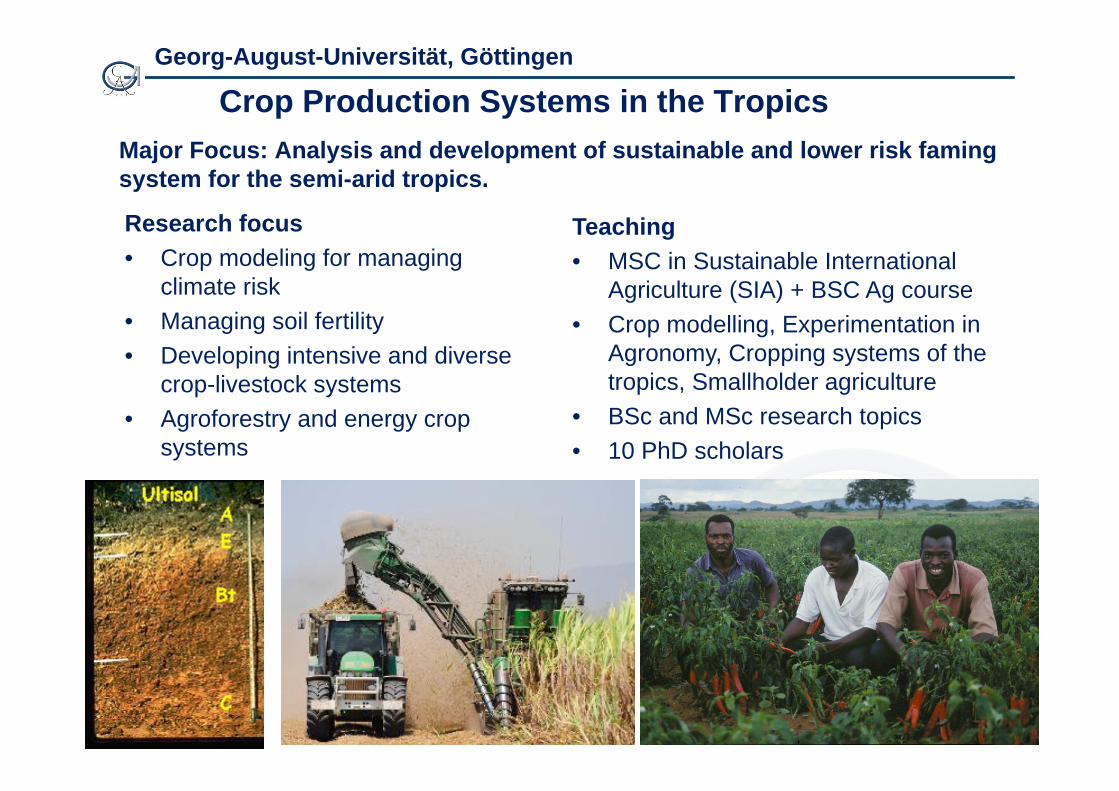
Crop Production Systems in the TropicsMajor Focus: Analysis and development of sustainable and lower risk faming system for the semi-arid tropics.
Georg-August-Universität, Göttingen
Research focus• Crop modeling for managing
climate risk• Managing soil fertility• Developing intensive and diverse
crop-livestock systems• Agroforestry and energy crop
systems
Teaching• MSC in Sustainable International
Agriculture (SIA) + BSC Ag course• Crop modelling, Experimentation in
Agronomy, Cropping systems of the tropics, Smallholder agriculture
• BSc and MSc research topics• 10 PhD scholars
• 65 % of the worlds agricultural lands fall into the category of drylands
• 2.5 billion people live in the Drylands• The majority of the poorest people live in semi-
arid areas• 644 million people are the poorest of the poor• 1/3 of these rely on agriculture for their livelihoods• 42% (27) of children in the Drylands of Asia (SSA)
are malnourished• Mixed (crop-livestock) farming systems are
predominant agricultural system
Dryland Systems- key features
Markets
How do we move the Drylands towards more resilient systems?
Microbe-plant
Community, watershed, region…
Farm, household, livelihood…
Field, flock, forest
Markets
Challenges above the farm level…global challenges• Poor governance and political instability• Lack of political will in putting Drylands on the agenda• Lack of infrastructure, institutions and human capacity• Market failure or unfair policies creating skewed markets
• Gender inequalityFarm level challenges• Land fragmentation (e.g. Eastern Ethiopia- land size 0.5-0.25 ha)• Labour cost and availability• Conflict for resources (water, grazing rights)• Severe environmental degradation• High inherent climate variability and severe threat of higher
temperatures/lower rainfall and higher variability due to climate change
RISK
In semi arid, low input systems farmers are most affected by climatic risk which is exacerbated by low soil fertility and poor agronomic management
(Pests and disease, cost of inputs, prices received for products, market risk, storage risk)
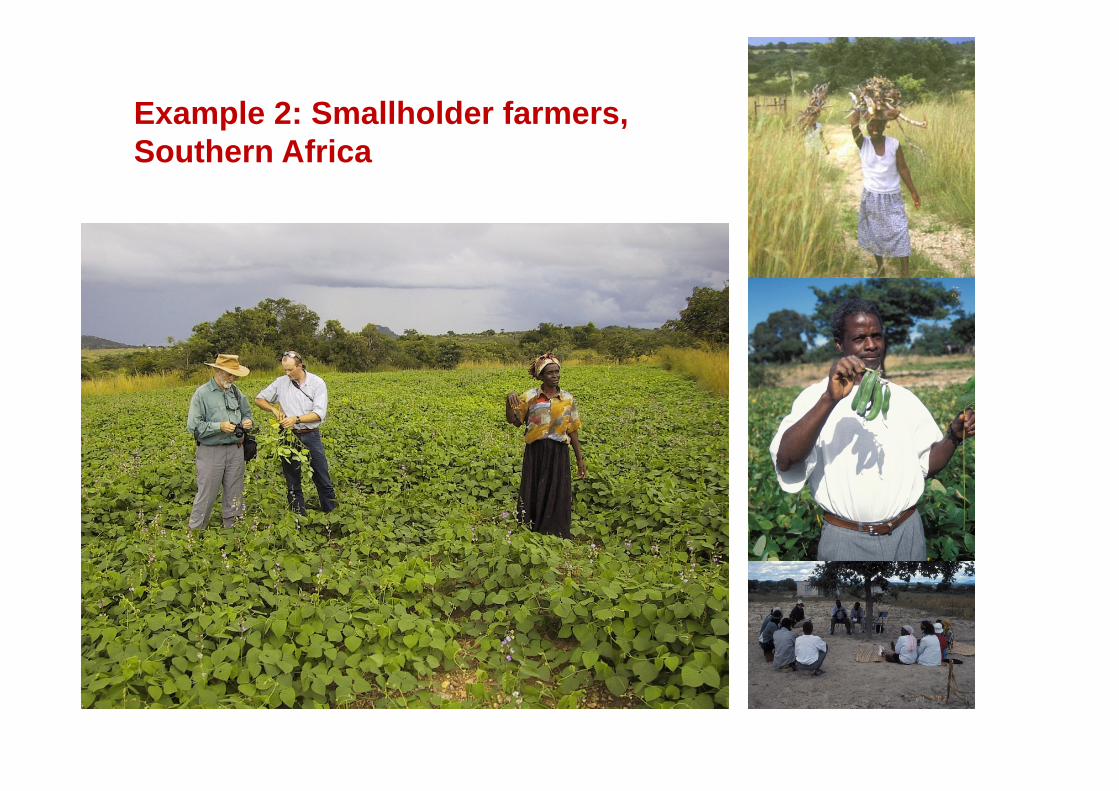
Example 1: Low rainfall cereal systems, Southern AustraliaExample 2: Smallholder farmers, Southern Africa
Establishment
Leaf area / biomassproduction
Harvest
Residue
Root growth
Flowering/grain production
Climate Transpiration
Soil water
Drainage
Runoff/Erosion
Soil Organic Matter /
Nutrients
Leaching
Management
Evaporation
RedistributionDecomposition/Incorporation
Water uptake
Nutrientuptake
Manure
Livestock
Key features of agricultural production system (APSIM)
Example 1 : Low rainfall cereal systems, Southern Australia• In Southern Australia, low rainfall (annual 250-350 mm) cropping
environments cover > 5M ha and produce > 50% of the regions grain.• Farming businesses in these regions incur financial losses in their
cropping enterprises in 2-3 out of 10 years due to poor seasonal conditions
• Farmers manage this risk by:– Diversifying enterprises, particularly with livestock– Being flexible in crop area and crop type– Adjusting inputs in response to season (PAW, crop stage, forecast)
• Using models to understand crop x soil x rainfall interactions has been useful in devising robust management strategies.
Conservation agriculture and intensive croppingSince early 2000’s, move towards more intensive and continuous cropping (a move away from fallow or pasture rotations with cereal)
More intensive cropping could lead to increased productivity in good years
Reductions in erosion in poor years
How to manage continuous cropping and could it be maintained?
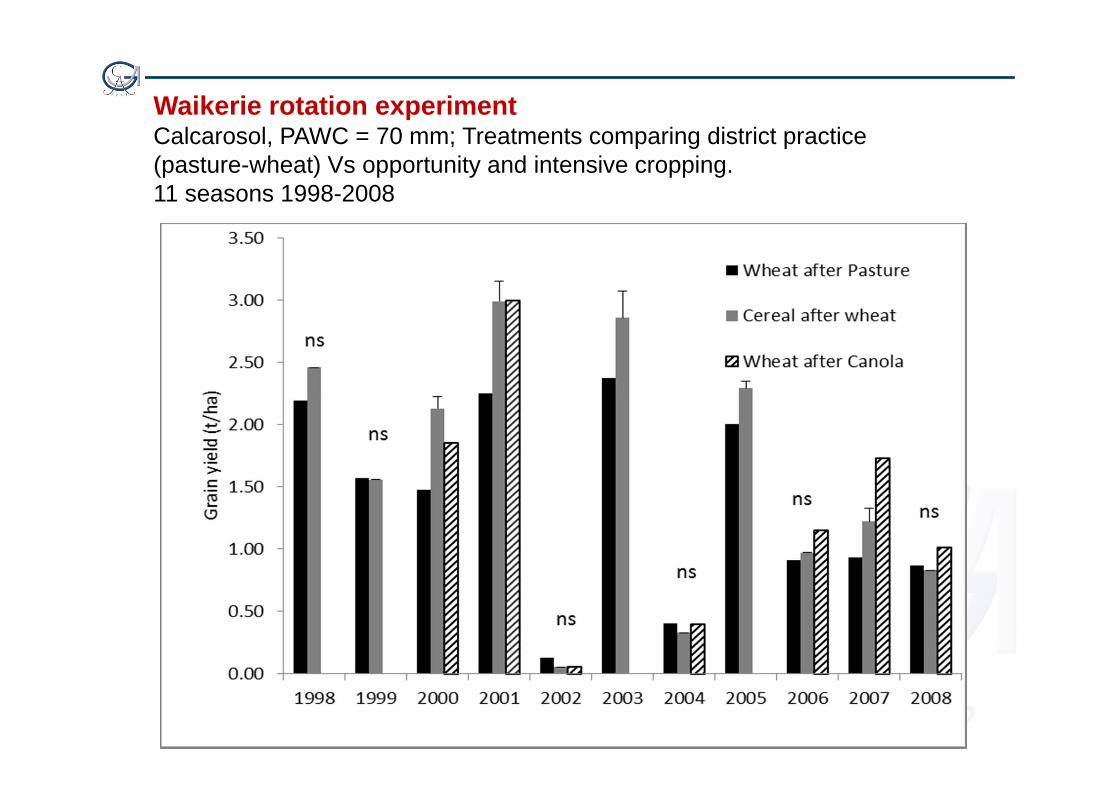
Waikerie rotation experimentCalcarosol, PAWC = 70 mm; Treatments comparing district practice (pasture-wheat) Vs opportunity and intensive cropping.11 seasons 1998-2008
Reliability of modelled predictions of yield
Reliability of modelled predictions of soil water-Waikerie
RMSEOverall = 6.6 mm, (9%)Fallow = 5.2 mm, (21%) Growing= 7.5 mm, (11%)
Effect of variations in PAW and seeding opportunity on percentage of modelled yields
Medium (100 cm) low 17 5 14 1 15 4 11 0 mod 11 6 16 5 11 7 15 5 high 9 6 14 6 8 7 13 6
Deep (>150 cm) low 16 6 17 2 15 0 15 2 mod 11 7 17 7 10 8 15 8 high 8 6 14 8 8 6 13 9
very low risk (one year in 10) medium risk (one year in 5)high risk situations
Poor weed control Effective weed control
Farmers’ fields: 2007 - 2008
Legume yield 2007/08
Bambara Cowpea
Best Farmer
A proud farmer at Kulani, Bohlobela growing bambara groundnut in rows
Farmers at Kulani, Bohlobela now rotate their fields between legumes (far left) and maize
Extension material
Strategic pathway to developing the system“The Bohlabela Model”
1. Identify the potential market opportunities and benchmark.2. Undertake strategic research to identify and demonstrate appropriate
varieties, agronomic practices and potential.3. Build the farmers’ (and extension officers) agronomic knowledge and
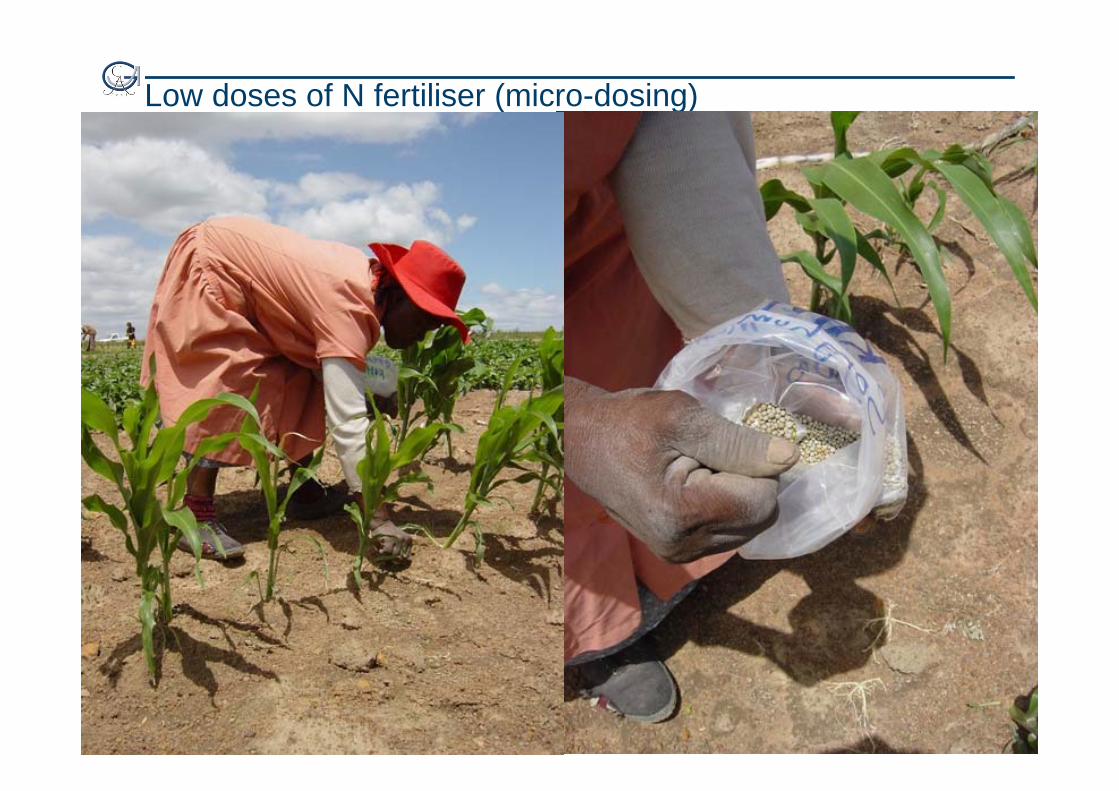
skills in crop production, through formal and in-formal training. 4. Supply/subsidise appropriate inputs such as new varieties and
fertiliser.5. Identify and address other constraints such as storage, packaging
and marketing of produce.6. Provide on-going technical and logistical support.
Markets
Tradeoffs and scale
Microbe-plant
Community, watershed, region…
Farm, household, livelihood…
Field, flock, forest
Markets
Key tradeoffs and tools: plant to field scale
Microbe-plant
Examples • High and low harvest index (fodder, building material Vs grain)• Short duration risk avoidance Vs longer duration higher yielding• Effect of stay green traits in sorghum across environment
Tools• Detailed crop models that capture interactions between environment
and genotype….and phenotype
e.g. Hammer et al. (2010) uses “….sufficient physiological rigour for complex phenotypic traits to become emergent properties of the model dynamics.”[Hammer et al. 2010. J. Exp. Botany 61(8), 2185-2202.]
Key tradeoffs and tools: Field to farm scale
Examples:• Fallow weed control and consequences for soil water at sowing (&
labour tradeoffs)• Quantifying the riskiness of various intervention strategies (e.g.
fertiliser response x season)• Comparing decisions around crop type/variety and time of planting
Tools• Crop-soil models that capture interactions between environment and
genotype (e.g. APSIM, DSSAT)• Summary models that capture model output statically (e.g. IAT)• Farm level models that capture interactions (e.g. APSFARM, NUANCES• Simpler economic based optimisation approaches (Linear Programming)
Key tradeoffs and tools: Farm to watershed or regional scales…
Examples:• Impacts of soil conservation measures (buffers, etc.) in watershed to
national level erosion assessments (e.g. USDA)• Impacts of widely adopted agronomic interventions on watershed
processes (e.g. Lake Tana in NW Ethiopia).
Tools• SWAT-APEX-EPIC (http://swat.tamu.edu/ http://apex.tamu.edu/)• Bio-economic modelling frameworks (farm to regional) e.g. or
Conclusions…or maybe the challenges• In many parts of the semi-arid tropics, food security remains a major challenge.
Understanding the farm system and the tradeoffs of various options helps us understand where intervention strategies might best be targeted.
• Simulation modelling has a special role to play in the semi-arid systems and where information is lacking - but needs better coordination, cooperation and critical mass
• Scaling up – more complex messages about farming system design require the building of capacity in stakeholders. This cannot be achieved without increased participation of the NARES (&NGO’s) and influencing policy
Building more resilient Drylands requires:• Building capacity in the regions scientists for applied research questions –
necessarily ‘systems’ thinking• Applying first class science to development issues (e.g. drought tolerance in
legumes and cereals, managing climate variability, soil fertility)• Scaling up successes via partnerships with the CGIAR, Universities, NARES and