Graduate eses and Dissertations Iowa State University Capstones, eses and Dissertations 2010 Stream bank soil and phosphorus losses within grazed pasture stream reaches in the Rathbun Watershed in southern Iowa Mustafa Tufekcioglu Iowa State University Follow this and additional works at: hps://lib.dr.iastate.edu/etd Part of the Environmental Sciences Commons is Dissertation is brought to you for free and open access by the Iowa State University Capstones, eses and Dissertations at Iowa State University Digital Repository. It has been accepted for inclusion in Graduate eses and Dissertations by an authorized administrator of Iowa State University Digital Repository. For more information, please contact [email protected]. Recommended Citation Tufekcioglu, Mustafa, "Stream bank soil and phosphorus losses within grazed pasture stream reaches in the Rathbun Watershed in southern Iowa" (2010). Graduate eses and Dissertations. 11895. hps://lib.dr.iastate.edu/etd/11895
Transcript
Graduate Theses and Dissertations Iowa State University Capstones, Theses andDissertations
2010
Stream bank soil and phosphorus losses withingrazed pasture stream reaches in the RathbunWatershed in southern IowaMustafa TufekciogluIowa State University
Follow this and additional works at: https://lib.dr.iastate.edu/etd
Part of the Environmental Sciences Commons
This Dissertation is brought to you for free and open access by the Iowa State University Capstones, Theses and Dissertations at Iowa State UniversityDigital Repository. It has been accepted for inclusion in Graduate Theses and Dissertations by an authorized administrator of Iowa State UniversityDigital Repository. For more information, please contact [email protected].
Recommended CitationTufekcioglu, Mustafa, "Stream bank soil and phosphorus losses within grazed pasture stream reaches in the Rathbun Watershed insouthern Iowa" (2010). Graduate Theses and Dissertations. 11895.https://lib.dr.iastate.edu/etd/11895
Materials and Methods ........................................................................................15
Study sites and treatments ............................................................................15
Identifying stream bank eroding areas .........................................................16
Installation of stream bank erosion pins ......................................................17
Soil bulk density sampling from stream banks and riparian areas ...............18
Soil-P sampling and estimation of soil and total P loss from stream banks.19
Rainfall data .................................................................................................20
Data analysis ................................................................................................20
Results and Discussion…………………………………………………………...20
Lengths and areas of severe and severely eroding stream banks .................20 Stream bank and riparian area soil bulk densities ........................................22
iii
Relationship between bank erosion and independent variables ..................23
Erosion rate and soil loss based on Strahler stream order classification ....27
Total soil-P concentrations and losses of soil and soil-P from stream bank 28
Summary and Conclusions ....................................................................................29
CHAPTER 4. STREAM MORPHOLOGY, RIPARIAN LAND-USE AND STREAM BANK EROSION WITHIN GRAZED PASTURES IN THE RATHBUN WATERSHED IN SOUTHERN IOWA: A CATCHMENT-WIDE PERSPECTIVE
Abstract…………………………………………………………………………...75
Introduction……………………………………………………………………….76
iv
Material and Methods…………………………………………………………….78
Study sites and treatments…………………………………………………78
Scope of the work………………………………………….........................79
Stream bank soil particles size analysis………............................................80
Stream bed slope and sinuosity…………………………………………….80
Land-use determination within 50 m strips on either side of the stream…..81
Catchment size, total stream lengths and stream order classification……..81
Stream bank erosion rates………………………………………………….81
Data analysis……………………………………………………………….81
Results and Discussion…………………………………………………………...82
Stream bank soil particle size…………………………………………… 82
Stream bed slope and sinuosity…………………………………………….83
Catchment stream length and size………………………………………….84
Impacts of land-use within 50 m strips on either side of the stream……….85
Conclusions……………………………………………………………………….86
References………………………………………………………………………...87
CHAPTER 5. GENERAL CONCLUSIONS……………………………………………..101
References………………………………………………………………………...103
Acknowledgments………………………………………………………………...103
1
CHAPTER 1
GENERAL INTRODUCTION
Introduction
Increased sediment load can negatively impact local stream integrity and increase
downstream flux of attached nutrients (IDNR, 1997). Phosphorus (P) moves to surface
waters predominantly attached to sediment as particulate P (Sharpley et al. 1987) and has
been identified as a limiting nutrient for eutrophication of many lakes and streams (Correll,
1998). Increased P concentration in streams often promotes algal blooms and excess growth
of other aquatic nuisance plants. Aerobic decomposition of the enhanced organic matter
production may lead to hypoxic conditions and reduce stream integrity (Carpenter et al.
1998).
Along with overland flow and bed sediment re-suspension, stream bank erosion is an
important pathway of non-point source pollutants into surface waters and has been found to
account for 40-70% (Laubel et al. 2003), 50% (Schilling and Wolter, 2000), 23-56% (Thoma
et al. 2005), 46-76% (Nagle et al. 2007), 25% (Simon, 2008) and more than 50% (Laubel et
al. 1999) of a catchment’s suspended sediment export. In addition to sediment, total-P
contribution to channels from stream bank erosion has been shown to vary from 56 %
(Roseboom, 1987), 15-40 % (Laubel et al. 2003), to 7-10 % (Sekely et al. 2002). The large
range of estimated sediment and P loads to streams from bank erosion is likely because of the
large number of variables involved in the process and the unique relationships among them.
Such variables include over-hanging banks, bank angle, bank vegetation cover, estimated
stream power (Laubal, 2003), and channel width, depth, and slope (Odgaard, 1987).
2
Riparian land-uses such as grazing and row-crop production have been shown to
impact rates of stream bank erosion (Striffler, 1964; Zaimes and Schultz, 2002). In the
Midwest, less than 10% of land-use is perennial vegetation, with more than 70% within row
crops or pastures (Burkart, 1994). In Iowa, intensive agricultural land-use as row-crop and
pasture compromise more than 90% of the land-uses and has been shown to increase
overland flow which can increase the volume of water in stream channels and result in
channel incision and widening and an extensive growth of gully networks (Zaimes et al.
2004). Moreover, previous research in Iowa by Downing and Kopaska (2001) concluded that
a watershed with a higher proportion of land in pasture may contribute more P to streams
than a watershed with a higher proportion of land in row-crops. However, the pathways of
this input were not identified in this work. A recent study by Alexander et al. (2008)
estimated that 37 percent of the P contributed to streams and lakes in the Mississippi River
Basin comes from manure on pastures and range land. Grazing can decrease water infiltration
and change species composition through increased soil compaction and surface erosion,
processes that contribute to changes in stream morphology and ultimately watershed
hydrology (Agouridis et al. 2005). It has also been shown that unlimited access of cattle can
reduce local stream integrity (Line et al. 2000; Sherer et al. 1988; Hagedorn et al. 1999;
Collins and Rutherford, 2003). The magnitude of the impact of riparian grazing is related to
the grazing management system. Research findings by Zaimes et al. (2008b) and Magner et
al. (2008) indicated that using rotational or intensive/short rotational grazing practices instead
of continuous grazing could reduce the amount of sediment and P load to streams.
Gburek and Sharpley (1997) suggested that to control P export from a watershed
resulting from grazing, areas that have potentially high soil P levels and surface runoff
3
should be targeted for conservation practices. These areas have been identified as generally
within 60 m of the stream (Gburek et al. 2000) or under trees where shade is provided for
livestock (Mathews et al. 1993). On an areal basis, these critical source areas (CSAs) have
been shown to account for only about 10% of the pasture area but about 90% of available P
export (Pionke et al. 1997). Zaimes et al. (2009) also found that loafing areas had high total-P
concentrations compared to other areas of the riparian pastures indicated that these areas
could be significant source of total-P to surface water.
Several other studies have assessed the relationship between riparian grazing
management and water quality. In one study to determine the contribution of cattle access
points to fecal bacteria in streams, Hagedorn et al. (1999) measured a 94% reduction in fecal
coliform populations after an off-stream water supply and stream-side fencing were installed.
In a similar study conducted by Sherer et al. (1988) to determine the impact of livestock on
fecal coliform levels in stream sediment, it was found that animal access points to the stream
were potentially major contributors of bacteria to the stream sediments. With respect to
sediment and nutrients, Line et al. (2000) observed a reduction in total suspended sediment
and total-P of 82% and 76%, respectively, after the installation of stream-side fencing.
Agourids et al. (2005) observed that using an off-stream water source and fence to exclude
cattle from riparian areas did not significantly change stream cross-sectional areas, but did
reduce the impact of cattle on localized areas that contributed sediment and manure to the
stream channel. Several authors have emphasized the opportunity costs for landowners in
implementing alternate riparian grazing practices. For example, Doughertly et al. (2004)
concluded that, although reducing the P export from CSA’s with proper management
strategies would have profound effects on stream water quality and aquatic life, the
4
adaptation and implementation of these new management practices may not be accepted by
landowners because of possible reduction in arable land-use. So when recommending
riparian conservation practices, it is essential to consider the effects of such CSAs on farm
profitability.
Stream bank erosion
Stream bank erosion is generally considered to be controlled by three major processes
(Lawler, 1992a). The first is mass bank failure, a geotechnical process that occurs when large
blocks of bank fall into the stream because the bank angle is too steep and the bank exceeds
its critical stable height. The second process is fluid entrainment, a fluvial process that is
related to the action of flowing water on the stream bank. During a high discharge event there
is an increase in water velocity and an increase in shear stress along the entire wetted
perimeter that dislodges soil from the bank (Lawler, 1992a). The third process is subaerial
preparation, a physical process that includes desiccation of soil materials by freeze-thaw
cycles that expand and contract pore spaces in the soil, loosening the adjacent soil particles
and causing them to slough off into the stream (Lawler, 1992a). The dominant erosion
process within a stream system depends on the location of the eroding bank (downstream,
mid-, and upstream) and the drainage area above the point of failure. Mass failure processes
are dominant in the downstream portion of large river systems, fluvial processes in the
midstream or mid-sized drainage basins, and physical processes in the upstream or the small
drainage basin (Lawler, 1995).
Objectives of the study
The goal of this research was to assess stream bank soil and P losses within grazed
pasture stream reaches in the Rathbun Watershed in southern Iowa. Three studies were
5
conducted. The objective of the first study was to assess the effects of different livestock
stocking intensities in riparian pastures on sediment and P loads from stream bank erosion.
The null hypothesis of this study was that there were no differences in sediment and P
contributed to streams from the banks of grazed riparian pastures under different stocking
rates.
The objective of the second study was to assess the relationship between stage (flow
depth) and stream bank erosion rates from grazed pasture stream reaches under different
stocking densities and within different stream orders. The null hypothesis was that there was
no relationship between stream stages and bank erosion rates.
The objective of the third study was to relate the impact of riparian land-use and
stream morphologic characteristics (bank soil texture, stream bed slope and sinuosity) at the
field and catchment scales with stream bank erosion from grazed riparian pasture stream
reaches. The null hypothesis was that catchment land-uses and stream morphologic
characteristics did not affect stream bank soil loss along the stream reaches of grazed riparian
pastures.
Descriptions of the physiographic region and treatments
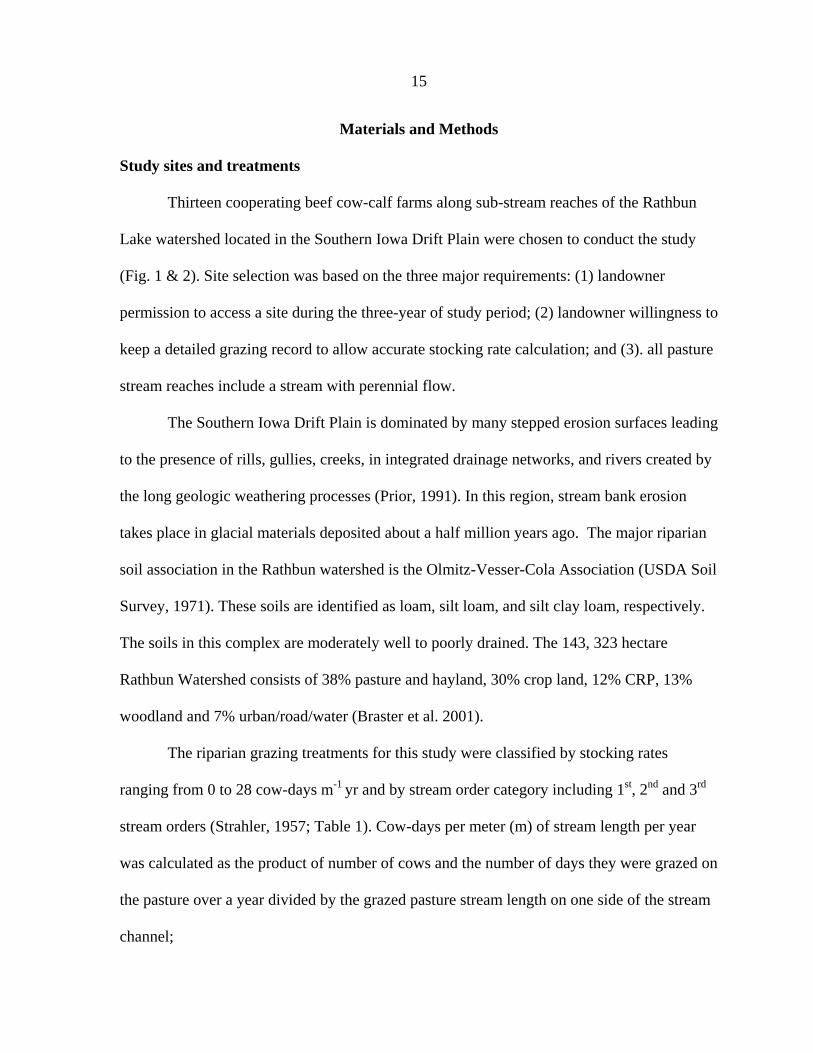
This study was conducted on thirteen cooperating beef cow-calf farms along stream
reaches in the Rathbun Lake watershed in southern Iowa. The Southern Iowa Drift Plain is
dominated by many stepped erosion surfaces and integrated drainage networks consisting of
rills, gullies, creeks, and rivers created by long geologic weathering processes (Prior, 1991).
In this region stream bank erosion takes place in glacial materials deposited about half
million years ago. Land-use within the 143,323 hectares of the Rathbun Watershed consisted
of 38% pasture and hayland, 30% crop land, 12% CRP, 13% woodland and 7%
6
urban/road/water (Braster et al. 2001). The riparian grazing treatments in the study were
classified by stocking rates that ranged from 0 to 28 cow-days m-1 yr. Additional details
regarding study site and treatments are provided within the chapters describing the study.
Thesis organization
The dissertation consists of five chapters. Chapter one is a general introduction to
sediment and P contributions to surface water from pasture land-use and describes the
importance of stream bank erosion as one of the major sources of sediment and P into
streams. The second chapter (first manuscript) is entitled “Stream bank erosion as a source of
sediment and P in grazed pastures of the Rathbun watershed in southern Iowa” and will be
submitted to the Journal of Soil and Water Conservation. Chapter 3 is entitled “Stream stage
and stream bank erosion in grazed pasture reaches in the Rathbun watershed in southern
Iowa” and will be submitted to the Journal of Environmental Quality or Journal of
Hydrology. Chapter 4 is entitled “Stream morphology, riparian land-use and stream bank
erosion within grazed pastures in the Rathbun watershed in southern Iowa: A catchment-wide
perspective” and will be submitted to the Journal of Agriculture, Ecosystems and
Environment. The chapter four is followed by a general conclusion chapter (chapter 5).
References
Agouridis, C. T., D. R. Edwards, S. R. Workman, J. R. Bicudo, B. K. Koostra, E. S. Vanzant,
and J. L. Taraba. 2005. Stream bank erosion associated with grazing practices in the
humid region. Transactions of the American Society of Agricultural Engineers 48
(1):181-190.
Alexander, R. B., Smith, R. A., Schwarz, G. E., Boyer, E. W., Nolan, J. V. and Brakebill, J.
W. 2008. Differences in phosphorus and nitrogen delivery to the Gulf of Mexico
from the Mississippi River Basin. Environ. Sci. Tech. 42:822-830.
7
Braster, M., T. Jacobson, and V. Sitzmann. 2001. Assessment and Management Strategies for
Roseboom, D. P. 1987. Case studies of stream and river restoration. In: Korab, H.
Management of the Illinois River system, the 1990's and beyond: Proceedings of a
Governor's conference on April 1-3, 1987 at Peoria, Illinois for citizens,
organizations, industry, and government representatives and resources management
professionals. Water Resources Center, University of Illinois. Urbana, Illinois 184-
194.
SAS (Statistical Analysis System) Institute. 2003. SAS Release 9.1 ed. SAS Inst., Cary,
North Carolina.
Schilling, K.E. and C.F. Wolter, 2000. Applications of GPS and GIS to Map Channel
Features in Walnut Creek, Iowa. Journal of American Water Resources Association
36(6):1423-1434.
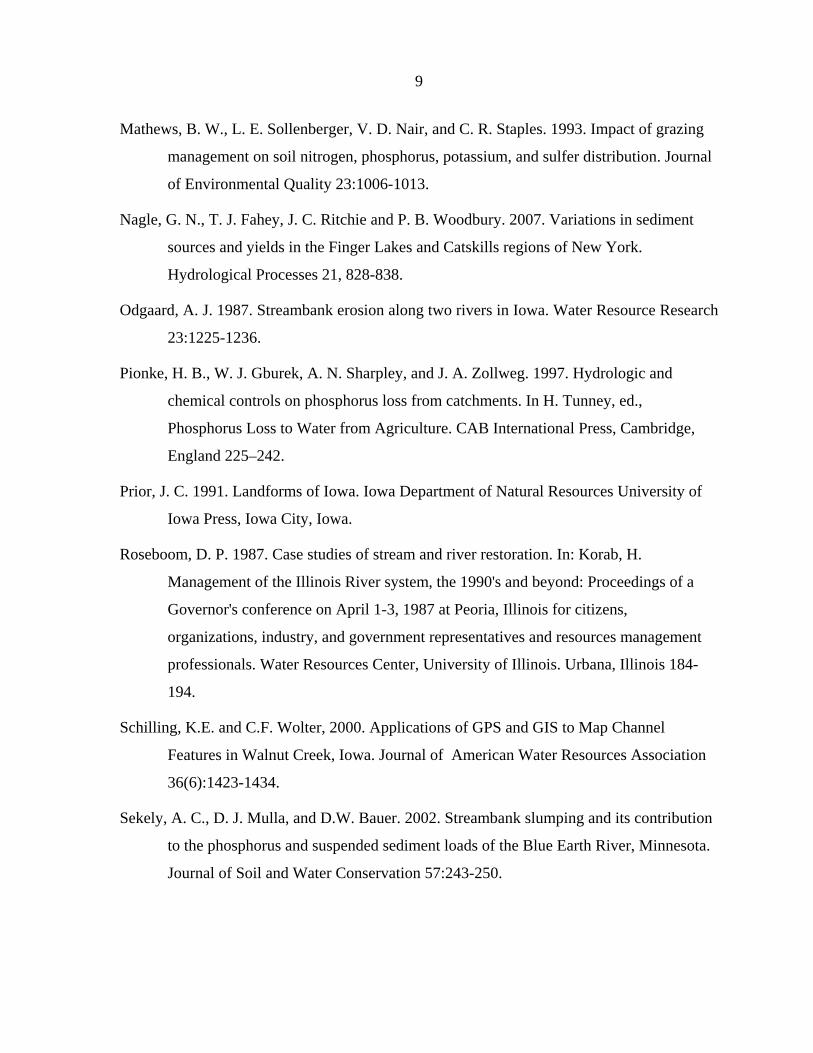
Sekely, A. C., D. J. Mulla and D.W. Bauer. 2002. Streambank slumping and its contribution
to the phosphorus and suspended sediment loads of the Blue Earth River, Minnesota.
Journal of Soil and Water Conservation 57:243-250.
Sharpley, A. N., S. J. Smith and J. W. Naney. 1987. Environmental impact of agricultural
nitrogen and phosphorus use. Journal of Agricultural and Food Chemestry. 35: 812-
817.
35
Simon A, Curini A, Darby SE, Langendoen EJ (2000) Bank and near-bank processes in an
incised channel. Geomorphology 35:193-217.
Simon, A and Collison, A.J.C. (2002) Quantifying the Mechanical and Hydrologic Effects of
Riparian Vegetation on Streambank Stability. Earth Surface Process and Landforms.
27:527-546.
Simon, A. 2008. Fine-sediment loadings to Lake Tahoe. Journal of the American Water
Resources Association 44(3), 618-639.
Simon, A., N. Pollen and E. Langendoen. 2006. Influence of two woody riparian species on
critical conditions for streambank stability: Upper Truckee River, California. Journal
of the American Water Resources Association 42(1), 99-113.
Strahler AN (1957) Quantitative analysis of watershed geomorphology. Am Geophysical
Union Trans 38:913-920
Thoma, D. P., S. C. Gupta, M. E. Bauer and C. E. Kirchoff. 2005. Airborne laser scanning
for riverbank erosion assessment. Remote Sensing of Environment 95, 493-501.
Trimble, S. W. 1994. Erosional effects of cattle on streambanks in Tennennee, U.S.A. Earth
Surface Processes and Landforms 19, 451-464.
Tufekcioglu, M. 2006. Riparian land-use impacts on stream bank soil and phosphorus losses
from grazed pastures. M.S. Thesis. Iowa State University.
U.S. Environmental Protection Agency. 2003. Strategy for water quality standards and
criteria: Setting priorities to strengthen the foundation for protecting and restoring the
nation’s waters. EPA-823-R-03-010.
United State Department of Agriculture. Soil Conservation Service. Soil Survey. Wayne
County, Iowa. 1971.
United States Department of Agriculture-Natural Resource Conservation Service. 1998.
Erosion and Sediment Delivery. Field Office Technical Guide Notice Number. IA-
198. United States Department of Agriculture and Natural Resource Conservation
Service, Des Moines, Iowa 13.
36
Wolman, M. G. 1959. Factors influencing erosion of a cohesive river bank. American Journal
of Science 257: 204-216.
Wynn, T. and S. Mostaghimi. 2006. The effects of vegetation and soil type on streambank
erosion, Southwestern Virginia, USA. Journal of the American Water Resources
Association 42 (1), 69-82.
Wynn, T. M., S. Mostaghimi, J. Burger, A. Harpold, M. Henderson and L-A. Henry. 2004.
Variation in root density along stream banks. Journal of Environmental Quality 33
(6), 2030-2039.
Zaimes, G. N. 2004. Riparian land-use practice impacts on soil and sediment characteristics,
and on stream and gully bank erosion soil and phosphorus losses with an emphasis in
grazing practices. Dissertation (Ph.D.). Iowa State University, Ames, IA.
Zaimes, G.N., R.C. Schultz, and T.M. Isenhart. 2006. Riparian land uses and precipitation
influences on stream bank erosion in central Iowa. Journal of the American Water
Resources Association. 42(1): 83-97.
Zaimes, G.N., R.C. Schultz, and T.M. Isenhart. 2008a. Total phosphorus concentrations and
compaction in riparian areas under different riparian land-uses of Iowa. Agriculture,
Ecosystems and Environment. 127: 22-30.
Zaimes, G.N., R.C. Schultz, and T.M. Isenhart. 2008b. Streambank soil and phosphorus
losses under different riparian land-uses in Iowa. Journal of the American Water
Resources Association. 44(4):935-947.
37
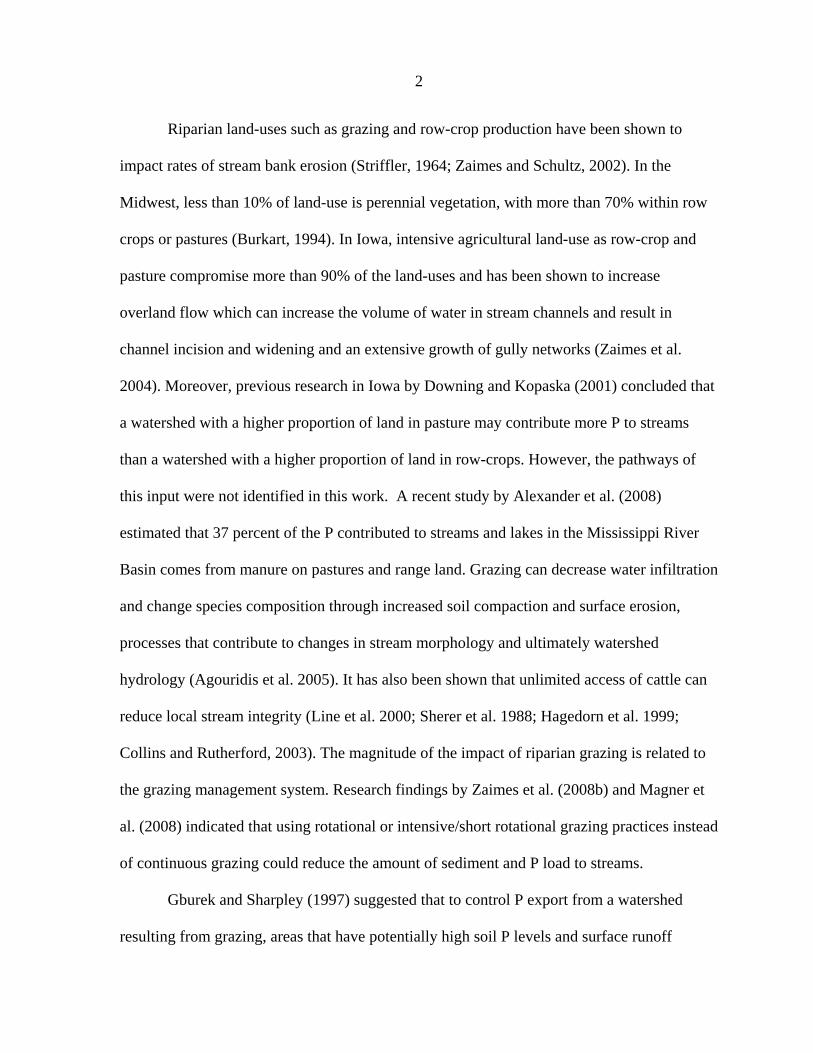
Figure 1: Location of the Rathbun watershed within the Southern Iowa Drift Plain land form region.
Rathbun Watershed
38
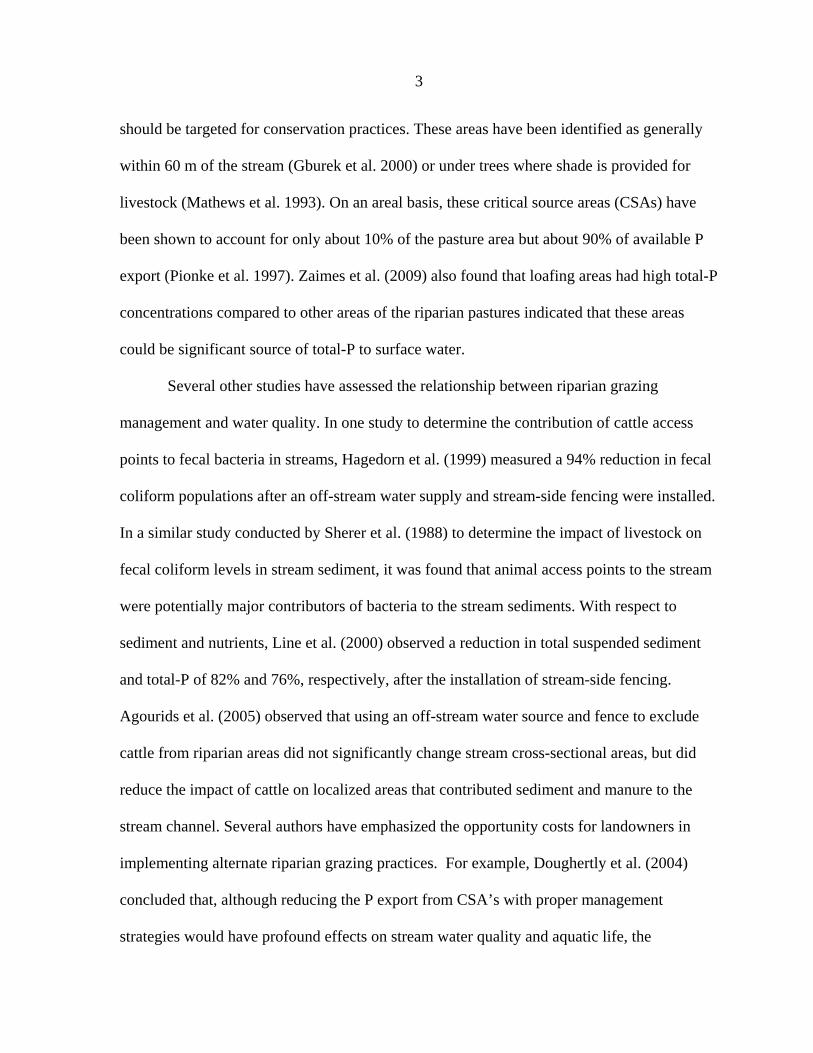
Figure 2: Location of thirteen study sites and their channel system within Rathbun Lake watershed in Southern Iowa. Numbers represent pasture identification based on the stocking rates from smallest to largest.
10
2
917
4
13
3
56
8
11
12
39
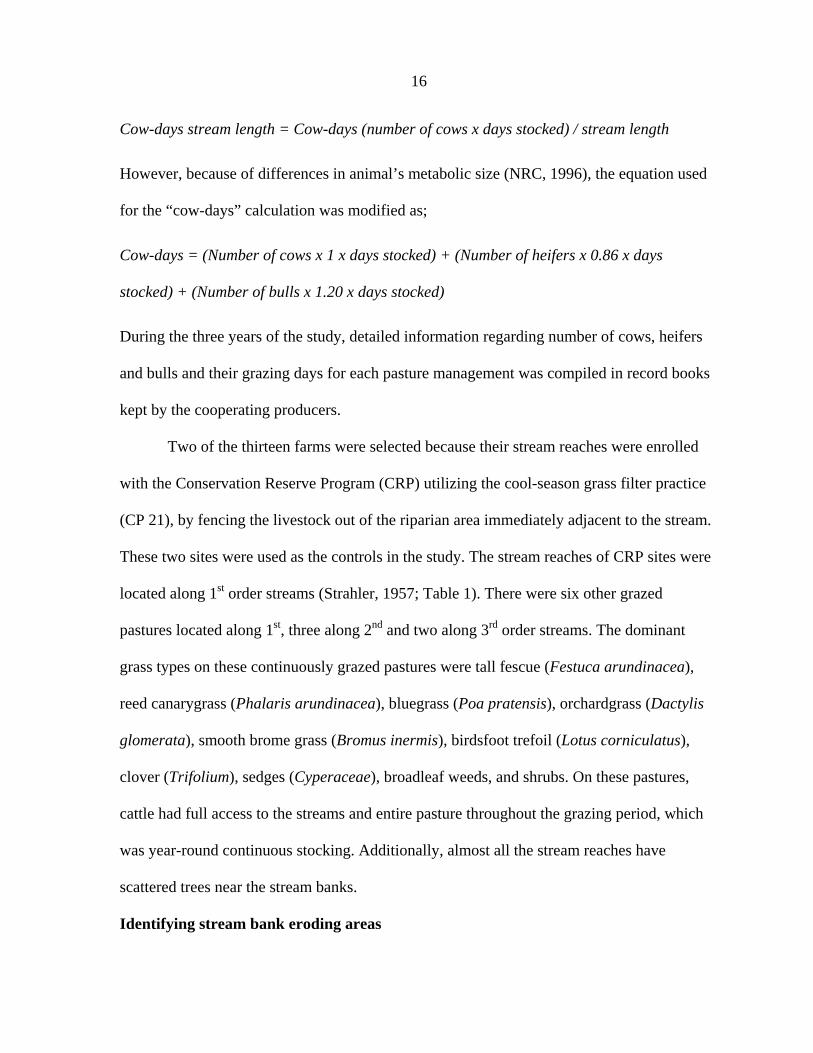
Figure 3: Schematic of steel pin placement and spacing on eroding stream banks.
Bank height < 1 m
1/2 Bank height
1 m 1 m 1 m 1 m
Bank height > 1 m
2/3 Bank height 1/3 Bank height
40
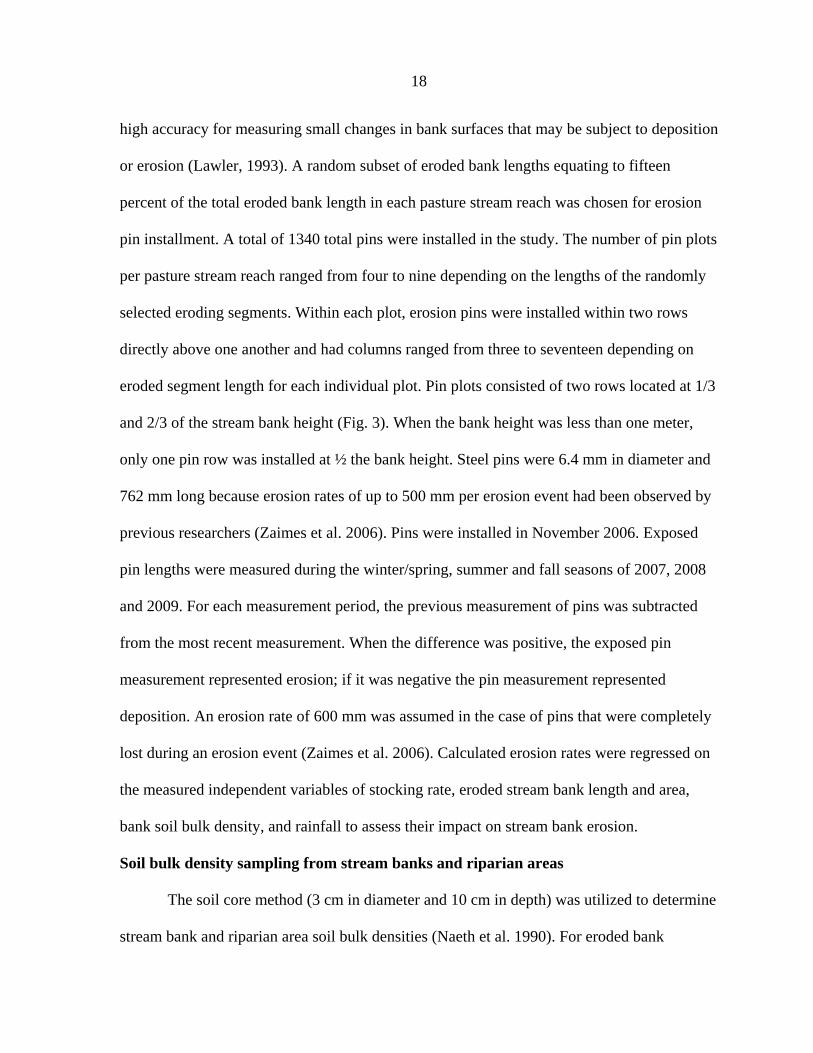
y = 0.3912x + 19.25P= 0.09 R2 = 0.2387
0
5
10
15
20
25
30
35
40
0 5 10 15 20 25 30
Stocking Rates (cow-days m-1)
Perc
ent E
rode
d Ba
nk L
engt
h
Figure 4: Relationship between stocking rates and percent eroded bank length of the total treatment reach length (includes both banks).
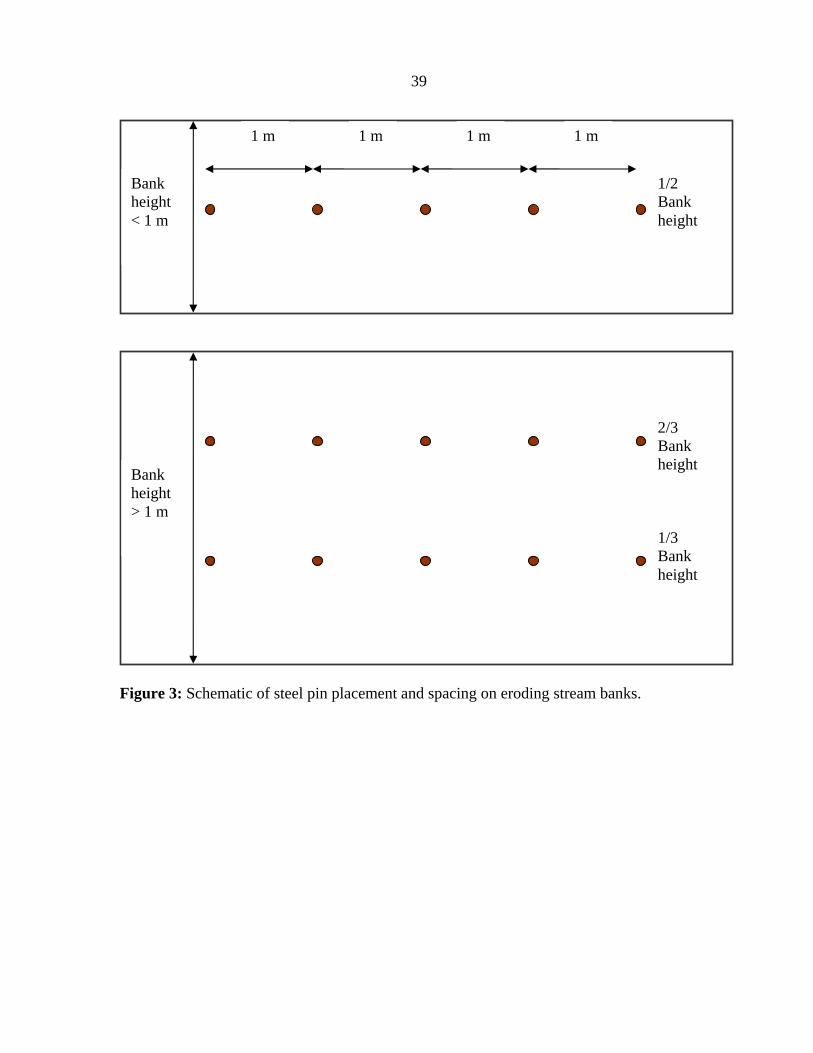
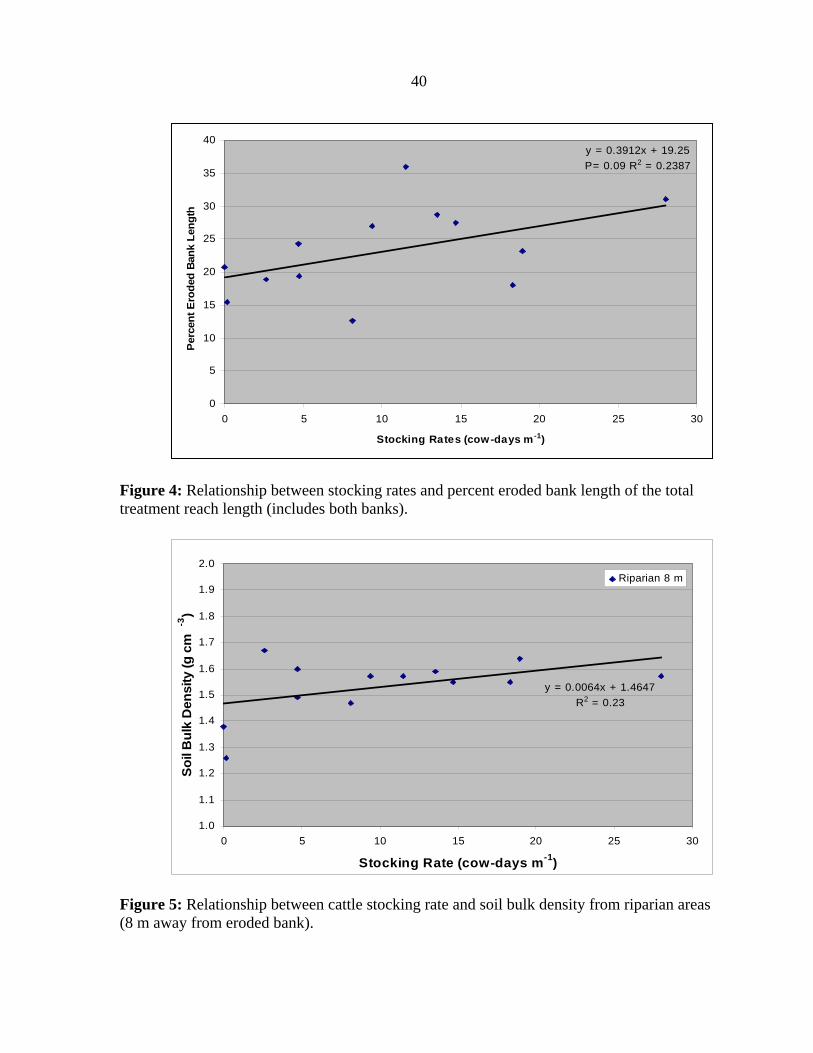
y = 0.0064x + 1.4647R2 = 0.23
1.0
1.1
1.2
1.3
1.4
1.5
1.6
1.7
1.8
1.9
2.0
0 5 10 15 20 25 30
Stocking Rate (cow-days m-1)
Soil
Bul
k D
ensi
ty (g
cm
-3)
Riparian 8 m
Figure 5: Relationship between cattle stocking rate and soil bulk density from riparian areas (8 m away from eroded bank).
41
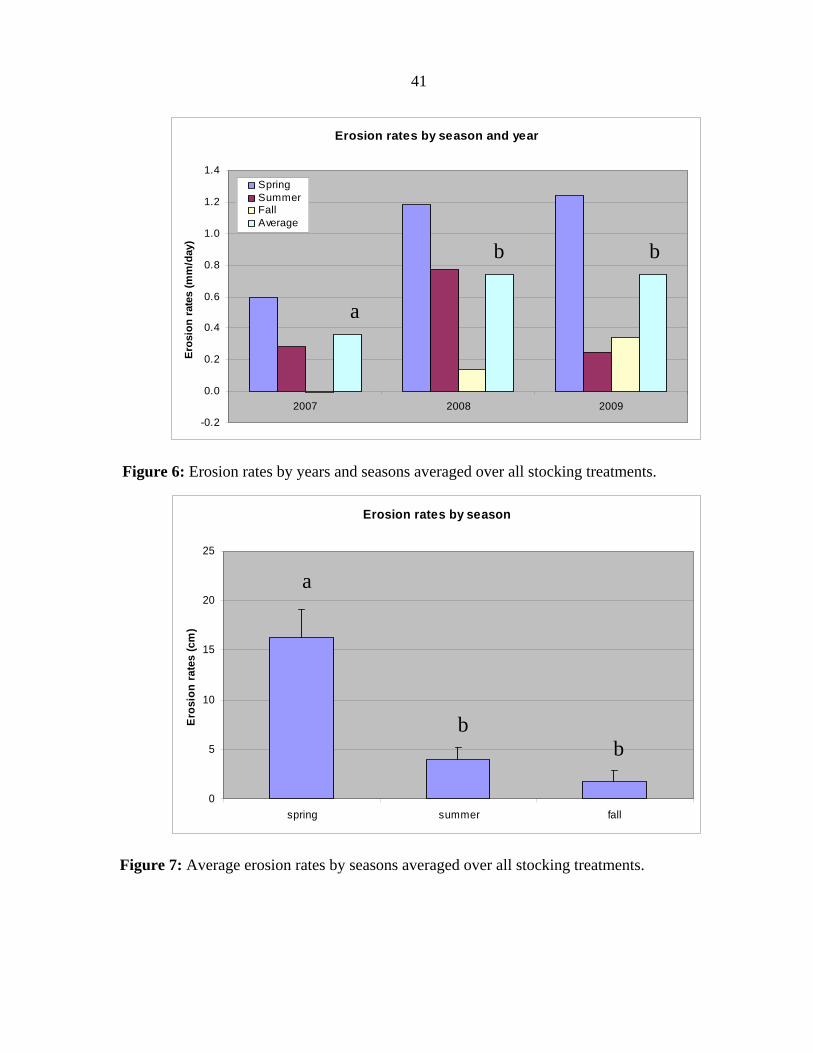
Figure 6: Erosion rates by years and seasons averaged over all stocking treatments.
Figure 7: Average erosion rates by seasons averaged over all stocking treatments.
Erosion rates by season
0
5
10
15
20
25
spring summer fall
Eros
ion
rate
s (c
m)
a
b b
Erosion rates by season and year
-0.2
0.0
0.2
0.4
0.6
0.8
1.0
1.2
1.4
2007 2008 2009
Eros
ion
rate
s (m
m/d
ay)
SpringSummerFallAverage
a
b b
42
Seasonal Precipitation Amounts by Year
0
20
40
60
80
100
120
140
2007 2008 2009
Am
ount
of P
reci
pita
tion
(cm
)SpringSummerFallTotal
Figure 8: Differences in precipitation by years and seasons averaged over all stocking treatments. Figure 9: Differences in average precipitation by seasons averaged over all stocking treatments.
a a
b
Precipitation by season
0
10
20
30
40
50
60
Spring Summer Fall
Prec
ipita
tion
(cm
)
ab a
b
43
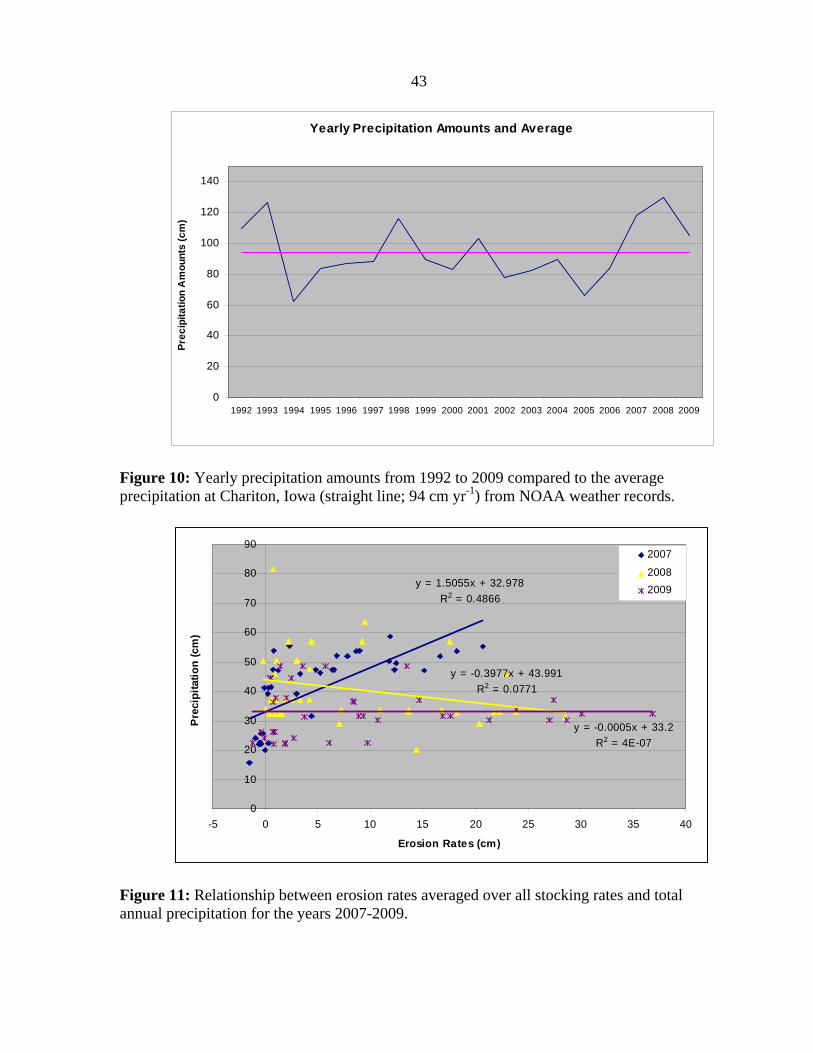
Figure 10: Yearly precipitation amounts from 1992 to 2009 compared to the average precipitation at Chariton, Iowa (straight line; 94 cm yr-1) from NOAA weather records.
y = 1.5055x + 32.978R2 = 0.4866
y = -0.3977x + 43.991R2 = 0.0771
y = -0.0005x + 33.2R2 = 4E-07
0
10
20
30
40
50
60
70
80
90
-5 0 5 10 15 20 25 30 35 40
Erosion Rates (cm)
Prec
ipita
tion
(cm
)
2007
20082009
Figure 11: Relationship between erosion rates averaged over all stocking rates and total annual precipitation for the years 2007-2009.
Figure 12: Differences in erosion rates, soil loss and total-P losses among 1st, 2nd, and 3rd stream category
0
50
100
150
200
250
300
350
400
Erosion rates Soil loss P loss
Eros
ion
(cm
), So
il lo
ss (t
onne
/km
/yr),
P lo
ss (k
g/km
/yr)
1st2nd3rd
ab
b a a
b
a
a a a
45
Table 1. Soil and total-P losses from severe and very severely eroded stream banks under different stocking rates and stream orders in the Rathbun watershed of southern Iowa.
Farm ID Stocking rate Stream order Erosion rate Bulk density Eroded area Soil loss P concentration P loss cow-days/m/yr by Strahler cm/yr g/cm3 m2/km tonne/km/yr mg/kg kg/km/yr
Site 1 (CRP) 0 1st 9 1.38 477 58 349 20
Site 2 (CRP) 0 1st 15 1.18 465 85 246 21
Site 3 (grazing) 3 3rd 38 1.58 1095 664 276 183
Site 4 (grazing) 5 2nd 25 1.48 775 285 329 94
Site 5 (grazing) 5 1st 26 1.44 645 245 281 69
Site 6 (grazing) 8 1st 34 1.35 428 196 279 55
Site 7 (grazing) 9 1st 17 1.48 605 150 305 46
Site 8 (grazing) 12 2nd 9 1.55 1121 164 322 53
Site 9 (grazing) 14 1st 10 1.47 756 116 300 35
Site 10 (grazing) 15 2nd 13 1.32 654 111 293 33
Site 11 (grazing) 18 3rd 38 1.53 1061 612 269 165
Site 12 (grazing) 19 1st 23 1.37 480 151 337 51
Site 13 (grazing) 28 1st 25 1.59 1029 416 327 136
Average CRP/spring 10 56 16
Average CRP/summer 1 6 2
Average CRP/fall 1 8 2
Average grazing/spring 18 208 62
Average grazing/summer 4 54 16
Average grazing/fall 2 21 6
Total average (CRP) 12 1.28 471 72 298 21
Total average (grazing) 24 1.46 786 283 302 84
46
CHAPTER 3
STREAM STAGE AND STREAM BANK EROSION IN GRAZED PASTURE
STREAM REACHES IN THE RATHBUN WATERSHED IN SOUTHERN IOWA
Abstract
Stream bank erosion in agricultural landscapes is a major pathway for non-point
source sediment and phosphorus loading of receiving waters. Previous studies have shown
direct and indirect effects of land use on stream bank erosion, and identified high erosion
rates within riparian pastures. One potential impact of agricultural land-use on stream bank
erosion is the alteration of stream stage characteristics, including an increase in the frequency
of high stage events over short periods of time (flash hydrograph formation). The objective
of this study was to assess the relationship between the numbers of high stream stage events,
as they directly reflect higher erosive streamflow, and contribute to stream bank soil erosion.
The study was conducted in six grazed pasture stream reaches within the Rathbun Lake
watershed, a reservoir on the Chariton River located within the Southern Iowa Drift Plain.
The erosion pin method was utilized to measure the change in stream bank erosion in
response to differences in the number of high stream stage events, which were monitored by
pressure transducers. The measured seasonal (summer and fall) erosion rates were correlated
with stream stage data to assess their impact on stream bank erosion. Approximately 75% of
the variability in stream bank erosion was found to be directly linked to the higher/erosive
stream flow (number of times of occupancy of each stage by high stream flow depth) with
the remaining 25% possibly due to stream bank soil antecedent moistures prior to a discharge
event, and differences in the duration of the high stream stages.
47
Introduction
Alteration in the hydrologic cycle of an agricultural watershed (surface runoff, soil-
water holding capacity and infiltration) is primarily driven by the change in land-use
affecting the percent of cover in row-crop or grazed pasture, and the change in precipitation
intensity, frequency, duration and amount. These changes eventually affect the pathways of
water flow between and/or within the aquatic and terrestrial ecosystems. These changes may
result in increased surface runoff, reduced water infiltration (Schultz et al. 2004) and
increased stream and base flow, and less evapotranspiration as a result of reduced soil-water
storage and seasonal plant cover (Schilling et al. 2009) As channels experience increased
numbers of erosive peak flows, channel morphology is modified through incision and
widening before new equilibrium conditions can develop (Menzel 1983).
In the Mississippi River basin, trends suggest an increase in stream flow associated
with an increase in precipitation (Lins and Slack, 1999; Kalra et al. 2008). Similarly, studies
by Guo at el. (2008) and, Tomer and Schilling (2009) suggest that climate change is the main
driving force behind increases in discharge. However, other studies suggest that increases in
stream flow cannot be completely explained by an increase in precipitation (Gebert and
Krug, 1996; Schilling and Libra, 2003; Zhang and Schilling, 2006). Studies by Raymond et
al. (2008) and Schilling at al. (2010) suggested that land-use change and management
practices are more important than the changes imposed by the climate in explaining the
increased stream flow in the Mississippi River. While it can be argued that land-use changes
provide the greatest influence on changes in streamflow characteristics and stream
morphology, Carleton et al. (2008) points out that alteration in climate and weather patterns
is under the influence of changes in land cover and land use.
48
In the last 150 years, 99% of Iowa’s tall grass prairie and 95% of its wetlands have
been converted to row crop and grazed pasture agriculture (Whitney, 1994; Burkhart et al.
1994). Most of the wetlands have been converted to agricultural land through the use of
artificial subsurface drainage. Along with these changes, streams were also channelized to
provide drainage outlets and to increase arable land area for agricultural production. Such
changes have been documented to increase stream gradient and channel incision (Hupp,
1992) and stream discharge, increase sediment and nutrient losses (Knox, 2001; Schilling
2004), and reduce stream sediment storage (Kroes and Hupp, 2010). Additionally, a
reduction in soil-water storage has resulted in an increase and acceleration of peak discharge
leading to flashy hydrographs during storm events (Bormann et al. 1999). Another study by
Knox (2001) concluded that agricultural land use, along with the artificial subsurface
drainage and channelization, has increased the peak discharges from high-frequency floods to
such an extent that makes comparison of modern process rates with those prior to human
disturbance a formidable challenge. The effects of land use change on stream flow and
discharge, channel incision and form and ultimately on stream bank erosion have been well-
documented by a number of other studies as well (Straub, 2004; Karwan et al. 2001;
Wallbrink and Olley, 2004; Fitzpatrick, 2001).
Stream bank erosion accounts for a significant portion of the total soil and
phosphorus (P) losses to receiving water bodies. Studies by Laubel et al. (1999; 2003), and
Schilling and Wolter (2000) have reported that bank erosion can contribute significant
amounts of suspended sediment to fluvial systems, accounting for at least half of a
watershed’s annual suspended sediment export. Bartley (2004) reported that gully and stream
bank erosion contributed 48% of the total sediment load to an estuary. Ranges of total-P
49
contribution to channels from stream bank erosion have been documented from 56 %
(Roseboom, 1987), 15-40 % (Laubel et al. 2003), to 7-10 % (Sekely et al. 2002).
The objective of the study was to assess the relationship between stream bank erosion
rates during summer and fall seasons and peak stream flow depths within several watersheds
in Southern Iowa. The null hypothesis was that variability in stream bank erosion rates was
not affected and/or correlated by the variation in stream stages.
Materials and Methods
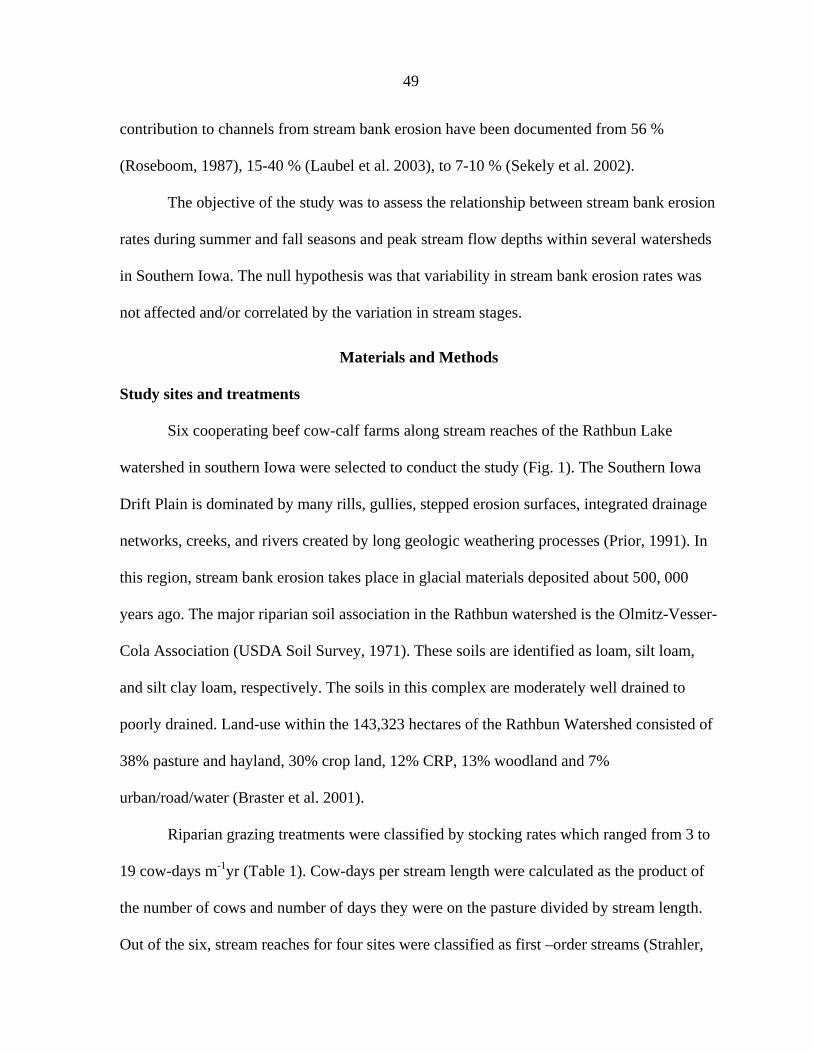
Study sites and treatments
Six cooperating beef cow-calf farms along stream reaches of the Rathbun Lake
watershed in southern Iowa were selected to conduct the study (Fig. 1). The Southern Iowa
Drift Plain is dominated by many rills, gullies, stepped erosion surfaces, integrated drainage
networks, creeks, and rivers created by long geologic weathering processes (Prior, 1991). In
this region, stream bank erosion takes place in glacial materials deposited about 500, 000
years ago. The major riparian soil association in the Rathbun watershed is the Olmitz-Vesser-
Cola Association (USDA Soil Survey, 1971). These soils are identified as loam, silt loam,
and silt clay loam, respectively. The soils in this complex are moderately well drained to
poorly drained. Land-use within the 143,323 hectares of the Rathbun Watershed consisted of
38% pasture and hayland, 30% crop land, 12% CRP, 13% woodland and 7%
urban/road/water (Braster et al. 2001).
Riparian grazing treatments were classified by stocking rates which ranged from 3 to
19 cow-days m-1yr (Table 1). Cow-days per stream length were calculated as the product of
the number of cows and number of days they were on the pasture divided by stream length.
Out of the six, stream reaches for four sites were classified as first –order streams (Strahler,
50
1957; Table 1) and the other two sites were located on second and third order streams,
respectively.
The dominant grass types on these continuously grazed pastures were tall fescue
(Ed.) North American Agroforestry: An integrated Science and Practice, 2nd Ed.
American Society of Agonomy, Madison, WI.
Sekely, A. C., D. J. Mulla, and D.W. Bauer. 2002. Streambank slumping and its contribution
to the phosphorus and suspended sediment loads of the Blue Earth River, Minnesota.
Journal of Soil and Water Conservation 57:243-250.
Simon, A and Collison, A.J.C. 2002. Quantifying the Mechanical and Hydrologic Effects of
Riparian Vegetation on Streambank Stability. Earth Surface Process and Landforms
27:527-546.
Strahler A. N. 1957. Quantitative analysis of watershed geomorphology. Am Geophysical
Union Trans 38:913-920.
Straub, T. D. 2004. St. Louis metro east region sediment and geomorphic study. Proceedings
of the 2004 World Water and Environmetal Resources Congress: Critical Transitions
in Water and Environmetal Resources Management p 4463-4474.
Tomer, M. D. and K. E. Schilling. 2009. A simple approach to distinguish land-use and
climate-change effects on watershed hydrology. Journal of Hydrology 376, 24-33.
United State Department of Agriculture. Soil Conservation Service. Soil Survey. Wayne
County, Iowa 1971.
Wallbrink, P and Jon Olley. 2004. Sources of fine grained sediment in incised and un-incised
channels, Jugiong Creek, NSW, Australia. International Association of Hydrological
Sciences 288, 165-169.
Whitney, G. G., 1994. From coastal wilderness to fruited plain. Cambridge University Press,
Cambridge, United Kingdom.
62
Wolman, M. G. 1959. Factors influencing erosion of a cohesive river bank. American Journal
of Science 257: 204-216.
Zaimes, G. N., R. C. Schultz and T. M. Isenhart. 2006. Riparian land-uses and precipitation
influences on stream bank erosion in central Iowa. Journal of American Water
Resources Association 42: 83-97.
Zaimes, G. N., R. C. Schultz, and T. M. Isenhart. 2004. Stream bank erosion adjacent to
riparian forest buffers, row-crop fields, and continuously-grazed pastures along Bear
Creek in Central Iowa. Journal of Soil and Water Conservation 59(1):19-27.
Zaimes, G. N., R. C. Schultz, and T. M. Isenhart. 2008b. Stream bank soil and phosphorus
losses under different riparian land-uses in Iowa. Journal of the American Water
Resources Association. 44 (4): 935-947.
Zhang, Y. K. and K. E. Schilling. 2006. Increasing streamflow and baseflow in Mississippi
River since the 1940s: Effect of land use change. Journal of Hydrology 324, 412-422.
63
Figure 1. Stream stage (transducer) locations/sites and catchments stream lengths within the Rathbun Watershed in Southern Iowa. Numbers correspond to site identification (Id). Site 1 is located on the second order stream. Site 6 is in third order stream and all the other sites (2, 3, 4 and 5) are in first order stream category (Strahler, 1957).
6
3
4 5
2 1
64
Figure 2. Schematic of steel pin placement and spacing on eroding stream banks.
Bank height < 1 m
1/2 Bank height
1 m 1 m 1 m 1 m
Bank height > 1 m
2/3 Bank height 1/3 Bank height
65
Figure 3. Location of the transducer on stream bank and five different preset stream stage sections and their predicted erosion response values (section 1= 0, section 2= 1, section 3 = 1, section 4= 1 and section 5= 1). The assigned/predicted erosion values for each section were based on the assumption that there is a linear relationship between stream bank erosion rate and stage. Note: since depth of flow within section 1 represents base flow condition, its effect on bank erosion was not accounted for in the relationship between stage and erosion rate.
Section 1 (base flow)
Section 4
Section 3
Section 2
Section 5 (flooding stage)
Well
Transducer
Cable
Stream bank
Stream bank
66
0
5
10
15
20
25
30
Site 1 Site 2 Site 3 Site 4 Site 5 Site 6
Eros
ion
Rate
s (c
m)
FallSummerSpring
Figure 4. Seasonal differences in average stream bank erosion from six different sites during the period of fall 2007 – fall 2009.
R2 = 0.9843
R2 = 0.9878
0
2
4
6
8
10
12
14
10 12 14 16 18 20 22 24 26 28
Spring Erosion Rates (cm)
Sum
mer
and
Fal
l Ero
sion
Rat
es (c
m)
Poly. (Spring-Summer)Poly. (Spring-Fall)
Figure 5. Relationship between erosion rates of spring and summer, and between spring and fall.
Figure 6a. Total stream stage by event based that were occupied from August 9, 2007 to November 24, 2009 and 5 different stage sections, including section 1 (0 to 50 cm), section 2 (51 to 99 cm), section 3 (100 to 149 cm), section 4 (150 to 198 cm) and section 5 (199 to 248 cm) from study site 1. Note; parallel stage lines in section 1 shows the winter time range when there was no transducer in the wells. Stream stage values were represented in Table 2.
y = 0.0763x - 0.4441R2 = 0.9976
-0.6
-0.4
-0.2
0.0
0.2
0.4
0.6
0.8
1.0
1.2
0 5 10 15 20
Stream stages including all the sections (#)
Eros
ion
rate
s (c
m)
Figure 6b. Relationship between total stream stage (occupancy of section 2 through section 5 in number of times) and erosion rates across seasons (summers and falls) from study site 1.
68
0
46
91
137
182
228
273
8/2/20
07
11/2/
2007
2/2/20
08
5/2/20
08
8/2/20
08
11/2/
2008
2/2/20
09
5/2/20
09
8/2/20
09
11/2/
2009
Stre
am S
tage
(cm
)
Water Depth (cm)Flooding Stage (cm)
Figure 7a. Total stream stage by event based that were occupied from August 2, 2007 to November 2, 2009 and 5 different stage sections, including section 1 (0 to 46 cm), section 2 (47 to 91 cm), section 3 (92 to 137 cm), section 4 (138 to 182 cm) and section 5 (183 to 228 cm) from study site 2.
y = 0.0472x - 0.075R2 = 0.6448
-1.0
-0.5
0.0
0.5
1.0
1.5
0 5 10 15 20 25 30 35
Stream stages including all the sections (#)
Eros
ion
rate
s (c
m)
Figure 7b. Relationship between total stream stage (occupancy of section 2 through section 5 in numbers of time) and responded erosion rates across seasons (summers and falls) from study site 2.
69
0
57
114
171
228
285
342
399
8/2/20
07
11/2/
2007
2/2/20
08
5/2/20
08
8/2/20
08
11/2/
2008
2/2/20
09
5/2/20
09
8/2/20
09
11/2/
2009
Stre
am S
tage
(cm
)
Water Depth (cm)Flooding Stage (cm)
Figure 8a. Total stream stage by event based that were occupied from August 2, 2007 to November 2, 2009 and 5 different stage sections, including section 1 (0 to 57 cm), section 2 (58 to 114 cm), section 3 (115 to 171 cm), section 4 (172 to 228 cm) and section 5 (229 to 285 cm) from study site 3.
y = 0.1234x - 1.6736R2 = 0.8408
-1.5
-1.0
-0.5
0.0
0.5
1.0
1.5
2.0
2.5
3.0
3.5
0 5 10 15 20 25 30 35 40
Stream stages including all the sections (#)
Eros
ion
rate
s (c
m)
Figure 8b. Relationship between total stream stage (occupancy of section 2 through section 5 in number of times) and responded erosion rates across seasons (summers and falls) from study site 3.
70
0
49
98
146
195
244
293
8/2/20
07
11/2/
2007
2/2/20
08
5/2/20
08
8/2/20
08
11/2/
2008
2/2/20
09
5/2/20
09
8/2/20
09
11/2/
2009
Stre
am S
tage
(cm
)
Water Depth (cm)Flooding Stage (cm)
Figure 9a. Total stream stage by event based that were occupied from August 2, 2007 to November 2, 2009 and 5 different stage sections, including section 1 (0 to 49 cm), section 2 (50 to 98 cm), section 3 (99 to 146 cm), section 4 (147 to 195 cm) and section 5 (196 to 244 cm) from study site 4.
y = 0.1293x - 0.3269R2 = 0.9756
-1.0
0.0
1.0
2.0
3.0
4.0
5.0
0 5 10 15 20 25 30 35 40
Stream stages including all the sections (#)
Eros
ion
rate
s (c
m)
Figure 9b. Relationship between total stream stage (occupancy of section 2 through section 5 in number of times) and responded erosion rates across seasons (summers and falls) from study site 4.
71
0
53
106
159
212
265
318
371
8/2/20
07
11/2/
2007
2/2/20
08
5/2/20
08
8/2/20
08
11/2/
2008
2/2/20
09
5/2/20
09
8/2/20
09
11/2/
2009
Stre
am S
tage
(cm
)
Water Depth (cm)Flooding Stage
Figure 10a. Total stream stage by event based that were occupied from August 2, 2007 to November 2, 2009 and 5 different stage sections, including section 1 (0 to 53 cm), section 2 (54 to 106 cm), section 3 (107 to 159 cm), section 4 (160 to 212 cm) and section 5 (213 to 265 cm) from study site 5.
y = 0.2323x + 4.0815R2 = 0.1941
0.0
2.0
4.0
6.0
8.0
10.0
12.0
14.0
16.0
0 5 10 15 20 25 30 35
Stream stages including all the sections (#)
Eros
ion
rate
s (c
m)
Figure 10b. Relationship between total stream stage (occupancy of section 2 through section 5 in numbers of time) and responded erosion rates across seasons (summers and falls) from study site 5.
72
0
76
153
229
305
381
458
8/2/20
07
11/2/
2007
2/2/20
08
5/2/20
08
8/2/20
08
11/2/
2008
2/2/20
09
5/2/20
09
8/2/20
09
11/2/
2009
Stre
am S
tage
(cm
)
Water Depth (cm)Flooding Stage (cm)
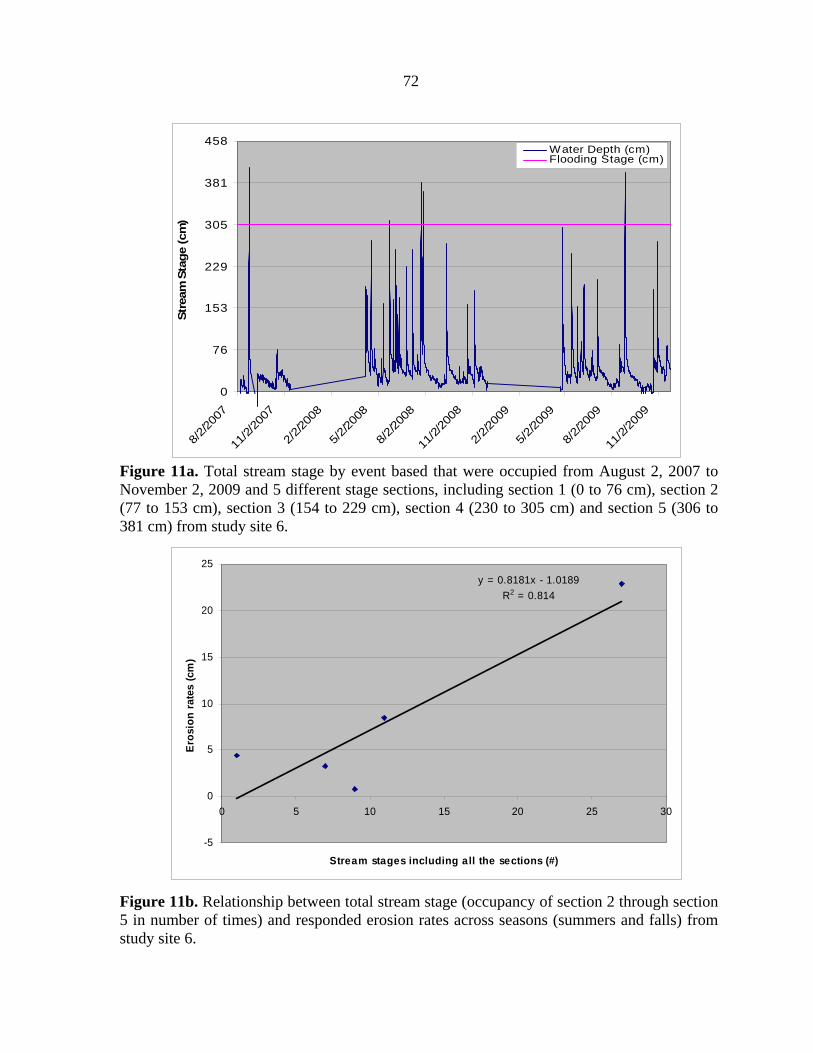
Figure 11a. Total stream stage by event based that were occupied from August 2, 2007 to November 2, 2009 and 5 different stage sections, including section 1 (0 to 76 cm), section 2 (77 to 153 cm), section 3 (154 to 229 cm), section 4 (230 to 305 cm) and section 5 (306 to 381 cm) from study site 6.
y = 0.8181x - 1.0189R2 = 0.814
-5
0
5
10
15
20
25
0 5 10 15 20 25 30
Stream stages including all the sections (#)
Eros
ion
rate
s (c
m)
Figure 11b. Relationship between total stream stage (occupancy of section 2 through section 5 in number of times) and responded erosion rates across seasons (summers and falls) from study site 6.
73
Table 1. Studied pasture stream reach (site) characteristics including stream length, stocking rates, stream reach bed slope, stream bed sinuosity, pasture size and total erosion rates.
Site Id Stream Stocking rates Stream bed Stream Pasture Total erosion length (m) (Cow-days/m yr) slope (%) sinuosity size (ha) rates (cm)
Site 1 1138 12 0.4 1.5 55 1
Site 2 1120 14 0.8 1.4 29 3
Site 3 1040 9 0.6 2.0 107 4
Site 4 890 19 1.6 1.1 25 9
Site 5 306 8 1.6 1.3 3 37
Site 6 922 3 1.5 1.2 29 40
Note: The total erosion rates represent the sum of the erosion rates from fall 2007, summer 2008, fall 2008, summer 2009 and fall 2009.
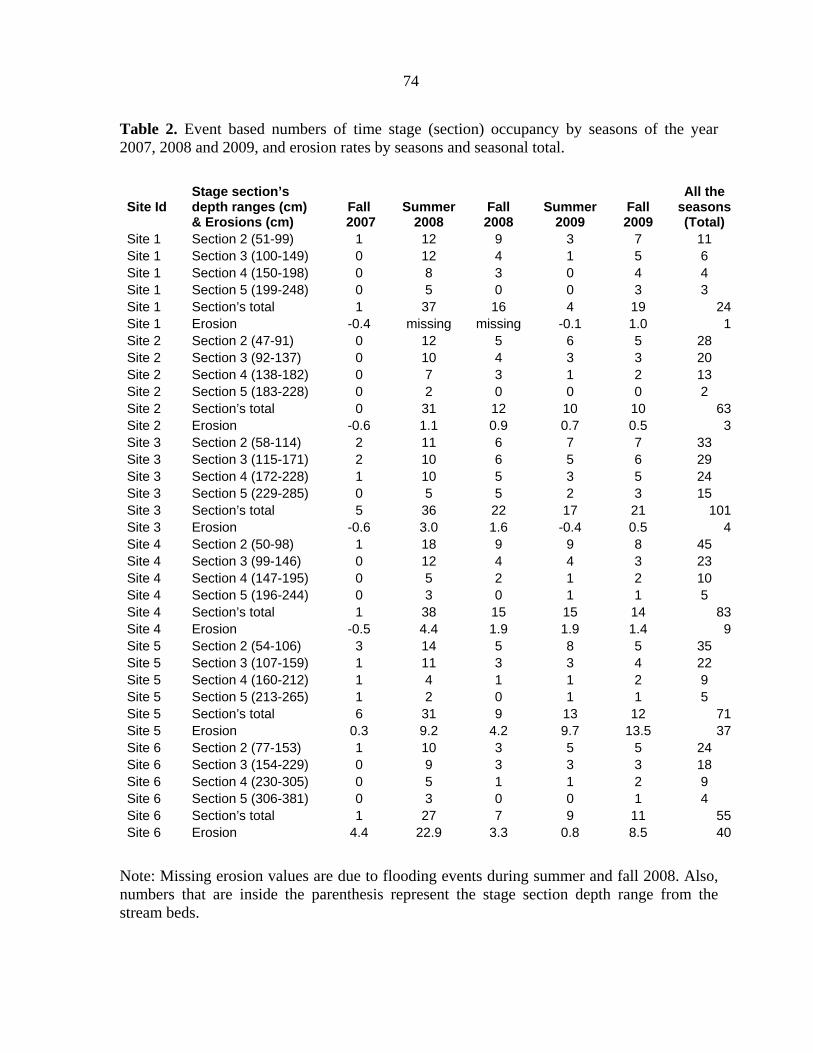
74
Table 2. Event based numbers of time stage (section) occupancy by seasons of the year 2007, 2008 and 2009, and erosion rates by seasons and seasonal total.
Note: Missing erosion values are due to flooding events during summer and fall 2008. Also, numbers that are inside the parenthesis represent the stage section depth range from the stream beds.
75
CHAPTER 4
STREAM MORPHOLOGY, RIPARIAN LAND-USE AND STREAM BANK
EROSION WITHIN GRAZED PASTURES IN THE RATHBUN WATERSHED IN
SOUTHERN IOWA: A CATCHMENT-WIDE PERSPECTIVE
Abstract
Factors influencing stream bank erosion at the field scale include watershed land-use,
stream morphology, and riparian management practices such as cropping and grazing. This
study assesses the relationship of riparian land-use, stream morphologic characteristics (bank
soil texture, stream bed slope and sinuosity), and catchment scale variables to stream bank
erosion within grazed riparian pastures in the Southern Iowa Drift Plain. Thirteen
cooperating beef cow-calf farms and their catchments in the Rathbun Lake watershed in
South Central Iowa were chosen to conduct this study. Stream bank erosion rates were
determined during three years using the erosion pin method. Results suggest that the
integration of stream morphologic characteristics and riparian land-uses at both the field and
catchment scale are necessary to explain the current level of stream bank erosion and
possibly for predicting a time-line for the channel to reach channel equilibrium according to
the “channel evolution model”. Larger catchment size or catchments with more total channel
length were found to experience more bank erosion due to greater magnitude of discharge
and taller saturated banks associated with larger and more incised channels. A significant
positive relationship between percent sand in the bank soil and bank erosion rates infers that
bank soils with less cohesiveness are more erodible. Catchment-scale assessments of the
thirteen watersheds showed that within the 50 m corridor on both sides of the stream, 46 to
76
61 % of riparian area was devoted to agricultural use and only 6 to 11 % was in ungrazed
perennial vegetation, much of it enrolled in the Conservation Reserve Program. Overall,
intensive agricultural use of riparian areas in such extent of time and scale could be directly
and/or indirectly related to excessive amounts of stream bank soil loss to stream and lake
leading to their impairment and reduction of ecological services.
Introduction
A river’s ability to erode and transport materials has been shown to be “a balance
between driving and resisting forces (Ritter et al. 2002). Driving force is directly related to
the potential energy produced by the flow/discharge characteristics of a given stream cross-
section. The driving force in Iowa streams has increased as a result of an increase in
precipitation and the impact on surface runoff resulting from the conversion of 99% of
Iowa’s tall grass prairie and 95% of its wetlands to row crop and grazed pasture agriculture
(Whitney, 1994; Burkart et al. 1994). In addition, some streams were also channelized to
increase arable land area for more agricultural production (Guthrie, 2000). The resulting
higher stream gradients and discharge has increased channel incision (Hupp, 1992) and the
ability of streams to carry larger loads of sediment and nutrients throughout many parts of the
Mississippi basin (Anderson 2000; Knox, 2001; Schilling 2004). Since stream discharge and
gradient are proportional to sediment load and particle size (Lane, 1955), an increase in
discharge and/or slope (driving force) must be balanced with an increase in sediment yield
and/or sediment size (resisting forces). In other words, any increase in discharge
characteristics of an unstable stream channel must be followed with a morphological
adjustment to dissipate the increased hydro-energy to create a new “state of equilibrium”.
The morphological adjustment first starts with incision followed by widening and then
77
aggradation, finally re-creating bank heights that are less than the critical height for
instability and failure (Simon and Klimetz, 2008). Over the long term, the change in the
cross-sectional profile initiated by channel incision translates into a change in the
longitudinal view as continued adjustments in the channel advance into the upper watershed
(Simon and Rinaldi, 2006). Stream sinuosity is increased through meandering at the lower
gradient downstream end of the channel network to reduce flow velocity in an effort to
establish an equilibrium state from the modified upstream portion of the channel system.
Such adjustments could take many decades to complete (Yan et al., 2010).
The impact of local riparian land-use factors such as grazing intensity on stream bank
erosion and/or cross-sectional channel modification has not been well established. This is
partially due to the many interacting factors such as bank soil properties (cohesion of the
channel bank soil or major textural unit), stream flow characteristics, and channel
morphology (stream bed slope and sinuosity), all of which can play crucial roles in the
adjustment of bank physiography (Simon and Rinaldi, 2006). However, some studies have
concluded that riparian cattle grazing can initiate the first step towards greater eroded bank
area and consequent destabilization (Trimble, 1994; Evans et al. 2006; Magner et al. 2008),
and that grazing can be considered as a geomorphic agent (Trimble, 1994). Indeed, a three-
year study by Zaimes et al. (2008b) recorded greater stream bank erosion rates from grazed
pastures (continuous, rotational, and intensive rotational) than from riparian forest buffers
and grass filters.
In a riparian grazing system, the improvement in stream water quality will most likely
be achieved with a set of integrated best management practices (BMPs) that are linked with
stream geomorphic and hydrologic characteristics (Agouridis et al. 2005). Additional
78
resistance to stream flow can be introduced with a continuous cover of ground vegetation on
the stream banks. This riparian vegetation can increase bank stability and soil strength by
mechanical reinforcement of the soil as a result of soil-root binding and from the
hydrological effects of soil moisture extraction by transpiration, which leads to a reduction in
soil pore-water pressure (Simon and Collison, 2002). While herbaceous vegetation can
effectively reduce the erosive effect of overland flow, woody vegetation has been observed to
be more effective in reducing high stream bank erosion rates (Harmel et al. 1999; Geyer et al.
2000; Zaimes et al. 2004, 2006) and in promoting channel stabilization (Dosskey et al. 2010).
A recent study by Knight et al. (2010) suggests that the addition of a grass zone to the outside
of a riparian forest buffer would reduce sediment loss resulting from ephemeral gullies and
increase stream water quality. Another study by De Baets et al. (2008) concluded that grass
vegetation increased soil strength in the topsoil (0-10 cm) whereas shrubs increased soil
strength in the subsoil (0-50 cm). Other BMPs, such as timing of cattle grazing, non-riparian
shade, alternative water sources, and livestock exclusion with fencing, have been shown to
effectively increase stream bank stabilization (Mclnnis and Mclver, 2009; Ranganath et al.
2009) and stream water integrity (Williamson et al. 1996; Line et al. 2000; Byers et al. 2005;
Miller et al. 2010).
The purpose of this study was to assess the effect of riparian land use and stream
morphologic characteristics including stream bank soil particle size, and stream bed slope
and sinuosity at the field and catchment scale, on stream bank erosion measured in grazed
riparian stream reaches.
Materials and Methods
Study sites and treatments
79
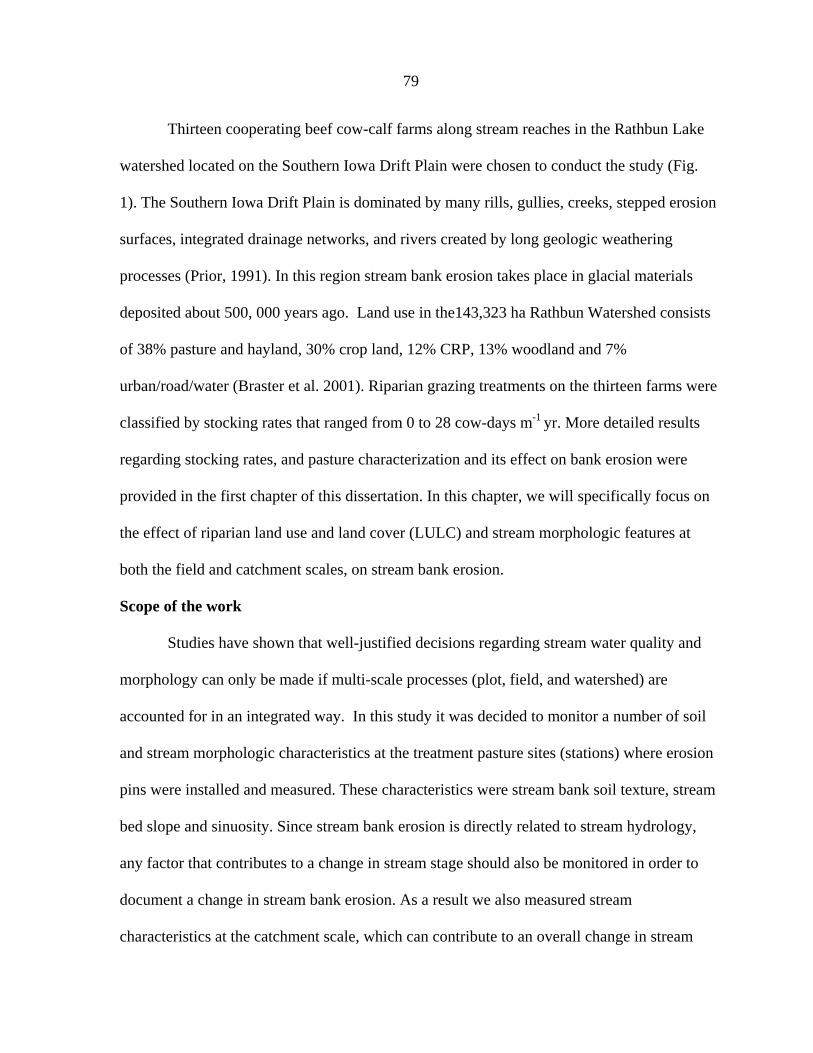
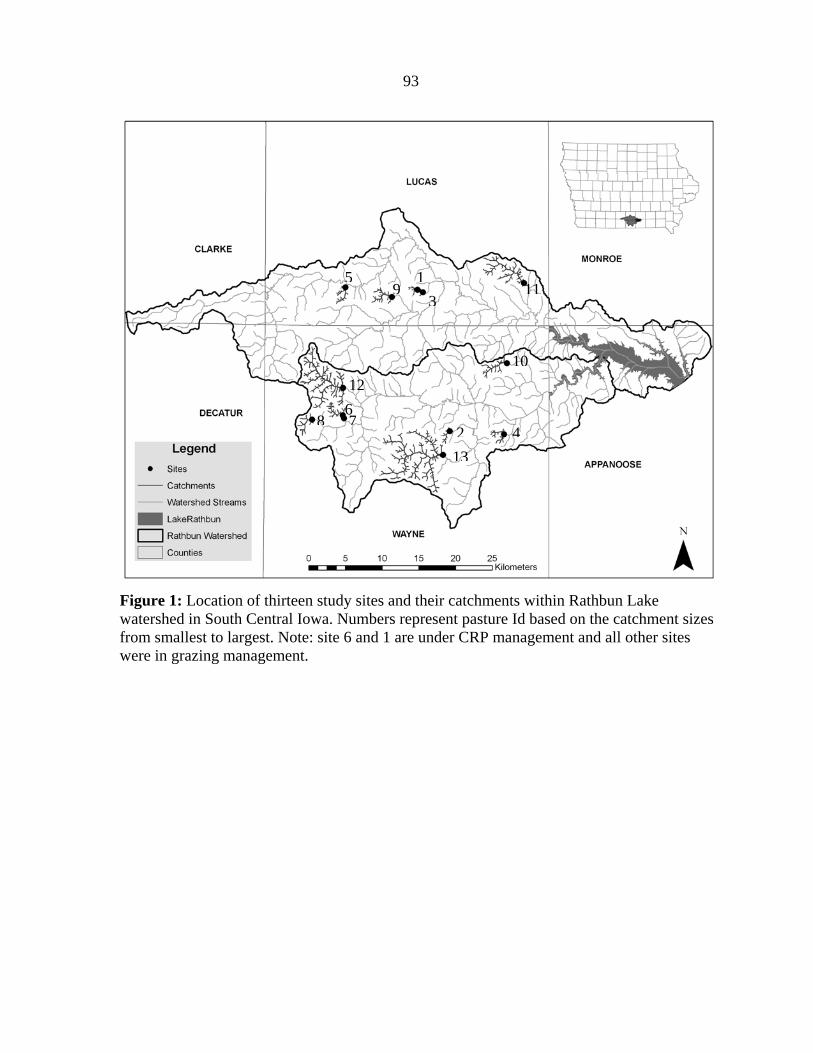
Thirteen cooperating beef cow-calf farms along stream reaches in the Rathbun Lake
watershed located on the Southern Iowa Drift Plain were chosen to conduct the study (Fig.
1). The Southern Iowa Drift Plain is dominated by many rills, gullies, creeks, stepped erosion
surfaces, integrated drainage networks, and rivers created by long geologic weathering
processes (Prior, 1991). In this region stream bank erosion takes place in glacial materials
deposited about 500, 000 years ago. Land use in the143,323 ha Rathbun Watershed consists
of 38% pasture and hayland, 30% crop land, 12% CRP, 13% woodland and 7%
urban/road/water (Braster et al. 2001). Riparian grazing treatments on the thirteen farms were
classified by stocking rates that ranged from 0 to 28 cow-days m-1 yr. More detailed results
regarding stocking rates, and pasture characterization and its effect on bank erosion were
provided in the first chapter of this dissertation. In this chapter, we will specifically focus on
the effect of riparian land use and land cover (LULC) and stream morphologic features at
both the field and catchment scales, on stream bank erosion.
Scope of the work
Studies have shown that well-justified decisions regarding stream water quality and
morphology can only be made if multi-scale processes (plot, field, and watershed) are
accounted for in an integrated way. In this study it was decided to monitor a number of soil
and stream morphologic characteristics at the treatment pasture sites (stations) where erosion
pins were installed and measured. These characteristics were stream bank soil texture, stream
bed slope and sinuosity. Since stream bank erosion is directly related to stream hydrology,
any factor that contributes to a change in stream stage should also be monitored in order to
document a change in stream bank erosion. As a result we also measured stream
characteristics at the catchment scale, which can contribute to an overall change in stream
80
stage at the treatment pasture sites. These characteristics at the catchment scale (whole
channel system) included current land-use management of riparian areas within a 50 m strip
on either side of the stream reaches, stream bed slope, sinuosity, and catchment stream
length.
Stream bank soil particle size analysis
Stream bank soil was sampled using the soil core method (3 cm in diameter and 10
cm in depth; Naeth et al. 1990). Soil samples for texture analysis were collected from eroded
bank segments of the pasture stream reaches, where erosion pin plots were located. Soil
sample collection was based on horizonation of stream bank soils. Two soil cores from the
mid point of each horizon were collected for laboratory analysis. Since each soil horizon
from the eroded bank surface had different heights, height-weighted averages were used to
calculate mean texture for the mean bank height for the plot. Soil particle sizes were
determined by the pipet method, which relies on a solution of sodium hexametaphosphate to
disperse soil aggregates into individual textural units (Gee and Bauder, 1986).
Stream bed slope and sinuosity
Slope and sinuosity measurements were calculated at two different scales using
Geographic Information System (GIS) Arc Map 9.2 tools. One set of measurements was
calculated at the grazed pasture stream reach (station) scale where the erosion pin plots were
located. The other set included measurements at the catchment scale of stream reaches
located above each of the treatment pastures. Stream bed slope values were calculated as the
difference in elevations (rise) between the lowest and highest point of stream reach divided
by the horizontal stream length (run) of a given stream reach. Sinuosity was estimated by
first digitizing the total meandered length of a given stream reach at one meter resolution
81
from 2002 Color Infrared digital orthophotos and then dividing that value by the straight line
valley length of the reach.
Land-use determination within 50 m strips on either side of the stream
Land-use was determined using color-infrared 2002 orthophotos (NRCS, 2002) for
the catchments above each of the grazed pasture sites (stations) where the pin plots were
located. Similarly, land-use and land cover was determined within a 50 m strip along both
sides of the stream using GIS Arc Map 9.2 tools. Land-use categories were classified as
agricultural (grazed grassland, alfalfa, winter wheat, corn, and soybean), unmanaged
(ungrazed grassland and deciduous forest), Conservation Reserve Program (CRP), and other
(open water, roads, wetlands and residential areas) by stream order category (Fig. 2).
Catchments size, total stream lengths and stream order classification
Catchment sizes and total stream lengths above each grazing pasture treatment were
delineated and measured on a 2002 digital orthophotos using GIS (Arc Map 9.2) software.
Stream order was manually assigned to each catchment reach using the Strahler (1957)
classification system. Estimates of land use area within the 50 m strips along both sides of
the streams were also described by stream order category (Fig. 2; Table 3).
Stream bank erosion rates
The erosion pin method was utilized to measure stream bank erosion rates (Wolman,
1959). Additional details regarding the erosion pin method and its use are provided in chapter
two of this dissertation.
Data analysis
Relationships among bank soil texture, stream bed slope and sinuosity, and catchment
land-use management on stream bank erosion were examined using the mixed procedure in
82
the Statistical Analysis Systems (SAS Institute, 2003). A multiple regression model including
stream bank soil texture, stream bed slope and sinuosity, and land-use category (%) were
used to explain the variability in the dependent variable, stream bank erosion rate. The
acceptable significance level was considered as p< 0.1 since bank erosion is influenced by
many spatial, temporal, climatic and anthropogenic impacts.
Result and Discussion
Stream bank erosion is a complex process driven by many interacting factors
including bank soil properties (texture and structure), stream morphology (longitudinal slope
and sinuosity of the stream bed), and riparian land-use and its direct and indirect effects on
stream hydrology and bank stability. In a degraded stream system, these factors are dynamic
and adjust until a “state of equilibrium” is reached within the stream network. Once
equilibrium has been reached, stream bed and bank degradation is minimized because the
stream channel has adjusted to transport all of the sediment supplied to it with the available
discharge. This dynamic process of channel modification is described by the channel
evolution model (Simon and Klimetz 2008).
In this three-year study, stepwise multi linear regression analysis revealed no
significant interaction among stream bank erosion rates, stream bank soil texture, stream bed
slope and sinuosity, and catchment land-use category (%). However, there were some
positive relationships between stream bank erosion rates, and both bank soil sand particles
(%) and catchment stream lengths.
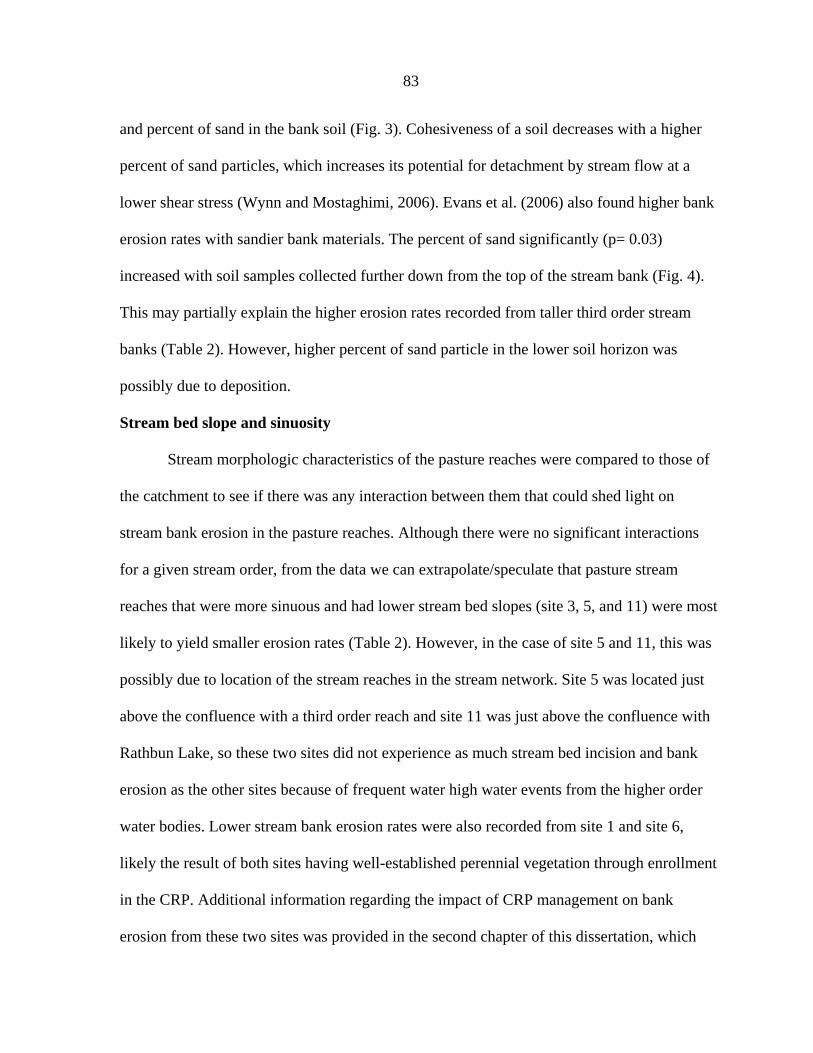
Stream bank soil particle size
The dominant stream bank textural unit of the thirteen sites was “silt loam” (Table 1).
In this study, there was a significant relationship (p= 0.04) between stream bank erosion rates
83
and percent of sand in the bank soil (Fig. 3). Cohesiveness of a soil decreases with a higher
percent of sand particles, which increases its potential for detachment by stream flow at a
lower shear stress (Wynn and Mostaghimi, 2006). Evans et al. (2006) also found higher bank
erosion rates with sandier bank materials. The percent of sand significantly (p= 0.03)
increased with soil samples collected further down from the top of the stream bank (Fig. 4).
This may partially explain the higher erosion rates recorded from taller third order stream
banks (Table 2). However, higher percent of sand particle in the lower soil horizon was
possibly due to deposition.
Stream bed slope and sinuosity
Stream morphologic characteristics of the pasture reaches were compared to those of
the catchment to see if there was any interaction between them that could shed light on
stream bank erosion in the pasture reaches. Although there were no significant interactions
for a given stream order, from the data we can extrapolate/speculate that pasture stream
reaches that were more sinuous and had lower stream bed slopes (site 3, 5, and 11) were most
likely to yield smaller erosion rates (Table 2). However, in the case of site 5 and 11, this was
possibly due to location of the stream reaches in the stream network. Site 5 was located just
above the confluence with a third order reach and site 11 was just above the confluence with
Rathbun Lake, so these two sites did not experience as much stream bed incision and bank
erosion as the other sites because of frequent water high water events from the higher order
water bodies. Lower stream bank erosion rates were also recorded from site 1 and site 6,
likely the result of both sites having well-established perennial vegetation through enrollment
in the CRP. Additional information regarding the impact of CRP management on bank
erosion from these two sites was provided in the second chapter of this dissertation, which
84
basically indicated that during the winter/spring season stream bank erosion rates from CRP
sites were significantly lower than from the grazed pasture sites. Grazing pasture site 7
experienced higher erosion rates than other first order streams, possibly because this site was
located just below the CRP site 6 (Fig. 1) where sediment input to stream water was lower.
This may have increased the erosion rate from site 7 in order to maintain the equilibrium
between stream power and sediment load (Qw . S ~ Qs . D50), as suggested by Lane’s (1955)
channel equilibrium model. In other words, if there is no sediment input with increased
discharge passing through the vegetated banks of the CRP stream reach, stream banks and
bed of the unvegetated stream reaches of grazed pasture below the CRP site may erode more
to increase suspended sediment concentration in the discharge (Zaimes et al. 2004).
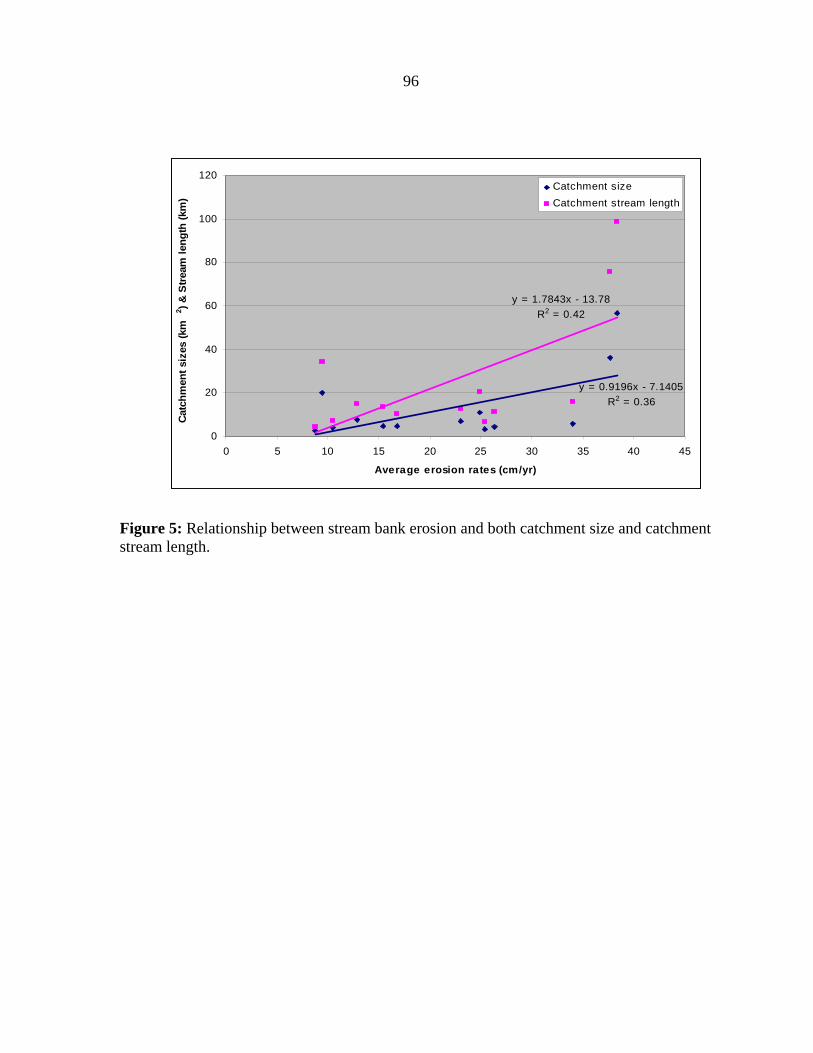
Catchment stream length and size
There was a significant relationship (p= 0.0309) between erosion rates and catchment
size (Fig. 5). An even stronger relationship was found (p= 0.0173) between erosion rates and
catchment stream lengths (Fig. 5). The larger catchment size or longer stream length translate
into higher discharge and stream power, which exerts greater stress on stream banks during
high flow events. This implies that when assessing stream bank erosion at the field scale, it is
important to account for the complexity of the stream channel network introduced by scale
differences. Additionally, the gravitational force increases with bank saturation on the taller
banks of higher order streams which increases the soil bulk unit weight (Simon et al. 2000),
triggering bank failure and slumping. In the case of incised stream reaches with taller banks
(mainly second and third order stream), bank stabilization should include trees along stream
banks in addition to shrub and grass cover towards the field edge, whereas stream reaches
85
with shorter bank (first order and ephemeral channels) could be stabilized with only grass
and shrub cover (Zaimes et al. 2004).
Impacts of land use within 50 m strips on either side of the stream
Riparian land-use at the catchment scale within the 50 m corridor on both sides of the
stream was found to consist of 46 to 61% agricultural use (row-crop and grazing), 6 to 11 %
in CRP (grass filter,) with the rest mainly unmanaged (Table 3). The small amount of
riparian area within conservation buffers (maximum of 11%) illustrates a significant
opportunity for implementation of management to reduce surface runoff and bank erosion
(Lyons et al. 2000). However, because variation in stream power (Larsen et al. 2006a)
and/or stage (Tufekcioglu, 2010) is highly correlated to bank erosion rate, the impact of
riparian management alone on bank erosion would not be enough to explain differences in
erosion rates from these thirteen sites. The connectivity of the stream ecosystem at the larger
scale is not only important for aquatic ecosystem integrity (Johnson and Covich, 1997;
Ranganath et al. 2009) and water quality (Allan et al. 1997), but is also important for the
stream morphologic and hydrologic modification that occurs further away from the place of
perturbation. Richards et al. (1996) found that stream morphological characteristics were
strongly related to catchment conditions. This relation could be one of the major reasons that
the erosion rates in this study did not correlate with pasture grazing intensities (cattle
stocking rates). In this case, when evaluating the effect of stocking rates on the change of
bank morphology at the field scale, selection of bank erosion as the sole response variable
may not be an appropriate choice (Lucas et al. 2009) since it is not only under the influence
of adjacent land-use, but also the complex nature of stream biogeochemical and hydrologic
interactions in the longitudinal dimension (Gove et al. 2001).
86
Since riparian areas are considered to be the critical source areas for sediment and
nutrient contributions to the stream, their protection is very important for stream water
quality and aquatic integrity. However, conversion from agricultural to conservation land-use
represents opportunity costs to landowners. The magnitude of such costs can be assessed
using a hypothetical situation where the total stream lengths on either side of the stream were
buffered with perennial vegetation within 50 m. Under this scenario, an average of 2.1 % of
the total watershed would be required to buffer the streams (Table 4). Without a
consideration of farm profitability, I believe that the ultimate solution to the stream water
impairment problem at the large scale and long term lies in the dedication of this 2 % percent
of overall land-use for the recovery of riparian corridor function and stream habitat integrity.
Conclusions
Multi linear regression analysis showed no significant interaction between the
independent variables stream bank soil particle size, stream bed slope and sinuosity, and
percent of riparian land-use, with stream bank erosion rate as the response variable. This may
be due to the complexity of the interactions between stream morphology and hydrology at
both the field and catchment scales, and insufficiency in the duration (3 years) of the study.
However, significant relationships between percent of bank sand particles and bank erosion
rates revealed that bank soils with less cohesiveness are more likely to erode due to reduced
binding capacity of the soil against erosive flow. The stream morphology (stream bed slope
and sinuosity), and riparian land-use data suggest that integration of the stream morphologic
characteristics and land-uses both at the field and catchment scale is necessary for the
explanation of bank erosion rates and ultimately for the identification of the current stage of
channel evolution. Larger catchments or stream channels were found to be related to higher
87
bank erosion rates than smaller catchments, possibly due to the high potential stream
discharge and taller saturated banks, which increase the gravitational force in the soil column
resulting in soil strength failure and collapse. At the catchment scale, riparian vegetation
cover assessment showed that within the 50 m corridor on both sides of the stream, 46 to 61
% of riparian area was devoted to agricultural crop use and grazing and only 6 to 11 % was
in CRP with the rest mainly in “unmanaged use”. These data and previous studies allow the
speculation that, in the long term and at the catchment scale, high percentage of agricultural
land-use in riparian areas can be either directly and/or indirectly related to alteration of
stream hydrologic regimes. In order to reach equilibrium state condition, where energy input
to the stream channel is balanced with the minimal channel boundary resistance, such land-
use changes will result in changes in stream bank erosion and channel morphology.
References
Agouridis, C. T., D. R. Edwards, S. R. Workman, J. R. Bicudo, B. K. Koostra, E. S. Vanzant,
and J. L. Taraba. 2005. Stream bank erosion associated with grazing practices in the
humid region. Transactions of the American Society of Agricultural Engineers 48
(1):181-190.
Allan, J. D., D. L. Erickson, and J. Fay. 1997. The influence of catchment land use on stream
integrity across multiply spatial scales. Freshwater Biology 37: 149-161.
Anderson, K. L. 2000. Historical alterations of surface hydrology in Iowa’s small agricultural
watersheds. MS thesis. Iowa State University, Ames, Iowa.
Braster, M., T. Jacobson, and V. Sitzmann. 2001. Assessment and Management Strategies for
Prior, J. C. 1991. Landforms of Iowa. Iowa Department of Natural Resources University of
Iowa Press, Iowa City, Iowa.
Ranganath, S. C., W. C. Hession, and T. M. Wynn. Livestock exclusion influences on
riparian vegetation, channel morphology, and benthic macroinvertebrate assemblages.
Journal of Soil and Water Conservation 64(1): 33-41.
Richards, C., L. B. Johnson, and G. E. Host. 1996. Landscape-scale influences on stream
habitats and biota. Canadian Journal of Fisheries and Aquatic Sciences 53(1): 295-
311.
Ritter, D. F., R. C. Kochel, and J. R. Miller. 2002. Process geomorphology, 4th ed. Book.
Page 190.
SAS (Statistical Analysis System) Institute. 2003. SAS Release 9.1 ed. SAS Inst., Cary,
North Carolina.
91
Schilling, K. E., 2004. Relation of baseflow to row crop intensity in Iowa. Agricultural
Ecosystem Environment 105, 433-438.
Sharpley, A. N., W. J. Gburek, G. Folmar, and H. B. Pionke. 1999. Sources of phosphorus
exported from an agricultural watershed in Pennsylvania. Agricultural Watershed
Management 41:77-89.
Simon A, Curini A, Darby SE, Langendoen EJ (2000) Bank and near-bank processes in an
incised channel. Geomorphology 35:193-217.
Simon, A and Collison, A.J.C. (2002) Quantifying the Mechanical and Hydrologic Effects of
Riparian Vegetation on Streambank Stability. Earth Surface Process and Landforms.
27:527-546.
Simon, A. and L. Klimetz. 2008. Relative magnitudes and sources of sediment in benchmark
watersheds of the Conservation Effects Assessment Project. Journal of Soil and Water
Conservation 63 (6), 504-522.
Simon, A. and M. Rinaldi. 2006. Disturbance, stream incision, and channel evolution: The
roles of excess transport capacity and boundary materials in controlling channel
response. Geomorphology 79, 361-383.
Strahler AN (1957) Quantitative analysis of watershed geomorphology. Am Geophysical
Union Trans 38:913-920
Trimble, S. W., 1994. Erosional effects of cattle on streambanks in Tennennee, U.S.A. Earth
Surface Processes and Landforms 19, 451-464.
Tufekcioglu, M., 2010. Stream bank soil and phosphorus losses in response to the alteration
of the hydrologic and morphologic characteristics of the grazed pastures stream
reaches in south central Iowa. Ph.D. Dissertation. Iowa State University, Ames, IA.
Whitney, G. G., 1994. From coastal wilderness to fruited plain. Cambridge University Press,
Cambridge, United Kingdom.
92
Williamson, R. B., C. M. Smith, and A. B. Cooper. 1996. Watershed riparian management
and its benefits to a eutrophic lake. Journal of Water Resources Planning and
Management 122(1): 24-32.
Wolman, M. G., 1959. Factors influencing erosion of a cohesive river bank. American
Journal of Science 257: 204-216.
Wynn, T. and S. Mostaghimi. 2006. The effects of vegetation and soil type on streambank
erosion, Southwestern Virginia, USA. Journal of the American Water Resources
Association 42 (1), 69-82.
Yan, B., M. D. Tomer, and D. E. James. 2010. Historical channel movement and sediment
accretion along the South Fork of the Iowa River. Journal of Soil and Water
Conservation 65(1), 1-8.
Zaimes, G. N., R. C. Schultz, and T. M. Isenhart. 2004. Stream bank erosion adjacent to
riparian forest buffers, row-crop fields, and continuously-grazed pastures along Bear
Creek in Central Iowa. Journal of Soil and Water Conservation 59(1):19-27.
Zaimes, G.N., R.C. Schultz, and T.M. Isenhart. 2006. Riparian land uses and precipitation
influences on stream bank erosion in central Iowa. Journal of the American Water
Resources Association. 42(1): 83-97.
Zaimes, G.N., R.C. Schultz, and T.M. Isenhart. 2008b. Streambank soil and phosphorus
losses under different riparian land-uses in Iowa. Journal of the American Water
Resources Association. 44(4):935-947.
93
Figure 1: Location of thirteen study sites and their catchments within Rathbun Lake watershed in South Central Iowa. Numbers represent pasture Id based on the catchment sizes from smallest to largest. Note: site 6 and 1 are under CRP management and all other sites were in grazing management.
59
126
132
10
48
111
3
7
94
Figure 2: Catchment stream lengths of the pasture site/Id 11 and its 50 m buffered areas based on the stream order category.
95
y = 0.546x + 9.1888R2 = 0.3195
0
5
10
15
20
25
30
35
40
45
50
0 5 10 15 20 25 30 35 40 45
Average erosion rates (cm/yr)
Aver
age
sand
siz
e (%
)
Figure 3. Relationship between erosion rates and percent sand particle size
y = 0.0515x + 16.24R2 = 0.0955
0
10
20
30
40
50
60
70
0 50 100 150 200 250 300 350 400
Stream Bank Soil Sample Depth (cm)
Perc
ent S
and
Figure 4. Relationship between percent sand particles and height of stream bank at which sample was collected. Note: Only stream banks taller than 150 cm are include.
96
y = 1.7843x - 13.78R2 = 0.42
y = 0.9196x - 7.1405R2 = 0.36
0
20
40
60
80
100
120
0 5 10 15 20 25 30 35 40 45
Average erosion rates (cm/yr)
Catc
hmen
t siz
es (k
m2 ) &
Stre
am le
ngth
(km
)Catchment sizeCatchment stream length
Figure 5: Relationship between stream bank erosion and both catchment size and catchment stream length.
97
Table 1. Percent particle sizes and their textural units from stream bank soils of the thirteen stream reaches.
Site Id Land-use Sand (%) Silt (%) Clay (%) Soil textural units
1 CRP 15 58 28 silt clay loam
2 Grazed 30 50 20 loam
3 Grazed 18 60 22 silt loam
4 Grazed 32 50 18 silt loam
5 Grazed 11 65 24 silt loam
6 CRP 8 65 27 silt loam
7 Grazed 9 66 25 silt loam
8 Grazed 19 60 21 silt loam
9 Grazed 16 62 21 silt loam
10 Grazed 26 54 19 silt loam
11 Grazed 19 60 21 silt loam
12 Grazed 27 56 18 silt loam
13 Grazed 43 38 19 loam
98
Table 2. Stream morphologic characteristics in both field and catchment scales and total erosion rates from pasture fields.
Site Id Stream bed slope Stream sinuosity Stream order Erosion rates (cm, year)
1 1.7(2.1) 1.1(1.1) I 8.6
2 2.0(1.8) 1.2(1.4) I 25.3
3 0.8(1.7) 1.4(1.2) I 10.3
4 1.3(2.0) 1.6(1.4) I 26.3
5 0.6(1.6) 2.0(1.2) I 16.6
6 2.0 (1.3) 1.5(1.3) I 15.3
7 1.6(1.4) 1.3(1.3) I 34.0
8 1.6(0.7) 1.1(1.2) I 23.0
9 0.8 (0.8) 1.4(1.4) II 13.0
10 0.7(0.8) 1.4(1.3) II 25.0
11 0.4(0.6) 1.5(1.3) II 9.3
12 0.3(0.3) 1.1(1.4) III 37.6
13 1.5(0.3) 1.2(1.4) III 38.3
Note; numbers inside the parenthesis represent the given stream feature at the catchment scale. Stream order category is based on Strahler (1957).
99
Table 3. Land-use types within 50 m on either side of the streams by stream order in studied catchments of the Rathbun watershed. Stream order Agriculture (%) Unmanaged use (%) CRP (%) Other (%)
Ephemeral 61 25 11 3
1st 64 26 7 3
2nd 52 39 6 3
3rd 46 47 7 0
Use in agriculture: grazed grassland, alfalfa, winter wheat, lush grass, corn, soybean.
Other: open water, roads, wetlands, industrial and residential areas (ftp://ftp.igsb.uiowa.edu/gis_library)
100
Table 4. The percent of total catchment area devoted to riparian buffers if 6 m wide buffers were established along ephemeral channel and 18 m wide buffers were established along all other perennial channels that were designated as “agriculture” land use in this study. Note: The buffer widths of 6 m and (12+6) m are the minimum grass filter and forest buffer widths with the grass width of 6 m, respectively, recommended by NRCS.
Site Id Buffered riparian area (km2) Catchment size (km2) Buffered catchment area (%)
1 0.02 2.5 0.9
2 0.08 3.2 2.7
3 0.07 3.9 1.9
4 0.10 4.4 2.2
5 0.08 4.7 1.6
6 0.14 4.8 3.0
7 0.16 5.8 2.8
8 0.12 7.1 1.7
9 0.14 7.6 1.9
10 0.16 10.9 1.5
11 0.36 20.1 1.8
12 0.82 36.3 2.2
13 1.24 56.6 2.2
Average 2.1
101
CHAPTER 5
GENERAL CONCLUSIONS
Row-crop cultivation and riparian pasture grazing are two agricultural practices
widely recognized as potential sources of phosphorus (P) and sediment to surface waters if
not carefully managed. An assessment of the magnitude of sediment and P contribution from
such sources, along with the development of cost-effective management practices, is
essential for maintaining sustainable agricultural practices and stream ecological integrity.
Stream bank erosion within agricultural landscapes is a major pathway for non-point source
sediment and P loading to receiving waters. Previous studies have shown direct and indirect
effects of land use on stream bank erosion, and identified high bank erosion rates from
riparian pastures. Other studies have shown significant variation in sediment and nutrient
loading to streams among different riparian grazing practices. The overarching goal of this
research was to assess stream bank soil and P losses within grazed pasture stream reaches in
the Rathbun Watershed in southern Iowa. Specific objectives of this study were to: 1)
compare the effects of varying livestock stocking rates on sediment and P losses from stream
bank erosion; 2) assess the relationship between the number of high stream discharge events
on stream bank soil erosion rates, and 3) evaluate the impacts of current riparian land-uses
and stream morphologic characteristics (bank soil texture, stream bed slope and sinuosity) at
the field and catchment scale on stream bank erosion.
In the first study, the length of severely eroded stream banks and soil compaction of
the riparian area were found to be significantly related to the higher riparian stocking rates.
While there was no significant correlation between bank erosion rates and stocking rates, the
102
erosion rates from the sites under CRP management were significantly lower than those from
grazed pasture sites, particularly during the winter/spring season. This suggests that use of
riparian areas for grazing can impact channel characteristics and water quality by increasing
sediment and P loads from bank erosion, and that riparian grazing management practices
should include a consideration of the impacts of grazing on stream bank erosion and stream
integrity.
The second study found that approximately 75% of the variability in stream bank
erosion can be directly correlated to the frequency of high stream discharge events, and the
remaining 25% is probably due to differences in percent bank soil antecedent moistures and
frequency and number of freeze-thaw events prior to the high stream discharge events. The
results suggest that hydrologic regime is a major driving force for stream bank erosion in the
studied pastures and that hydrology is not only influenced by adjacent land use but the
catchment characteristics above the pasture sites. It can be inferred from these results that
stream bank soil loss can be reduced by implementing riparian and watershed practices that
increase soil water-holding capacity and reduce surface runoff and high stream flow.
In the third study, an evaluation of stream morphologic characteristics and land-use
both at the field and catchment scale was found to be necessary to explain current stream
bank erosion rates. Larger catchment size or catchments with more stream length were found
to have greater bank soil loss than did smaller catchment size, likely due to the potential of
the high energy of stream discharge and taller saturated banks in higher order channels.
These factors increase the gravitational force in the soil column resulting soil strength failure
and collapse. A significant relationship between percent of bank soil sand particles and bank
erosion rates revealed that bank soils with less cohesiveness are more likely to erode due to
103
the reduced binding capacity of the soil against erosive flows. Catchment-scale assessments
in the study watersheds showed that within the 50 m corridor on both sides of the stream, 46
to 61% of the riparian area was devoted to agricultural crop and pasture use and only 6 to
11% was in CRP with the rest mainly in unmanaged use.
Overall, intensive agricultural use of the riparian areas throughout these catchments
can be directly and/or indirectly related to excessive amounts of sediment and nutrient load to
the streams and their impairment for providing ecological services. Such impacts on riparian
areas and surface water quality can likely be reduced with well-defined pasture management
practices (off-stream water sources, nutrient supplement placement away from the stream,
stable crossing points, rotational grazing with lower stocking rates, timing of the grazing) and
conservation buffer practices, that consider pasture characteristics such as pasture shape and
size and shading by trees along the stream banks (Haan et al. 2006, 2010; Bear, 2010).
References
Bear, D. A. 2010. Pasture management effects on nonpoint source pollution of Midwestern
watersheds. MS Thesis. Iowa State University.
Haan, M.M., J.R. Russell, J.D. Davis, and D.G. Morrical. 2010. Grazing management and
microclimate effects on cattle distribution relative to a cool-season pasture stream.