Annual Geological Conference '96 June 8-9, 1996, Kota Kinaha/u, Sahah Stream sediment geochemistry of Sn, Au and associated elements in Southeast Asia W.K. FLETCHER Department of Earth and Ocean Sciences University of British Columbia Vancouver Abstract: This paper summarises and reviews some detailed orientation surveys, case histories and experimental studies of the behaviour of cassiterite and gold in streams in SE Asia as a basis for recommendations on the design and interpretation of exploration geochemical surveys for these elements. In the tropical rain forests of SE Asia the frequent rain storms mobilize stream sediments and rapidly flush very fine sand, silt and clay from the stream bed in suspension. This flushing process causes fine heavy minerals such as cassiterite and gold to preferentially accumulate on the bed of the stream. The most consistent and longest geochemical dispersion trains for elements transported as heavy minerals are thus found in the very fine sand fractions « 100 l1m). Use of coarser fractions, collected at heavy mineral trap sites, gives more erratic geochemical anomalies that are often displaced downstream away from their source. During interpretation these displaced anomalies can be recognised by: (i) ratioing Au or Sn values to either abundance of a ubiquitous heavy mineral (e.g., magnetite) or the transport equivalent size of the stream sediment; (ii) by absence of mobile pathfinder elements (e.g., As and base metals); or (iii) from field observations of stream width, velocity, bed roughness and gradient that permit favourable sites for heavy mineral accumulation to be identified. Where removal of the rain forest and conversion ofland to agricultural production greatly increases rates of soil erosion, the accumulations of heavy minerals can be diluted to the extent that Au anomalies may go undetected. Possible answers to this problem are: (i) use of more sensitive analytical procedures; (ii) elimination of the silt-clay fraction and analysis offine sand (53-100 l1m) fraction; or (iii) use of heavy mineral concentrates. Once soil erosion is minimized by re-establishing a cover of ground vegetation, as in mature rubber plantations, fine sediments are again flushed from the stream bed and geochemical anomalies return to more natural conditions with accumulations of heavy minerals on the stream bed. INTRODUCTION It is well established that the design and interpretation of geochemical surveys for elements present in stream sediments as the principal constituents of heavy minerals poses special challenges for the exploration geologist and geochemist. First, the rarity of the heavy mineral grains requires that particular attention be given to use of samples and subsamples of sufficient size to maintain representativity at all stages of sample collection and preparation. If this condition is not met the unacceptably large errors, commonly known as the nugget effect, can result in erratic data that are difficult to interpret and follow-up. However, even with great care to maintain sample representativity throughout the process, the resulting geochemical data will often: (i) display considerable local variation on the stream bed, and (ii) concentrations may increase, downstream away from their source - in contrast to the traditional downstream dilution model of exploration geochemistry whereby anomalous metal values Geol. Soc. MalaYJia, Bulletin 40, July 1997,. pp. 57-69 decrease downstream from their source as a consequence of dilution by barren material. These characteristics of heavy mineral dispersion trains result from the selective sorting and preferential concentrations of heavy minerals on the bed of a stream in response to changing sedimentological and hydraulic conditions (Ljunggren and Sundborg, 1968; Slingerland, 1984; Slingerland and Smith, 1986). Providing their origins are understood, the resulting geochemical patterns can present an opportunity, rather than a problem, to the exploration geochemist. This paper reviews the results of orientation studies and exploration case histories from the Southeast Asian region, relates the results to experimental studies of transport of cassiterite in a small Malaysian stream, and draws some theoretical and practical conclusions. METHODS We have applied two distinct methods to study the behaviour of heavy minerals and associated
Transcript
Annual Geological Conference '96 June 8-9, 1996, Kota Kinaha/u, Sahah
Stream sediment geochemistry of Sn, Au and associated elements in Southeast Asia
W.K. FLETCHER
Department of Earth and Ocean Sciences University of British Columbia
Vancouver
Abstract: This paper summarises and reviews some detailed orientation surveys, case histories and experimental studies of the behaviour of cassiterite and gold in streams in SE Asia as a basis for recommendations on the design and interpretation of exploration geochemical surveys for these elements.
In the tropical rain forests of SE Asia the frequent rain storms mobilize stream sediments and rapidly flush very fine sand, silt and clay from the stream bed in suspension. This flushing process causes fine heavy minerals such as cassiterite and gold to preferentially accumulate on the bed of the stream. The most consistent and longest geochemical dispersion trains for elements transported as heavy minerals are thus found in the very fine sand fractions « 100 l1m). Use of coarser fractions, collected at heavy mineral trap sites, gives more erratic geochemical anomalies that are often displaced downstream away from their source. During interpretation these displaced anomalies can be recognised by: (i) ratioing Au or Sn values to either abundance of a ubiquitous heavy mineral (e.g., magnetite) or the transport equivalent size of the stream sediment; (ii) by absence of mobile pathfinder elements (e.g., As and base metals); or (iii) from field observations of stream width, velocity, bed roughness and gradient that permit favourable sites for heavy mineral accumulation to be identified.
Where removal of the rain forest and conversion ofland to agricultural production greatly increases rates of soil erosion, the accumulations of heavy minerals can be diluted to the extent that Au anomalies may go undetected. Possible answers to this problem are: (i) use of more sensitive analytical procedures; (ii) elimination of the silt-clay fraction and analysis offine sand (53-100 l1m) fraction; or (iii) use of heavy mineral concentrates. Once soil erosion is minimized by re-establishing a cover of ground vegetation, as in mature rubber plantations, fine sediments are again flushed from the stream bed and geochemical anomalies return to more natural conditions with accumulations of heavy minerals on the stream bed.
INTRODUCTION
It is well established that the design and interpretation of geochemical surveys for elements present in stream sediments as the principal constituents of heavy minerals poses special challenges for the exploration geologist and geochemist. First, the rarity of the heavy mineral grains requires that particular attention be given to use of samples and subsamples of sufficient size to maintain representativity at all stages of sample collection and preparation. If this condition is not met the unacceptably large errors, commonly known as the nugget effect, can result in erratic data that are difficult to interpret and follow-up. However, even with great care to maintain sample representativity throughout the process, the resulting geochemical data will often: (i) display considerable local variation on the stream bed, and (ii) concentrations may increase, downstream away from their source - in contrast to the traditional downstream dilution model of exploration geochemistry whereby anomalous metal values
Geol. Soc. MalaYJia, Bulletin 40, July 1997,. pp. 57-69
decrease downstream from their source as a consequence of dilution by barren material. These characteristics of heavy mineral dispersion trains result from the selective sorting and preferential concentrations of heavy minerals on the bed of a stream in response to changing sedimentological and hydraulic conditions (Ljunggren and Sundborg, 1968; Slingerland, 1984; Slingerland and Smith, 1986). Providing their origins are understood, the resulting geochemical patterns can present an opportunity, rather than a problem, to the exploration geochemist.
This paper reviews the results of orientation studies and exploration case histories from the Southeast Asian region, relates the results to experimental studies of transport of cassiterite in a small Malaysian stream, and draws some theoretical and practical conclusions.
METHODS
We have applied two distinct methods to study the behaviour of heavy minerals and associated
58 W.K. FLETCHER
Table 1. Average and range of concentrations of Sn and some associated elements in anomalous soils and sediment, Bujang Melaka. All values in ppm in < 177 ~m fraction.
Element Soil' Sediment2 Ratio3
(n = 113) (n=11)
Sn 510 (350-750) 763 (275-1900) 0.67
W 85 (33-220) 81 (35-150) 1.05
As 960 (750-1220) 153 (100-180) 6.27
Pb 114 (84-155) 68 (32-105) 1.68
1: Data for anomalous population from Table 2, Fletcher et al. (1984a)
2: Data from sites 20 to 31 , pp 67-68, Fletcher et al. (1984b) 3: Ratio of average soil concentration to average sediment
concentration
elements in active stream sediments. The first has been to investigate variations of concentrations of Sn and Au along streams known to contain anomalous concentrations of these elements. This traditional orientation survey approach has been used to investigate distribution ofSn and associated elements in two streams in Malaysia, and Au in a stream near Loei, Thailand. The second, less traditional, approach involves use of pit traps to measure rates of transport of different size fractions of the sediments and heavy minerals. This provides a basis for a theoretical analysis of the sedimentological processes that result in preferential sorting and accumulation of the heavy minerals. The practical difficulties associated with pit traps preclude their widespread application. Nevertheless, the two approaches are complementary and taken together should provide a general basis for making recommendations for optimization of exploration geochemical surveys.
Full descriptions of the field areas, and sampling and analytical procedures are to be found in the papers cited for each study.
ORIENTATION SURVEYS
1. Sn and associated elements in the Sungai Petal (Fletcher et al., 1984a, 1984b, 1986, 1987)
The S. Petal is a steep, relatively undisturbed mountain stream draining Gunung Bujang Melaka, a satellite granite dome of Main Range Batholith, Malaysia. Rainfall exceeds 3,500 rom per year. Cassiterite mineralization, associated with pegmatites and aplites, was mined in the headwaters of the stream for brief periods in the early part of the century. Strongly anomalous concentrations ofSn, W and As are found in podzolic soils associated with the primary Sn mineralization (Table 1).
Table 2. Comparison of concentrations of Sn and associated elements in various size fraction of sediments from ten high and low energy environments in the S. Petal. All data in ppm. Data from Fletcher et al., (1984a, 1984b, 1986).
Sn and associated elements in the < 177 l1m fraction
Sn 444 (70) 184 (78) 2.41 2.70 W 32 (52) 16 (41) 2.01 3.19 As 24 (25) 27 (21) 0.90 -1.14 Pb 18 (18) 19 (33) 0.92 -0.74
1: Ratio of concentration in high to low energy environment 2: t with 9 df t.99 = 2.821, t.9S = 1.833, t.so = 1.383 3: Coefficient of variation (%)
Dispersion of anomalous elements along the S. Petal shows some distinct differences depending on whether the element is associated with a resistate mineral (Sn and W) or is present in the mineralization as a sulphide that oxidize during weathering (As and the base metals). Tin concentrations in the stream sediments near the source are comparable or higher than in the anomalous soils (Table 1). However, further downstream there are considerable differences in concentrations of Sn at closely adjoining sites on the bed of the stream depending on whether the sample is from a high or low energy site -characterized by sandy gravels and medium sands, respectively - with the former almost invariably containing significantly higher concentrations of Sn than the latter (Table 2). However, when different size fractions are considered it is apparent that the differences in Sn concentrations between high and low energy environments systematicallY decreases with decreasing grain size, i.e., th~ variability of Snconcentrations on the stream bed is reduced by analysis of the finer size fractions. With respect· to the' dispersion and dilution of Sn along the S. Petal away from the primary mineralization, Sn content of the finest fractions
Geol. Soc. MalaytJia, Bulletin 40
STREAM SEDIMENT GEOCHEMISTRY OF SN, Au AND ASSOCIATED ELEMENTS IN SOUTHEAST ASIA 59
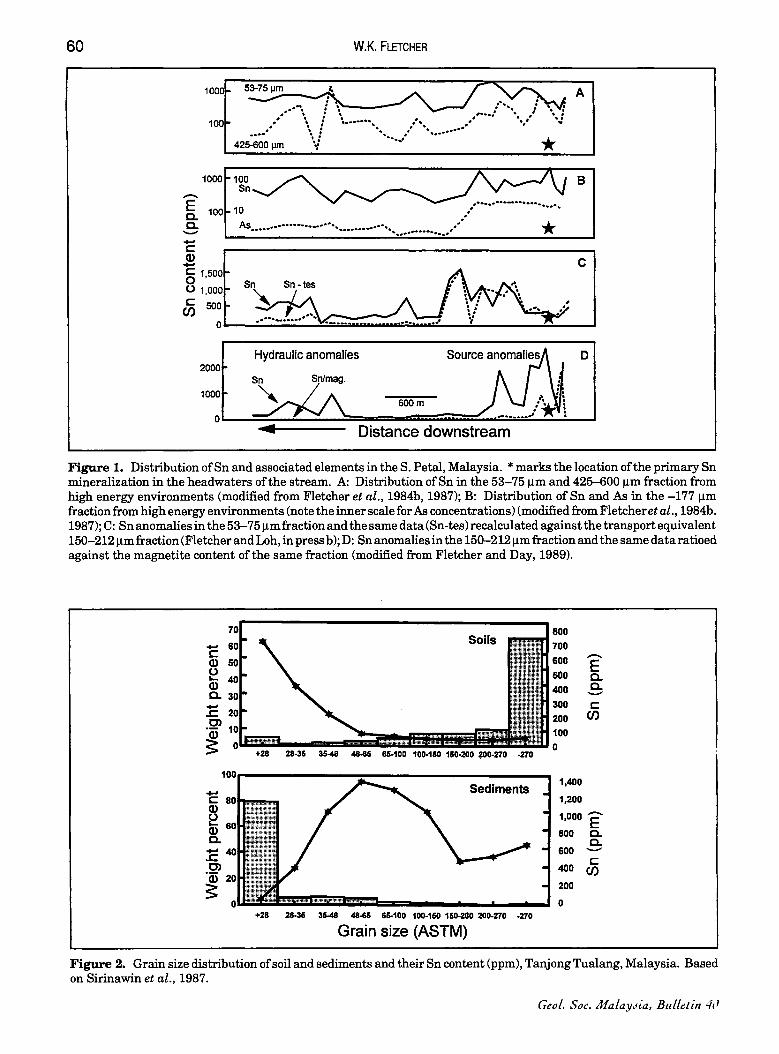
remains anomalous along the entire length of the stream, some 5 km, to the point where it emerges into the Kinta Valley (Fig. lA). Conversely, Sn content of the coarser fractions, particularly from low energy sites, decreases relatively rapidly downstream from the source. This dilution is also apparent in the coarse fractions from high energy environments, but the results are more erratic and Sn concentrations at several distal high energy have Sn concentrations similar to those near the primary Sn mineralization (Fig. lA).
The dispersion pattern for AP, (and the base metals) has completely different characteristics (Fig. 1B). In particular: (i) close to the source, anomalous concentrations in sediments are much lower than in the associated soils (Table 1); (ii) the stream sediment anomalies are diluted to near-background concentrations a relatively short distance downstream from the source; and (ii) the differences in concentrations between low and high energy environments are not significant (Table 2).
2. Sn and associated elements at Tanjong Tualang (Sirinawin et al., 1987)
This location is 60 km southwest of Ipoh, near Tanjong Tualang, where coincident Sn, Pb and As anomalies are found in several small streams draining gently undulating terrain. The source of the geochemical anomalies, in streams draining a small hill that at the time of the study supported a mature rubber estate, is not known. However, cassiterite was found in small quartz veins exposed in the stream and it is conjectured that there may be a granite cupola beneath the hill.
The most striking feature of the anomalies is that appreciably higher concentrations of Sn are found in the finer fractions of the stream sediments than in the associated soils (Fig. 2; Table 3). This difference in Sn concentrations appears to result from the much lower proportions of clay, silt and fine sand found in the sediments compared to the soils, i.e. in the soils the Sn-rich heavy mineral fraction is diluted by the abundance of the barren light mineral fractions. No such effect is present for AP, and Pb which have higher anomaly thresholds in soils than in sediments (Table 3).
3. Au in the Huai Hin Laep, Loei, Thailand (Paopongsawan, 1991; Paopongsawan and Fletcher 1993; Fletcher et al., 1995)
The Huai Hin Laep is a small stream (catchment area 8 km2) 40 km of Loei in northern Thailand. The climate is monsoonal (rainfall 1,100 mm per year) and the forest has been cleared to grow maize. Microprobe analyses show that the gold particles in the stream have a low fineness (average 622) and only patchy high purity rims: the Au is therefore
July 1997
thought to be of primary origin rather than secondary Au derived from the lateritic soils. The source of the Au is most likely associated with quartz veins in the headwaters of the stream.
Heavy mineral concentrates (SG > 3.2) in the 53-106, 106-212 and 212-425)lm size fractions of sediments from the Huai Hin Laep have strongly anomalous but erratic concentrations of Au that range from < 75 ppb to 185,000 ppb (Fig. 3; Table 4). The erratic variations result from the low numbers of gold particles in heavy mineral concentrates that were prepared from 40 kg < 12 )lm field samples. However, despite the erratic variations, the data show two systematic trends: (i) Au values tend to increase downstream over a distance of some 5 km away from the supposed source; and (ii) higher Au concentrations are found at relatively high energy sites characterized by increased flow velocities and bed roughness, and decreased stream width (Table 5).
In contrast to the heavy mineral concentrates, sediment samples in the < 212 )lm and < 53 )lm size fractions fail to detect the presence of the anomalous Au dispersion train if analytical methods having a detection limit of 5 ppb Au are employed. This results from dilution of the Au-rich heavy mineral fraction by the erosion and input into the stream channel of considerable amounts of barren silt and clay from the adjoining slopes a process exacerbated by the practice of ploughing the land to plant maize shortly before the onset of the monsoon rains. The Au anomaly can, however, be detected in the < 53 )lm fraction by use of more sensitive analytical methods. These reveal a Au dispersion pattern very similar to those in the heavy mineral concentrates but with a peak value of only 3.1 ppb Au.
SUMMARY AND DISCUSSION OF ORIENTATION SURVEY RESULTS
Results from the orientation surveys have several important features in common. In particular: 1. Comparing associated low and high energy
environments on the stream bed, the latter typically have higher concentrations of Au and Sn with the difference in concentrations between high and low energy being greatest for the coarser size fractions.
2. Sn and Au anomalies persist for several km downstream from the source with the anomalies in the finer fractions of the sediments being most uniform and consistent. Erratic anomalous values can, however, also be found a considerable distance downstream in coarse fractions from high energy sites. At such sites
Figure 1. Distribution ofSn and associated elements in the S. Petal, Malaysia. * marks the location of the primary Sn mineralization in the headwaters of the stream. A: Distribution of Sn in the 53-75 11m and 425-600 11m fraction from high energy environments (modified from Fletcher et al., 1984b, 1987); B: Distribution of Sn and As in the -177 11m fraction from high energy environments (note the inner scale for As concentrations) (modified from Fletcheret al., 1984b, 1987); C: Sn anomalies in the 53-75 11m fraction and the same data (Sn-tes) recalculated against the transport equivalent 150-212 11m fraction (Fletcher and Loh, in press b); D: Sn anomalies in the 150-212 11m fraction and the same data ratioed against the magnetite content of the same fraction (modified from Fletcher and Day, 1989).
Figure 2. Grain size distribution of soil and sediments and their Sn content (ppm), Tanjong Tualang, Malaysia. Based on Sirinawin et al., 1987.
Ceol. Soc. MalaY.lia, Bulletin 411
STREAM SEDIMENT GEOCHEMISTRY OF SN, Au AND ASSOCIATED ELEMENTS IN SOUTHEAST ASIA 61
Table 3. Anomalous Sn, Pb and As concentrations in stream sediments compared to anomalous and mean background concentrations in soils, Tanjong Tualang, Malaysia. All values in ppm. Data based on Sirinawin et al. (1987) .
Sediments Soils Element Anomaly Threshold
Threshold (mean)
Sn 550 70 (30)
As 30 145 (50)
Pb 45 125 (20)
anomalous concentrations can be comparable to those in soil anomalies at the source.
3. There is a distinct difference between the geochemical behaviour of Sn, and As and the base metals, with the pathfinder elements having anomalies that disappear relatively rapidly downstream and are weaker than anomalies in the associated soils. The increased concentrations of Au and Sn at
high energy sites on the stream bed, together with the separation of Sn from the base metals, provide strong evidence that grains of gold and cassiterite preferentially accumulate on the stream bed in response to physical processes, controlled by the properties of the grains (density, size, shape) and hydraulic conditions (stream discharge, slope, bed roughness etc.), that selectively separate heavy minerals from same-sized light grains. This is also in agreement with the interpretation of nearidentical geochemical patterns for Au on a stream bed in Canada and with the predictions of bedload transport equations for accumulation of heavy minerals on stream beds (Day and Fletcher, 1989, 1991).
That Au behaves entirely as a heavy mineral in streams is sometimes questioned on the grounds of the now well-known chemical mobility of Au in tropical soils and also with respect to the existence of very fine flour or skim gold that can supposedly float. However, there is no evidence from the Huai Hin Laep that either fine gold (in the < 53 /lm fraction) or the tendency of gold to form flakes significantly inhibits its accumulation as a heavy mineral. This is consistent with experimental evidence that flattening of gold spheres (Corey Shape Factor = c/..,jab = 1) to thin discs (CSF = 0.1) only reduces their settling velocities by 40 to 70% (Walsh and Rao, 1986). Based on these findings and a-p-plying Stokes Law
(v = g (Ph-PI) d2/ 18/l
[where v = terminal settling velocity in cm per sec;
JuLy 1997
Table 4. Gold concentrations (ppb) by a combined aqua-regiaAmberlite XAD-8 column method in < 53 ~m sediments, and by a fire assay - atomic absorption method in three fractions of heavy mineral concentrates. Data from Paopongsawan and Fletcher (1994) and Fletcher et al . (1995) . Note that results are listed in descending order from upstream to downstream to correspond to the profiles in Figure 3.
Sample Sediments Heavy mineral concentrates Number < 53 ~m
Table 5. Spearman rank correlation coefficients for gold and selected stream parameters at point bar sites 1,000 to 6,500 m downstream from the assumed source (n = 9). From Fletcher et al. (1995).
With n = 9, correlations ~ 0.600 are significant at P = 0.10; these values are underlined. *D
65 is bed roughness (i.e. 65% of bed
particles have a diameter smaller than D65
) . Sed = sediment; HM = heavy mineral fraction.
62 W.K. FLETCHER
g = acceleration due to gravity (981 cm per sec2); Ph and PI are the specific gravity of the mineral grain and water, respectively; d is the grain diameter; and!-l is viscosity of water (in poises)], a gold sphere (CSF = 1) and a flake of gold (CSF = 0.1) should settle roughly ten and five times faster, respectively, than a quartz grain of the same volume. The distribution of Au in active stream sediments is thus expected to be dominated by its behaviour as a heavy mineral even if the gold is present as fine flakes. This does not, of course, preclude the possible secondary redistribution and introduction of dissolved or colloidal gold into "old" fluvial deposits, channels and alluvial terraces as reported in Kalimantan - a possibility that must be allowed for if old alluvium is being sampled.
CASE-HISTORIES
Despite the considerable activity in gold exploration throughout the region, few detailed case histories have been published. Results of two of the more complete studies - at Batu Hijau and in northern Sulawesi - are summarized below. In addition, Watters et al., (1989) and van Leeuwen (1994) have noted that the finer fractions of stream sediment are to be preferred for gold exploration in the region. Rytuba and Miller (1990), working in the western Pacific Islands of Yap and Palau, describe the successful use offine grained, intertidal mangrove swamp sediments to detect the presence of Au mineralization in inland areas adjacent to the mangrove swamps .
1. Batu Hijau (pers. comm., Newmont Exploration staff)
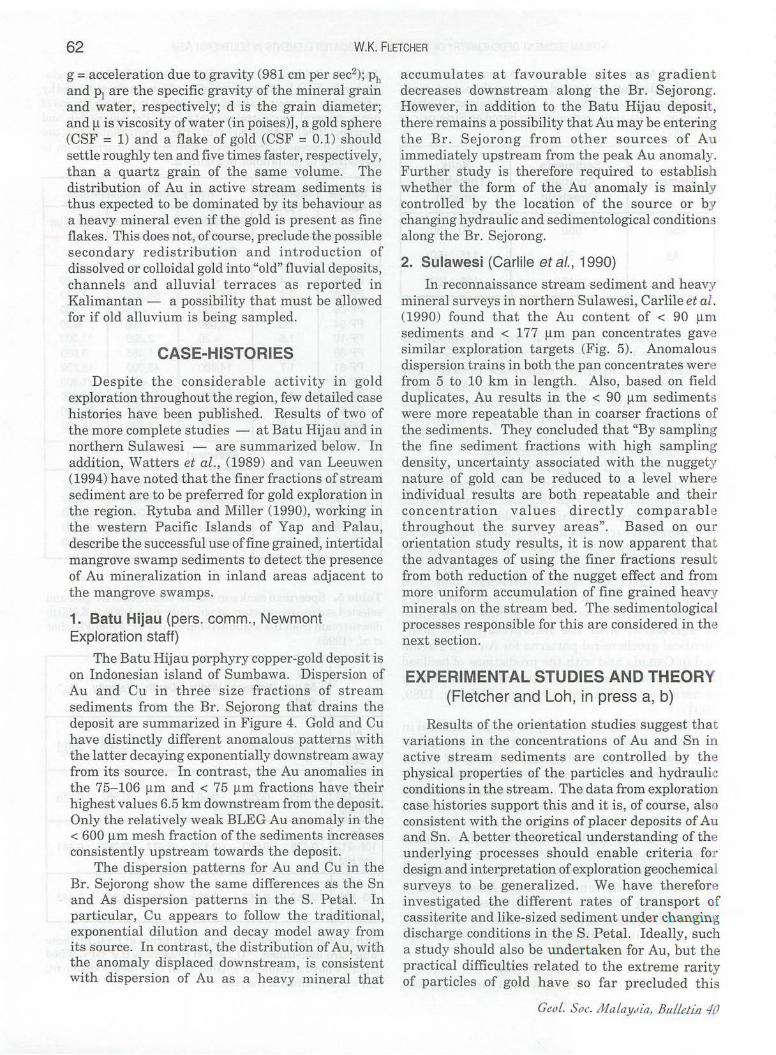
The Batu Hijau porphyry copper-gold deposit is on Indonesian island of Sumbawa. Dispersion of Au and Cu in three size fractions of stream sediments from the Br. Sejorong that drains the deposit are summarized in Figure 4. Gold and Cu have distinctly different anomalous patterns with the latter decaying exponentially downstream away from its source. In contrast, the Au anomalies in the 75- 106 !-lm and < 75 !-lm fractions have their highest values 6.5 km downstream from the deposit. Only the relatively weak BLEG Au anomaly in the < 600 !-lm mesh fraction of the sediments increases consistently upstream towards the deposit.
The dispersion patterns for Au and Cu in the Br. Sejorong show the same differences as the Sn and As dispersion patterns in the S. Petal. In particular, Cu appears to follow the traditional, exponential dilution and decay model away from its source. In contrast, the distribution of Au, with the anomaly displaced downstream, is consistent with dispersion of Au as a heavy mineral that
accumulates at favourable sites as gradient decreases downstream along the Br. Sejorong. However, in addition to the Batu Hijau deposit , there remains a possibility that Au may be entering the Br. Sejorong from other sources of A immediately upstream from the peak Au anomaly. Further study is therefore required to establish whether the form of the Au anomaly is mainly controlled by the location of the source or by changing hydraulic and sedimentological conditioll3 along the Br. Sejorong.
2. Sulawesi (Carlile etal., 1990)
In reconnaissance stream sediment and heavy mineral surveys in northern Sulawesi, Carlile et al . (1990) found that the Au content of < 90 !-lm sediments and < 177 !-lm pan concentrates gave similar exploration targets (Fig. 5). Anomalous dispersion trains in both the pan concentrates were from 5 to 10 km in length. Also, based on field duplicates, Au results in the < 90 !-lm sediment were more repeatable than in coarser fractions of the sediments. They concluded that "By sampling the fine sediment fractions with high sampling density, uncertainty associated with the nuggety nature of gold can be reduced to a level where individual results are both repeatable and their concentration values directly comparable throughout the survey areas" . Based on our orientation study results, it is now apparent that the advantages of using the finer fractions result from both reduction of the nugget effect and from more uniform accumulation of fine grained heavy minerals on the stream bed. The sedimentological processes responsible for this are considered in the next section.
EXPERIMENTAL STUDIES AND THEORY (Fletcher and Loh, in press a, b)
Results of the orientation studies suggest that variations in the concentrations of Au and Sn in active stream sediments are controlled by the physical properties of the particles and hydraulic conditions in the stream. The data from exploration case histories support this and it is, of course, also consistent with the origins of placer deposits of Au and Sn. A better theoretical understanding of the underlying processes should enable criteria for design and interpretation of exploration geochemical surveys to be generalized. We have therefore investigated the different rates of transport of cassiterite and like-sized sediment under changing discharge conditions in the S. Petal. Ideally, such a study should also be undertaken for Au, but the practical difficulties related to the extreme rarity of particles of gold have so far precluded this
Figure 3. Distribution of Au (ppb) in 53-106 j.l.m heavy mineral (SG > 3.3) concentrates and -53 j.l.m sediments from point bar and pavement environments along the Huai Hin Laep, Thailand. The assumed source ofthe Au is marked by *. Modified from Fletcher et al. (1995).
.. >2.10ppm
c:J
40 km
.. >1.31 ppm
c:J 0.06-1.31 ppm
Figure 5. Distribution of Au in: (A) -177 j.l.m pan concentrates; and B: -90 j.l.m sediments for Block 3, North Sulawesi. R = Ratatotok. Some minor anomalies have been omitted for clarity. Modified from Carlile et al. 1990.
2,000r-----------------,
:n- 1,500 a. .3: ~ 1,000
500
1,200
E 800 0. 0. ........-
(5 400
• -600 jJm (BLEG)
o 75·106jJm
•• 75jJm
• -600 jJm (BLEG)
D 75·106jJm
•• 75jJm
ou.~~ .. ~~~~~--~~--~~ 1.2 2.5 6.5 10
Distance downstream (km)
Figure 4. Distribution of Au and Cu in the -600 j.l.m, 75-106 j.l.m and -75 j.l.m fractions of stream sediments in the Br. Sejorong draining the Batu Hijau deposit, Indonesia. Au in the -600 j.l.m fraction is bulk leach (cyanide) extractable gold and in the two finer fractions after fire assay. Data courtesy ofNewmont Exploration Ltd.
(J) -; :D m > s:: (J) m o ~ m Z -; G) m o () :r: m s:: en -; :D -< o " (J) z » c > z o > (J) (J)
o ()
5> -; m o m r m s:: m z uJ z (J) o c -; :r: m > (J) -;
» (J)
5>
64 W.K. FLETCHER
-E -Q) C) ::l as C)
~
possibility. However, since the distribution of Sn and Au on stream beds are very similar (as discussed above), it seems reasonable to assume that the same processes are responsible for both, and hence to assume that a study of cassiterite forms a reasonable basis for inferences about the transport and deposition of gold in active stream sediments.
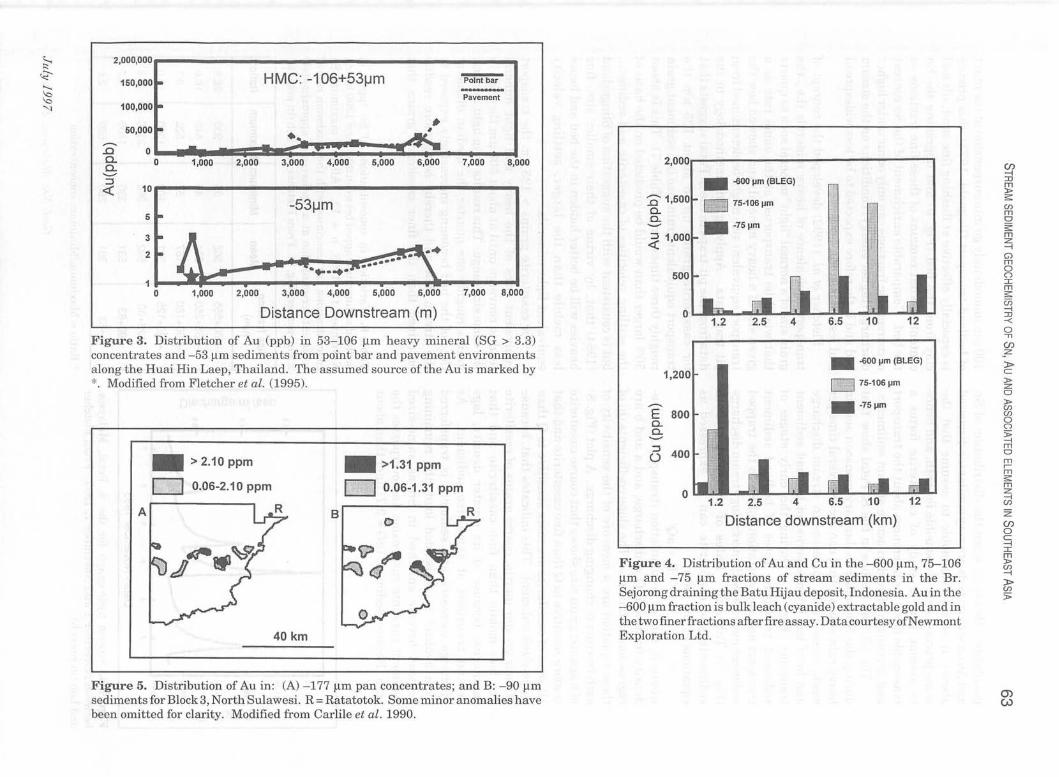
The pit-trap studies in the S. Petal show that during the November to January monsoon season heavy rain storms, that can occur several time per week, cause rapid increases in stream discharge and brief but intense period of bedload sediment transport (Fig. 6). During the early stages of sediment transport, rates of bedload sediment transport and concentrations of Sn in the trapped sediment increase with increasing stream discharge (Fig. 7; Table 6). Rates of transport of both sediments and cassiterite can be expressed as equations of the form:
R; = aQb where Ri rate of accumulation (transport) of sizedensity fraction i; Q is discharge; and a and b are regression coefficients. The slope coefficients (b) of these equation are a measure of the sensitivity of each fraction to changing discharge. A plot (Fig. 8) ofb against grain size shows that coarse cassiterite is more sensitive to Q than fine cassiterite and that all sizes of cassiterite are more sensitive to Q than same-sized sediment. This indicates that, because of their greater inertia, coarse grains of cassiterite are less mobile than fine cassiterite and that cassiterite, because of its greater density, lags behind transport of same-size sediment. As discharge increases and sediment is transferred from bedload to suspended load, the remaining bedload become enriched in Sn as same-sized sediment goes into suspension and overpasses the trap. Because sediment (SG = 2.7) finer than about
11.10
1.5 11.00 0
Q)
.!!! 10.90 1.0 '"E
Q)
10.80 2' as .c 0 II)
10.70 15
10.60 Z 3 4 5 6 7
Date - November 1993
Figure 6. Stream hydrograph for the S. Petal, Malaysia, between November 1 and November 7,1993. From Fletcher
100 Jlm immediately go into suspension at the onset of bedload transport (Bagnold, 1973), this process is especially effective at flushing fine sand, silt and clay from the bed (Fig. 9) and upgrading the Sn content of what remains of these fine fractions on the bed. Comparable enrichment of the Sn content of coarser size fractions can only occur under higher discharge (higher energy) conditions on the stream bed and is therefore expected to be less widespread and less consistent.
Fletcher et al. (1992) developed the concept of transport equivalence of heavy minerals (i.e., the grain size of a normal "light" mineral such as quartz that would be transported at the same rate as a given size of a heavy mineral) and showed how the transport equivalent size might be determined from pit trap data. Applying this methodology to the data from the pit-traps in the S. Petal suggests that for cassiterite grains up to about 125 Jlm the transport equivalent grain size is a sediment grain roughly three times larger (Table 7). This is about 50% larger than would be predicted on the basis of the settling velocities of cassiterite and sediment, but is consistent with the suggestion of Slingerland (1984) that, by virtue of their smaller size, fine heavies will be better hidden in the bed and hence less mobile than the larger, settling velocity equivalent light minerals.
For cassiterite grains > 125 Jlm the transport equivalent sizes of the heavy and light mineral tend to converge until at about 500 Jlm they fall in the same size range. This results from light mineral grains roughly one quarter the median diameter (Md) of the bed becoming increasingly exposed to the stream flow and thereby being more readily entrained than the finer cassiterite grains that
Table 6. Variation in concentrations of Sn (ppm) in bedload sediments trapped between 0900 and 1300 hours, November 13, 1993. n = 12. All the maximum Sn concentrations are associated with the maximum rate of sediment accumulation at a discharge of approximately 2.2 m3 per sec (Fig. 8). From Fletcher and Loh (in press a).
Figure 8. Slope coefficients (b) for cassiterite and sediment versus grain diameter (dj ) and the ratio of grain diameter to bed median diameter (d/dm). b is derived from equations of the form Rj = aQbwhere Rj is size-density fraction i, Q is discharge. The graph is based on data, shown party in Fig. 7 a and 7b, from the S. Petal November 13,1993 for values ofQ up to 2.2 m3 /sec. Based on Fletcher and Loh (in prep).
'C' ::lIO,OOO ,..-----------------------...,
o _J::. 0.365-.5 0.18-0,25 0.01J.q.U5 <0.083 -e- -..... --)lEo' -lj' ~ ---mm C) 0.25-0.355 0.125-0.18 0.083-0.09 E 1,000 -c: o ~ 100
Figure 7b. Rate of accumulation of Sn in a pit-trap in the S. Petal, Malaysia, versus discharge on November 13,1993. From Fletcher and Loh (in press a).
Figure 9. Grain size distribution of transported sediments in the S. Petal, Malaysia, R-max = texture at maximum rate of sediment accumulation in the pittrap, and Q-maxand Q-min are at maximum and minimum discharge respectively. Data for November 13, 1993. From Fletcher and Loh (in press b).
0> 01
66 W.K. FLETCHER
remain fully hidden in the bed. In Figure 8 this increased exposure to the flow of the larger light mineral grains is reflected in slope (b) coefficients decreasing for grains sizes> 0.25 Md' Based on these findings, Fletcher and Loh (in press b) show that transport equivalence can (only) be used to correct Sn data for hydraulic effects provided that both the heavy mineral and its transport equivalent size are sufficiently small to be fully hidden in the bed. In practice, this means that light minerals grains that are the transport equivalent size to the heavy mineral must be finer than about 0.25 Md of
the bed. For example, on a stream bed with a median grain size 2 mm light mineral grains up to about 500 J.l.m would be fully hidden. In this situation transport equivalence could probably be used to correct geochemical data for Au and Sn in size fractions up to 100 and 170 J.l.m, respectively. This assumes that the transport equivalent sizes of cassiterite and gold are light mineral grains some 3 and 5 times larger diameter (Table 8). An example of the application of transport equivalence to interpretation of geochemical data is given in the next section.
Table 7. Coefficients of variation, hydraulic and transport equivalent size ranges of cassiterite. N = 29. From Fletcher and Loh (in press b).
Cassiterite size Hydraulic equivalent Transport equivalent CV.orb (~) size range (~). size range (~)b
a Based on Stoke's Law the hydraulic equivalent size (dhe) is calculated as:
dhe = dm x + "(SGs. - 1.0) I (2.7 - 1.0) = 1.88dm (for SGs• = 7.0)
where d.n and SG.n are, respectively, the diameter and specific gravity of a cassiterite grains
CVtesb
0.92 0.83
0.51 0.44 0.58
0.27
(nb: Stokes Law is only applicable strictly to particles having diameters less than about 0.20 mm).
Table 8. Cassiterite and gold: estimated hydraulic equivalent sizes, transport equivalent sizes, and the range of application for use of the transport equivalent sizes to correct for winnowing on stream beds of different roughness. From Fletcher and Loh (in press b).
Grain size Hydraulic equivalent Transport equivalent ~) slze(~)· slze(~)b
a Hydraulic equivalent size (HES) calculated from Stoke's Law as in Table 4. bTES: transport equivalent size estimated as HES + (HES*0.50).
Bed 0&O(~) 0&0 (~) x 0.25
3.00 2.00 1.00 0.75 0.50 0.25
TES usable range
··c •• .* *. ** *.
** ** .* **
c** Indicates that diameter of the transport equivalent light mineral grains is < (D5000.25) and that such grains will be "fully" hidden in the bed, i.e. the abundance of the transport equivalent grain size should be usable to correct for winnowing effects.
Geol. Soc. MalaytJia, Bulletin 40
STREAM SEDIMENT GEOCHEMISTRY OF SN, Au AND ASSOCIATED ELEMENTS IN SOUTHEAST ASIA 67
DISCUSSION AND APPLICATIONS
The orientation studies and case histories can now be discussed on the basis of the results from the pit-traps. Most importantly the onset of bedload transport in any stream is accompanied by removal of the finer fraction « 100 11m) in suspension Bagnold (1973). In tropical regions with frequent rain storms, the cumulative effect of is to flush and eliminate fine sediments from the beds of undisturbed rain forest streams as also observed by Pickup et al. (1981) in Papua New Guinea. The heavy mineral content of the fine fractions that remain on the stream bed is thereby enriched. For a heavy mineral of a given density the lower size limit to this enrichment process will be determined by the grain size at which the heavy minerals are immediately transferred to suspended load at the onset of bedload motion. Stokes Law allows us to predict that cassiterite and gold spheres of approximately 50 11m and 30 11m diameter, respectively, will have the same settling velocities as light mineral grains (SG 2.7) 100 11m diameter. However, gold flakes (CSF = 0.1) have a settling velocity roughly half that of spheres of the same mass (Walsh and Rao, 1986), so it seems more reasonable to assume a lower limit of this enrichment process at about 50 11m diameter for both cassiterite and gold. This has the very important practical implication that use of the fine
Table 9. Sediment yield in forested and logged catchments in Malaysia and Papua New Guinea. From Douglas et al. (1992).
Catchment Area (km2) Yield (t.km·2y-')
Lowland forested areas in Malaysia Sg. Telom 77 53 Sg. Mupor 21.8 41 Sg. Gombak 140 97 W8S5* 1.1 312
Lowland logged areas in Malaysia Sg. Tekam 0.47 660 Bkt. Berembun 0.30 189 Sipitang 0.15 300 Baru* 0.56 1,600
Forested area in Papua New Guinea"" Ok Ningi 4.56 10,746 Ok Tedi 420 7,857
* The W8S5 and Baru catchments are close together in lowland rain forest in Sabah, Malaysia. They were studied over the same period by Douglas et al. (1992).
** The very high sediment yields in these streams result from high relief and very high precipitation (Pickup et al., 1981).
JuLy 1997
sand fractions, between 50 and 100 J..Lm, is most likely to give the longest and most consistent geochemical anomalies for elements dispersed as heavy minerals. Also, because for a given concentration the finer fractions will contain the greatest number of heavy mineral grains, use of these fractions reduces sampling errors and minimizes the nugget effect. Referring to the results of the orientation and case history studies, the underlying sedimentological basis for use of the fine fractions is now apparent.
A disadvantage sometimes encountered with the finer fractions is their relatively scarcity on the stream bed. Where this presents a problem and coarser material (e.g., 180 11m) is used it should be realized that heavy mineral content of these coarser fractions will only be upgraded at relatively high energy sites. Such sites, which are characterized by coarser bed material, often occur at the heads of bars or where the stream narrows and are commonly referred to as trap sites. Results obtained for coarse fractions at such sites are likely to be relatively erratic because of both the poorer sampling statistics for coarser particles and because the heavy minerals in these fractions are much less consistently upgraded by the stream. Furthermore, the anomalies can be displaced a considerable distance downstream from the source of the heavy minerals (e.g., Figs. 1 and 3) - possibly leading to confusion during interpretation and wasted effort during follow-up. These displaced "hydraulic" anomalies can be identified by several criteria: (i) absence of anomalous concentrations of the chemically mobile pathfinder elements, such as the base metals, that become separated during the dispersion process (Fig. 1B); (ii) reduction of anomaly contrast if concentrations are expressed relative to the abundance of the transport equivalent size fraction. For example, for fine cassiterite, the transport equivalent size fraction is roughly three times coarser (Table 7), so that to correct the original Sn data in Figure 1C for hydraulic effects, Sn concentrations in the 53-75 11m fraction have to be recalculated as:
Snte• = Sn53-75 * W53-7/W150-212
where Sn53-75 is the measured Sn content of the 53-75 11m fraction; W53-75 is the weight of the 53-75 11m fraction; and W150-212 is the weight of the 150-212 11m fraction. The corrected result, Sntes is shown as the dotted line in Figure lC; or, (iii) reduction of anomaly contrast if the anomaly is ratioed to another, relatively ubiquitous heavy mineral, e.g., magnetite as shown in Figure 1D. Finally, information on such field parameters as stream velocity, width, and bed roughness may indicate that conditions are particularly favourable for heavy mineral enrichments to have developed
68 W.K. FLETCHER
at a site (e.g., Table 5). Problems can also arise with the use of the fine
sediment fractions when they are too abundant. In the SE Asian region this situation can result from removal of the forest cover and conversion of the land to agriculture. For example, in the Huai Hin Laep soil erosion, caused by the monsoon rains falling on newly ploughed fields, transfers more fine material to the stream than the stream has the capacity to transport (Fig. 10) and concentrations of Au in the sediments are diluted to < 5 ppb (Table 4). Thus, geochemical heavy-mineral anomalies that would normally be upgraded by stream processes can be subjected to considerable dilution in disturbed watersheds. Insofar as the contribution of eroded tropical soils to the stream sediments consists largely of clay sized material, one answer to this problem might be to collect two samples: one a conventional stream sediment sample including the silt and clay fractions, and the other sample wet sieved through a 53 !lm screen to retain only the (fine) sand fraction for analysis. For example, based on Paopongsawan and Fletcher (1993), the Au content of the -106 !lm fraction of sediments from the Huai Hin Laep would typically be < 5 ppb Au. However, elimination of the -53 !lm component by wet sieving and analysis of the -106+53 !lm fraction would give average Au values of 60 and 160 ppb Au depending on wether samples were collected from bar or pavement sites, respectively.
Logging of tropical rain forests also increases soil erosion and sediment yield (Table 9): however, geochemical aspects of this are only now being studied. Results of the orientation survey in the mature rubber estate at Tanjong Tualang suggest that once a groundcover of vegetation is reestablished, geochemical patterns on the stream bed eventually tend to return to their pre-
disturbance condition (Sirinawin et al., 1987).
CONCLUSIONS
Field studies and sedimentological theory suggest that, in undisturbed streams in the rain forests of SE Asia, the longest and most consistent geochemical anomalies for elements associated with heavy minerals will be in the sand fractions finer than about 100 !lm. Anomalies can also be found in the coarser fractions, particularly at heavy mineral trap sites formed in high energy environments, but these anomalies are typically more erratic. During interpretation, heavy mineral accumulations that form at hydraulically favourable sites can be distinguished from anomalies close to their bedrock source by: (i) absence of the more chemically mobile pathfinder elements; (ii) by re-presenting data with respect to either a relatively ubiquitous heavy mineral (e.g., magnetite), or to the sediment size fraction that is the transport equivalent of the heavy mineral; and (iii) observations on field parameters such as stream width, bed roughness, velocity and gradient. The possible dilution of heavy mineralgeochemical anomalies should be taken into account in disturbed watersheds.
ACKNOWLEDGEMENTS
The author's understanding of stream sediment geochemistry in tropical rain forests has benefited considerably from work with graduate students at the University of British Columbia, and with colleagues at the Geological Survey of Malaysia and the former South East Asia Tin Research and Development Centre. In particular, the contributions of Stanley Loh, Pasakorn Paopongsawan and Thanawut Sirinawin must be mentioned.
~r-::::----;~================~I Sediment 100
&0
-C40
~ Q) 0. 30 -.J::. C)
~20
10
0 ..... _ ........
Gravel Cs.sand Med. sand
Size fraction Sift
Figure 10. Size distribution of sediment and soils from the RuaiRin Laep, Thailand. Number above sediment columns are the weight percent of each fraction. The unusually high content of silt and clay (17.47%) in the sediment results from large inputs from soil erosion. Based on Paopongsawan and Fletcher (1993).
GeoL. Soc. MaLaY.Jia, BuLLetin 40
STREAM SEDIMENT GEOCHEMISTRY OF SN, Au AND ASSOCIATED ELEMENTS IN SOUTHEAST ASIA 69
REFERENCES
BAGNOLD, RA., 1973. The nature of saltation and of 'bed-load' transport in water. Proc. R. Soc. Lond. A, 332, 473-504.
CARLILE, J.C, DIGOOWIROGO, S. AND DARIUS, K, 1990. Geological setting, characteristics and regional exploration for gold in the volcanic arcs of North Sulawesi, Indonesia. J. Geochem. Explor. 35, 105-140.
DAY, S.J. AND FLETCHER, W.K, 1989. Effects of valley and local channel morphology on the distribution of gold in stream sediments from Harris Creek, British Columbia, Canada. J. Geochem. Explor., 32, 1-16.
DAY, S.J. AND FLETCHER, W.K, 1991. Concentrations of magnetite and gold at bar and reach scales in a gravelbed stream, British Columbia, Canada. J. Sed. Pet., 61, 871-882.
DOUGLAs, 1., SPENCER, T., GREER, T., BIDIN, K, SINUN, W. AND
WONG, W.M., 1992. The impact of selective commercial logging on stream hydrology, chemistry and sediment loads in the Ulu Segama rain forest, Sabah, Malaysia. In: A.G. Marshall and M.D. Swaine (Eds.), Tropical Rain Forest: Disturbance and Recover. The Royal Society of London, 397-406.
FLETCHER, W.K, 1994. Behaviour and exploration geochemistry of cassiterite and other heavy minerals in stream. J. Southeast Asia Earth Sci., 10,5-10.
FLETCHER, W.K., CHURCH, M. AND WOLCOTT, J., 1992. Fluvial transport equivalence of heavy minerals in the sand size range. Can. J. Earth. Sci., 29, 2017-2021.
FLETCHER, W.K. AND DAY, S.J., 1989. Behaviour of gold and some other heavy minerals in drainage sediments: some implications for exploration geochemical surveys. Trans. Inst. Min. Metall. 98, B13O-B136.
FLETCHER, W.K, DOUSSET, P.E. AND YUSOFF BIN ISMAIL, 1984a. Distribution of tin and associated elements in soils at Ulu Petal, BujangMelaka, Perak, Malaysia. Rpt. of Investigation 32, SEATRAD Centre, 70p.
FLETCHER, W.K, DOUSSET, P.E. AND YUSOFF BIN ISMAIL, 1984b. Behaviour of tin and associated elements in a mountain stream, Bujang Melaka, Perak, Malaysia. Rpt. of Investigation 24, SEATRAD Centre, 71 p.
FLETCHER, W.K, DOUSSET, P.E. AND YUSOFF BIN ISMAIL, 1986. Behaviour of tin and associated elements in a mountain stream, Bujang Melaka, Perak, Malaysia. GEOSEA V Proceedings Vol. II. Geol. Soc. Malaysia Bull. 20, 701-762.
FLETCHER, W.K, DOUSSET, P.E. AND YUSOFF BIN ISMAIL, 1987, Elimination of hydraulic effects for cassiterite in a Malaysian stream. J. Geochem. Explor. 28, 385-408.
FLETCHER, W.K, LAHIRI, R, CAUGHLIN, B.L. AND BWK, H., 1995.
Use of a sensitive analytical method and the silt-clay « 53 /lm) fraction of stream sediments in exploration for gold in northern Thailand. J. Geochem. Explor., 55, 301-307.
FLETCHER, W.K AND LoH, CH. Transport of cassiterite in a Malaysian stream: implications for geochemical exploration. In press a: J. Geochem. Explor.
FLETCHER, W.K AND LOH, CH., Fluvial transport equivalence of cassiterite in a Malaysian stream. In press b: J. Geochem. Explor.
FLETCHER W.K AND LOH, CH. Sedimentology of cassiterite in a Malaysian stream. In preparation.
LJUNGGREN, P. AND SUNDBORG, A., 1968. Some aspects of fluvial sediments and fluvial morphology, II. A study of some heavy mineral deposits in the valley of the river Lule. Alv. Geogr. Ann.,50A, 121-135.
PAOPONGSAWAN, P., 1991. Behaviour of gold in stream sediments, Huai Hin Laep, Loei region, northeastern Thailand. Unpub!. MSc Thesis, University of British Columbia, 178p.
P AOPONGSAWAN, P. AND FLETCHER, W.K, 1993. Distribution and dispersion of gold in point bar and pavement sediments in the Huai Hin Laep, Loei, northeastern Thailand. J. Geochem. Explor., 47, 251-268.
PICKUP, G., HIGGINS, RA. AND WARNER, RF., 1981. Erosion and sediment yield in the Fly River drainage basins, Papua New Guinea. Int. Assoc. Hydrol. Sci. Pubis. No. 132,438-456.
RYTUBA, J.J. AND MILLER, W.R, 1990. Geology and geochemistry of epithermal precious metal vein systems in the intraoceanic arcs of Palau and Yap, western Pacific. J. Geochem. Explor., 35, 413-447.
SIRINAWIN, T., FLETCHER, W.K AND DOUSSET, P.E., 1987. Evaluation of geochemical methods in exploration for primary tin deposits, Batu Gajah-Tanjong Tualang area, Perak, Malaysia. J. Geochem. Explor., 29, 165-181.
SLINGERLAND, R, 1984. Role of hydraulic sorting in the origin of fluvial placers. S. Sediment. Petrol., 54,137-150.
SLINGERLAND, R AND SMITH, N.D., 1986. Occurrence and formation of water-laid placers. Annu. Rev. Earth Planet. Sci., 14, 113-147.
VANLEEUWEN, T.M., 1994. 25 Years of mineral exploration and discovery in Indonesia. J. Geochem. Explor., 50, 13-90.
WATTERS, RA., TUCKER, G.B.H. AND SOESILA, B., 1989. Reconnaissance and follow-up exploration for gold in central Kalimantan, Indonesia. J. Geochem. Explor., 41, 103-123.
WALSH, D. E. AND RAo, P.D., 1986. A study offactors suspected of influencing the settling velocity of fine gold particles. Final Report, U.S. Bureau of Mines Research Grant No. 1154102,75p.
----------... -~~.-.---------Manuscript received 8 May 1996