21
Streamline-based History Matching of Arrival Times and Bottom-Hole Pressure Data for Multicomponent Compositional Systems Shusei Tanaka November, 2015
| Date post: | 14-Apr-2017 |
| Category: |
Engineering |
| Upload: | shusei-tanaka |
| View: | 52 times |
| Download: | 0 times |

Streamline-based History Matching of Arrival
Times and Bottom-Hole Pressure Data for
Multicomponent Compositional Systems
Shusei Tanaka
November, 2015

Motivation
Streamlines0.0
0.1
0.2
0.3
0.4
0.5
0.6
0.7
0.8
0.9
0 500 1000 1500 2000
Wat
er C
ut
Time [Days]
0
0.1
0.2
0.3
0.4
0.5
0.6
0.7
0.8
0.9
1
0 500 1000 1500 2000
CO
2M
ole
Fra
ctio
n
Time [Days]
WCT/GOR
0
200
400
600
800
1000
1200
1400
1600
1800
2000
0 50 100 150 200
Bo
tto
m H
ole
Pre
ssu
re
Time [Days]
0
200
400
600
800
1000
1200
1400
1600
1800
2000
0 50 100 150 200
Bo
tto
m H
ole
Pre
ssu
re
Time [Days]
BHP
Observation
Initial
2/21
Update in geological model
What can we tell prior to injected water breakthrough?
• Pressure data needs to be incorporated within streamline framework
How to generalize streamline-based history matching to multicomponent compositional system?
• Need to develop a technique to integrate pressure and component information

Objectives
Propose a novel approach to compute pressure and injected gas arrival time sensitivity using streamlines• Analytic sensitivity of bottom hole pressure (BHP), GOR and injection
component
• Application to compositional, gas injection problem
Simultaneous inversion of BHP, GOR and primary injection component• Integrate gas production data with injector and producer BHP
• Application to the Brugge benchmark case
3/21
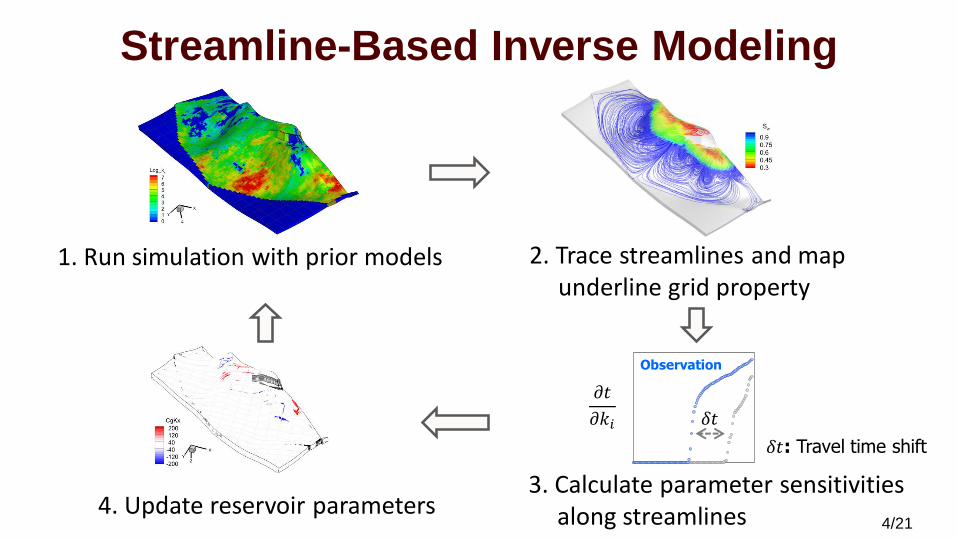
Streamline-Based Inverse Modeling
1. Run simulation with prior models 2. Trace streamlines and map underline grid property
4. Update reservoir parameters
0.0
0.1
0.2
0.3
0.4
0.5
0.6
0.7
0.8
0.9
0 500 1000 1500 2000
Wat
er
Cu
t
Time [Days]
𝛿𝑡
Observation
𝜕𝑡
𝜕𝑘𝑖
3. Calculate parameter sensitivities along streamlines 4/21
𝛿𝑡: Travel time shift
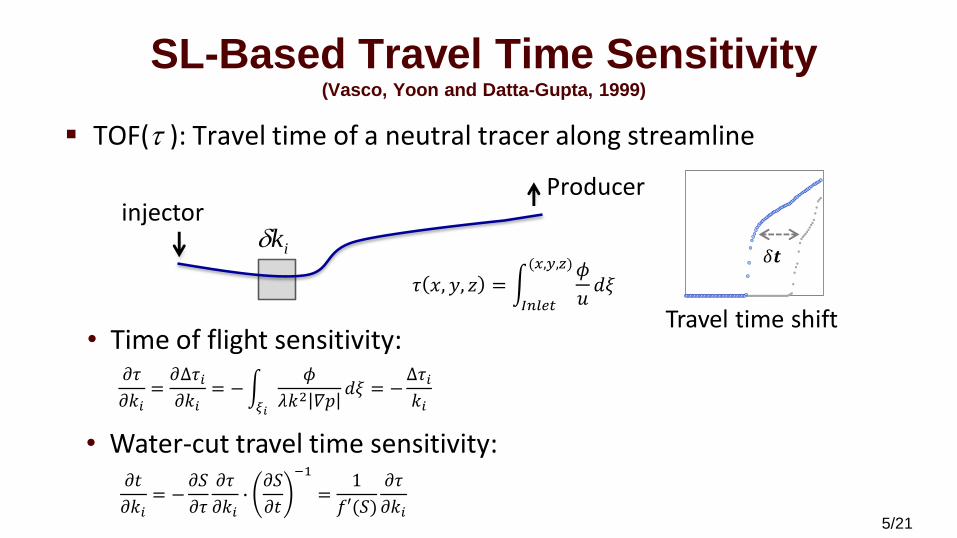
SL-Based Travel Time Sensitivity(Vasco, Yoon and Datta-Gupta, 1999)
TOF(t ): Travel time of a neutral tracer along streamline
ik
0.0
0.1
0.2
0.3
0.4
0.5
0.6
0.7
0.8
0.9
0 500 1000 1500 2000
Wat
er
Cu
t
Time [Days]Travel time shift
injectorProducer
𝜏 𝑥, 𝑦, 𝑧 = න𝐼𝑛𝑙𝑒𝑡
(𝑥,𝑦,𝑧)𝜙
𝑢𝑑𝜉
𝛿𝒕
𝜕𝜏
𝜕𝑘𝑖=𝜕∆𝜏𝑖𝜕𝑘𝑖
= −න𝜉𝑖
𝜙
𝜆𝑘2 𝛻𝑝𝑑𝜉 = −
∆𝜏𝑖𝑘𝑖
𝜕𝑡
𝜕𝑘𝑖= −
𝜕𝑆
𝜕𝜏
𝜕𝜏
𝜕𝑘𝑖∙𝜕𝑆
𝜕𝑡
−1
=1
𝑓′(𝑆)
𝜕𝜏
𝜕𝑘𝑖
• Time of flight sensitivity:
• Water-cut travel time sensitivity:
5/21

SL-Based Bottom Hole Pressure Sensitivity
Use local pressure drop along streamline and underline property
Rate-Rate constraint
Rate-BHP constraint
• Bottom hole pressure sensitivity along streamline
ikinjector
Producer
0
200
400
600
800
1000
1200
1400
1600
1800
2000
0 50 100 150 200
Bo
tto
m H
ole
Pre
ssu
re
Time [Days]Production BHP
i
ini
ii k
ppppp
kk
p
......21
𝜕𝑝𝑏ℎ𝑝
𝜕𝑘𝑖= ±
𝜕∆𝑝𝑖𝜕𝑘𝑖
≈ ±∆𝑝𝑖𝑘𝑖
𝜕𝑝𝑏ℎ𝑝
𝜕𝑘𝑖≈ ±
𝜏𝑖𝜏
𝜕∆𝑝𝑖𝜕𝑘𝑖
≈ ±𝜏𝑖𝜏
∆𝑝𝑖𝑘𝑖
6/21

Sensitivity Comparison: 3-phase Gas Injection
-20.0
-15.0
-10.0
-5.0
0.0
0.0 0.5 1.0
Pre
ssu
re S
en
siti
vity
, wrt
k
Normalized Distance
Analytical (Stremaline)
Adjoint Method
0.0
5.0
10.0
15.0
20.0
0.0 0.5 1.0
Pre
ssu
re S
en
siti
vity
, wrt
k
Normalized Distance
Analytical (Stremaline)
Adjoint Method
Inj: Gas Rate
Prd: Rate
Producer BHP sensitivity to k
Injector BHP sensitivity to k
7/21
AdjointStreamline

Sensitivity Comparison: 2D Areal Example
Injector BHP sensitivity by k
P4 BHP sensitivity of by k
Permeability field(Wells by rate constraint)
Adjoint Proposed
8/21
Injector
P1
P2 P3
P4

Extension to Multicomponent System:
Gas and Component Sensitivity Equation
𝜕𝑡
𝜕𝑘𝑖= −
𝜕𝜏𝜕𝑘𝑖
𝜕𝜕𝜏
𝑆𝑔𝑏𝑔 + 𝑅𝑆𝑆𝑜𝑏𝑜
𝜕𝜕𝜏
𝐹𝑔𝑏𝑔 + 𝑅𝑆𝐹𝑜𝑏𝑜 +𝑐𝜙
𝐹𝑔𝑏𝑔 + 𝑅𝑆𝐹𝑜𝑏𝑜
• Travel time sensitivity of gas (GOR)
Pro
du
cer
Mo
le F
ract
ion
/GO
R [
-]
Time [Days]
Observed
Initial
Updated
9/21
𝜕𝑓𝑘𝜕𝑘𝑖
=𝜕𝑓𝑘𝜕𝑧𝑘
𝜕𝑧𝑘𝜕𝜏
𝜕𝜏
𝜕𝑘𝑖
• Amplitude sensitivity of the production component (primary injection component):
GOR is informative, but applicable only if pressure data is matched
Limited data points but able to match breakthrough of injected gas component at producer
GOR
Mole fraction
Travel time toMaximize overlap
Amplitude match of each data point

Sensitivity Comparison:
2D Areal CO2 Flood, Gas Travel Time
NumericalPermeability field SL-based AnalyticalP4
10/21
Injector
P1
P2 P3

Sensitivity Comparison:
2D Areal CO2 Flood, CO2 Amplitude
Numerical SL-based Analytical
11/21
Permeability fieldP4
Injector
P1
P2 P3

Permeability Update by Iterative Linearized
Inversion (LSQR)
• Define a penalized misfit:
• Iterative inversion to update parameters :
Advantages:• Post process to compute sensitivities analytically along streamlines • High resolution updates in permeability to match well data
Injection component GOR - Smoothness
- Consistency with prior
static model
Scaled by stdev
min 𝛿𝐝𝑖𝑐 − 𝐒𝑖𝑐𝛿𝐤 + 𝛿𝐝𝐺𝑂𝑅 − 𝐒𝐺𝑂𝑅𝛿𝐤 + 𝛿𝐝𝑏ℎ𝑝 − 𝐒𝑏ℎ𝑝𝛿𝐤 + 𝛽1 𝐈𝛿𝐤 + 𝛽2 𝐋𝛿𝐤
𝐒𝑖𝑐𝐒𝐺𝑂𝑅𝐒𝑏ℎ𝑝𝛽1𝐈𝛽2𝐋
∆𝐤 =
𝛿𝐝𝑖𝑐𝛿𝐝𝐺𝑂𝑅𝛿𝐝𝑏ℎ𝑝00
Pressure
12/21

History Matching: Multicomponent Gas
Injection
• 7 component 5-spot CO2 injection• Matching injection BHP, production GOR and CO2 mole fraction
Reference model Initial model
Inj
P1
P2P3
P4
13/21

0.0
0.5
1.0
0 1000 2000 3000
Pro
du
ctio
n C
O2
Mo
le F
ract
ion
[-]
Time [Days]
Observed P1 Observed P2 Observed P3 Observed P4 Initial P1 Initial P2 Initial P3 Initial P4
Initial Data Misfit
Injector BHP(Amplitude, average)
Production GOR(Travel Time)
Producer CO2 composition
(Amplitude, every point)
14/21
observed
Calculated

Reduction in Objective Functions
Data mismatch wrt. iteration(Normalized RMSE)
15/21

Data Misfit After History Match
Injector BHP Production GOR Producer CO2composition
16/21

Updated Permeability Field
Reference model Initial model Updated
17/21
Injector
P1
P2 P3
P4
DecreasedIncrased

History Matching of Brugge Benchmark Field
• Use simulation result of realization 77 as observed data• Use realization 1 as initial model• Match GOR, BHP and end time production CO2 (at 10 yrs)
Reference model Initial model
Producer
CO2 Injector
18/21

Change in Permeability
19/21
Reference k Initial k
Change of k, GOR Change of k, using all data
High perm at middle layer

Reduction in Data Misfit per Well
20/21
Pressure RMS error(30 wells)
GOR RMS error(10 producers)
Individual well
Mean
Production CO2 mole fraction at 10 yrs
(20 producers)

Conclusion
21/21
We have developed a novel Streamline-based method to integrate pressure data into prior geologic models
• Can be applied to field data prior to breakthrough with water/gas injection multicomponent system
The method offers the same advantages as prior streamline work:• Analytic calculation of sensitivities comparable with Adjoint-
based calculation• Requires single flow simulation per iteration • Applicable with conventional Finite Difference simulations


![1728EX+ : Programming Guide - safe-tech · 02 ... Streamline section Streamline Streamline section Streamline section ... 1728EX+ : Programming Guide Keywords [English] Created Date:](https://static.documents.pub/doc/80x56/5b84d6a77f8b9aec488d14a4/1728ex-programming-guide-safe-02-streamline-section-streamline-streamline.jpg)


