Table of Contents Overview.............................................................................................................................................................. 3 Installation........................................................................................................................................................... 3 Running Streamline-ENV ................................................................................................................................... 3 Setting Preferences ............................................................................................................................................ 3 Preparing to work with YSI Sondes and Handhelds........................................................................................ 4 Tools for YSI Sondes and Handhelds............................................................................................................... 5
Explorer - Uploading Files from a YSI sonde or Handheld ............................................... 5 To upload files from a device to your computer.................................................................. 5
Calibration Manager – Advanced 6-Series Calibrations ................................................... 6 Calibrate sensors on a YSI sonde .................................................................................... 7 Display, print and export calibration reports...................................................................... 9 Retrieve calibration constants stored in the sonde.............................................................10 View the calibration history ...........................................................................................10
Configuration Manager – Manage and Document Sonde Configurations .......................... 11 To access and edit a sonde configuration .........................................................................11 Store a configuration in a template file ............................................................................11 Upload the configuration changes to the sonde .................................................................12 Load a Configuration Template.......................................................................................12
Template Manager – Manage and Organize Configuration Templates ............................ 12 Deployment Wizard – Setup Sondes and Deploy or collect Sonde or GPS Data ............... 13 Terminal Emulator – Traditional Instrument Communication Interface ......................... 13
Data Processing and Analysis......................................................................................................................... 14 Analyst – QA/QC, Statistics, Charts, Tables, Data Screening and More .......................... 14
A. Resource Panel Features ..........................................................................................15 B. Features of the Quick-Action Toolbar..........................................................................16 C. Features of the File Listing........................................................................................16 D. Features of the Charting Area ...................................................................................17 E. Features of the Data Table........................................................................................17
Analyst – How to Section............................................................................................. 18 To Start Analyst ..........................................................................................................18 To Open and View a Data File ........................................................................................18 To Customize Charts, Parameters & Limits .......................................................................18 To Set Start and End Time Limits for the File....................................................................19 To Export the Data from the Spreadsheet ........................................................................21 To Copy a Random Section of the Spreadsheet.................................................................21 To Perform Quality Assurance/ Quality Control Operations ..................................................22 To Perform Statistical Analyses and Produce Reports .........................................................25 To Create a Database or Inventory Report of your Data Files ..............................................27
To Export Multiple Files.................................................................................................28 Merging Files..................................................................................................................................................... 29
File Merge Module ....................................................................................................... 29 To Merge Files with Matching Parameters.........................................................................29 To Merge Files with Different Parameters or Time Periods...................................................31
Streamline-ENV Operators Guide http://riocean.com
Interactive Oceanographics 81 Shippee Road East Greenwich, RI USA 02818
Overview This guide provides details and instructions for Streamline-ENV environmental monitoring software. The
intent is to provide a basic overview of the features and functions that are utilized to interface with YSI sondes, handhelds and GPS receivers and complete basic operations such as calibrating a sonde, setting up a deployment, collecting and uploading data from a sonde or GPS, and analyzing and viewing data. The latest version of this document can be downloaded from http://www.riocean.com/sl/slenvguide.pdf.
Installation Streamline-ENV operates on personal computers running a Windows operating system. The installation
setup program is available for download on our web site at http://www.riocean.com. Follow these steps to install Streamline-ENV:
1. Download the installation setup program slsetup.exe. 2. Run the self-extracting file. Select ‘Unzip’ to automatically extract the necessary setup program files
and launch the installer. 3. Follow the on-screen instructions to complete the installation. 4. After the installation completes restart the computer.
Running Streamline-ENV During the installation of Streamline-ENV, shortcuts for Streamline-ENV are created in the Start menu and
in a folder on the desktop. Look in Window’s Start Menu or on the desktop for the ‘Interactive Oceanographics’ folder and select it. Click on the ‘Streamline-ENV’ icon to start the program.
If you are running a trial version the Registration form is displayed first. Click the button labeled ‘Continue with Trial’ to start the program. The trial version will function for 21 days without a license.
Setting Preferences After Streamline-ENV has opened, select VIEW PREFERENCES from the main menu to open the
Preferences dialog box. The settings on the left-hand side of the Preferences window (General, Chart, Tables and Calibrations) are preset to favorable values and can be left unchanged for now. Fill in your organization’s information on the right hand side of the dialog. The information is used to personalize sonde calibration reports. Add your name to the Operators list by pressing the ‘+’ button. Add names of any co-workers that will work with the calibrations. The name selected in the drop-down list will appear on calibration reports.
If YSI’s Code Updater is installed, click the Folder icon under Firmware Updates. Specify the folder where the Code Updater program is installed. A checkmark indicates the Code Updater was located in the specified folder.
Streamline-ENV Operators Guide http://riocean.com
Interactive Oceanographics 81 Shippee Road East Greenwich, RI USA 02818
Preparing to work with YSI Sondes and Handhelds The TOOLS menu provides access to various programs used to manage YSI sondes and 650 handhelds
and even GPS devices. The first step to working with your instrument is to add it to the instrument database. Instruments are added to the database using Device Manager. Device Manager (see figure below) is accessed from the main menu (TOOLS DEVICE MANAGER). As an example, the following steps are followed to add sonde to the database: 1. Click the down arrow next to the (+Add Device) button and select ‘YSI 6-series’ from the drop-down
menu. An icon is added to the left hand frame for the 6-series instrument and the communications settings will be set to standard values. The icon links to the new instrument item (in this case a sonde) that is created in the database.
2. In the ‘Device Properties’ frame on the top right, enter the serial number of the sonde shown on the product label located on the outside of the sonde housing. If desired, a name may be given to the instrument and notes may be added in the appropriate fields.
3. Make any necessary changes to the communication settings. 4. Connect the sonde to the computer’s serial port using the cable provided by the manufacturer and
make sure the sonde has sufficient battery or external power. 5. Click ‘Apply’ to save the setting and then select the ‘Test Device’ command. During the test
process, Device Manager will attempt to connect to the sonde using the specified port and communications settings. A status bar located at the bottom of the window details the progress of the test and provides an error message if a connection is not established with the sonde.
6. If communications are established with the sonde, then the firmware version, internal serial number and device type are read from the sonde and displayed remaining fields in the ‘Device Properties’. Streamline-ENV requires the sonde to have firmware version 2.27 or greater. If the sonde has earlier firmware it will need to be updated using the YSI Code Updater available from YSI’s website (http://www.ysi.com). The internal serial number, which may be different from the one on the outside label, are included on calibration and data reports generated by Streamline-ENV providing an efficient means to associate and track sondes.
7. Press ‘Apply’ to save the information. Repeat steps 1-7 to add more instruments to the database.
Streamline-ENV Operators Guide http://riocean.com
Interactive Oceanographics 81 Shippee Road East Greenwich, RI USA 02818
Tools for YSI Sondes and Handhelds Once the communications test has been successfully completed you may access tools to calibrate,
upload files and configure instruments using Device Manager. (Note: GPS receivers can be added to the database and a communications test can be run however there are no advanced tools available for GPS. GPS data can be captured using the deployment Wizard.) This section provides instructions for using the various tools and continues the YSI sonde example from the previous section.
Before continuing, make sure the sonde is still connected to the serial port. Double-click on the icon for the YSI 6-series instrument created in the previous section or click the ‘Tools’ button (see figure above). Device Manager will connect to the sonde and, once a connection is established, displays the tools screen shown in the figure below. Click the button corresponding to the module (Explorer, Calibration, Configuration, Template Manager or Return to exit) you would like to access and then refer to the sections below for specific instructions.
Explorer - Uploading Files from a YSI sonde or Handheld
Explorer displays the files stored in memory on a YSI 6-series sonde or handheld and can upload single or multiple files in one operation.
To upload files from a device to your computer 1. Place a check in the box appearing next to the name of any file you would like to upload. You may
check as many boxes in the file list as you like.
Streamline-ENV Operators Guide http://riocean.com
Interactive Oceanographics 81 Shippee Road East Greenwich, RI USA 02818
2. If this is you first time using Explorer, click on the ‘Create Folder Shortcut’ icon. Select a folder from the Browse dialog box where you would like the data files saved. This action creates a shortcut to the specified folder much like a link to a web page. After selecting a directory, a dialog box is displayed – enter a name for the shortcut. An icon is added to under the ‘Browse’ icon in the shortcut list and a ‘+’ appears next to the Browse icon.
3. Click the ‘+’ to expand the shortcut tree and then click on the icon for the shortcut that was just created.
4. Click the Upload button (green right hand arrow) on the toolbar below the file list to upload the selected files.
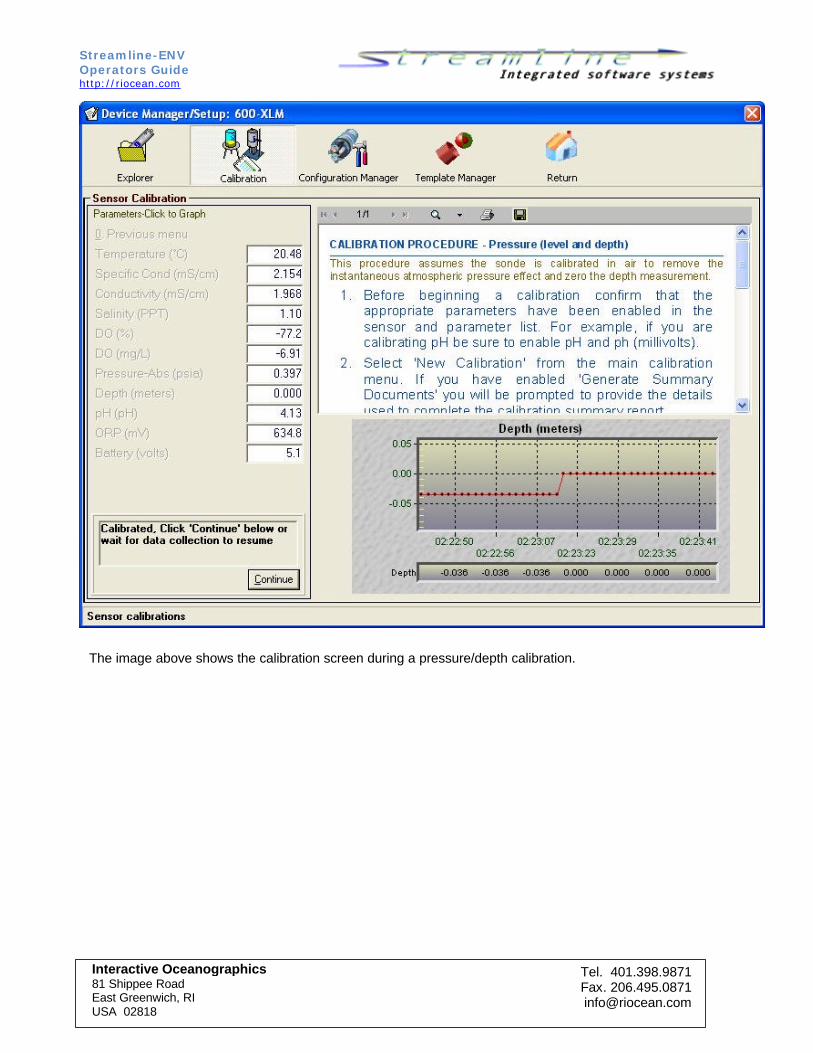
Calibration Manager – Advanced 6-Series Calibrations Calibration manager provides tools to calibrate manage and monitor all your YSI sondes. Select the ‘Calibration’ icon from the main toolbar to access the Calibration Manager. A ‘Sensor Calibration’ menu is located in the left hand panel and helpful tips, instructions and report documents are displayed in the help window to the right. The start screen for the Calibration Manager is shown below.
Streamline-ENV Operators Guide http://riocean.com
Interactive Oceanographics 81 Shippee Road East Greenwich, RI USA 02818
Use the Sensor Calibration menu to: Calibrate sensors on a YSI sonde 1. Prepare the sonde for the calibration according to the manufacturer’s specifications and instructions. 2. Select ‘New Calibration’ from the ‘Sensor Calibration’ menu. 3. Select the sensor you wish to calibrate from the menu and then follow the menu prompts that follow. 4. If ‘Generate Summary Documents’ is enabled
(in the Preferences) then the dialog window shown to the right is displayed. The information you provide is included in the report generated for the calibration(s). Complete the form and press ‘OK’.
5. Step-by-step instructions for calibrating sensors are displayed in the help window. The procedures followed during this step are similar to the procedures followed when using a laptop and terminal emulator or a YSI 650 handheld to calibrate a sonde. When you have completed this step the sonde will begin running the calibration.
6. While the calibration is running, a chart and real-time data table is displayed below the help window. A tabular list of the parameters and instantaneous values are shown in the menu area. Click on a parameter name to plot that parameter on the chart. Use the chart and table to determine when the sensor has stabilized and then click the ‘Calibrate’ button. Wait for data collection to resume and view the change in the reading. Does the measured value for the sensor match the concentration of the calibration standard?
7. Click ‘Continue’ to proceed and answer YES when asked if you would like to have the chart saved in the calibration history.
8. When prompted, enter comments or provide additional details about the calibration. Comments will appear in the calibration report.
9. If you would like to calibrate additional sensors return to the parameter list and repeat steps 4 through 7. You may need to press ‘Previous Menu’ to return to the sensor menu. If you have completed your calibrations select ‘Previous Menu’ until the Sensor Calibration menu is shown.
10. When you return to the main calibration menu, you will be prompted to check if the wipers (if optical sensors are installed) have parked correctly. The calibration report is generated automatically from the information gathered during the session (if you opted to ‘Automatically Open summary documents when created’ in the Preferences then the report will be displayed automatically in a new window.
Streamline-ENV Operators Guide http://riocean.com
Interactive Oceanographics 81 Shippee Road East Greenwich, RI USA 02818
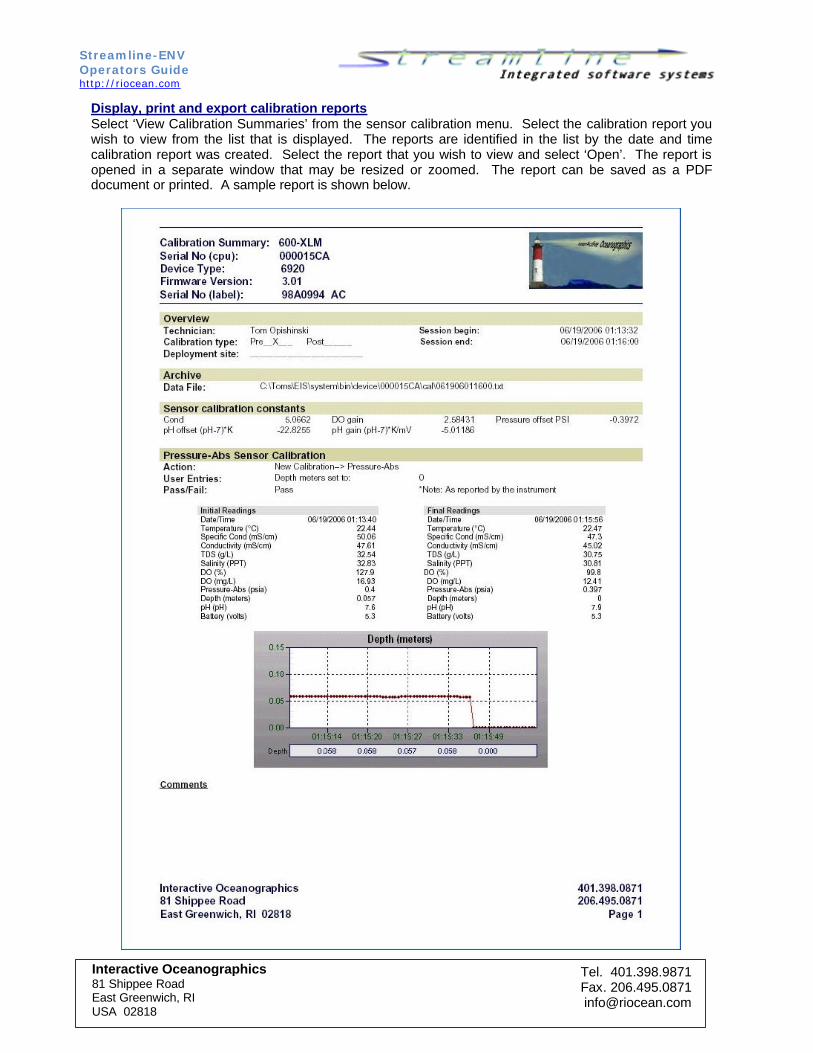
Display, print and export calibration reports Select ‘View Calibration Summaries’ from the sensor calibration menu. Select the calibration report you wish to view from the list that is displayed. The reports are identified in the list by the date and time calibration report was created. Select the report that you wish to view and select ‘Open’. The report is opened in a separate window that may be resized or zoomed. The report can be saved as a PDF document or printed. A sample report is shown below.
Streamline-ENV Operators Guide http://riocean.com
Interactive Oceanographics 81 Shippee Road East Greenwich, RI USA 02818
Retrieve calibration constants stored in the sonde The calibration constants can be viewed by selecting ‘View Calibration Constants’ from the sensor calibration menu. The constants are read directly from sonde memory and displayed in presentation ready format in the help window. Print or save the document using the tools available in the help window.
View the calibration history Select ‘Calibration History’ from the menu options and then click on the command button labeled ‘Update History’ displayed below the help window. Calibration constants and charts are archived in the calibration history file. The history file should be updated each time a calibration session is completed. Storing the calibration constants provides a direct means to monitor the condition of the probes thereby allowing the probe to be replaced before failure.
Streamline-ENV Operators Guide http://riocean.com
Interactive Oceanographics 81 Shippee Road East Greenwich, RI USA 02818
Configuration Manager – Manage and Document Sonde Configurations
Configuration Manager reads the entire YSI sonde configuration and presents the information in an intuitive interface allowing the operator to easily modify settings. A unique feature is the ability to store the configuration settings in a template. Configuration templates may be used to restore a configuration or to transfer the configuration to other sondes. One possibility is to maintain a template that is used during calibrations and another that’s used during deployments. The figure below details the SYSTEM tab in Configuration Manager.
To access and edit a sonde configuration 1. Select the Configuration Manager icon from the toolbar and then click ‘Read sonde configuration’. 2. Once the configuration has been retrieved from the sonde (follow the progress in the status bar at the
bottom of the window) select a tab to access the specific group of settings that you would like to modify. The names of the tabs correspond to the sonde’s main configuration categories that are available when communicating with a sonde using a terminal emulator.
Store a configuration in a template file 3. It’s recommended to store a copy of the configuration the first time a sonde is added to Configuration
Manager. The template can be used to restore the sonde settings to their original values. Click ‘Save Configuration Template’ and, when prompted, enter a name and description for the template file.
Streamline-ENV Operators Guide http://riocean.com
Interactive Oceanographics 81 Shippee Road East Greenwich, RI USA 02818
4. Under the SYSTEM tab is an option to automatically synchronize the sonde clock (e.g., date and time) to the PC clock. You can use this feature to synchronize the clocks on multiple sondes.
5. Make any other desired changes to the settings. NOTE: Changes made to SENSOR and REPORT settings are applied immediately. Other settings are not applied until the configuration is saved to the sonde.
Upload the configuration changes to the sonde 6. When you have finished making changes, upload and reprogram the sonde by clicking ‘Save
Configuration to Sonde’. 7. Follow the progress in the status bar as the settings are uploaded to the sonde. Load a Configuration Template 8. Select the ‘Load Configuration Template’ button. 9. Select a template from the dropdown list box on the Load Configuration Template’ window. NOTE: If
a template has not been saved then no files will be available. 10. If you have loaded a template, review the settings and refer to the sections above to modify and/or
upload the settings to a sonde.
Template Manager – Manage and Organize Configuration Templates Use Template Manager (shown below) to copy, rename, delete, update and import or export existing templates. Templates can be shared with other users or transferred between computers using the Import and Export commands. An exported template can be sent by email or posted on a web site for your colleagues to use. Template Manager can be accessed from within Device Manager or from the main menu under TOOLS TEMPLATE MANAGER. Not all options are available from the template manager in Device Manager. Use the Template Manager accessible from the main menu to rename, import or export templates.
Streamline-ENV Operators Guide http://riocean.com
Interactive Oceanographics 81 Shippee Road East Greenwich, RI USA 02818
Deployment Wizard – Setup Sondes and Deploy or collect Sonde or GPS Data
The Deployment Wizard (figure below) works with YSI 6-series sondes and NMEA GPS systems to provide a simple method to deploy and collect water quality and GPS data. For sondes, the wizard guides the user through the configuration process and optimizes the instrument based on the type of deployment selected (real-time, unattended, or integrated with an SDI-12 data acquisition system). After launching the Deployment Wizard, select an instrument from the list during the first step and then connect the instrument to the computer. The Deployment Wizard will display the instruments communications settings (as set in the Device Manager). Be sure the communications settings match the device settings. Select the deployment option when the screen below is displayed and complete the remaining step - the steps differ according to the deployment option that is selected. When you have completed the steps the instrument will be ready to be deployed. If you selected the ‘Discrete real-time sampling’ option for a YSI sonde or GPS then you will have the option of running the instrument immediately and viewing the data in real-time. When running a discrete deployment, a shortcut is created automatically in Analyst (see ‘Data Processing & Analysis section) for the instrument and data files. Use the shortcut to quickly access and view the file in Analyst.
Terminal Emulator – Traditional Instrument Communication Interface
Streamline-ENV provides a standard terminal emulator to communicate with instruments. We recommend using the Device Manager when working with YSI sondes, handhelds and GPS devices. If necessary, the terminal emulator can be used for: 1. interfacing with YSI sondes and handhelds; 2. uploading files from a YSI sonde or handheld and; 3. interface to other devices that communicate via a serial interface.
Streamline-ENV Operators Guide http://riocean.com
Interactive Oceanographics 81 Shippee Road East Greenwich, RI USA 02818
Data Processing and Analysis This section provides instructions for using the data processing and analysis modules available in
Streamline-ENV from the FILE menu. The sections that follow detail the steps to follow to process, analyze, export, merge and display your data.
Analyst – QA/QC, Statistics, Charts, Tables, Data Screening and More Streamline-ENV’s module for data processing, analysis and presentation is called Analyst. From the moment you open Analyst to process data you’ll notice that it offers a comprehensive, yet easy to use, set of tools designed to save you time and streamline your data processing. This section deviates from the format of previous sections with an extended description of Analyst’s interface preceding instructional content.
Analyst’s interface is separated into 5 sections: A. Resource Panel – Includes various tools & controls accessed by clicking on the appropriate tab. B. Quick-Action Toolbar – Quick access to common functions. C. File Listing – Displays list of data files and file attributes in the active folder. D. Data Table – Tabular listing of the data. E. Chart Display – Displays data in selected chart format.
Streamline-ENV Operators Guide http://riocean.com
Interactive Oceanographics 81 Shippee Road East Greenwich, RI USA 02818
A. Resource Panel Features The Resource Panel provides fast access to common options that are organized by functionality and accessible by Tabs. • The BROWSE Tab is used for opening data files. Use the tools to select the location (drive and
folder) where the data files are stored. If data files are located in the selected location, they will be shown in the File Listing (see section below). Files are opened from the File Listing.
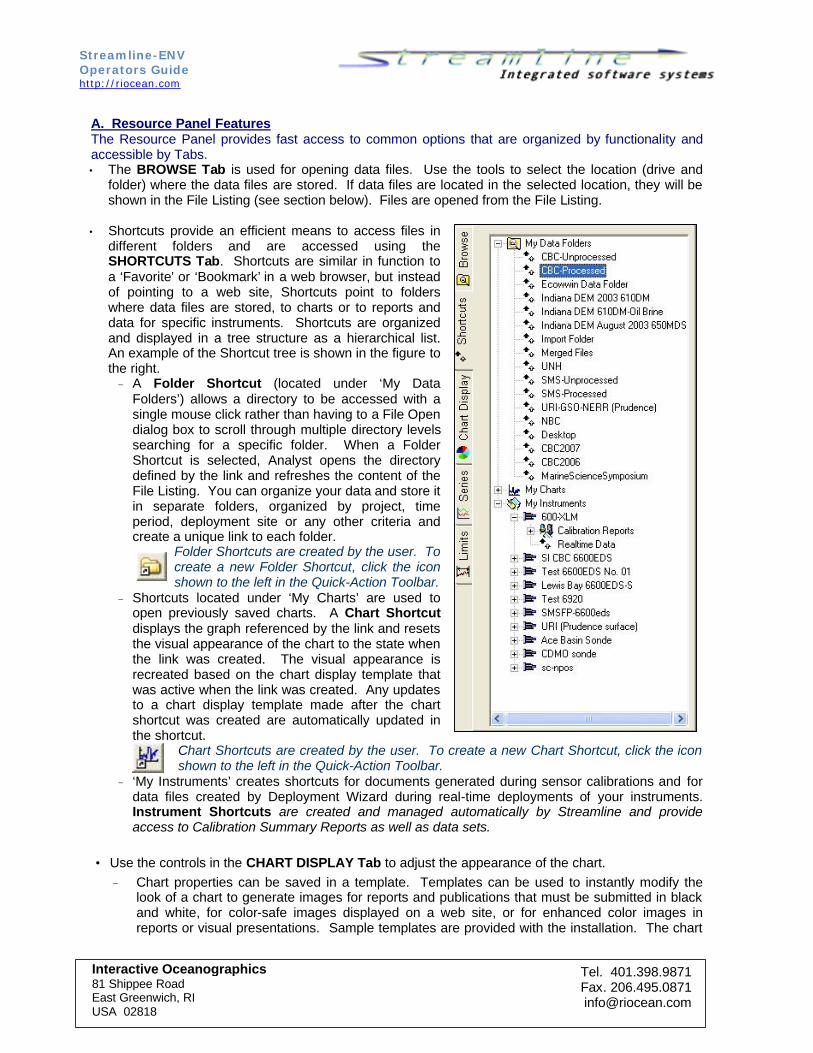
• Shortcuts provide an efficient means to access files in
different folders and are accessed using the SHORTCUTS Tab. Shortcuts are similar in function to a ‘Favorite’ or ‘Bookmark’ in a web browser, but instead of pointing to a web site, Shortcuts point to folders where data files are stored, to charts or to reports and data for specific instruments. Shortcuts are organized and displayed in a tree structure as a hierarchical list. An example of the Shortcut tree is shown in the figure to the right. - A Folder Shortcut (located under ‘My Data
Folders’) allows a directory to be accessed with a single mouse click rather than having to a File Open dialog box to scroll through multiple directory levels searching for a specific folder. When a Folder Shortcut is selected, Analyst opens the directory defined by the link and refreshes the content of the File Listing. You can organize your data and store it in separate folders, organized by project, time period, deployment site or any other criteria and create a unique link to each folder.
Folder Shortcuts are created by the user. To create a new Folder Shortcut, click the icon shown to the left in the Quick-Action Toolbar.
- Shortcuts located under ‘My Charts’ are used to open previously saved charts. A Chart Shortcut displays the graph referenced by the link and resets the visual appearance of the chart to the state when the link was created. The visual appearance is recreated based on the chart display template that was active when the link was created. Any updates to a chart display template made after the chart shortcut was created are automatically updated in the shortcut.
Chart Shortcuts are created by the user. To create a new Chart Shortcut, click the icon shown to the left in the Quick-Action Toolbar.
- ‘My Instruments’ creates shortcuts for documents generated during sensor calibrations and for data files created by Deployment Wizard during real-time deployments of your instruments. Instrument Shortcuts are created and managed automatically by Streamline and provide access to Calibration Summary Reports as well as data sets.
• Use the controls in the CHART DISPLAY Tab to adjust the appearance of the chart.
- Chart properties can be saved in a template. Templates can be used to instantly modify the look of a chart to generate images for reports and publications that must be submitted in black and white, for color-safe images displayed on a web site, or for enhanced color images in reports or visual presentations. Sample templates are provided with the installation. The chart
Streamline-ENV Operators Guide http://riocean.com
Interactive Oceanographics 81 Shippee Road East Greenwich, RI USA 02818
examples shown in this manual illustrate a few of the possible templates that can be created for a chart.
- Time series and XY charts may be presented as line, marker, marker/line, spline, marker/spline, bar, or marker with best fit line or best fit curve.
- Chart properties and trace attributes such as size, colors, grid lines, axes, line styles and color, symbol color and style as well as font size are fully customizable.
• Parameters displayed on a chart can be quickly selected using options available under the SERIES
Tab. - Use the parameter checkboxes to show or hide parameter traces on the chart. The checkboxes
are useful for quickly reviewing different parameters, one (or a few) at a time. To turn all the parameters on or off at once, use the Quick-Action toolbar icons shown to the left.
- Charts are initially displayed with date/time on the x-axis and parameter data on the y-axis but may be modified using the list boxes. Analyst allows any parameter to fill the x-axis on overlay or stacked charts to allow the relationship between parameters to be visually examined.
• The LIMITS Tab provides a mechanism to adjust the temporal limits for the file. Set the starting and
ending times to exclude data that may have been collected before the instrument was deployed or following retrieval. Temporal limits for individual parameters may be set in the QA/QC module.
B. Features of the Quick-Action Toolbar • The Quick-Action toolbar contains a series of icons that are grouped by functionality and provide
efficient access to a variety of functions. Holding the mouse cursor stationary over a toolbar icon will display a helpful tool-tip. Use the toolbar to: - Save, copy or print the chart, File Listing or Data Table. - Create Folder and Chart shortcuts. - Expand any section of Analyst to fill the entire window. - Show or hide all parameters on the chart and Data Table. - Zoom chart or Data Table. - Select center-scroll, cursor-tracking and cross-hair modes. - Set selection option for the Data Table for row selection or random selection.
C. Features of the File Listing • Rather than using a standard ‘File Open’ dialog box that shows an often obscure list of file name
names, Analyst replaces the ‘File Open’ dialog with a spreadsheet listing of available data files along with their associated metadata. Use the drop-down list in the ‘Action’ column in the File List to open a data file for plotting, QA/QC or statistical analysis.
• The ‘File Listing’ allows the user to quickly locate and open a file based on a files’ descriptive
metadata such as deployment site, time period, device type, instrument serial number and more. • Sort the listing using the metadata attributes by clicking on a column header. When any column
other than the ‘Time Span’ column is used to sort, the secondary sorting is performed by date/time.
Streamline-ENV Operators Guide http://riocean.com
Interactive Oceanographics 81 Shippee Road East Greenwich, RI USA 02818
• The file list may be printed, stored as a text file or copied to Microsoft Excel® or other spreadsheet application to efficiently create a database of your data archives.
D. Features of the Charting Area • Chart formats include multi-axes, stacked, overlay for time series or XY data and Rose or polar
scatter for vector data (i.e., data with speed and direction). • Fully resizable and full control of chart appearance (see Chart Display Tab section above). • Integrated zooming and chart scrolling.
Quick-Click Feature: Clicking a data point on the chart automatically scrolls the spreadsheet in the Data Table to the corresponding row of data and highlights it. This capability streamlines the process of examining features such as outliers and identifying the time of the event.
• Right-clicking the mouse on the chart provides access to additional features. The available features include setting limits to exclude data, zooming, printing, saving the chart image to an image file (JPG, PNG, and BMP) or copying and pasting directly into reports, web documents, , etc.
• The y-axis can be inverted to plot water depth or pressure against other parameters to display data collected from vertical water column profiles.
• Cursor tracking and cross-hair options. E. Features of the Data Table • A tabular presentation of the data in spreadsheet form is provided and displayed simultaneously with
the chart. • Quick-Click Feature: Clicking a row of data in the spreadsheet automatically moves the tracking
cursor on the chart to the corresponding data sample. In the figure below, the selected data point is indicated with the cross-hair and the corresponding data in the spreadsheet is highlighted.
• Additional features are available by right-clicking on the data spreadsheet including: - Set limits to exclude data. - Export the open file to tab- or comma-delimited text files, HTML format or directly to Excel®. - Copy all or a portion of the spreadsheet and paste into other applications. - Printing.
Streamline-ENV Operators Guide http://riocean.com
Interactive Oceanographics 81 Shippee Road East Greenwich, RI USA 02818
To Start Analyst To start Analyst, select FILE ANALYST from the main menu. To Open and View a Data File 1. Use the Drive and Folder list located on the BROWSE tab in the Resource Panel to select a folder
containing YSI DAT files. 2. When a folder is selected containing DAT formatted files, the File Listing is refreshed and entries are
created for each file located in the folder. If the File Listing is not visible, click the ‘Show File List’ icon in the bar above the File Listing until it is visible. You can resize any frame by dragging the border or corners of the frame. To facilitate locating a specific file, the File Listing can be sorted by clicking on a column header. If no files are visible confirm that the correct directory was selected in the BROWSE tab.
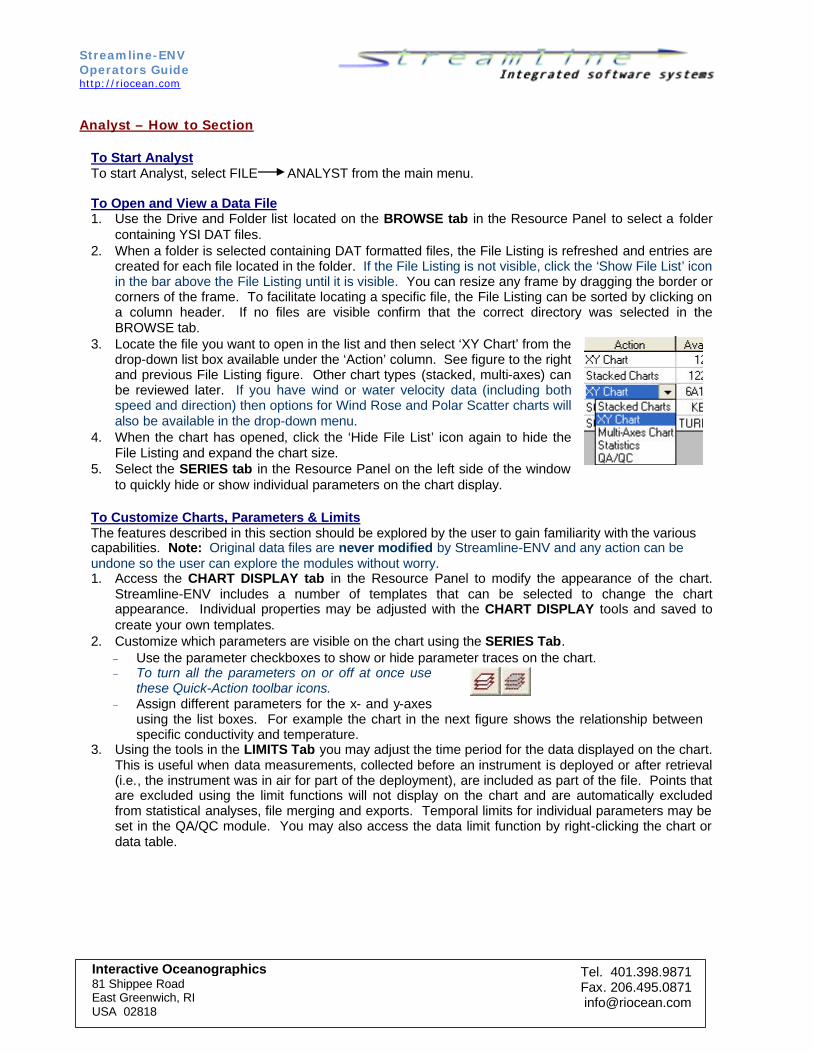
3. Locate the file you want to open in the list and then select ‘XY Chart’ from the drop-down list box available under the ‘Action’ column. See figure to the right and previous File Listing figure. Other chart types (stacked, multi-axes) can be reviewed later. If you have wind or water velocity data (including both speed and direction) then options for Wind Rose and Polar Scatter charts will also be available in the drop-down menu.
4. When the chart has opened, click the ‘Hide File List’ icon again to hide the File Listing and expand the chart size.
5. Select the SERIES tab in the Resource Panel on the left side of the window to quickly hide or show individual parameters on the chart display.
To Customize Charts, Parameters & Limits The features described in this section should be explored by the user to gain familiarity with the various capabilities. Note: Original data files are never modified by Streamline-ENV and any action can be undone so the user can explore the modules without worry. 1. Access the CHART DISPLAY tab in the Resource Panel to modify the appearance of the chart.
Streamline-ENV includes a number of templates that can be selected to change the chart appearance. Individual properties may be adjusted with the CHART DISPLAY tools and saved to create your own templates.
2. Customize which parameters are visible on the chart using the SERIES Tab. - Use the parameter checkboxes to show or hide parameter traces on the chart. - To turn all the parameters on or off at once use
these Quick-Action toolbar icons. - Assign different parameters for the x- and y-axes
using the list boxes. For example the chart in the next figure shows the relationship between specific conductivity and temperature.
3. Using the tools in the LIMITS Tab you may adjust the time period for the data displayed on the chart. This is useful when data measurements, collected before an instrument is deployed or after retrieval (i.e., the instrument was in air for part of the deployment), are included as part of the file. Points that are excluded using the limit functions will not display on the chart and are automatically excluded from statistical analyses, file merging and exports. Temporal limits for individual parameters may be set in the QA/QC module. You may also access the data limit function by right-clicking the chart or data table.
Streamline-ENV Operators Guide http://riocean.com
Interactive Oceanographics 81 Shippee Road East Greenwich, RI USA 02818
An example illustrating the use of custom chart axes. In this example specific conductivity is assigned to the x-axis and is plotted versus temperature. Custom axes allow the user to examine physical relationships between parameters. Also plot data from vertical profiles with depth or pressure on the y-axes and automatically inverted so the water surface is at the top of the chart.
row in the spreadsheet and a popup menu is displayed. Selecting the DATA LIMITS SET AS START option from the popup menu completes the process to exclude the initial readings. Note the specific conductivity and conductivity measurements in air were zero in the rows preceding the highlighted row of data.
2. Repeat this procedure to exclude the invalid measurements at the end of the file. Use the DATA LIMITS SET AS END option after selecting the spreadsheet row with the last valid measurements.
3. The second figure illustrates the results of these procedures. The remaining measurements are those acquired when the sonde was deployed in water.
4. Limits can be removed by right clicking the spreadsheet and selecting DATA LIMITS CANCEL START LIMIT, DATA LIMITS CANCEL END LIMIT or DATA LIMITS CANCEL ALL LIMITS.
5. If cursor-tracking is enabled, limits may also be set by right-clicking the chart. the position of the cross-hair determines the limit.
Streamline-ENV Operators Guide http://riocean.com
Interactive Oceanographics 81 Shippee Road East Greenwich, RI USA 02818
To Export the Data from the Spreadsheet 1. To export the entire spreadsheet, right-click the Data List spreadsheet and select EXPORT from the
popup menu. Next select the format from the submenu. Available formats are ‘Data Report’ (tab- or comma-delimited text files), HTML or Excel.
2. Select a destination folder and enter a name for the file in the ‘Save As’ dialog box. 3. Press ‘Save’. To Copy a Random Section of the Spreadsheet 1. To copy a random section from the spreadsheet, first enable ‘Random Block Mode’ by
clicking this icon on the Quick-Action toolbar. 2. Select the data in the spreadsheet so that it is highlighted. 3. Place the mouse cursor within the highlighted area and right-click to display the popup menu. Select
EDIT COPY TO CLIPBOARD. The figure below shows a random selection of data cells in the Data List spreadsheet being copied to the Windows Clipboard.
4. The data is copied to Window’s memory and can be pasted into other applications such as Word, WordPad, Notepad, Excel, and email using their EDIT PASTE commands.
Streamline-ENV Operators Guide http://riocean.com
Interactive Oceanographics 81 Shippee Road East Greenwich, RI USA 02818
To Perform Quality Assurance/ Quality Control Operations 1. Select ‘QA/QC’ from the drop-down list box under the ‘Action’ column in Analyst’s File List. Select a
file containing data you wish to exclude such as outliers or fouled data. The image below details the QA/QC module.
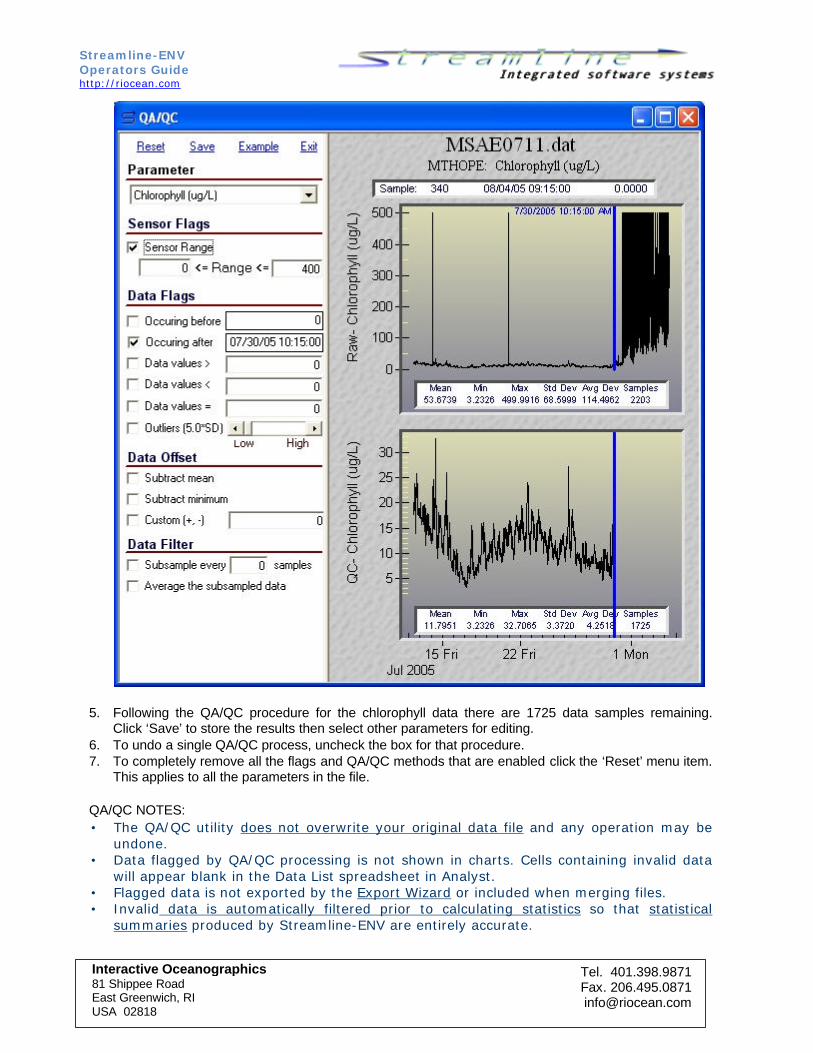
2. Next select the parameter from the drop-down list that contains invalid data points. In the image below chlorophyll has been selected and is shown in two identical charts on the right. Each chart also includes a statistical summary of the data set. The chlorophyll data contains two discrete spikes (outliers) and fouling has contaminated the last 5 or 6 days of the record. As data is flagged during the QA/QC process, the lower chart and statistics will be updated to include only the processed QA/QC data.
3. For this example, the data contaminated by fouling will be removed first. To begin, use the mouse to zoom into the section of data where the fouling begins (approximately between July 25th and August 1). You may zoom further if desired. Click the checkbox next to the ‘Occurring After’ label and then click inside the blank text box to the right. The textbox will be highlighted with a blue color indicating that it is waiting for you to click on the graph to set the end marker. Move the cursor inside the chart
Streamline-ENV Operators Guide http://riocean.com
Interactive Oceanographics 81 Shippee Road East Greenwich, RI USA 02818
area to a data point on the parameter trace where the fouling begins. The cursor will change to a hand when it is over a data point. When the hand is visible, click the left mouse button to define the end point. Data with timestamps later than the time stamp of the selected point (e.g., data to the right of the selected point) will be flagged and excluded from charts displays and analytical processes. The result of this operation is shown in the figure below. Note the number of samples shown in lower chart has decreased from 2203 to 1727.
4. There are several options to remove the outliers including the procedures labeled ‘Data Values >’ or the ‘Outliers’ option. Streamline also allows the measurement range to be defined for each sensor and used to remove data falling outside that range. In the preceding figure the range for a YSI chlorophyll sensor has been defined from 0 to 400 µg/l to match the published range. These values will be retained by Streamline and displayed whenever chlorophyll data is present. Checking the box to enable flagging by sensor range completes the QA/QC process of the chlorophyll data. The final result is shown in the figure on the next page.
Streamline-ENV Operators Guide http://riocean.com
Interactive Oceanographics 81 Shippee Road East Greenwich, RI USA 02818
5. Following the QA/QC procedure for the chlorophyll data there are 1725 data samples remaining. Click ‘Save’ to store the results then select other parameters for editing.
6. To undo a single QA/QC process, uncheck the box for that procedure. 7. To completely remove all the flags and QA/QC methods that are enabled click the ‘Reset’ menu item.
This applies to all the parameters in the file. QA/QC NOTES: • The QA/QC utility does not overwrite your original data file and any operation may be
undone. • Data flagged by QA/QC processing is not shown in charts. Cells containing invalid data
will appear blank in the Data List spreadsheet in Analyst. • Flagged data is not exported by the Export Wizard or included when merging files. • Invalid data is automatically filtered prior to calculating statistics so that statistical
summaries produced by Streamline-ENV are entirely accurate.
Streamline-ENV Operators Guide http://riocean.com
Interactive Oceanographics 81 Shippee Road East Greenwich, RI USA 02818
To Perform Statistical Analyses and Produce Reports 1. For this example, be sure to select a file with data spanning multiple days. Select ‘Statistics’ from the
drop-down list box under the ‘Action’ column in Analyst’s File List. A new Statistical Analysis window will be opened with a formatted statistical summary of the file. As shown in the figure below, the initial report is an analysis of all the measurements excluding data identified as invalid, excluded by user-defined data limits, or flagged by QA/QC operations (see previous section). In other words, the analysis process automatically removes invalid and flagged data to accurately calculate the statistics. The summary includes the number of valid samples for each parameter and the percentage valid calculated from the total number of measurements contained in the file.
2. Analyst can quickly generate statistical summaries for an entire data file (as above) or calculate
statistics by month, week, day or hour. As an example, access the first drop-down list box in the menu (reads ‘Summary’ in the figure above) and select ‘Daily’. A new report will be generated with the statistical variables calculated for each day. If the file covers many days of measurements, the report may contain multiple pages. A daily statistics report is shown in the next figure with page 1 of 5 visible.
3. Use the toolbar to navigate pages, zoom or print the report. 4. Select the ‘Standard Format ‘ menu and change the format to ‘Mean Series Format’. A new report is
generated with statistical means of the parameters for the selected time interval (e.g., monthly, weekly, daily, hourly).
5. Select an option from the ‘Save Report’ menu to save the report to PDF, HTML web page format (visit http://cbc.riocean.com/ and select ‘Weather Statistics’ from the Table of contents to view examples), or Rich Text Format (Word). The last figure in this section is a table from a report created by Streamline-ENV and saved in Word format. The table was copied directly from the saved report and pasted in this document.
6. Both formats may be saved to an Excel file using the ‘Save Report’ menu. Using reports saved in ‘Mean Series’ format you can quickly create plots showing monthly, weekly, daily or hourly averages for the parameters In Excel.
7. Use the ‘Parameters’ menu to select the parameters shown in the statistics report.
Streamline-ENV Operators Guide http://riocean.com
Interactive Oceanographics 81 Shippee Road East Greenwich, RI USA 02818
The tables above provide an example of a ‘Daily Statistics’ report in ‘Standard Format’. The first page of the report includes file metadata and information about the instrument that recorded the file. This page was
created in Streamline-ENV and saved to RTF (Microsoft Word) format and then inserted into this document.
Streamline-ENV Operators Guide http://riocean.com
Interactive Oceanographics 81 Shippee Road East Greenwich, RI USA 02818
Example of a ‘Mean Series Format’ report that includes calculated daily averages for each parameter during a July 2007 deployment. The table was generated by Streamline-ENV’s Statistical Analysis module and saved to Word format. The table was directly copied from the saved Word document and inserted into this manual.
To Create a Database or Inventory Report of your Data Files The File List in Analyst can be copied and pasted into other documents to create reports and databases documenting your data inventory.
1. Select ‘Save File Listing’ or ‘Copy File Listing’ from the drop-down menu accessed from the icon shown to the right in the Quick-Action Toolbar.
2. If ‘Save File Listing’ is selected a ‘Save As’ dialog will be shown. Select a destination and enter a file and then click ‘Save’.
3. If ‘Copy File Listing’ is selected then use the EDIT PASTE commands in the destination application (e.g., Word, Excel, Access, etc.) to insert the list.
Streamline-ENV Operators Guide http://riocean.com
Interactive Oceanographics 81 Shippee Road East Greenwich, RI USA 02818
The Batch Export module operates on multiple files rather than a single file thus offering the user a substantial time savings since the export commands do not have to be repeated for each file. The module supports multiple data formats allowing files to be converted directly to tab-, pipe- or comma-delimited, Excel and HTML format. Tab- and comma-delimited files may be dragged and dropped into most spreadsheet software (including Microsoft Excel®) and the data is correctly parsed and ready to be plotted immediately. Data can be exported directly to Microsoft Excel® format. This offers the user additional time savings since it is not necessary to first export to one of the text file formats and then, as a second step, import the file to Microsoft Excel®.
Batch Export Module
The Batch Export module has been designed with an easy to use wizard-like interface. A sample screen from the Batch Export module is shown in the figure below.
To Export Multiple Files 1. Select FILEàEXPORT from the main menu. Follow the step-by-step instructions to complete steps
2-6 2. Select the source folder containing the YSI data files you wish to export. The source folder may be
specified using Folder Shortcuts or a Browse Dialog. 3. Select a destination folder where the new files will be saved. 4. Select the format for the exported files. 5. Select the ‘Process’ command button to complete the export operation. Status information will be
displayed to update the progress of the export operations.
Streamline-ENV Operators Guide http://riocean.com
Interactive Oceanographics 81 Shippee Road East Greenwich, RI USA 02818
Streamline-ENV’s file merging module is capable of merging YSI DAT formatted files. The files may contain matching parameters as required with existing YSI sonde software; however this is not a requirement for Streamline-ENV’s ‘File Merge’ module. Streamline-ENV can merge files containing dissimilar parameters and even data collected with different sampling rates or covering different time periods. This is extremely useful for viewing data from different sensors (e.g., sonde and meteorological), for comparing simultaneous measurements at different monitoring stations (e.g., upstream/downstream, surface/bottom), or even for the same month or week but in different years.
File Merge Module
The File Merge module is designed to guide the user through the steps to complete a merging operation. A sample image of the File Merge module is shown below.
To Merge Files with Matching Parameters
1. Select FILEàMERGE from the main menu. 2. Follow the step-by-step prompts. 3. Files are selected in the first two steps. Files with identical matching parameters must be selected! 4. Specify a destination folder and name for the merged file. 5. In the final step requires specification of the method used to handle the data merging. To merge files
with matching parameters (type and number) select the first option as shown in the next figure.
Streamline-ENV Operators Guide http://riocean.com
Interactive Oceanographics 81 Shippee Road East Greenwich, RI USA 02818
6. Parameters may be excluded by using the check boxes in the parameter list. 7. Press the ‘Merge’ command button to complete the process. 8. Press ‘Continue’ to merge additional files or to exit. 9. Once the process is complete the file may be accessed in Analyst. An example of a file created
using this merge method is shown in the figure below.
Yearly temperature record that was created by merging the 12 monthly data files.
Monthly files were processed with the QA/QC utility before merging.
Streamline-ENV Operators Guide http://riocean.com
Interactive Oceanographics 81 Shippee Road East Greenwich, RI USA 02818
To Merge Files with Different Parameters or Time Periods 1. Select FILEàMERGE from the main menu. 2. Follow the step-by-step prompts. 3. Files are selected in the first two steps. Select any two files – the parameters and coverage period
do not have to match. 4. Specify a destination folder and name for the merged file. 5. In the final step requires specification of the method used to handle the data merging. To merge
dissimilar files select the second option in the Merge Method Options dialog. 6. Select the parameters that will be included in the merged data file using the check boxes in the
parameter list. 7. Press the ‘Merge’ command button to complete the process. 8. Press ‘Continue’ to merge additional files or to exit. 9. Once the process is complete the file may be accessed in Analyst. An example file created using this
method is given below. For the example, files for a sonde and meteorological sensor suite (deployed at the same monitoring station) were merged.
Merging files from different sensors allows correlations between different parameters to be analyzed. The chart above was created in Analyst using a file containing data merged from a sonde and a weather system. The chart shows the drop in barometric pressure and the turbidity plume that resulted from the passing of Hurricane Felix.