State of Washington Joint Legislative Audit & Review Committee (JLARC) Streamlined Sales Tax Mitigation Report 11-1 January 5, 2011 Upon request, this document is available in alternative formats for persons with disabilities.
Transcript
State of Washington Joint Legislative Audit & Review Committee (JLARC)
Streamlined Sales Tax Mitigation
Report 11-1 January 5, 2011
Upon request, this document is available in alternative formats for persons with disabilities.
Joint Legislative Audit and Review Committee 1300 Quince St SE PO Box 40910 Olympia, WA 98504 (360) 786-5171 (360) 786-5180 Fax www.jlarc.leg.wa.gov
Committee Members Audit Authority The Joint Legislative Audit and Review Committee (JLARC) works to make state government operations more efficient and effective. The Committee is comprised of an equal number of House members and Senators, Democrats and Republicans. JLARC’s non-partisan staff auditors, under the direction of the Legislative Auditor, conduct performance audits, program evaluations, sunset reviews, and other analyses assigned by the Legislature and the Committee. The statutory authority for JLARC, established in Chapter 44.28 RCW, requires the Legislative Auditor to ensure that JLARC studies are conducted in accordance with Generally Accepted Government Auditing Standards, as applicable to the scope of the audit. This study was conducted in accordance with those applicable standards. Those standards require auditors to plan and perform audits to obtain sufficient, appropriate evidence to provide a reasonable basis for findings and conclusions based on the audit objectives. The evidence obtained for this JLARC report provides a reasonable basis for the enclosed findings and conclusions, and any exceptions to the application of audit standards have been explicitly disclosed in the body of this report.
Appendix 3 – Impact Summary by Jurisdiction .................................................................. 29
Appendix 4 – Timeline of Streamlined Sales Tax Mitigation Process ............................... 45
Committee Approval
Subsequent to the January 5, 2011 meeting, this report was approved for distribution by the Joint Legislative Audit and Review Committee.
Acknowledgements
We appreciate the assistance provided by the Department of Revenue staff in conducting this study. In particular, we would like to thank the Division of Research and Legislative Analysis staff for their availability and responsiveness during a very busy time.
REPORT SUMMARY Why a JLARC Study of Streamlined Sales Tax Mitigation? In 2007, the Legislature enacted legislation (SSB 5089) to conform Washington’s tax laws to the Streamlined Sales and Use Tax Agreement (SSUTA). The SSUTA is a multistate compact intended to simplify and standardize state tax laws and facilitate sales tax collection on interstate transactions. The Legislature also enacted provisions to mitigate the negative impacts this legislation had on local taxing jurisdictions.
In this same legislation, the Legislature directed the Joint Legislative Audit and Review Committee (JLARC) to review these mitigation provisions in 2010. The purpose of this study is to determine the extent to which these mitigation provisions compensate local jurisdictions that experienced a loss in local sales tax revenue.
Streamlined Sales Tax Impacts Local Jurisdictions Washington became a full member of the SSUTA on July 1, 2008. Membership impacted the local sales tax collections of 364 local taxing jurisdictions, which include cities, counties, and transit districts. SSUTA membership had two primary effects on local sales tax collections:
1. Membership brings in new sales tax revenue from out-of-state retailers that had registered under the SSUTA. These retailers agreed to collect and remit sales tax on interstate sales to SSUTA member states. Since these retailers voluntarily register under the SSUTA, the sales tax they remit is known as voluntary compliance revenue.
2. Membership required changes to Washington’s sales tax sourcing laws. Sourcing laws determine the taxable location of a sale and which jurisdiction receives local sales tax. Prior to the SSUTA, Washington retailers sourced sales based on a delivery’s point of origin. For example, a couch delivered from a warehouse in Kent to a home in Seattle was sourced to Kent, and Kent received the local sales tax. In contrast, full members of the SSUTA must use the destination of a sale as the sales tax source. Thus, Seattle now receives local sales tax for the same transaction.
While the new voluntary compliance revenue benefited all local taxing jurisdictions, the change in sourcing laws shifted the distribution of local sales tax around the state. This shift meant that some local jurisdictions experienced a net gain or loss in sales tax revenue.
January 5, 2011
STATE OF WASHINGTON
JOINT LEGISLATIVE AUDIT AND REVIEW COMMITTEE
STUDY TEAM Peter Heineccius
PROJECT SUPERVISOR Keenan Konopaski
LEGISLATIVE AUDITOR Keenan Konopaski
Copies of Final Reports and Digests are available on the JLARC website at:
Legislature Enacted Provisions to Mitigate Negative Impacts to Local Jurisdictions The Legislature enacted provisions to mitigate the loss some jurisdictions experienced due to the change in sourcing laws. The Legislature directed the Department of Revenue to determine each local jurisdiction’s losses by comparing businesses’ tax return data from before and after the sourcing change. These losses are reduced by any voluntary compliance revenue a jurisdiction receives. The Legislature directed the State Treasurer to distribute a payment to each jurisdiction equal to any remaining net loss. The state agencies have followed the statutory requirements.
Mitigation Payments and New Revenue Lower Than Expected The actual cost of the mitigation payments is lower than expected, compared to the fiscal note prepared for the Legislature as it considered the bill in 2007.
Exhibit 1 – Mitigation Payments and New Revenues Lower Than Expected (Dollars in Millions)
Fiscal Year 2009 Fiscal Year 2010 Fiscal Note Actual Fiscal Note Actual Mitigation Payment Costs $31.6 $21.4 $41.5 $26.1 Voluntary Compliance Revenue $49.1 $5.6 $59.0 $7.1 Source: JLARC analysis of data from the Department of Revenue.
Extent to Which Provisions Mitigate Negative Impacts Is Unclear Data is not currently available to ascertain what local sales tax revenues local jurisdictions would have actually received if Washington had continued under origin-based sourcing. Absent this information, it is not possible to determine the exact extent to which the mitigation provisions have compensated local jurisdictions for the losses that are due to the state’s participation in the SSUTA. To collect such information would require businesses to track and report the location of both the origin and destination of all of their deliveries.
Mitigation Provisions May Not Reflect All Losses Over Time
Even assuming an accurate estimate of local losses, JLARC identified three consequences of the mitigation provisions that the Legislature has not explicitly addressed. First, the estimate of losses in past quarters differs from updated estimates, but there is no retroactive adjustment for past payments. Second, future mitigation payments will not reflect losses experienced by jurisdictions in future years. Finally, alternate provisions for public facilities districts to increase their tax rates do not fully mitigate annual losses experienced by the Kent Public Facilities District.
No Other States Have Mitigation Provisions While no other states have mitigation provisions, it is unlikely that any other SSUTA full member states faced the same magnitude of negative impacts to local jurisdictions from changing to destination-based sourcing. States that face similar challenges as Washington have elected to delay changing to destination sourcing and remain associate members.
REPORT DETAIL Streamlined Sales Tax Impacts Local Jurisdictions The Streamlined Sales and Use Tax Agreement (SSUTA) is a multistate effort to simplify and standardize sales tax laws. Generally, consumers pay sales tax on purchases, and retailers are responsible for collecting the tax and then remitting it to the state where the sale takes place. However, receiving sales tax becomes more complicated for the state if the retailer is located in a different state.
Under current interpretations of the U.S. Constitution, a state may only compel retailers to collect and remit sales tax if the retailer has a physical presence in the state. This limitation is due to the burden retailers would face in trying to comply with the different sales tax laws across the country. While this limitation resulted from a U.S. Supreme Court decision, it may be modified by an act of Congress, which has the power to regulate interstate commerce.
With the rise of the Internet, many sales are made by retailers that do not have a physical presence in the states in which they make sales. This means that states cannot collect sales tax on an increasing number of sales. One study estimated that almost $7 billion in sales taxes on Internet sales went uncollected nationwide in 2009, including $172 million in Washington State.1
In 1999, the National Governors Association and the National Conference of State Legislatures created the Streamlined Sales and Use Tax Project. The goal of this project was to reduce the burden on interstate retailers by simplifying sales tax collection. A complementary goal was to encourage federal legislation that would allow states to compel out-of-state retailers to collect and remit sales tax. The outcome of this effort was the Streamlined Sales and Use Tax Agreement.
Washington, along with 43 other states and the District of Columbia, helped draft the SSUTA, which went into effect October 1, 2005. After that time, only full member states could vote on amendments and receive the benefits of the Agreement. Full member states are those that have enacted legislation to bring their tax laws into conformity with SSUTA requirements. Associate member states are those that have enacted conforming legislation that has not yet gone into effect.
In 2007, the Legislature passed SSB 5089, which brought Washington’s tax laws into conformity with the SSUTA. Washington became a full member of the SSUTA when the conforming legislation took effect on July 1, 2008. Currently, the SSUTA has 20 full member states, including Washington, as well as three associate member states. See Exhibit 2.
1 Donald Bruce, William F. Fox & LeAnn Luna. State and Local Government Sales Tax Revenue Losses from Electronic Commerce. University of Tennessee (2009).
Becoming a full member had two primary effects on local sales tax revenues in Washington. First, membership brings in new sales tax revenue from certain out-of-state retailers. Second, to become a full member, Washington had to change its sales tax sourcing laws.
Membership Brings In New Sales Tax Revenue from Certain Out-of-State Retailers One of the benefits of SSUTA membership is that Washington now receives sales tax from out-of-state retailers that have registered under the SSUTA. These registered retailers have agreed to collect and remit sales tax on purchases made by residents of SSUTA member states, even if the retailer does not have a physical presence in the state. Since these registered retailers voluntarily comply with the sales tax laws of SSUTA member states, the revenue received from these retailers is known as “voluntary compliance revenue.”
In exchange for collecting and remitting sales tax, these retailers receive amnesty for previously owed taxes and assistance with administering collections. There are over 1,200 registered retailers around the country, but state taxpayer information laws prohibit disclosing their identities.
When Washington became a full member of the SSUTA, the registered retailers without a physical presence in Washington began to collect and remit sales tax on interstate purchases made by Washington residents. These retailers have a unique identifier which allows the Department of Revenue to track the amount of voluntary compliance revenue coming into the state. In this way, the Department of Revenue can identify new sales tax revenue that is due solely to Washington’s membership in the SSUTA. Aside from this tracking, voluntary compliance revenue is disbursed to local jurisdictions combined with all other local sales tax collections.
Exhibit 2 – Twenty States Are Full Members of the SSUTA
Source: JLARC analysis of data from the Streamlined Sales and Use Tax Governing Board. * Georgia will become an associate member state in January 2011.
Membership Required Changes to Washington’s Sales Tax Sourcing Laws One of the most significant changes required to become a full member of the SSUTA was a change to Washington’s sales tax sourcing laws. Sourcing laws determine the taxable location of a sale, or where a sale is considered to take place for taxing purposes. The location of a sale determines both the sales tax rate and which local jurisdictions will receive local sales tax from the transaction.
For over-the-counter sales, the buyer and seller are in the same location, so the source is simply where the transaction takes place. For shipments or deliveries, the location of the sale could be either the point of origin or the point of destination. When drafting their tax laws, states choose whether to use the origin or the destination as the source of the sale.
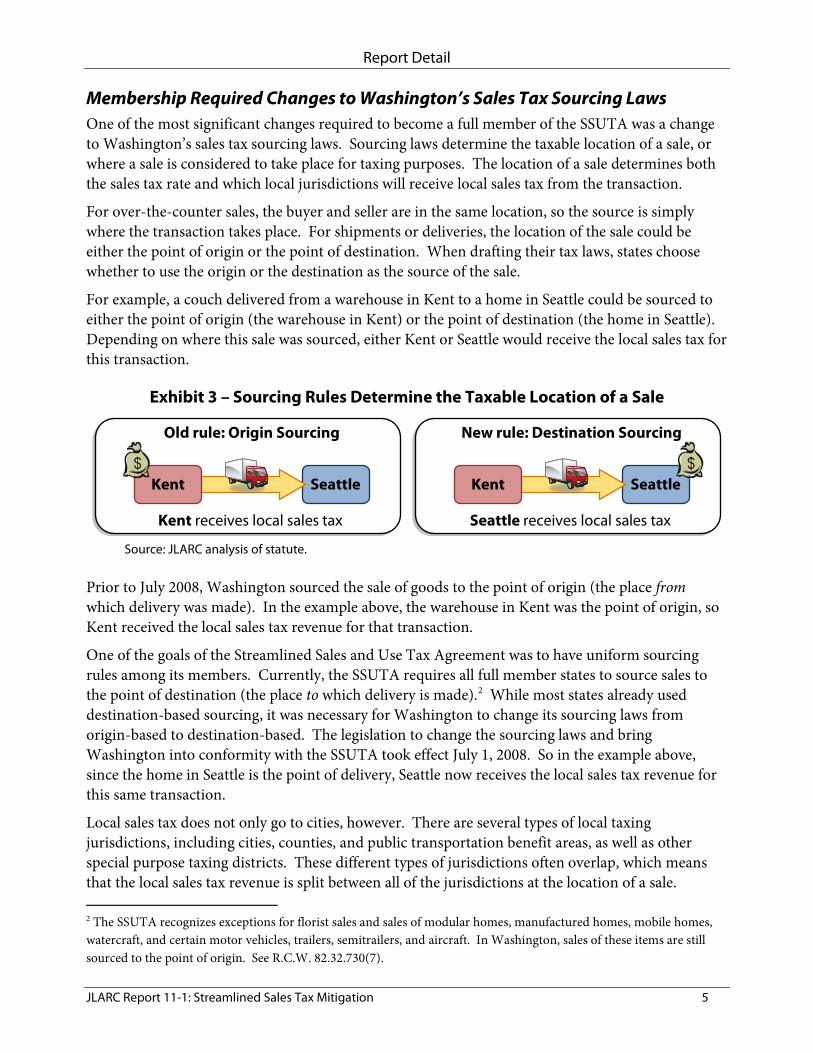
For example, a couch delivered from a warehouse in Kent to a home in Seattle could be sourced to either the point of origin (the warehouse in Kent) or the point of destination (the home in Seattle). Depending on where this sale was sourced, either Kent or Seattle would receive the local sales tax for this transaction.
Prior to July 2008, Washington sourced the sale of goods to the point of origin (the place from which delivery was made). In the example above, the warehouse in Kent was the point of origin, so Kent received the local sales tax revenue for that transaction.
One of the goals of the Streamlined Sales and Use Tax Agreement was to have uniform sourcing rules among its members. Currently, the SSUTA requires all full member states to source sales to the point of destination (the place to which delivery is made).2
Local sales tax does not only go to cities, however. There are several types of local taxing jurisdictions, including cities, counties, and public transportation benefit areas, as well as other special purpose taxing districts. These different types of jurisdictions often overlap, which means that the local sales tax revenue is split between all of the jurisdictions at the location of a sale.
While most states already used destination-based sourcing, it was necessary for Washington to change its sourcing laws from origin-based to destination-based. The legislation to change the sourcing laws and bring Washington into conformity with the SSUTA took effect July 1, 2008. So in the example above, since the home in Seattle is the point of delivery, Seattle now receives the local sales tax revenue for this same transaction.
2 The SSUTA recognizes exceptions for florist sales and sales of modular homes, manufactured homes, mobile homes, watercraft, and certain motor vehicles, trailers, semitrailers, and aircraft. In Washington, sales of these items are still sourced to the point of origin. See R.C.W. 82.32.730(7).
Exhibit 3 – Sourcing Rules Determine the Taxable Location of a Sale
For example, portions of the local sales tax from a sale that takes place in Seattle go to the City of Seattle, King County, King County Metro, and Sound Transit.
Sometimes there may be multiple taxable locations within the same city. For example, a city could exist on the border between two adjacent counties, which means that different counties would receive local sales tax for sales in different parts of the city. Taxable locations are the unique combinations of overlapping jurisdictions, which are used to determine which jurisdictions receive local sales tax. See Exhibit 4.
Sourcing Change Caused Sales Tax Revenue Loss for Some Local Jurisdictions The change from origin-based to destination-based sourcing in July 2008 shifted the distribution of local sales tax around the state. The change affected which local jurisdictions received local sales tax on the deliveries and shipments of goods between different locations.
The Department of Revenue conducted studies in 2003 and 2004 to estimate what impact the sourcing change would have on local jurisdictions. The Department found that some jurisdictions would receive more sales tax revenue under destination sourcing than origin sourcing, while other jurisdictions would experience a loss in local sales tax revenue. Jurisdictions that were the origin of deliveries substantially more often than the destination of deliveries, such as jurisdictions with concentrations of warehousing industries, would experience the largest decrease in local sales tax collections.
There are 364 local taxing jurisdictions impacted by the change to destination-based sourcing, including 39 counties, 281 cities and towns, and 27 public transportation benefit areas. Seventeen other special purpose districts that fund regional centers, sport stadiums, and the Regional Transit Authority (Sound Transit) are also impacted by the change. See Exhibit 5.
Exhibit 4 – Taxable Locations Are Unique Combinations of Overlapping Jurisdictions
Legislature Enacted Provisions to Mitigate Negative Impacts to Local Jurisdictions The Legislature understood that some local jurisdictions would experience a loss in local sales tax revenue as a consequence of the legislation to bring Washington into conformity with the SSUTA. Therefore, the Legislature included provisions to mitigate local sales tax losses due to these changes. These mitigation provisions outlined a process where local jurisdictions that experienced a net reduction in local sales tax revenue due to Washington’s participation in the SSUTA would receive compensation from the State General Fund. Both the Department of Revenue and the State Treasurer have a role in this process.
Department of Revenue Directed to Determine Local Jurisdictions’ Losses
Initial Year (Fiscal Year 2009) For the first year of mitigation, the Legislature directed the Department of Revenue to compare the quarterly tax return and tax collection data from before the sourcing change (Fiscal Year 2008) and after the sourcing change (Fiscal Year 2009). From these initial comparisons, the Legislature directed the Department to determine the quarterly gain or loss of each local taxing jurisdiction. See Exhibit 6.
Exhibit 5 – Change to Sourcing Rules Impacted 364 Local Taxing Jurisdictions
Source: JLARC analysis of DOR data.
Counties (39) Cities (281) Transit Areas (27) Other (17) not displayed
The Legislature also directed the Department to convene a Mitigation Advisory Committee, which consists of representatives from positively and negatively impacted cities, counties, and transportation authorities. The Department is able to consult with the Committee to revise or supplement its determination of local losses.
Subsequent Years (Fiscal Year 2010 and After) After the initial year of quarter-by-quarter estimates, the Legislature directed the Department to compare an entire year of data from before the sourcing change (Fiscal Year 2008) with a year after (Fiscal Year 2009) to determine the annual gain or loss of each local jurisdiction. For the following year (Fiscal Year 2010), statute sets each jurisdiction’s quarterly gain or loss as equal to one-fourth of the jurisdiction’s annual gain or loss for Fiscal Year 2009. See Exhibit 7.
FY 2008 Tax Data
FY 2009 Tax Data
FY 2009 Impact
Ongoing Estimate
Exhibit 7 – Ongoing Losses Are ¼ of FY 2009 Annual Impact
Source: JLARC analysis of statute.
DOR compared
tax data
DOR determined
impact
¼ ¼
¼ ¼
Origin Sourcing
Destination Sourcing
Annual Gain/Loss
Quarterly Gain/Loss
FY 2008 Tax Data
Q1
Q2
Q3
Q4
Origin Sourcing
FY 2009 Impact
Q1
Q2
Q3
Q4
Quarterly Gain/Loss
FY 2009 Tax Data
Q1
Q2
Q3
Q4
Destination Sourcing
Exhibit 6 – DOR Initially Compared Tax Data to Determine Quarterly Impact
Statute only requires the Department to determine each jurisdiction’s annual gain or loss once, but the Department is able to make adjustments to this amount once a year in consultation with the Mitigation Advisory Committee. For all subsequent years, each jurisdiction’s quarterly gain or loss is equal to one-fourth of the adjusted annual gain or loss for the initial year (Fiscal Year 2009).
Local Losses Reduced by New Sales Tax Revenue from Certain Out-of-State Retailers The Legislature directed the Department of Revenue to determine the net gain or loss for each jurisdiction by combining the jurisdiction’s quarterly gain or loss with any voluntary compliance revenue received by the jurisdiction in that quarter. Voluntary compliance revenue is the new sales tax revenue received from out-of-state retailers that have registered under the SSUTA. These new revenues reduce the amount of loss experienced by local jurisdictions due to the sourcing change.
Unlike annual gains and losses, the Department must continue to determine the amount of voluntary compliance revenue each jurisdiction receives each quarter. While a jurisdiction’s quarterly loss remains the same (fixed at one-fourth of the adjusted annual loss), the jurisdiction’s quarterly net loss will fluctuate due to variations in the amount of voluntary compliance revenue collected that quarter. This means that a jurisdiction may have a net gain one quarter and a net loss the following quarter, due to voluntary compliance revenue.
State Treasurer Distributes Quarterly Payments for Net Losses The Legislature created the Streamlined Sales and Use Tax Mitigation Account in the State General Fund in 2007. The sole purpose of the account is to mitigate the negative fiscal impacts to local taxing jurisdictions due to the sourcing change. The Legislature directed the State Treasurer to transfer $31.6 million dollars into the account from the State General Fund to pay for the initial year of mitigation in Fiscal Year 2009.
Current Year Impact
Ongoing Estimate
Current Year Actual Revenue
Exhibit 8 – Losses Offset By Voluntary Compliance Revenue
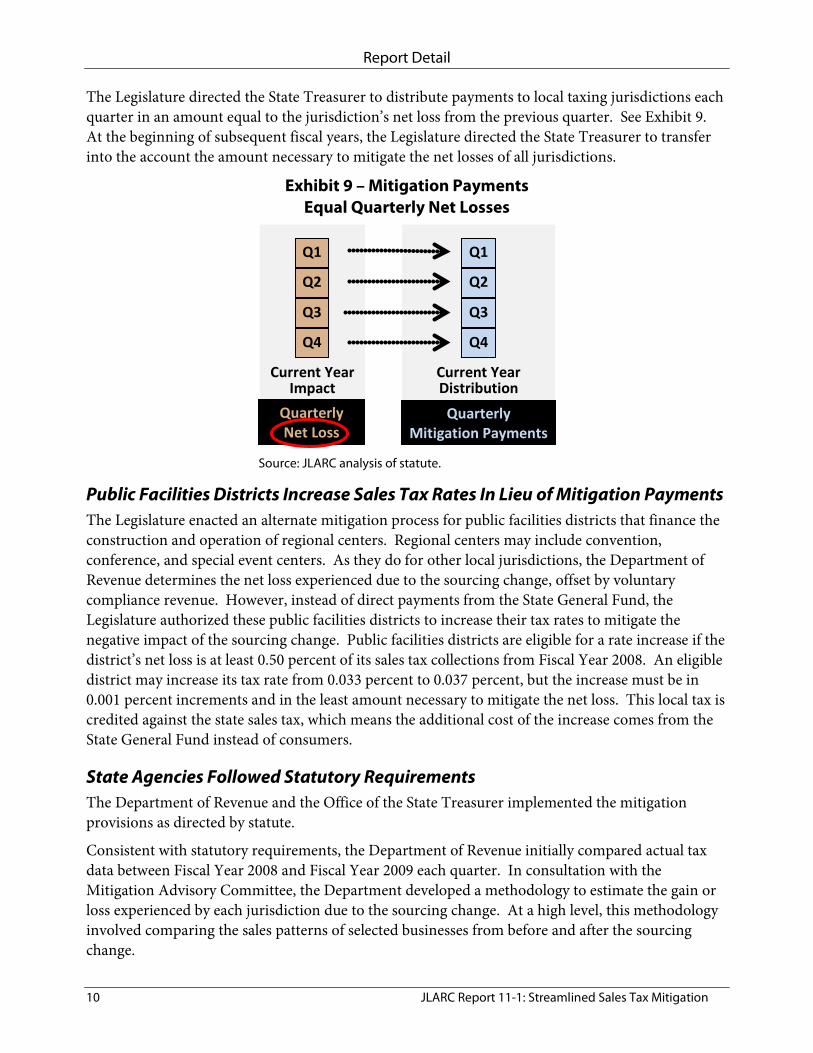
The Legislature directed the State Treasurer to distribute payments to local taxing jurisdictions each quarter in an amount equal to the jurisdiction’s net loss from the previous quarter. See Exhibit 9. At the beginning of subsequent fiscal years, the Legislature directed the State Treasurer to transfer into the account the amount necessary to mitigate the net losses of all jurisdictions.
Public Facilities Districts Increase Sales Tax Rates In Lieu of Mitigation Payments The Legislature enacted an alternate mitigation process for public facilities districts that finance the construction and operation of regional centers. Regional centers may include convention, conference, and special event centers. As they do for other local jurisdictions, the Department of Revenue determines the net loss experienced due to the sourcing change, offset by voluntary compliance revenue. However, instead of direct payments from the State General Fund, the Legislature authorized these public facilities districts to increase their tax rates to mitigate the negative impact of the sourcing change. Public facilities districts are eligible for a rate increase if the district’s net loss is at least 0.50 percent of its sales tax collections from Fiscal Year 2008. An eligible district may increase its tax rate from 0.033 percent to 0.037 percent, but the increase must be in 0.001 percent increments and in the least amount necessary to mitigate the net loss. This local tax is credited against the state sales tax, which means the additional cost of the increase comes from the State General Fund instead of consumers.
State Agencies Followed Statutory Requirements The Department of Revenue and the Office of the State Treasurer implemented the mitigation provisions as directed by statute.
Consistent with statutory requirements, the Department of Revenue initially compared actual tax data between Fiscal Year 2008 and Fiscal Year 2009 each quarter. In consultation with the Mitigation Advisory Committee, the Department developed a methodology to estimate the gain or loss experienced by each jurisdiction due to the sourcing change. At a high level, this methodology involved comparing the sales patterns of selected businesses from before and after the sourcing change.
Exhibit 9 – Mitigation Payments Equal Quarterly Net Losses
The Department had to make decisions about which businesses to include in the estimate, since a shift in a business’s sales patterns may have been for reasons other than the change to destination sourcing. Initially, the Department identified and included only businesses that were likely to make deliveries. To improve accuracy of the estimate, the Department also solicited assistance from local jurisdictions to identify businesses that were erroneously included or excluded, based on the jurisdictions’ knowledge of businesses in their districts. Often it was necessary for the Department to research and contact individual businesses to determine what adjustment was required. To date, the Department has made adjustments for over 2,000 identified businesses and will continue to research businesses brought forward by the Committee or local jurisdictions.
For example, the Department identified, researched, and made adjustments for businesses that: • Opened, closed, moved, or merged during the comparison period; • Do not make deliveries, but had been included in the estimate; • Do make deliveries, but had been excluded from the estimate; • Correctly used destination sourcing prior to July 1, 2008; • Changed to destination sourcing before or after July 1, 2008 by mistake; • Use origin sourcing for some sales and destination sourcing for others; • Report taxes annually; • Reported tax returns with negative amounts or adjustments; • Were located in areas annexed into city limits during the comparison period; • Do not have any in-state establishments; • Report as out-of-state businesses, but have in-state establishments; and • Make minimal deliveries but have a disproportionately large impact on the estimate.
After the initial year of quarter-by-quarter estimates, the Department incorporated all of these adjustments and compared the entire year of data from Fiscal Year 2008 with Fiscal Year 2009 to determine the annual gain or loss of each local jurisdiction. For the following year (Fiscal Year 2010), each jurisdiction’s quarterly gain or loss was equal to one-fourth of the jurisdiction’s annual gain or loss for Fiscal Year 2009.
For each quarter following the sourcing change, the Department offset each jurisdiction’s loss with the amount of voluntary compliance revenue received by the jurisdiction. In compliance with statute, the State Treasurer distributed quarterly payments to any local jurisdictions that have a reamining net loss. In addition to direct payments, the Department determined that three public facilities districts were eligible to increase their local sales tax rate to mitigate a net loss in revenues.
The Department met with the Mitigation Advisory Committee in August 2010 to discuss the yearly review of the annual gains and losses. The Department made additional adjustments to the estimate of the annual loss and the revised amount will be determined in December 2010.
Mitigation Payments and New Revenues Lower Than Expected As of December 1, 2010, there have been eight quarterly mitigation payments to local taxing jurisdictions. During Fiscal Year 2009, the Department estimated that 151 jurisdictions experienced a net loss for at least one quarter. For Fiscal Year 2010, the Department determined that 65 jurisdictions experienced a net loss over the entire year. Over these two years, six jurisdictions
received approximately 75 percent of all mitigation payments: King County Metro Transit, Kent, Sound Transit, Auburn, King County, and Tukwila.
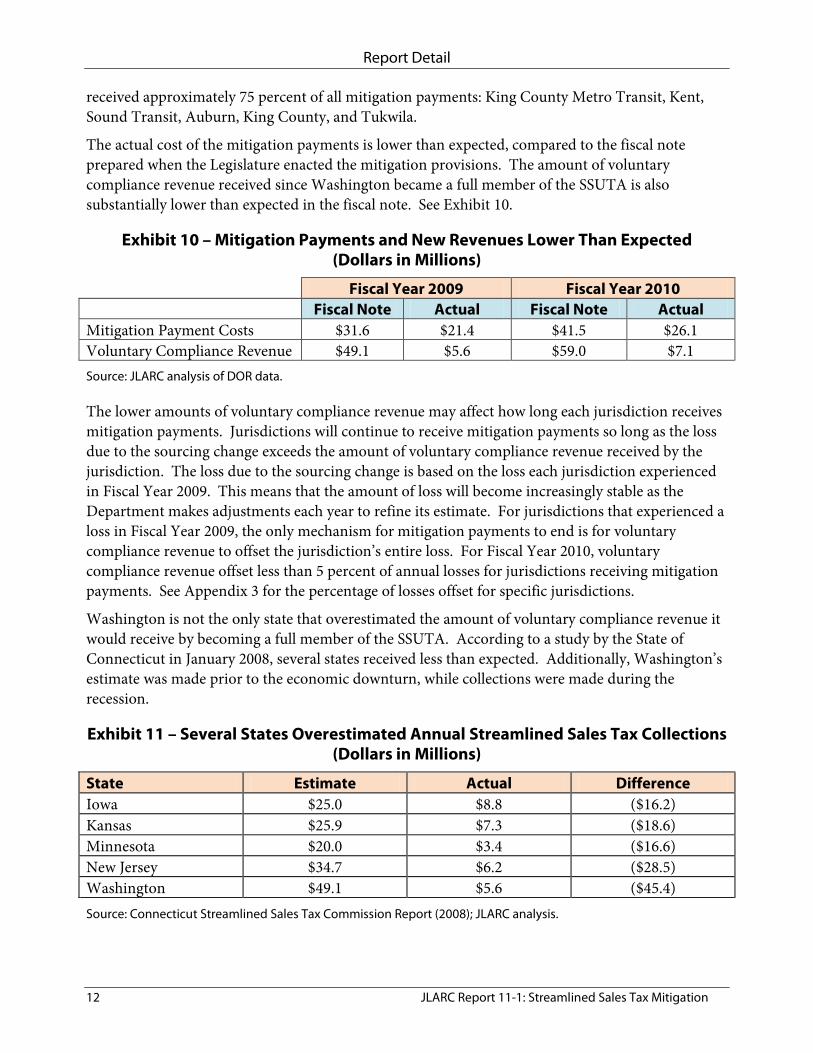
The actual cost of the mitigation payments is lower than expected, compared to the fiscal note prepared when the Legislature enacted the mitigation provisions. The amount of voluntary compliance revenue received since Washington became a full member of the SSUTA is also substantially lower than expected in the fiscal note. See Exhibit 10.
Exhibit 10 – Mitigation Payments and New Revenues Lower Than Expected (Dollars in Millions)
Fiscal Year 2009 Fiscal Year 2010 Fiscal Note Actual Fiscal Note Actual Mitigation Payment Costs $31.6 $21.4 $41.5 $26.1 Voluntary Compliance Revenue $49.1 $5.6 $59.0 $7.1 Source: JLARC analysis of DOR data.
The lower amounts of voluntary compliance revenue may affect how long each jurisdiction receives mitigation payments. Jurisdictions will continue to receive mitigation payments so long as the loss due to the sourcing change exceeds the amount of voluntary compliance revenue received by the jurisdiction. The loss due to the sourcing change is based on the loss each jurisdiction experienced in Fiscal Year 2009. This means that the amount of loss will become increasingly stable as the Department makes adjustments each year to refine its estimate. For jurisdictions that experienced a loss in Fiscal Year 2009, the only mechanism for mitigation payments to end is for voluntary compliance revenue to offset the jurisdiction’s entire loss. For Fiscal Year 2010, voluntary compliance revenue offset less than 5 percent of annual losses for jurisdictions receiving mitigation payments. See Appendix 3 for the percentage of losses offset for specific jurisdictions.
Washington is not the only state that overestimated the amount of voluntary compliance revenue it would receive by becoming a full member of the SSUTA. According to a study by the State of Connecticut in January 2008, several states received less than expected. Additionally, Washington’s estimate was made prior to the economic downturn, while collections were made during the recession.
Exhibit 11 – Several States Overestimated Annual Streamlined Sales Tax Collections (Dollars in Millions)
State Estimate Actual Difference Iowa $25.0 $8.8 ($16.2) Kansas $25.9 $7.3 ($18.6) Minnesota $20.0 $3.4 ($16.6) New Jersey $34.7 $6.2 ($28.5) Washington $49.1 $5.6 ($45.4) Source: Connecticut Streamlined Sales Tax Commission Report (2008); JLARC analysis.
Extent to Which Provisions Mitigate Negative Impacts Is Unclear The State Treasurer distributes mitigation payments equal to the net loss amounts determined by the Department of Revenue. These net loss amounts are equal to the Department’s estimate of the negative impacts due to the sourcing change, less any voluntary compliance revenue. The extent to which the mitigation provisions address the negative impacts to local jurisdictions thus depends on the accuracy of the Department’s estimate of losses due to the sourcing change.
Data is not currently available to ascertain what local sales tax revenues jurisdictions would have actually received if Washington had continued under origin-based sourcing. Absent this information, it is not possible to measure the accuracy of the Department’s estimate, since the actual negative impact of the sourcing change is not known. In order to make an accurate calculation, businesses would need to track and report the location of both the origin and destination of all their deliveries. Neither the Legislature nor the Department requires businesses to report this information.
With existing data, it is not feasible to estimate local losses more reliably than the estimate produced by the Department of Revenue. The primary obstacle to any alternate estimate methodology is isolating the impact of the sourcing change from other concurrent changes in the economy. A direct comparison of each jurisdiction’s revenue year over year will not reflect the impact of the sourcing change, due to the general economic downturn experienced by all jurisdictions in Fiscal Year 2009.
To solicit feedback on the methodology of the Department’s business by business estimate of local losses, JLARC sent a survey to the 364 impacted local jurisdictions. While several respondents criticized the complexity of the estimate, no local jurisdictions suggested improvements to the methodology or proposed an alternative methodology. Similarly, JLARC has no recommendations to improve the methodology used by the Department. Without objective criteria against which to evaluate the Department’s estimate, JLARC is unable to conclude to what extent the mitigation provisions compensate for the negative impacts of the sourcing change.
Mitigation Provisions May Not Reflect All Losses Over Time JLARC identified three consequences of the mitigation provisions that were not explicitly addressed by the Legislature when drafting the statute. First, past payments do not reflect updated loss estimates by the Department of Revenue. Second, future payments will continue to reflect losses experienced in Fiscal Year 2009. Third, the cap on increased tax rates for public facilities districts means that mitigation for the Kent Public Facilities District does not compensate its estimated annual losses.
Past Payments Do Not Reflect Updated Loss Estimates Estimated losses in prior quarters differ from later estimates of losses. For the first year of mitigation, the Department analyzed losses by quarter, while for subsequent years the Department determined the annual loss. This means the amount of mitigation a jurisdiction received in the first four quarterly payments does not necessarily equal the amount it would have received using an annual analysis of losses. Similarly, the Department has refined its estimate of losses throughout the
mitigation process and continues to make adjustments for businesses identified by the Mitigation Advisory Committee or local taxing jurisdictions. Adjustments apply to all mitigation payments going forward, but the Department does not retroactively correct past payments that differed from the adjusted estimate.
This means that several jurisdictions received payments in prior quarters that would have been higher or lower if based on the Department’s updated estimate of losses. The Department consulted with the Attorney General’s Office and determined that if the Department made retroactive adjustments, the Department would be required to make adjustments for all past payments, including both overpayments and underpayments. The Department may not have statutory authority to repossess money from jurisdictions and decided not to make past payment adjustments unless directed to do so by the Legislature.
By comparing the latest annual loss estimates to prior quarterly loss estimates, JLARC estimates that 32 jurisdictions would have received higher mitigation payments, with a total difference for all jurisdictions of approximately $1.7 million. Conversely, JLARC estimates that 121 jurisdictions would have received lower mitigation payments, with a total difference for all jurisdictions of approximately $4.3 million.
Future Payments Will Reflect Losses Experienced in Fiscal Year 2009 The Department of Revenue’s estimate of annual loss is based on the loss jurisdictions experienced in Fiscal Year 2009. Statute explicitly provides that the Department is not required to estimate annual loss more than once, but the Department may make any adjustments to the amount it deems proper in consultation with the Mitigation Advisory Committee each year. The Department has decided that future adjustments will be limited to refining and correcting the estimate for Fiscal Year 2009. Therefore, in each subsequent year all mitigation payments will be based on an adjusted snapshot of the loss experienced in Fiscal Year 2009.
This means that payments in future years will not necessarily reflect the net loss a jurisdiction would have experienced in that future year. For example, if a jurisdiction had a loss in Fiscal Year 2009, then it may still receive mitigation payments in 2015, even if the jurisdiction received more from destination sourcing than it would have under origin sourcing in 2015. Conversely, a jurisdiction that did not experience a loss in Fiscal Year 2009 will not receive mitigation payments, even if it experiences a loss in local sales tax revenue in future years due to destination-based sourcing.
It is unclear whether the Department can make additional estimates in future years. Even if the Department had sufficient resources to replicate the estimate process used in Fiscal Year 2009, the Department could not use the same methodology. The estimate compared data from Fiscal Year 2009 to Fiscal Year 2008, which was the last year that reflected origin-based sourcing. Any future year will be too far removed from Fiscal Year 2008 to make a reliable comparison.
Increased Tax Rate for Kent PFD Does Not Compensate Estimated Losses Public facilities districts (PFDs) for regional centers do not receive quarterly mitigation payments from the State Treasurer. Instead, the mitigation provisions allow such a PFD to increase its sales tax rate if its net loss due to the sourcing change exceeded 0.50 percent of its sales tax collections. In October 2009, the Department of Revenue determined that six such PFDs experienced a net loss due
to the sourcing change. Three of these PFDs were eligible to raise their sales tax rate: Kent, Pasco, and South Snohomish. These jurisdictions increased their sales tax rates in the months following the Department’s determination. JLARC estimates that mitigation for all three PFD’s will cost the state approximately $100 thousand in Fiscal Year 2011.
Under statute, a PFD may only increase its sales tax rate to 0.037 percent. While this increase was sufficient to mitigate the net losses of the Pasco PFD and South Snohomish PFD, the Kent PFD experienced a net loss in sales tax revenue of 26.2 percent in Fiscal Year 2009 due to the sourcing change. Even by increasing its sales tax to the highest available rate, the Kent PFD is only able to restore approximately 10 percent of its sales tax losses each year. JLARC estimates that the Kent PFD would require an additional $106 thousand to fully mitigate its net loss in Fiscal Year 2011. However, the Kent PFD will eventually recoup these losses, so long as the duration of the tax does not exceed 25 years.
No Other States Have Mitigation Provisions Other Full Member States Did Not Experience the Same Impact to Local Tax Revenue There are six other full member states of the SSUTA that, like Washington, changed to destination-based sourcing and have a local sales tax. However, none of these states considered or implemented mitigation provisions to compensate local jurisdictions. While no other states have mitigation provisions, it is unclear whether any other SSUTA full member state faced the same magnitude of negative impacts to local jurisdictions from changing to destination sourcing.
For example, Iowa and North Carolina collect local sales tax at the county level, which may have muted the magnitude of shifts between jurisdictions. In Vermont, fewer than ten towns had a local sales tax at the time of the change, and local jurisdictions rely primarily on property taxes instead of sales taxes for revenue. The Oklahoma Tax Commission considered Oklahoma’s prior sourcing provisions substantially similar to destination-based sourcing and did not anticipate any major impacts to local jurisdictions. Similarly, the Arkansas Department of Finance determined that no jurisdictions were negatively impacted significantly more than others. Kansas studied how local sales tax distributions would have been affected by changing to destination sourcing, but the results of the studies were unclear, so no action was proposed.
States Similar to Washington Have Delayed Implementation of Sourcing Change There are three associate member states to the SSUTA that have a sales tax structure comparable to Washington’s prior to the sourcing change: Ohio, Utah, and Tennessee. Like Washington, these states impose a complex local sales tax and use origin-based sourcing. These states have passed legislation to change to destination-based sourcing, which would likely shift the distribution of local sales tax around the state once the legislation went into effect.
However, Ohio and Utah have since repealed the legislation that implemented destination-based sourcing. The two states sponsored a successful amendment to the SSUTA in December 2007, which allows states to become full members while retaining origin-based sourcing for intrastate
sales of goods. However, five states must first elect this option before it becomes effective, so Ohio and Utah remain associate members.
Tennessee passed legislation to change to destination-based sourcing but has deferred the effective date several times. According to the Tennessee Department of Revenue, it is unlikely that the legislation will come into effect. Instead, Tennessee will likely wait until enough states elect the Ohio-Utah amendment to the SSUTA and retain origin-based sourcing for intrastate sales of goods. Tennessee’s Department of Revenue has a mitigation plan modeled after Washington’s mitigation provisions, but this plan has not passed the Tennessee Legislature. According to the Tennessee Department of Revenue, if Tennessee elects to retain origin-based sourcing for goods, then the impact to local jurisdictions will be minimal and probably not necessitate mitigation.
Why a JLARC Study of Streamlined Sales Tax Mitigation? In 2007, the Legislature enacted legislation (SSB 5089) to conform to the multi-state Streamlined Sales and Use Tax Agreement. The Streamline Agreement is intended to harmonize state tax codes and facilitate collecting sales tax on interstate transactions. The legislation took effect July 1, 2008.
As part of the 2007 legislation, the Legislature included provisions to mitigate negative impacts to revenue collections for local taxing jurisdictions. The Legislature also directed the Joint Legislative Audit and Review Committee (JLARC) to review these mitigation provisions in 2010. The purpose of the study is to determine to what extent the provisions compensate jurisdictions that experienced a loss in local sales tax revenue.
Mitigating Losses of Local Sales Tax Revenue Sourcing Change Caused Sales Tax Revenue Losses for Some Local Jurisdictions Sales tax sourcing rules determine the taxable location of a sale and which jurisdiction is entitled to local sales tax. Prior to becoming a full member of the Streamline Agreement, Washington retailers sourced sales tax based on a delivery’s point of origin. For example, a couch delivered from a warehouse in Kent to a home in Seattle would be sourced to Kent, and Kent would receive the local sales tax from that purchase.
Full members of the Streamline Agreement are required to use a delivery’s destination as the sales tax source. Therefore, in July 2008, Washington changed its sourcing statutes to conform to the Streamline Agreement. Thus Seattle now receives local sales tax for the delivery of a purchase sent to Seattle from Kent. This sourcing change shifted the distribution of sales tax around the state. As a result, some local jurisdictions experienced a loss in local sales tax revenue.
DOR Estimated the Losses of Local Taxing Jurisdictions The Legislature directed the Department of Revenue (DOR), in consultation with an advisory committee, to determine the impact of the sourcing change to local jurisdictions. For the first year, DOR estimated the gains or losses for each jurisdiction by comparing tax returns with the previous year. For subsequent years, DOR uses one-fourth of the loss estimated in the initial year as the quarterly loss for each local jurisdiction.
Local Losses Are Offset by Interstate Revenue Gains Some out-of-state retailers have voluntarily registered with the Streamline Agreement. These registered retailers collect and remit sales tax for purchases delivered to Washington. DOR monitors this new source of sales tax revenue, which is known as voluntary compliance revenue. Each quarter, DOR subtracts the local portion of voluntary compliance revenue from estimated quarterly losses in order to determine the net loss for each local jurisdiction.
Local Jurisdictions Receive State Mitigation Payments Local jurisdictions receive mitigation payments each quarter for the net loss due to the sourcing change. Mitigation continues until DOR determines that a local jurisdiction no longer experiences a net loss. To date, the state has made seven quarterly payments to 153 local jurisdictions, totaling over $47 million.
Study Scope As directed by statute, JLARC will review to what extent the Streamline Agreement mitigation provisions compensate the local taxing jurisdictions impacted by the change in sourcing. JLARC staff will solicit input from DOR’s mitigation advisory committee, which includes representatives from impacted local jurisdictions, the Office of Financial Management, and fiscal committee staff.
Study Objectives The study will analyze the effect of the mitigation provisions by addressing four key questions:
1) Does the Department of Revenue determine local losses consistent with statutory provisions?
2) Do the distributions made to local jurisdictions equal the net loss as determined by the Department of Revenue?
3) To what extent do the distributions compensate local jurisdictions for the impact of the sourcing change?
4) How have other Streamline Agreement member states addressed impacts to local jurisdictions due to sourcing changes?
Timeframe for the Study Staff will present the preliminary report at the December 2010 JLARC meeting and the final report at the January 2011 meeting.
JLARC Staff Contact for the Study Peter Heineccius (360) 786-5123 [email protected]
JLARC Study Process
Criteria for Establishing JLARC Work Program Priorities
Is study consistent with JLARC mission? Is it mandated?
Is this an area of significant fiscal or program impact, a major policy issue facing the state, or otherwise of compelling public interest?
Will there likely be substantive findings and recommendations?
Is this the best use of JLARC resources? For example:
Is JLARC the most appropriate agency to perform the work?
Would the study be nonduplicating?
Would this study be cost-effective compared to other projects (e.g., larger, more substantive studies take longer and cost more, but might also yield more useful results)?
Is funding available to carry out the project?
Legislative Mandate
JLARC- Initiated
Staff Conduct Study
Report and Recommendations Presented at Public Committee Meeting
Legislative and Agency Action; JLARC Follow-up and
APPENDIX 2 – AGENCY RESPONSES • Association of Washington Cities • Washington State Association of Counties • Washington State Transit Association • Office of Financial Management and Department of Revenue
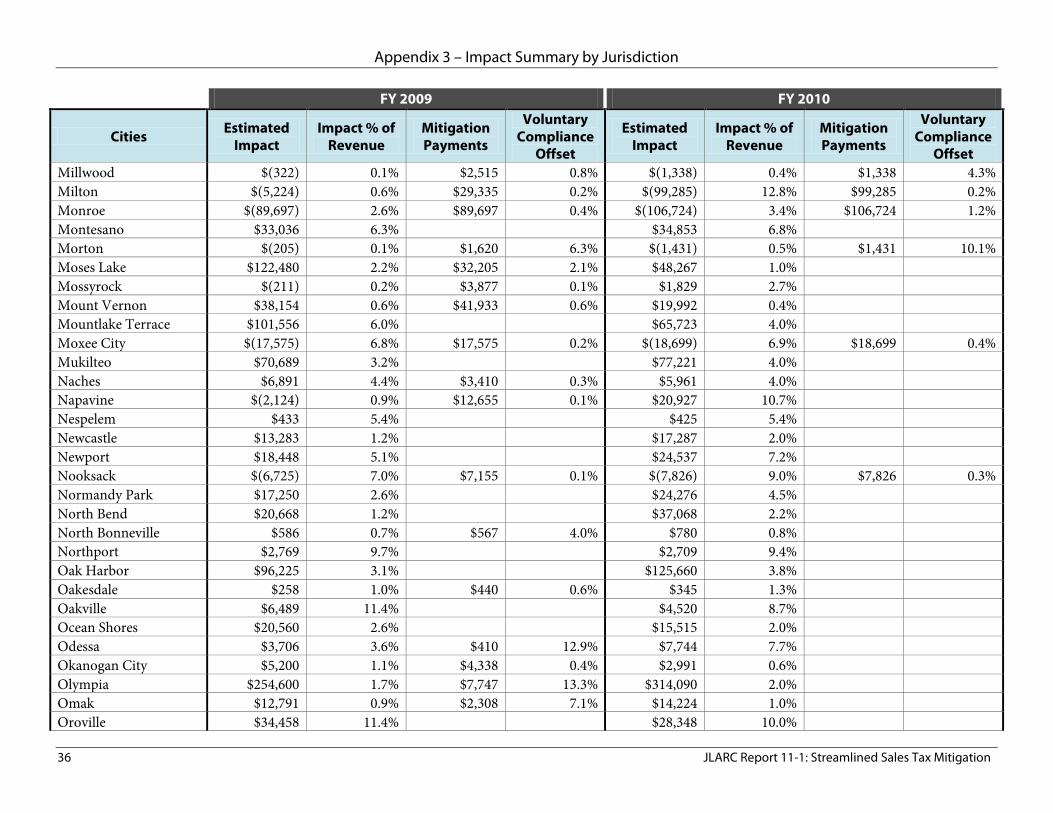
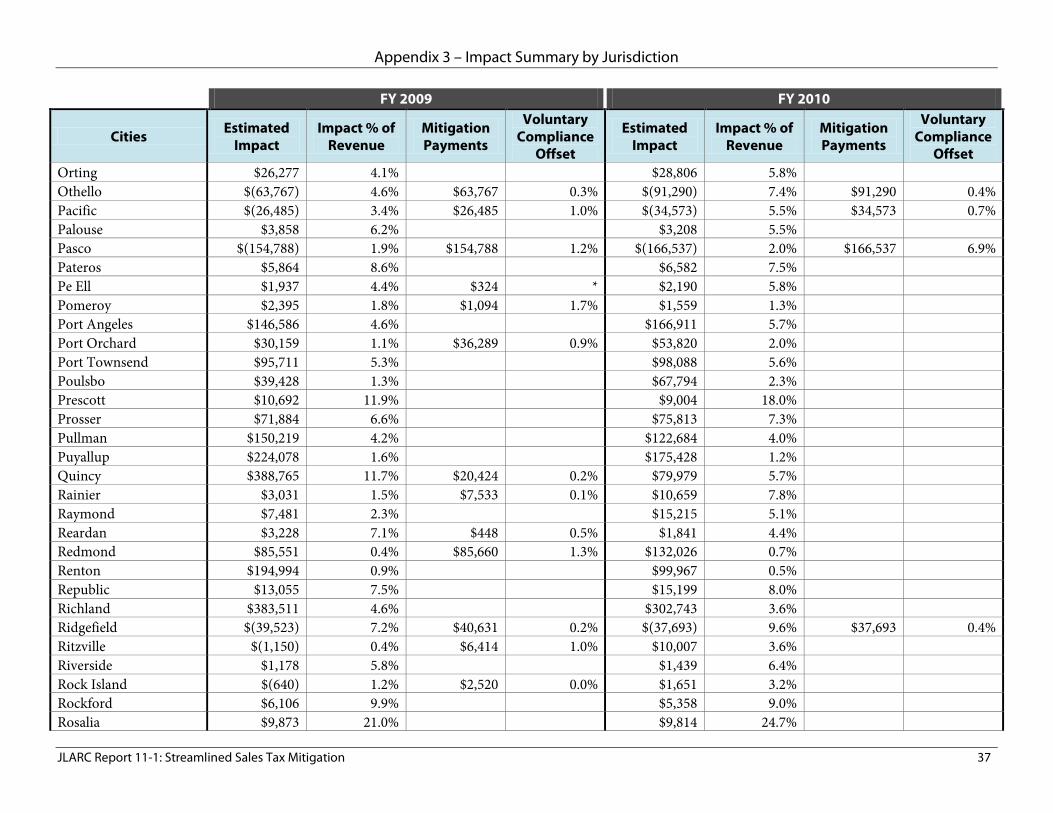
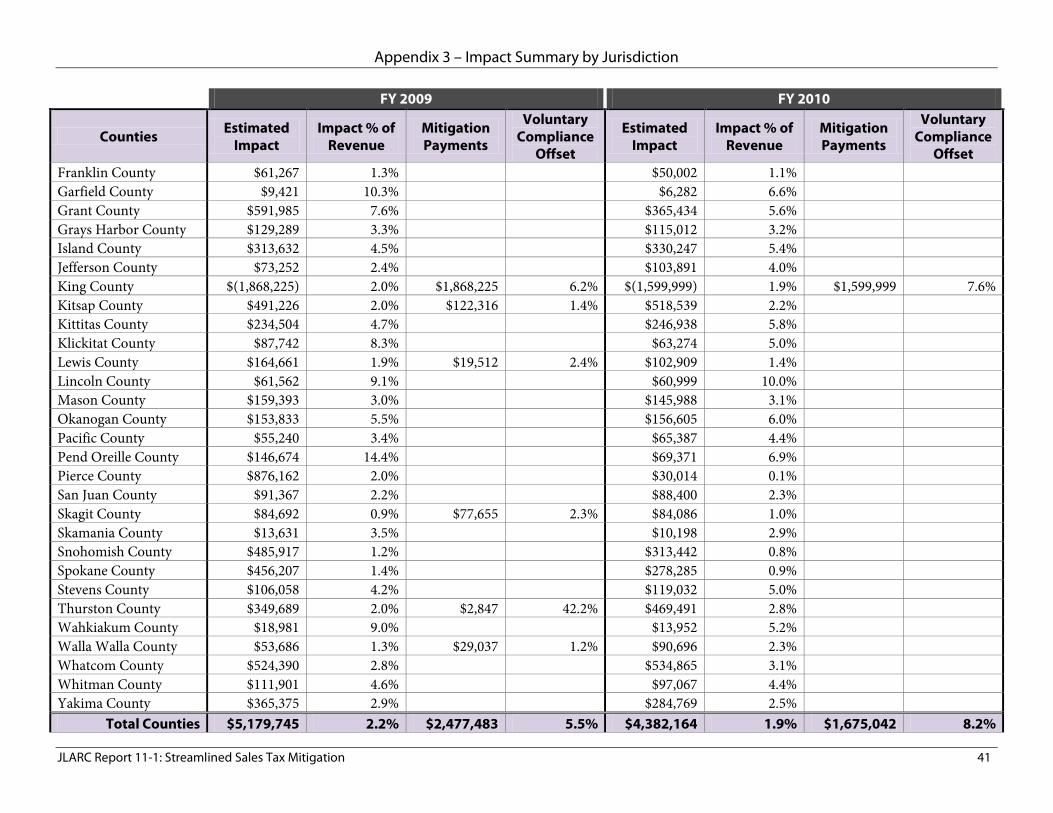
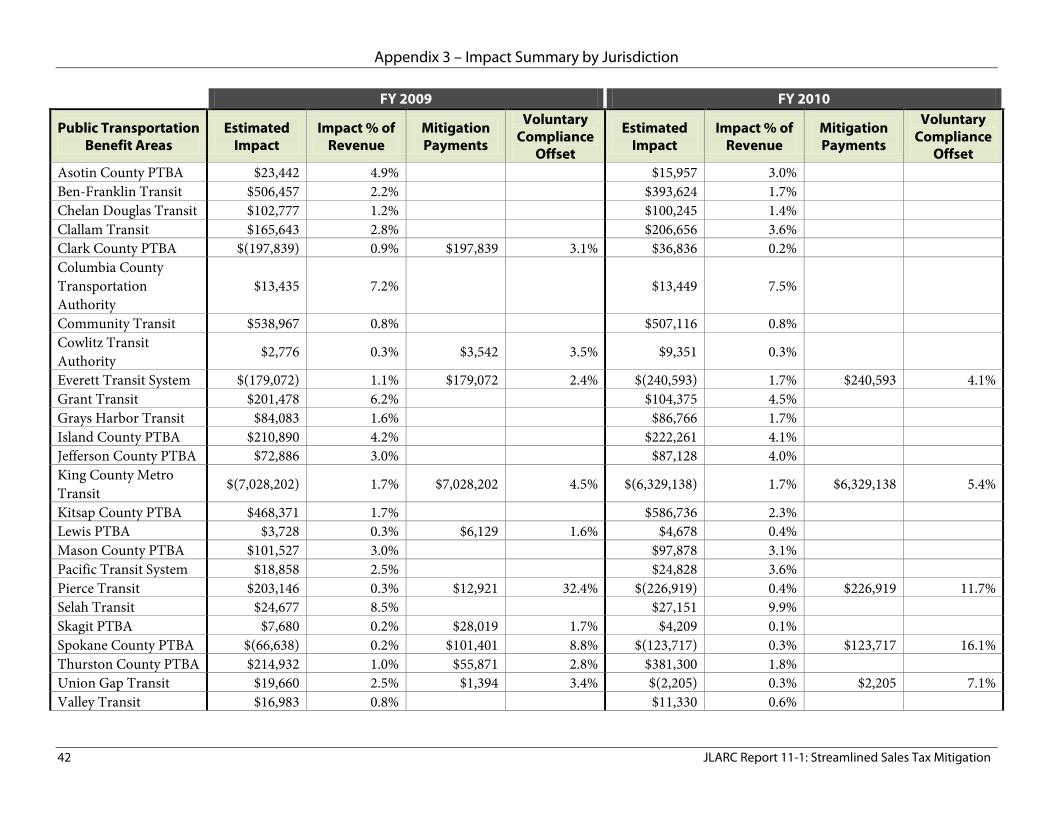
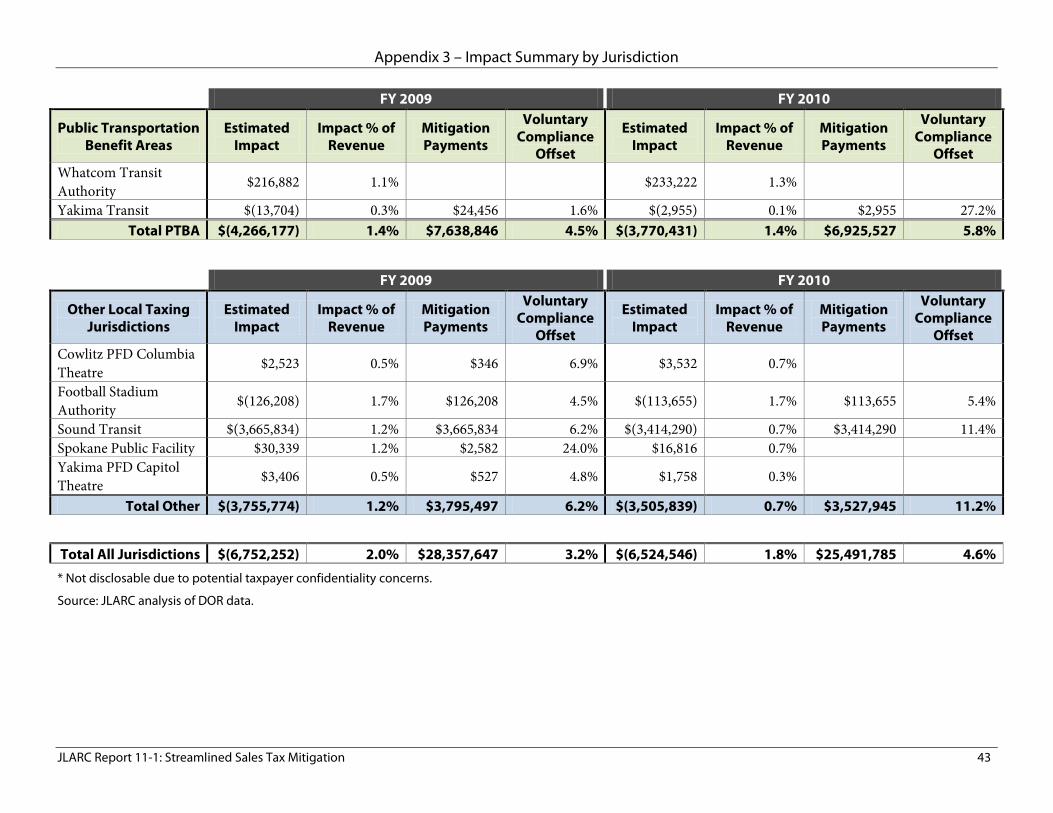
The following tables detail the impact of the Streamlined Sales and Use Tax Agreement for cities, counties, public transportation benefit areas, and other special purpose local taxing jurisdictions that receive mitigation payments. Public facilities districts for regional centers do not receive mitigation payments and are not included.
These tables summarize the following for Fiscal Years 2009 and 2010:
• Estimated Impact: The sum of the four quarters of gains or losses due to the sourcing change (including any voluntary compliance revenue offsets).
• Impact Percent of Revenue: The estimated impact as a percentage of all sales tax revenue to the jurisdiction.
• Mitigation Payments: The sum of the four quarterly mitigation payments made to the jurisdiction.
• Voluntary Compliance Offset: The voluntary compliance revenue as a percentage of the loss due to the sourcing change. This amount is not disclosed for some jurisdictions due to potential taxpayer confidentiality concerns.
Note that in Fiscal Year 2009, some jurisdictions had both net gains and net losses in different quarters. For these jurisdictions the total payments for the year will be higher than the estimated impact for the year.
Total Other $(3,755,774) 1.2% $3,795,497 6.2% $(3,505,839) 0.7% $3,527,945 11.2%
Total All Jurisdictions $(6,752,252) 2.0% $28,357,647 3.2% $(6,524,546) 1.8% $25,491,785 4.6% * Not disclosable due to potential taxpayer confidentiality concerns.
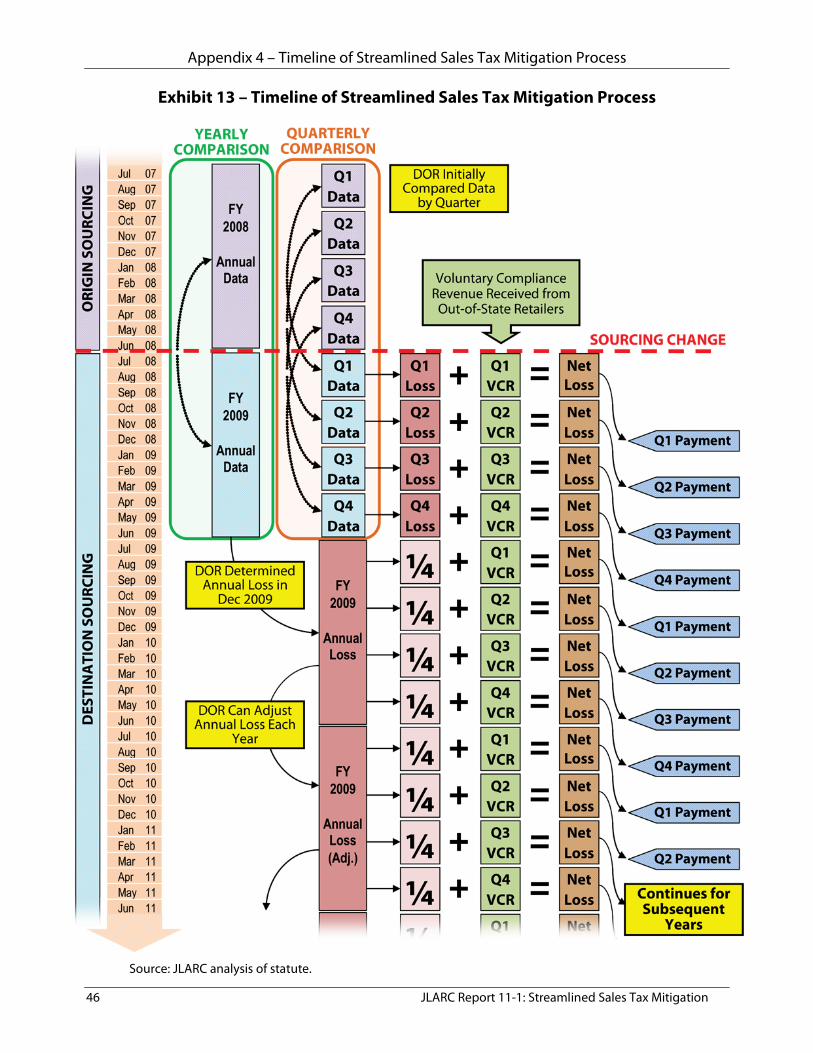
MITIGATION PROCESS On the reverse of this page, see a detailed timeline describing the process leading up to the distribution of mitigation payments. Time runs vertically down the left side of the diagram, and indicates the periods when Washington used origin- and destination-based sourcing. The dashed red line indicates the sourcing change on July 1, 2008.
For the first four quarters after the sourcing change, the Department of Revenue compared data quarter by quarter (see “Quarterly Comparison”). For example, data from the first quarter of Fiscal Year 2009 was compared with the first quarter of Fiscal Year 2008, the second quarter with the second quarter, etc. From this analysis, the Department of Revenue determined the quarterly loss experienced by each jurisdiction (if any). The Department then offset that loss with any voluntary compliance revenue the jurisdiction received that quarter to determine the jurisdiction’s net loss. This amount was then transmitted to the State Treasurer, who issued a mitigation payment at the end of the next quarter.
After the initial year, the Department had sufficient data to compare the data for all of Fiscal Year 2009 with Fiscal Year 2008 (see “Yearly Comparison”). The Department determined the annual loss of each jurisdiction (if any) in December 2009. This annual loss amount reflected losses experienced during Fiscal Year 2009. One-fourth of the annual loss was used in each quarter of Fiscal Year 2010 as the jurisdiction’s quarterly loss. This quarterly loss was offset by voluntary compliance revenue received in each quarter of Fiscal Year 2010. The process of determining the payment amount remained the same.
For subsequent years, the Department may adjust the annual loss amount of each jurisdiction once every year. This means that for all future years, each jurisdiction’s quarterly loss will be based on one-fourth of the adjusted annual loss experienced in Fiscal Year 2009.
Appendix 4 – Timeline of Streamlined Sales Tax Mitigation Process