17
Strengthening Performance Management through Enhanced Wait Time Reporting Haim Sechter: Manager, Reporting and Analytics Jennifer Liu: Team Lead, Reporting and Analytics
| Date post: | 29-Dec-2015 |
| Category: |
Documents |
| Upload: | melissa-casey |
| View: | 214 times |
| Download: | 0 times |
Strengthening Performance Management through Enhanced Wait Time Reporting
Haim Sechter: Manager, Reporting and AnalyticsJennifer Liu: Team Lead, Reporting and Analytics
Presentation Summary
1. Cancer Care Ontario background
2. Wait Time Reporting Current data collection and reporting New reporting solution
3. Project delivery, benefits, and lessons learned
4. Next steps
2
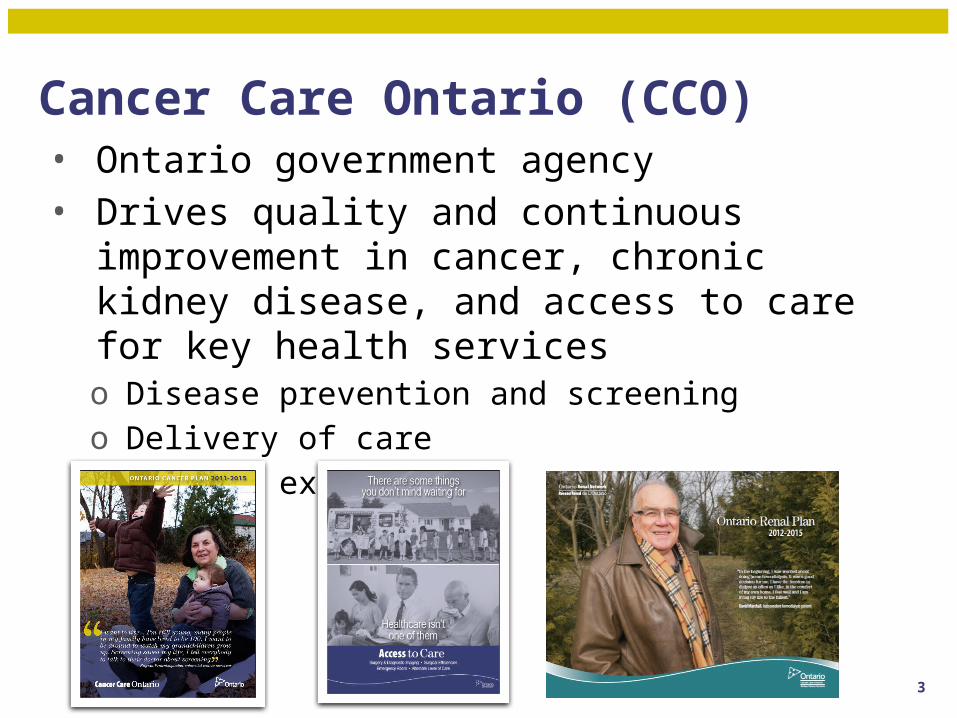
Cancer Care Ontario (CCO)• Ontario government agency • Drives quality and continuous improvement in cancer,
chronic kidney disease, and access to care for key health serviceso Disease prevention and screeningo Delivery of care o Patient experience
3
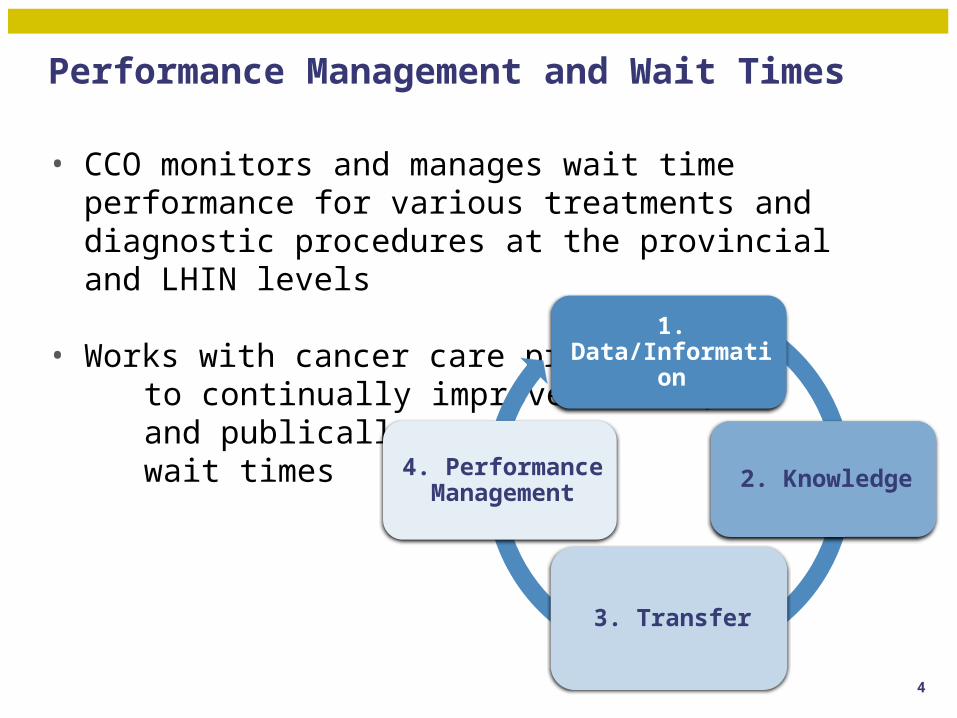
Performance Management and Wait Times
• CCO monitors and manages wait time performance for various treatments and diagnostic procedures at the provincial and LHIN levels
• Works with cancer care providers to continually improve access, and publically reports wait times
1. Data/Information
2. Knowledge
3. Transfer
4. Performance Management
4
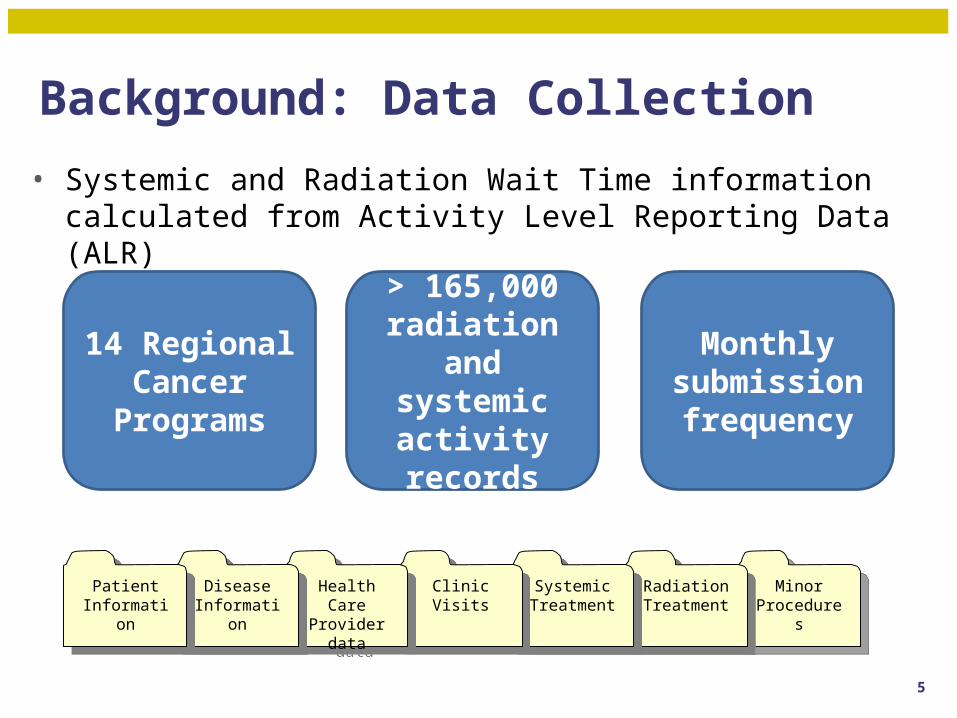
Background: Data Collection
• Systemic and Radiation Wait Time information calculated from Activity Level Reporting Data (ALR)
Minor Procedures
Minor Procedures
14 Regional Cancer
Programs
> 165,000 radiation and
systemic activity records
Monthly submission frequency
Radiation Treatment
Radiation Treatment
Systemic Treatment
Systemic Treatment
Clinic VisitsClinic VisitsHealth Care Provider data
Health Care Provider data
Disease Information
Disease Information
Patient Information
Patient Information
5
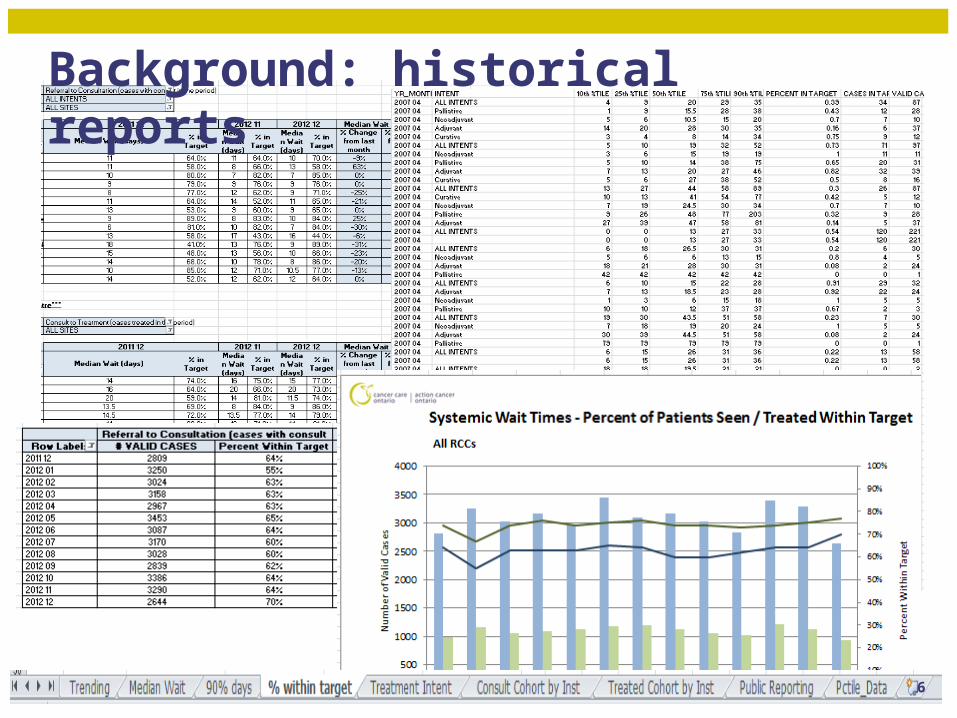
Background: historical reports
6
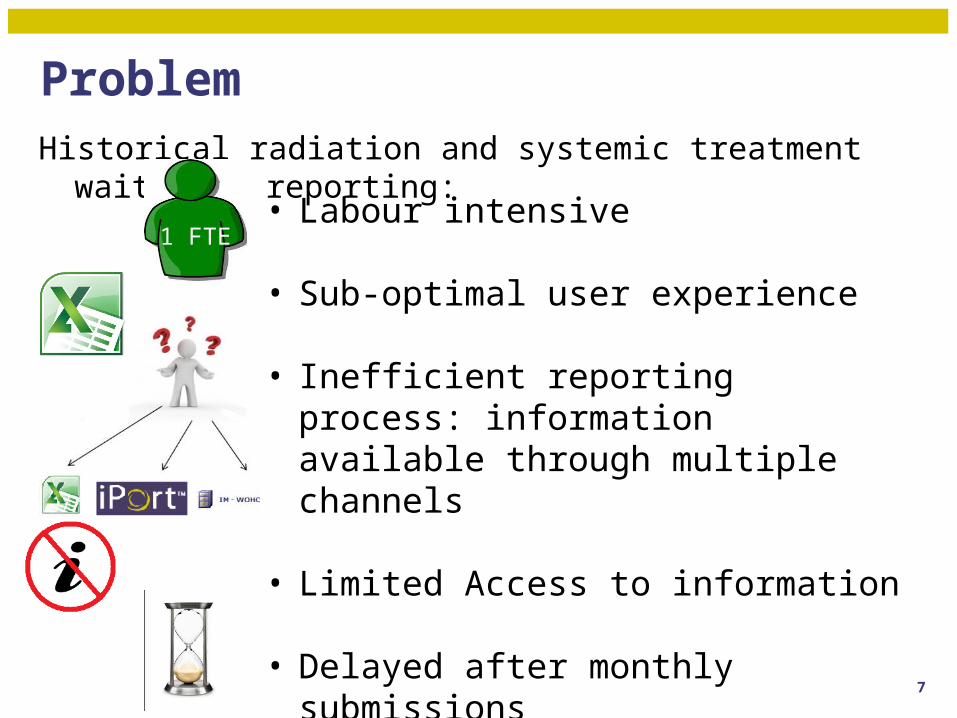
ProblemHistorical radiation and systemic treatment wait time reporting:
• Labour intensive
• Sub-optimal user experience
• Inefficient reporting process: information available through multiple channels
• Limited Access to information
• Delayed after monthly submissions
1 FTE
7
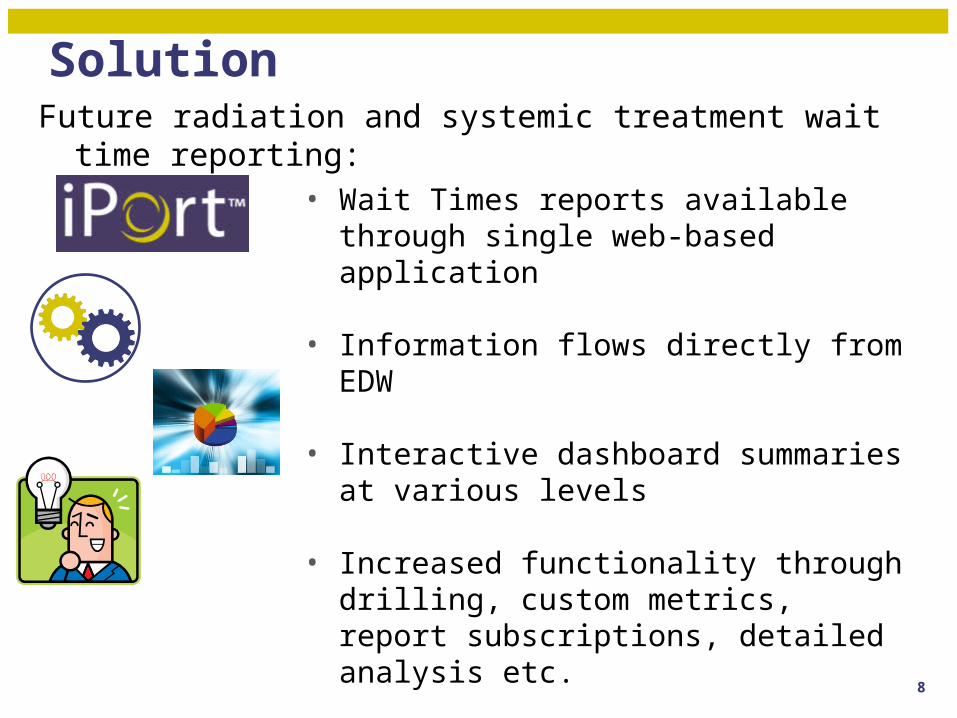
Future radiation and systemic treatment wait time reporting:
Solution
• Wait Times reports available through single web-based application
• Information flows directly from EDW
• Interactive dashboard summaries at various levels
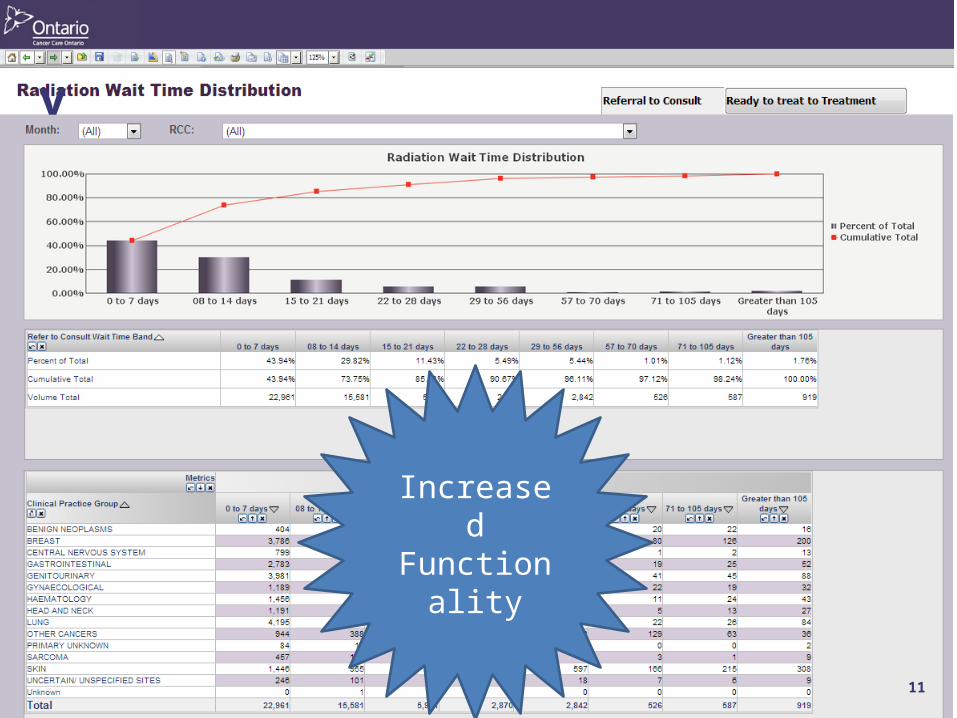
• Increased functionality through drilling, custom metrics, report subscriptions, detailed analysis etc.
8
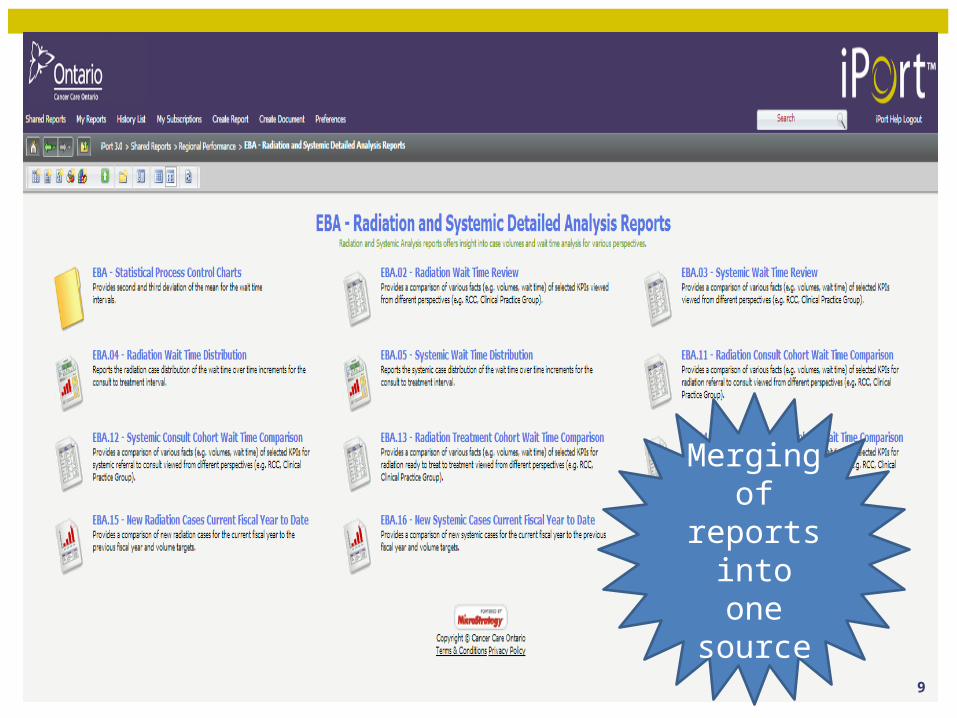
Merging of reports into one source
9
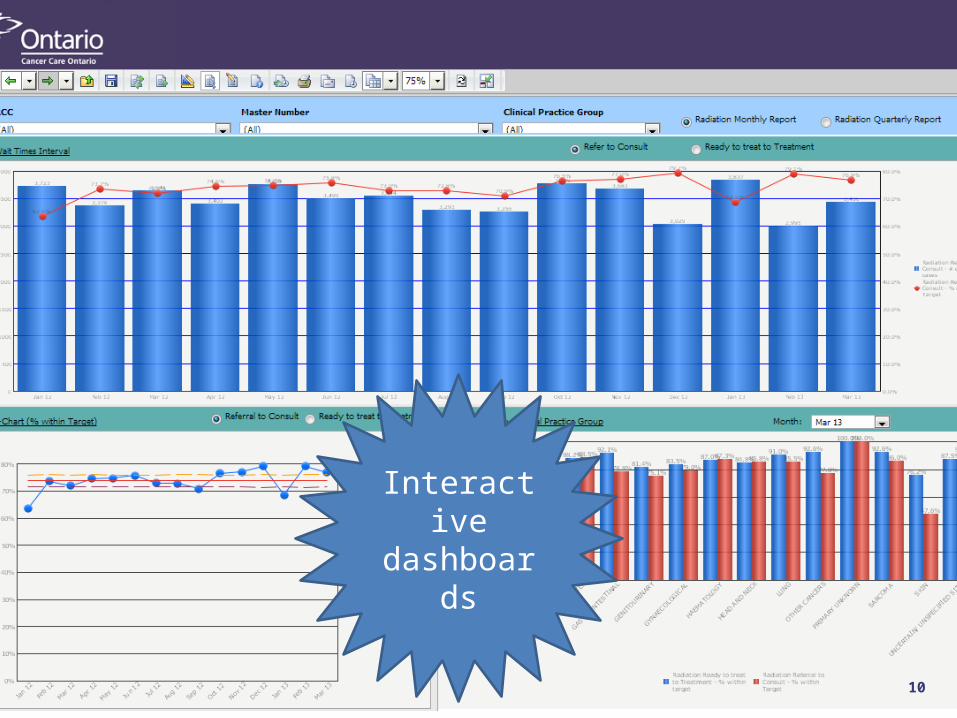
Interactive dashboards
10
v
Increased Functionality
11
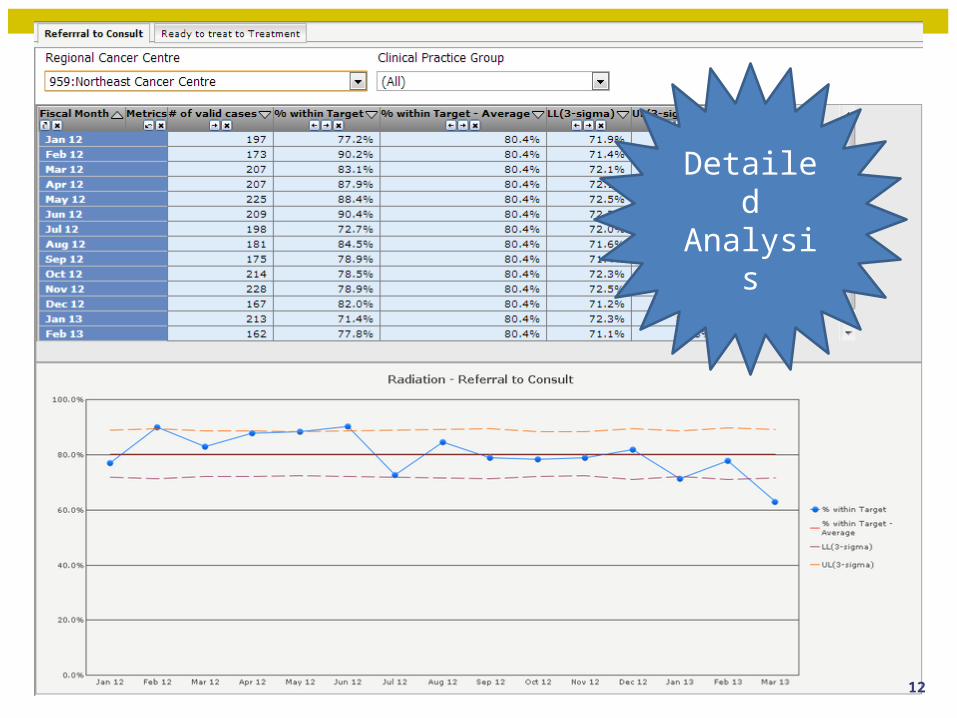
Detailed Analysis
12
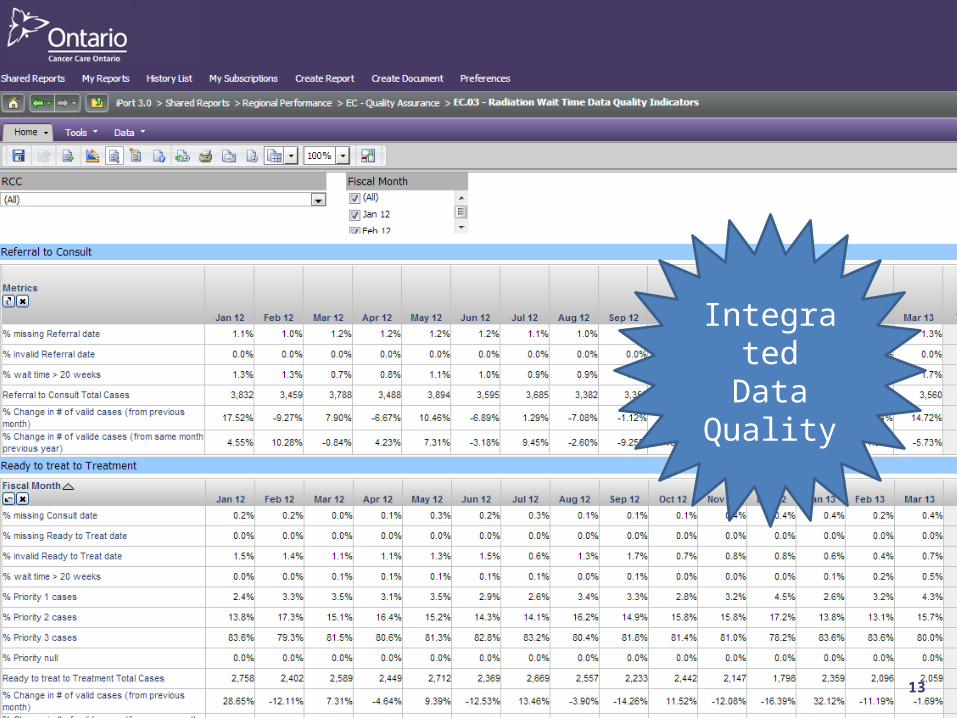
Integrated Data
Quality
13
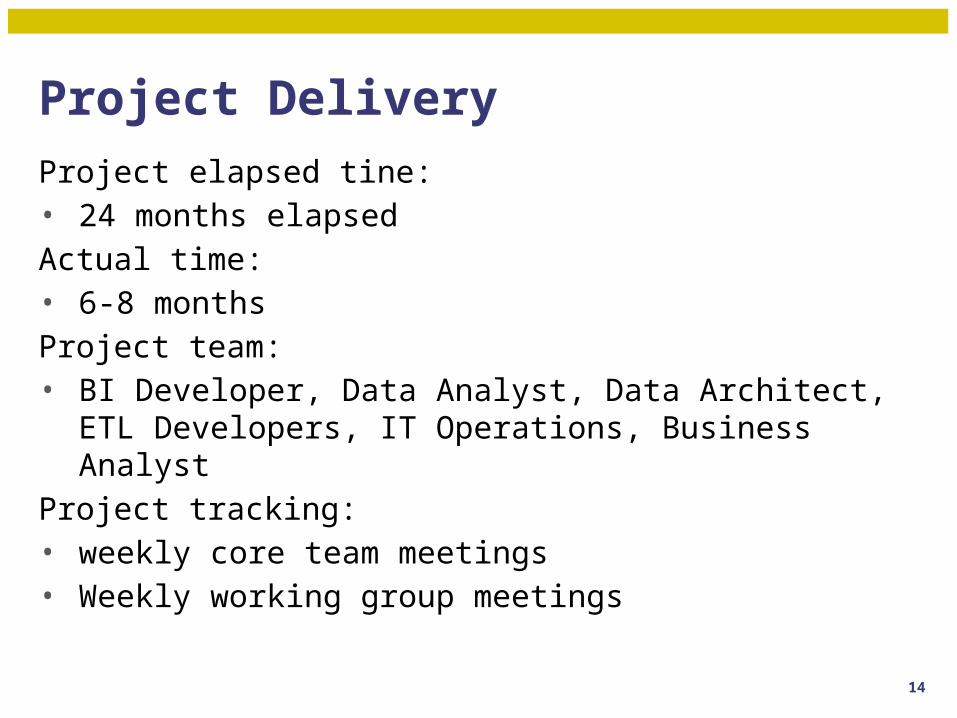
Project Delivery
Project elapsed tine: • 24 months elapsed
Actual time: • 6-8 months
Project team: • BI Developer, Data Analyst, Data Architect, ETL
Developers, IT Operations, Business Analyst
Project tracking: • weekly core team meetings• Weekly working group meetings
14
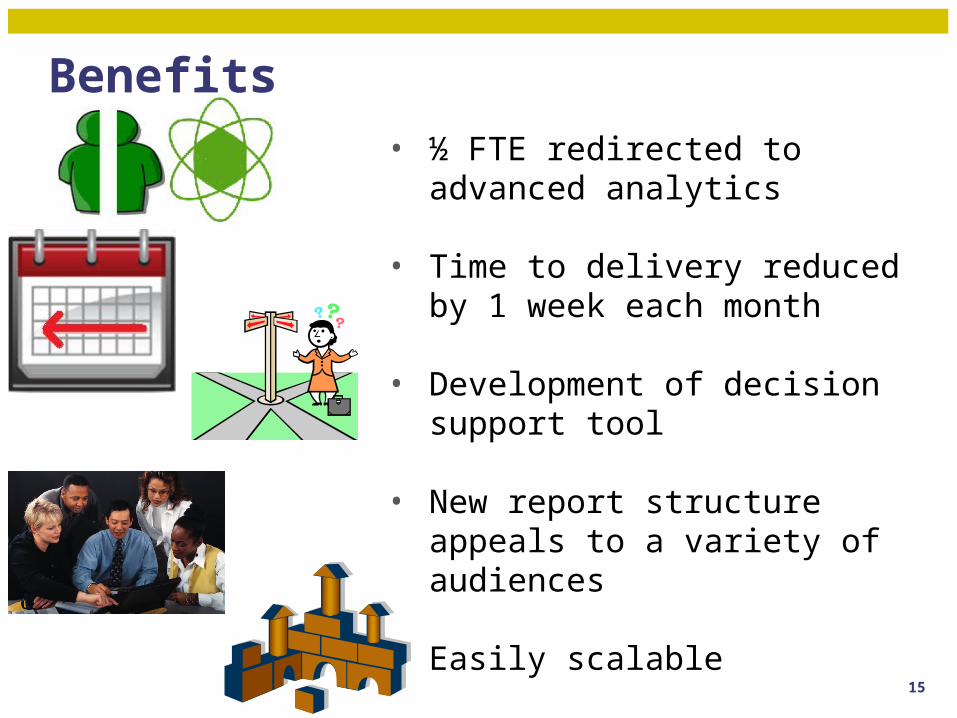
Benefits
• ½ FTE redirected to advanced analytics
• Time to delivery reduced by 1 week each month
• Development of decision support tool
• New report structure appeals to a variety of audiences
• Easily scalable 15
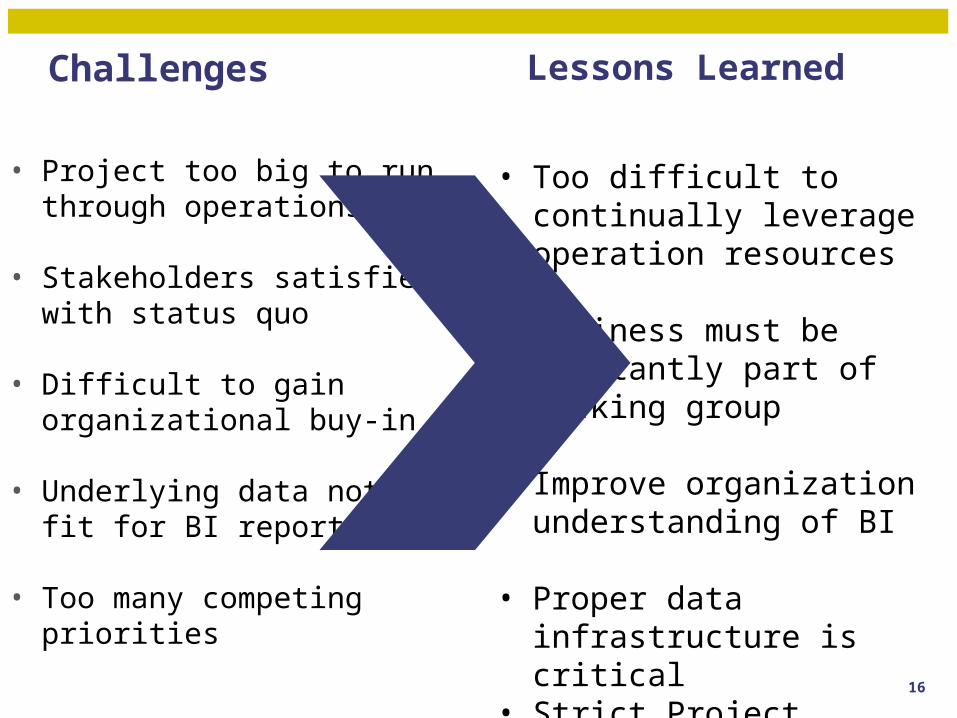
Challenges
• Project too big to run through operations
• Stakeholders satisfied with status quo
• Difficult to gain organizational buy-in
• Underlying data not fit for BI reporting
• Too many competing priorities
• Too difficult to continually leverage operation resources
• Business must be constantly part of working group
• Improve organization understanding of BI
• Proper data infrastructure is critical
• Strict Project management approach has to be leveraged
Lessons Learned
16
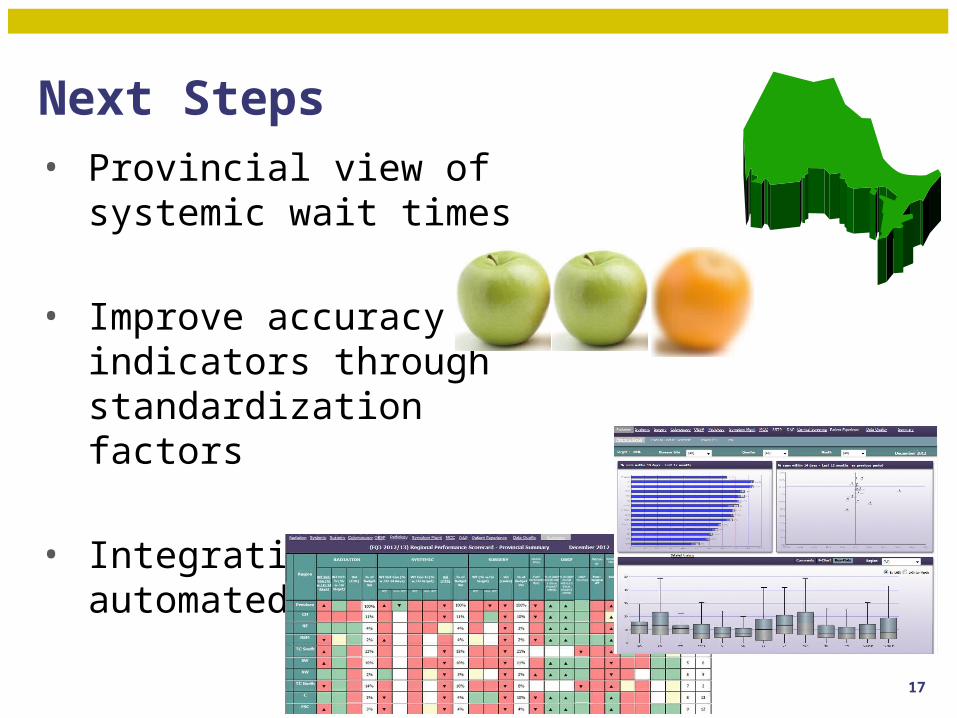
Next Steps• Provincial view of systemic
wait times
• Improve accuracy of indicators through standardization factors
• Integration with automated scorecard
17


