88
UNCDF | FFDO/UN-DESA DRAFT Joint Publication Strengthening Subnational Finance in LDCs Comment now on the draft publication! http://tinyurl.com/draft-publication-comments
| Date post: | 20-Mar-2018 |
| Category: |
Documents |
| Upload: | nguyendang |
| View: | 221 times |
| Download: | 1 times |

UNCDF | FFDO/UN-DESA DRAFT Joint Publication
Strengthening
Subnational Finance in LDCs
Comment now on the draft publication!
http://tinyurl.com/draft-publication-comments
2
Table of Contents
(I) Setting the stage – Municipal finance and the 2030 Agenda for Sustainable Development ...... 4
Localizing the new global development agenda ................................................................................. 4
Financing challenges at the local level ............................................................................................... 5
Special challenges for subnational finance in LDCs........................................................................... 7
Urbanization in LDCs ......................................................................................................................... 8
Challenges to fiscal decentralization efforts in LDCs....................................................................... 11
The global economic context ............................................................................................................ 14
(II) Challenges in raising subnational revenues ............................................................................... 14
Taxation at different levels of government ....................................................................................... 15
The challenges of levying common local taxes: property and business taxes .................................. 19
Perspectives on business taxes .......................................................................................................... 22
Subnational revenue composition in African LDCs ......................................................................... 23
Examples of subnational revenue composition in Asian LDCs ........................................................ 25
Introduction of user charges, fees and licenses ................................................................................. 27
Intergovernmental transfers in LDCs ................................................................................................ 30
Surcharges as a complement to intergovernmental transfers ............................................................ 31
(III) LDC experiences in improving municipal revenue generation .............................................. 33
Lao PDR (1): Land titling as a road to better property taxation ....................................................... 33
Mozambique (1): Facilitating intergovernmental transfers through implementation of a treasury single account.................................................................................................................................... 35
Ethiopia: Implementing a land value capture system during rapid urbanization .............................. 36
Uganda (1): The role of grants and intergovernmental transfers in a second-tier city – perspectives from Busia Municipal Council .......................................................................................................... 38
Lesotho: Local governments and revenue generation in Lesotho-Legally empowered but politically constrained ........................................................................................................................................ 39
(IV) Challenges in municipal financial management ....................................................................... 41
(V) LDC experiences in developing local participatory budgeting ................................................ 47
Nepal: Increasing citizen participation with participatory planning (PP) ......................................... 47
Bangladesh (1): Experimenting with inclusive budgetary processes at the local level .................... 48
Solomon Islands: Tackling local governance challenges in a small island developing state ........... 48
Senegal (1): The experience of PB experiments in Fissel and Ndiaganiao ...................................... 49
Madagascar: Building capacity for PB through donor support ......................................................... 50
Mozambique (1): Evolving PB approaches in Maputo ..................................................................... 50

3
(VI) Challenges in accessing long-term finance for capital investments ........................................ 52
Municipal bonds................................................................................................................................ 53
Institutional investors: an untapped source for sub-national infrastructure investment? .................. 64
(VII) LDC experiences in mobilizing long-term finance for capital investment ........................... 69
Uganda (2): A project-based partnership to finance municipal transportation in Busia ................... 69
Lao PDR (2): The Morphu Village water supply project: a local PPP done right ............................ 70
Bangladesh (2): Establishing a municipal development fund to finance local infrastructure ........... 71
Tanzania: Dar es Salaam’s water supply: a local PPP gone wrong .................................................. 72
Senegal (2): Dakar’s experience in (almost) getting a municipal bond to the financial market ....... 73
(VIII) International cooperation on municipal finance ................................................................... 75
Climate finance for subnational governments................................................................................... 77
How to strengthen international cooperation for subnational finance? ............................................ 78
(IX) Bibliography ................................................................................................................................ 81

4
(I) Setting the stage – Municipal finance and the 2030 Agenda for Sustainable Development
With the adoption of the 2030 Agenda for Sustainable Development, the Addis Ababa Action Agenda
(Addis Agenda), and the Paris Agreement in 2015, the international community has laid out a clear
vision and roadmap for achieving sustainable development in all of its three dimensions—economic,
social and environmental.1 Yet, while the 2030 Agenda is global, most of its implementation will
ultimately happen at the local level with the participation of subnational governments and local
stakeholders. Being closer to the people than central governments, local governments, and local
stakeholders are uniquely positioned to identify development needs and contribute to the development
of adequate policy measures to address them.
The importance of the local dimension has been recognized by world leaders. All landmark
agreements of 2015—the year of “global action” —recognized the imperative to work with local
authorities and at the local level. Sustainable Development Goal (SDG) 11 is a local objective in itself
and calls for cities and human settlements to be “inclusive, safe, resilient and sustainable”. The local
dimension permeates other SDGs, targets, and means of implementation, including those on basic
public service provision in health, energy, water and sanitation, education and other areas, climate
change-related planning, sustainable tourism, ecosystem and biodiversity, and the capacity of local
communities to pursue sustainable livelihood opportunities.
Localizing the new global development agenda
The Secretary-General of the United Nations, Mr. Ban Ki-moon, emphasized that “our struggle for
global sustainability will be won or lost in cities.” How to win that struggle and “localize” the 2030
Agenda and other landmark UN agreements of recent years is at the heart of the deliberations leading
up to the Third United Nations Conference on Housing and Sustainable Urban Development (UN
Habitat III, 17-20 October 2016). The Conference presents a timely opportunity to chart new
pathways in response to the challenges of urbanization and the implementation of the 2015 landmark
agreements. The outcome document of UN Habitat III, “The New Urban Agenda”, is envisaged to
promote a new model of urban development, one that integrates all dimensions of sustainable
development and helps align national and subnational priorities in support of inclusive and equitable
1 Lead authors were Daniel Platz (FFDO, UN-DESA), Vito Intini (UNCDF) and Tim Hilger (UNCDF). All EGM
participants (both Africa and Asia made important substantive contributions (annex forthcoming). Patrick Nally, Yixiao Fang and Yijun William Wu provided excellent research assistance. Comments from Paul Smoke, Dominika Halka and Shari Spiegel are gratefully acknowledged. The views and opinions expressed in this informal background paper are those of the lead authors and do not necessarily reflect those of the United Nations Secretariat or UNCDF. The designations and terminology employed may not conform to United Nations practice and do not imply the expression of any opinion.

5
economic and social development. Implementing the New Urban Agenda will rest on three pillars:
sound urban rules and regulations, farsighted urban planning and design, and strengthened municipal
finance.
Financing challenges at the local level
The financing required to implement the 2030 Agenda is estimated to be of the order of several
trillion dollars per year, and a significant portion of it will have to be mobilized and spent at the local
level. Indeed, mobilizing adequate funding for long-term investments in support of inclusive and
sustainable local development is perhaps the greatest challenge that local authorities face. The Addis
Agenda provides a natural starting point to discuss local finance in the context of the 2030 Agenda. It
presents a coherent framework for financing the 2030 Agenda for Sustainable Development, including
the Sustainable Development Goals, and puts forward a comprehensive set of corresponding policy
actions. In the Addis Agenda, Member States committed to fully engage local authorities in their
implementation efforts. Furthermore, the Addis Agenda promotes greater international cooperation
“to strengthen capacities of municipalities and other local authorities” (paragraph 34).
To meet the financing challenge, the Addis Agenda highlights the need to draw upon all sources of
finance (public, private, national, and international) and puts forward a policy framework that realigns
financial flows with public goals. It calls for an enabling environment comprising appropriate public
policies and regulatory frameworks that help unlock the transformative potential of people and
incentivize changes in consumption, production, and investment patterns in support of sustainable
development.
The comprehensive approach of the Addis Agenda translates well to the local level. For local
authorities, drawing upon all sources of finance implies the need to more effectively mobilize internal
(e.g., local taxes, user fees, land value capture) and external revenue streams (e.g., intergovernmental
transfers, donor support), in order to provide public goods and services and to finance large-scale
capital investments. A policy framework that realigns local financial flows with local public goals
implies a well-coordinated fiscal, political, and administrative decentralization effort, where local
expenditure responsibilities are backed by reliable intergovernmental transfers and fiscal
empowerment (e.g., the legal and technical capacity to levy taxes).
This report places particular emphasis on the challenges faced by local governments in least
developed countries (LDCs, see Box 1). The Addis Agenda pays special heed to LDCs as the most
vulnerable group of countries. It calls for global support to overcome the structural challenges they
face. It encourages donor countries to increase the allocation of official development assistance
(ODA) to the world’s poorest nations to 0.2 per cent of national income. The European Union

6
committed to do so by 2030. A major challenge for LDCs and donors alike will be to ensure that those
resources are effectively directed to and spent at the local level—where they are needed most.
Box 1.1: What are least developed countries (LDCs)?
LDCs are the poorest and most vulnerable countries. They comprise more than 880 million people*, or around 12 per cent of the world’s population, but account for less than 2 per cent of world GDP.
The low level of socio-economic development in LDCs is linked to weak human and institutional
capacities, low income converging with high inequality, and a lack of domestic financial resources.
Governance crises, political instability, and, in some cases, internal or external conflicts often
exacerbate the situation. LDCs often suffer from low productivity and low investment. Furthermore,
they are exposed to external shocks, for example from their dependency on the export of a few
commodities as the primary source of revenue or their often high vulnerability to climate change.
The United Nations define least developed countries (LDCs) as low-income countries suffering from
structural impediments to sustainable development. Every three years, the list of LDCs is reviewed by
the Committee for Development Policy (CDP), which gives recommendations for inclusion and
graduation of countries. Recommendations are then endorsed by the Economic and Social Council
(ECOSOC) and decided on by the General Assembly. The criteria used by the CDP for inclusion in
the list are (1) gross national income per capita; (2) the human assets index (HAI); and (3) the
economic vulnerability index (EVI). The CDP sets thresholds on each of the three criteria, and
country must satisfy all three at one triennial review to be added to the list. In addition, its population
must not be larger than 75 million inhabitants. However, decisions about inclusion and graduation are
not only based on the assessment of the three criteria, but also factor in country-specific information
and views from the government. To leave the LDC category, a country must cease to meet any two
criteria through two consecutive reviews.

7
Table 1.1: List of least developed countries as of May 2016 (year of inclusion in brackets):
Africa:
Angola (1994)
Benin (1971)
Burkina Faso (1971)
Burundi (1971)
Central African Republic (1975)
Chad (1971)
Comoros (1977)
Dem. Rep. of the Congo (1991)
Djibouti (1982)
Equatorial Guinea (1982)
Eritrea (1994)
Ethiopia (1971)
Gambia (1975)
Guinea (1971)
Guinea-Bissau (1981)
Lesotho (1971)
Liberia (1990)
Madagascar (1991)
Malawi (1971)
Mali (1971)
Mauritania (1986)
Mozambique (1988)
Niger (1971)
Rwanda (1971)
Sao Tome And Principe (1982)
Senegal (2000)
Sierra Leone (1982)
Somalia (1971)
South Sudan (2012)
Sudan (1971)
Togo (1982)
Uganda (1971)
United Rep. of Tanzania (1971)
Zambia (1991)
Asia and the Pacific:
Afghanistan (1971)
Bangladesh (1975)
Bhutan (1971)
Cambodia (1991)
Kiribati (1986)
Lao People’s Dem. Republic (1971)
Myanmar (1987)
Nepal (1971)
Solomon Islands (1991)
Timor-Leste (2003)
Tuvalu (1986)
Vanuatu (1985)
Yemen (1971)
Latin America and the Caribbean:
Haiti (1971)
Special challenges for subnational finance in LDCs
The state of subnational finance in LDCs is affected by conditions and developments at the local,
national and global levels. Certain megatrends, such as rapid urbanization, changes to the global
economic context, climate change, and natural disasters have particularly strong impacts at the local
level. Limited subnational financial capacities reduce the ability of local government authorities in
8
LDCs to effectively manage these impacts, as well as to improve local service delivery and finance
local infrastructure development. In addition to global megatrends, LDCs are confronted with
additional challenges from the national and local level in most areas of subnational finance. Weak
human and institutional capacities, low per capita income, low productivity, and shallow financial
sectors are frequently combined with political instability and high vulnerability to terms-of-trade
shocks due to the reliance on a limited number of commodities for export. At the subnational level,
these characteristics may translate into small local revenue bases; limited financial, expenditure, and
asset management capacities; unpredictable and insufficient intergovernmental transfers; and little to
no access to private capital. Other political constraints, e.g., insufficient local revenue authority, may
pose further challenges for subnational finance in LDCs.
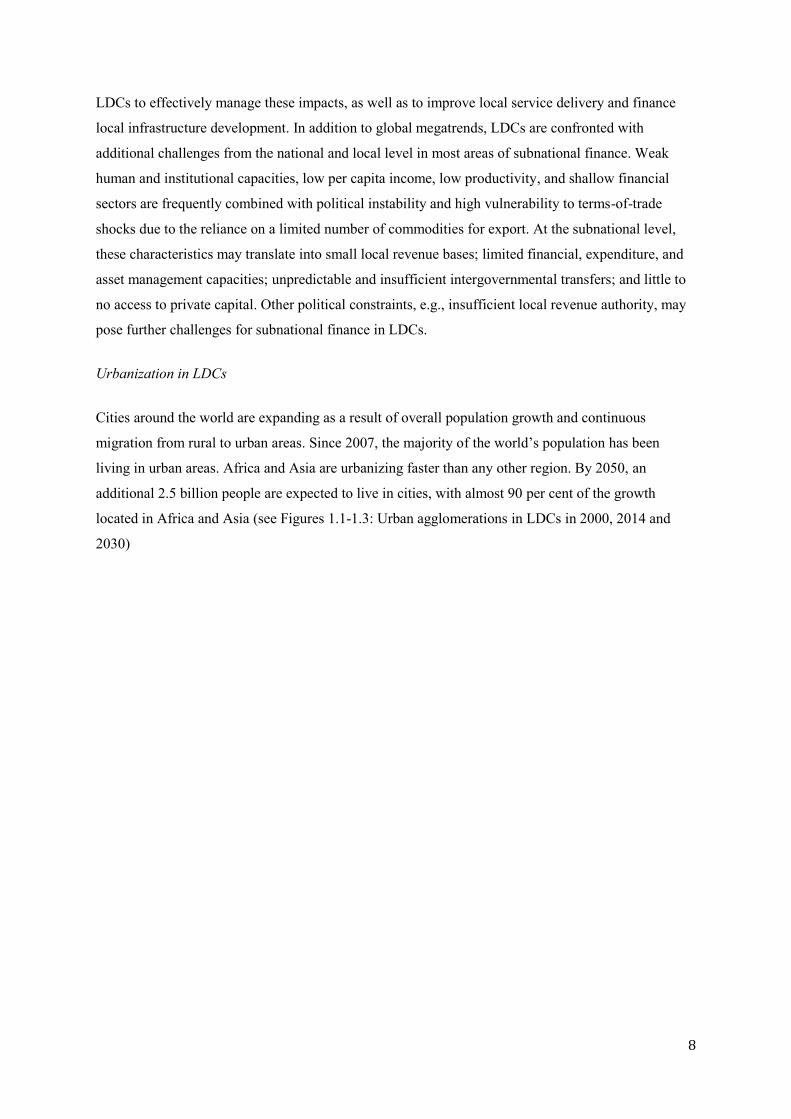
Urbanization in LDCs
Cities around the world are expanding as a result of overall population growth and continuous
migration from rural to urban areas. Since 2007, the majority of the world’s population has been
living in urban areas. Africa and Asia are urbanizing faster than any other region. By 2050, an
additional 2.5 billion people are expected to live in cities, with almost 90 per cent of the growth
located in Africa and Asia (see Figures 1.1-1.3: Urban agglomerations in LDCs in 2000, 2014 and
2030)

9
Figure 1.1: Urban agglomerations in LDCs 2000:
Figure 1.2: Urban agglomerations in LDCs in 2014:

10
Figure 1.3: Projected urban agglomerations in LDCs in 2030:
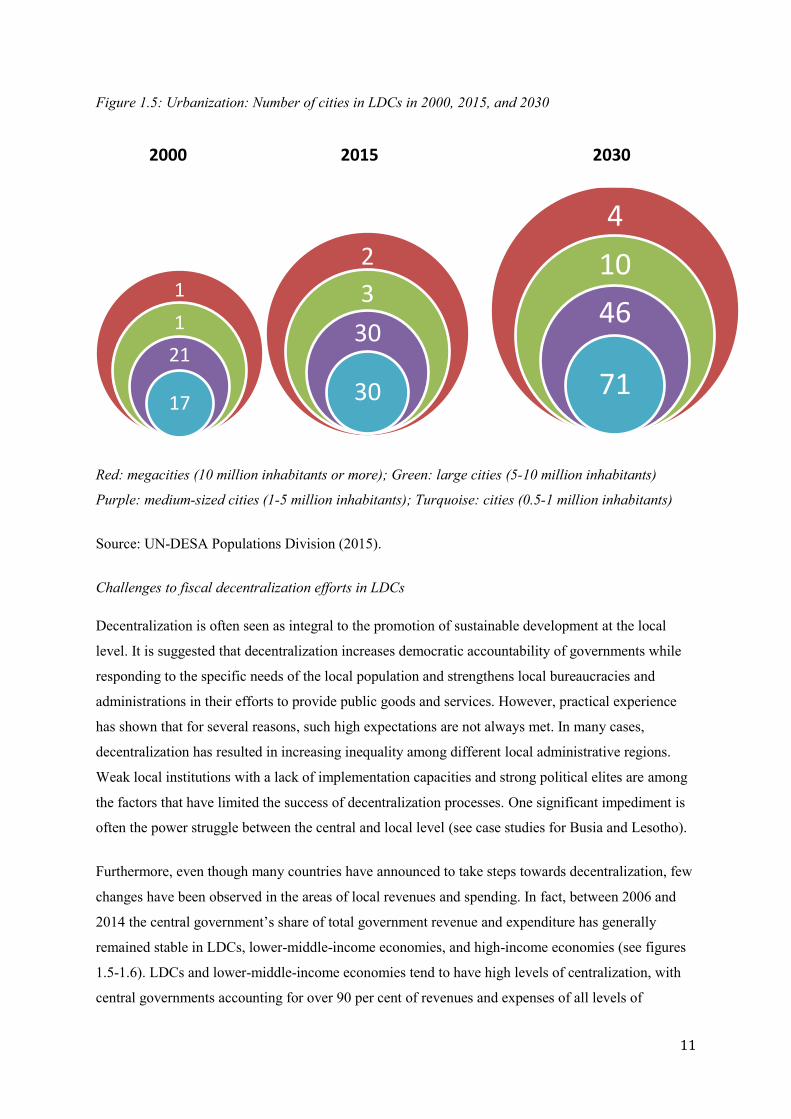
The proportion of the urban population in LDCs is expected to increase from 31 per cent in 2014 to 49
per cent in 2050. LDCs such as the Democratic Republic of the Congo, the United Republic of
Tanzania, and Bangladesh are predicted to increase their urban population by 50 million people each.
While Kinshasa is currently the only megacity (more than 10 million inhabitants) in an African LDC,
Dar es Salaam and Luanda are both expected to surpass the 10 million mark by 2030. Rapid
urbanization affects not only the largest cities, but also smaller cities, in particular those with less than
500,000 inhabitants (Figure 1.4 shows the number of cities in LDCs by size). At the same time, rural-
urban linkages will remain critical in African and Asian countries, since around 44 per cent of the
African population and 33 per cent of the Asian population will still live in rural areas in 2050.
11
4
10
46
71
Figure 1.5: Urbanization: Number of cities in LDCs in 2000, 2015, and 2030
Red: megacities (10 million inhabitants or more); Green: large cities (5-10 million inhabitants)
Purple: medium-sized cities (1-5 million inhabitants); Turquoise: cities (0.5-1 million inhabitants)
Source: UN-DESA Populations Division (2015).
Challenges to fiscal decentralization efforts in LDCs
Decentralization is often seen as integral to the promotion of sustainable development at the local
level. It is suggested that decentralization increases democratic accountability of governments while
responding to the specific needs of the local population and strengthens local bureaucracies and
administrations in their efforts to provide public goods and services. However, practical experience
has shown that for several reasons, such high expectations are not always met. In many cases,
decentralization has resulted in increasing inequality among different local administrative regions.
Weak local institutions with a lack of implementation capacities and strong political elites are among
the factors that have limited the success of decentralization processes. One significant impediment is
often the power struggle between the central and local level (see case studies for Busia and Lesotho).
Furthermore, even though many countries have announced to take steps towards decentralization, few
changes have been observed in the areas of local revenues and spending. In fact, between 2006 and
2014 the central government’s share of total government revenue and expenditure has generally
remained stable in LDCs, lower-middle-income economies, and high-income economies (see figures
1.5-1.6). LDCs and lower-middle-income economies tend to have high levels of centralization, with
central governments accounting for over 90 per cent of revenues and expenses of all levels of
1
1
21
17
2
3
30
30
2000 2015 2030

12
governments, while high-income economies show more advanced fiscal decentralization with ratios
below 70 percent. 2
Figure 1.6: Local revenue as share of central government revenue
Source: IMF Government Finance Statistics Yearbook database
2 These findings build off of those from Dziobek, Mangas, and Kufa (2011), who found that with the exception
of countries transitioning from command to market economies, between 1995 and 2008, the level of decentralization has seen little change regardless of countries’ level of development or population.
2006 2007 2008 2009 2010 2011 2012 2013 2014
Afghanistan (LDC) 99 99 100 99 100 100 99 100
Bhutan (LDC) 100 100 100 100 100 100 100 100 100
Kiribati (LDC) 98 98 99
Timor-Leste (LDC) 100 100 100 100 100
Armenia 97 97 98 97 97 95 96 96
El Salvador 98 96 96 95 95 96 95 90
Honduras 95 99 96 95 95 95 95 98 96
Indonesia 91 89 87
Canada 47 47 46 45 45 44 45 45 46
Germany 66 65 65 66 66 65 65 65 65
Sweden 66 66 63 62 63 67 65 65 65
Switzerland 51 51 54 53 53 54 54 54
United States 57 57 54 55 56 57 57 60 60
0
20
40
60
80
100
120
Re
ven
ue
: Ce
ntr
al G
ove
rnm
en
t as
a s
har
e
of
gen
era
l go
vern
me
nt
reve
nu
es

13
Figure 1.7: Local expenditure as share of central government expenditure
Source: IMF Government Finance Statistics Yearbook database
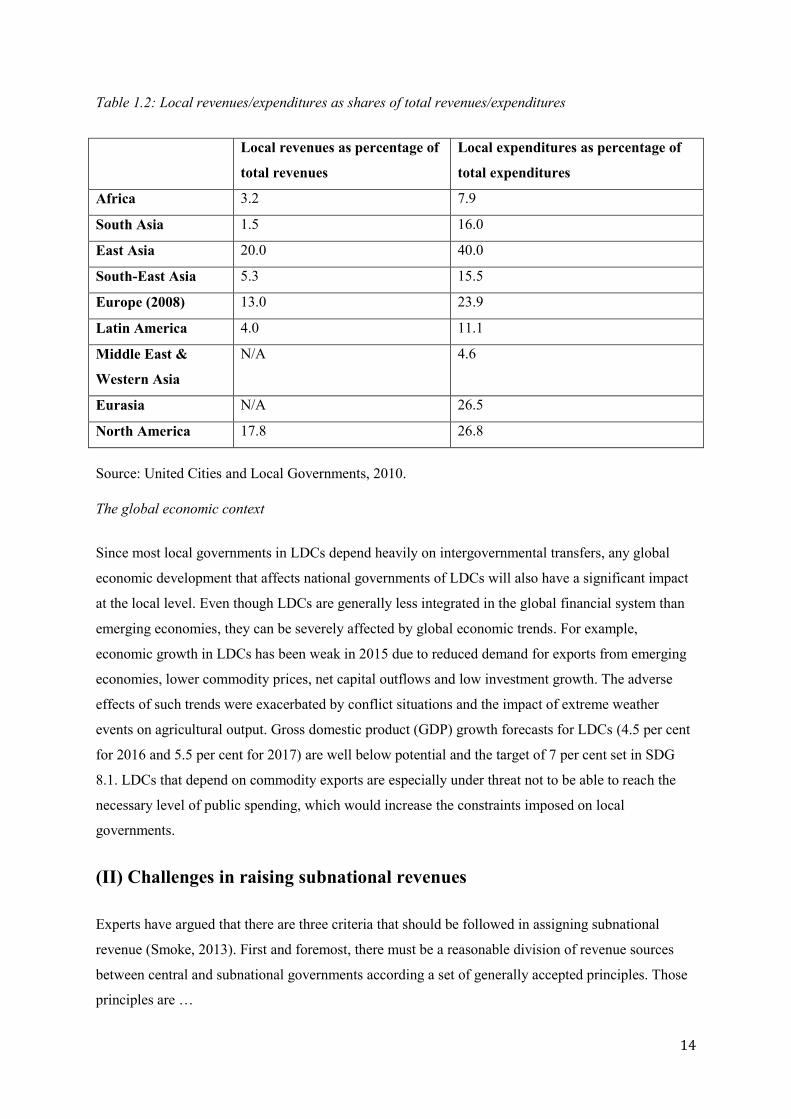
The level of local revenues and expenditures in comparison to total revenues and expenditures also
varies among regions (Table 1.2). In developing regions, countries in Latin America and South-East
Asia show slightly higher rates for local revenues and expenditures as a share of total revenues and
expenditures than Africa.
2006 2007 2008 2009 2010 2011 2012 2013 2014
Afghanistan (LDC) 101 99 100 100 100 100 100 100
Bhutan (LDC) 100 100 100 100 100 100 100 100 100
Kiribati (LDC) 97 97 98
Timor-Leste (LDC) 100 100 100 100 100
Armenia 97 97 98 98 98 96 96 97
El Salvador 102 99 99 99 99 100 99 93
Honduras 99 104 101 99 99 101 101 97 101
Indonesia 103 99 100
Canada 46 46 46 45 45 44 43 43 43
Germany 66 66 65 66 67 65 64 64 64
Sweden 64 64 62 63 64 67 67 67 67
Switzerland 54 58 55 53 54 54 53 53 52
United States 60 60 61 66 67 66 64 64 64
0
20
40
60
80
100
120Ex
pe
nd
itu
re:
Ce
ntr
al G
ove
rnm
en
t as
a s
har
e
of
gen
era
l go
vern
me
nt
exp
en
dit
ure
s
14
Table 1.2: Local revenues/expenditures as shares of total revenues/expenditures
Local revenues as percentage of
total revenues
Local expenditures as percentage of
total expenditures
Africa 3.2 7.9
South Asia 1.5 16.0
East Asia 20.0 40.0
South-East Asia 5.3 15.5
Europe (2008) 13.0 23.9
Latin America 4.0 11.1
Middle East &
Western Asia
N/A 4.6
Eurasia N/A 26.5
North America 17.8 26.8
Source: United Cities and Local Governments, 2010.
The global economic context
Since most local governments in LDCs depend heavily on intergovernmental transfers, any global
economic development that affects national governments of LDCs will also have a significant impact
at the local level. Even though LDCs are generally less integrated in the global financial system than
emerging economies, they can be severely affected by global economic trends. For example,
economic growth in LDCs has been weak in 2015 due to reduced demand for exports from emerging
economies, lower commodity prices, net capital outflows and low investment growth. The adverse
effects of such trends were exacerbated by conflict situations and the impact of extreme weather
events on agricultural output. Gross domestic product (GDP) growth forecasts for LDCs (4.5 per cent
for 2016 and 5.5 per cent for 2017) are well below potential and the target of 7 per cent set in SDG
8.1. LDCs that depend on commodity exports are especially under threat not to be able to reach the
necessary level of public spending, which would increase the constraints imposed on local
governments.
(II) Challenges in raising subnational revenues
Experts have argued that there are three criteria that should be followed in assigning subnational
revenue (Smoke, 2013). First and foremost, there must be a reasonable division of revenue sources
between central and subnational governments according a set of generally accepted principles. Those
principles are …

15
Second, individual revenue sources should be designed to follow a set of principles in a consistent
way (see below). Third, revenue system must be effectively implemented on the ground.
The most common subnational revenue sources in LDCs include user fees and charges, taxes/levies,
as well as intergovernmental transfers, sometimes financed or supplemented by foreign aid.3 These
sources may be supplemented by investment income, property sales, and licenses. User charges and
fees are mostly levied where people pay for the benefits and utilities they receive (e.g. water supply,
sanitation, energy, parking space). At the same time, the municipality typically provides a range of
public goods (police, ambulance, firefighters, streetlights etc.) whose consumption is not exclusive
and whose benefits it cannot directly assign to the individual consumers. In such cases, taxes are the
more appropriate tool as they target the entire community that stands to benefit from the service.
In general, revenue mobilization and management are very challenging in LDCs both at the national
level and subnational levels due to narrow tax bases
Taxation at different levels of government
Inconsistencies in the overall fiscal framework are not uncommon across the globe and they may be
more pronounced in countries with institutional settings, such as LDCs. Inconsistencies may appear in
the form of insufficient harmonization of central and subnational taxes. Limiting overlap with central
taxes and reducing revenue disincentives in transfer and lending mechanisms are important to ensure
that the full set of subnational revenues is consistent with the rest of the national fiscal system.
When it comes to the revenue potential at the local level, evidence suggests that, in general, there is a
positive correlation between the size of the local government (in terms of its population) and the role
of own-source revenues. For example, taxes and other local sources of revenue can account for as
little as 9 per cent of total revenue in small Brazilian municipalities (less than 5000 people) and over
50 per cent in large cities. The fact that larger local entities have more institutional capacity to raise
revenue is not surprising, all other things being equal, but where countries face severe institutional
constraints at all tiers of government, as is the case in most LDCs, the positive correlation may often
not hold. Indeed, in most cities in LDCs, the correlation is less pronounced, with even large cities
struggling with generating more than 10 per cent of their revenues through user fees and taxes (World
Bank, 2006).
3 Many publications on subnational finance list borrowing as a source of income. This paper treats borrowing separately.
Borrowed money is not income unless the loan or debt is forgiven. For example, a debt/income ratio, an important measurement of financial health, does not make sense if income includes debt.

16
The appropriate choice of which taxes to impose, how much to charge, and how to structure them
depends on a wide range of factors such as the size, the level of economic development, and the
demographic composition of the local authority. Across LDCs, one finds a wide array of local taxes at
both at the national and local levels (Table 2.1).
Table 2.1: Taxes assigned to/levied by different levels of selected LDC governments
Country Tier of Government Tax Authority
Burundi National Customs duties, VAT, excise duties, PIT, BPT
Local Vehicle tax, real estate tax
Rwanda National Customs duties, VAT, excise duties, PIT, BPT
Local Property tax, rental income tax, and trading licenses
Mali National Customs duties, VAT, excise duties, PIT, BPT
Local Regional and local development tax, income tax from local
civil servants, Property taxes, other taxes
Tanzania National Customs duties, VAT, excise duties, income tax
Local Development levy, property tax, service levy, business
license, fee on trade, crop and` livestock cess*, other fees
and user charges
Uganda National Customs duties, VAT, excise duties, PIT, BPT
Local Rents, rates, royalties, stamp duties, crop and livestock
cess, fees on registration and licensing and other fees and
taxes that parliament may prescribe (property taxes, license
and user charges)
Afghanistan National Customs duties, withholding tax, business receipts & CIT,
PIT, capital gains tax
Local Vehicle registration tax, toll tax, advertisement tax,
property tax, road tax
Bangladesh National Customs duties, excise duties, supplementary duties, PIT,
CIT, VAT, capital gains tax
Local Tolls, lighting rates, conservancy rates, holding tax, vehicle
tax, animal tax, marriage tax
Bhutan National Customs duties, excise duties, PIT, BIT, CIT, sales tax
Local Property taxes, property transfer tax, land taxes, cattle tax,
grazing tax, advertisement tax
Cambodia National Customs duties, excise duties, VAT, CIT, PIT, stamp duty
Local Property taxes, administrative fees (civil registry

17
functions), user fees and charges, land taxes
Lao PDR National Customs duties, excise duties, VAT, CIT, PIT, stamp duty
Local Property taxes, vehicle taxes, fuel taxes, fees and
administrative charges
Myanmar National Customs duties, excise duties, CIT, PIT, stamp duty,
capital gains tax
Local Property taxes, land taxes, development affairs
organization fees (public services including water, sewage
and trash collection), wheel tax
Nepal National Customs duties, excise duties, CIT, VAT, capital gains tax
Local Property taxes, municipal business tax, municipal tax on
vehicles, local development fee
Timor-Leste National Customs duties, excise duties, CIT, PIT, petroleum tax
Local NA
Yemen National Customs duties, excise duties, PIT, CIT, general sales tax
Local Property taxes, municipal business tax, administrative
service fees
PIT: Personal Income Tax, BPT: Business Profit Tax, VAT: Value Added Tax. * Cess: a tax
introduced in colonial times, often levied on livestock and produce.
Sources: Khadka (2015), Urban Management Centre (2010), World Bank (2015), IMF (2013), IMF
(2010), Huda (2009), Taliercio (2005), Crowe Horwath International (2015), Dickenson-Jones (2015),
Shrestha (2002), Remeo (2015).
Over the years, many attempts have been undertaken to evaluate local revenue sources according to a
set of key principles (Smoke, 2013). Such principles include:
Revenue adequacy: covering subnational budgetary needs (based on the “finance follows
function” principle).
Revenue buoyancy: growing in proportion to the economy and expenditure needs.
Stability: avoiding large fluctuations in revenue yields that would undermine the ability of
subnational governments to provide services.
Correspondence between payments and benefits (including limiting tax exporting).
Distortionary Impact: minimizing distortions of economic decisions made by individuals and
firms (e.g. resulting from differentiated base assessment and rates).
Autonomy and Accountability: allowing subnational governments discretion to make
independent decisions (creating a link between revenue generation and service delivery).

18
Administrative feasibility: ensuring the scale and complexity of administration is consistent
with capacity and affordable to the subnational government.
Political feasibility: maximizing the likelihood of acceptance of a source through consistency
with political reality, e.g. taxpayers see value for money, fair treatment, less visible/onerous
(small payments over time versus large lump sums).
Equity: ensuring fair treatment among equals (horizontal) and across different groups (equals)
framed in terms of income but can use other points of reference.
Table 2.2 illustrates some of the major challenges in adhering to these key principles at the local
level.
Table 2.2: Challenges in implementing principles for subnational taxes in LDCs
Principle Major challenge
Revenue adequacy Determining overall revenue adequacy (including transfers), is not simple since functional assignments from the central government are often vague, inconsistent and may be not fully adopted at the local level. Where functional assignments are clear and local revenues are deemed inadequate, typical challenges that may lead to low local revenues include low intergovernmental transfers, low functional capacity in tax administration and outdated valuation of the tax base as well as a low overall revenue base due to low per capita income and large informal sectors.
Revenue buoyancy Adequate revenue buoyancy is often elusive due to lack of administrative actions needed to ensure growth of the revenue base (e.g., revaluing and indexing property assessments).
Stability Stability requires good administration and a strong commitment to enforce collection during more difficult economic times or periods of political pressure, especially in periods leading up to subnational elections.
Correspondence between payments
and benefits
The correspondence between payments and benefits can be compromised by differential treatment of taxpayers or sectors in pursuit of policy objectives, poorly developed or enforced assessment and collection and tax exporting. i.e., the ability to shift tax burdens to people who live outside the city (although this is not universally opposed and may be to some extent seen as desirable in certain instances, such as taxes that fall primarily on foreign tourists).
Local Autonomy Revenue autonomy varies considerably, but it is often limited by the central
government due to concerns over national fiscal policy management and/or local capacity. At the same time, subnational governments may fall to take advantage of autonomy that is granted because they do not know how to do so where decentralization is new or capacity is weak. Alternatively, disincentives in the fiscal system or political conditions may undermine the
19
motivation of subnational governments to exercise their revenue powers.
Administrative feasibility
Administrative feasibility may be compromised by pursuing non-revenue raising objectives and or adopting poorly defined or unduly complex administrative procedures.
Political Feasibility
Political feasibility is often difficult to determine and effective adoption of subnational taxes may be challenging in developing country environments, especially in the poorest countries where citizens are not used to receiving and/or paying for services.
Equity Horizontal equity is generally a greater concern of subnational tax policy than vertical equity given potential spatial inefficiencies created by subnational redistributive taxation. Equity can be affected, for example, if there is preferential treatment of certain taxpayers or groups due to subnational tax regulations and weak or selective administration.
Source: based on Smoke (2013) and Bird (2010).
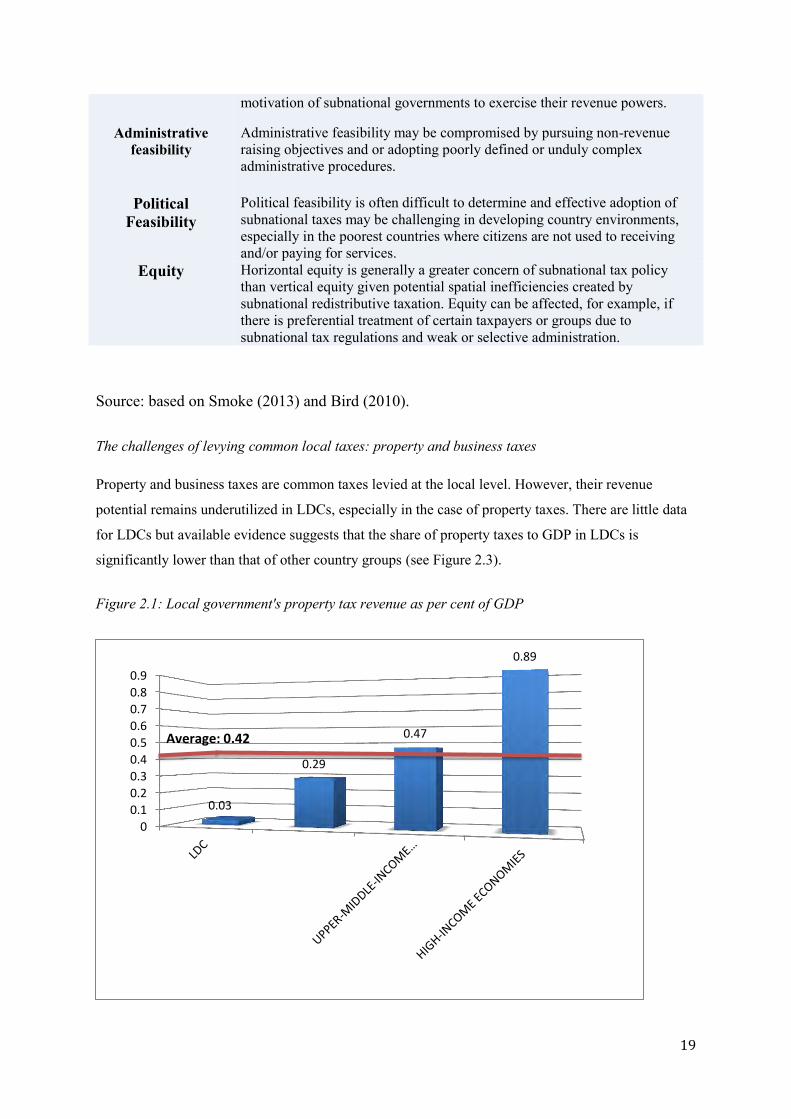
The challenges of levying common local taxes: property and business taxes
Property and business taxes are common taxes levied at the local level. However, their revenue
potential remains underutilized in LDCs, especially in the case of property taxes. There are little data
for LDCs but available evidence suggests that the share of property taxes to GDP in LDCs is
significantly lower than that of other country groups (see Figure 2.3).
Figure 2.1: Local government's property tax revenue as per cent of GDP
0
0.1
0.2
0.3
0.4
0.5
0.6
0.7
0.8
0.9
0.03
0.29
0.47
0.89
Average: 0.42

20
Source: IMF Government Finance Statistics Database, accessed August 2016.
Yet, important progress has been made in a range of LDCs. For example, figure 2.4 suggests the
performance of key taxes in Maputo, the capital of Mozambique, increased significantly between
2010 and 2014. In particular, the “SISA”, a set of tax levied on transfers of real estate, plays a
significant role in Maputo’s local revenue (figure 2.5).
Figure 2.2: Tax and fees coverage in the municipality of Maputo, 2010-2014
Source: Cumbe, 2016.
0
50,000
100,000
150,000
200,000
250,000
2010 2011 2012 2013 2014
Municipal Property Tax
Municipal Personal Tax
Real Estate Transfer Tax
Annual Vehicles Tax
Tax for Economic Activity
Tax for Building permit
Tax for Use of Municipal Land
Municipal Market Taxes
Advertising Taxes
Parking tax
Tax for Collection and treatment ofwasteOther Revenues

21
Figure 2.3: Composition of local tax revenue in the municipality of Maputo (per cent based on
average for 2010-2014)
Source: Cumbe, 2016.
One of the major challenges with levying property taxes in LDCs is the lack of proper titles for
residential premises and tax exemptions for low-value properties. For example, it is estimated that less
than 10 per cent of land in Africa, where most LDCs are located, is properly documented
(Byamugisha, 2013). Moreover, given the lack of suitably qualified staff and resources for local
governments in many LDCs, rising land values are not regularly assessed, leading to substantial
revenue shortfalls as old property values remain on the books. Consequently, where property taxes are
levied, they often do not keep pace with economic development. For this reason, some LDCs in
Africa have refused to establish direct property taxes and instead tax only rental income (Cameroon)
or apply a simplified occupancy tax (Burkina Faso). Property taxes also suffer from broader
challenges that affect other types of national taxes such as low nominal tax rates and low collection
rates.
Where title registration systems and fiscal cadastres (i.e. comprehensive and perpetual inventories that
describe and assess the value of landholdings) are not well developed, ‘street addressing’ (i.e. giving
streets names and/or numbers) is a constructive first step towards determining the tax base and
increasing tax revenues. Street addressing allows locating residents and greatly facilitates municipal
service provision. It also helps enforce the collection of user fees for water and electrical utilities. It is
important to see the building of fiscal cadastres and street addressing as complementary practices.
0.00
5.00
10.00
15.00
20.00

22
Indeed, the reconciling of street indices with fiscal registers can lead to substantial local revenue
increases (Habitat III, 2015).4
A property tax reform approach that places emphasis on updating the property tax roll through
building a fiscal cadastre and improving the accuracy of property valuation is generally referred to as
a “valuation-pushed reform”. Such a reform sometimes assumes that non-valuation administrative
processes are functional and that a major improvement in property tax revenue comes from improving
property valuations (Bird, 2015). Most academic literature, however, favours a “collection- led” to a
“valuation- pushed” reform in low-income and LDC countries (McCluskey 2015). It is argued that in
these countries non-valuation administrative functions are frequently not fully functional, i.e. that
efforts should be placed on improving collection and enforcement of the tax system and ensuring legal
enforcement rather than on valuation. Yet, over the past decades, reforms in LDCs like Sierra Leone
(Freetown), Tanzania (Dar es Salaam), and Uganda (Kampala) have focussed primarily on valuation
(Mc Clusky 2015). Whereas both approaches are essential components of a holistic reform effort, it is
important to find the right balance and appropriate sequencing of reforms (see Lao PDR Case Study
(1), Ethiopia Case Study). While valuation-based reforms may make sense in large cities in LDCs,
their applicability may be more limited in smaller urban and rural jurisdictions with limited local
administrative capacities and no central administrative support. Contrary to the current trend to push
new valuation techniques, many LDCs may therefore think about directing their scarce resources
towards “collection-based reform efforts” first, especially where institutional capacities are weak.
Perspectives on business taxes
In economic theory, business taxes at the local level are often seen as inefficient mechanisms of own
source revenue generation. It is argued that such taxes may discourage business formation, have
adverse effects on growth and investment, and lead to distorted capital allocation. At the same time,
subnational entities may compete in lowering their business taxes in a “race to the bottom” that erodes
the tax base and revenues.
However, there is no solid empirical evidence that business taxes have implications on growth, and in
practice, virtually every country imposes some sort of business tax, either at the national or local
level. Bird (2006) notes there are efficiency, equity, and political arguments that support the case of
the local business tax. The efficiency and equity rationale is captured in the principle of benefit
taxation. If firms receive identifiable, cost-reducing benefits through public sector services, they
should pay for the costs incurred in the provision of such benefits, e.g. wear and tear from large trucks
4 In the context of Sub-Saharan Africa, some non-LDCs like Botswana, Namibia and South Africa have well-developed
property markets. Their experience could help African LDCs in their property market reforms.

23
on a road or waste disposal expenditures. In this connection, business taxes are efficient in that they
ensure that someone pays for the costs related to providing a particular service. At the same time, they
are equitable and fair in that they ensure that firms pay for a service rendered by local authorities and
not just their citizens. In addition, taxing larger domestic and foreign businesses or corporations may
make political sense since negative externalities, such as environmental costs, may outweigh positive
effects, such as local job creation or skills transfers, as is often the case with extractive industries.
Local business taxes are also easier to administer and more elastic than property taxes and are
therefore a crucial source for expanding infrastructure and local services.
Subnational revenue composition in African LDCs
In many LDCs, business taxes are widely used. In West African LDCs, the “patente,” a differentiated
set of fixed tax rates that is based on size of premises, type of business, and number of employees has
made up for a sizable share of local revenues (Figure 2.6). In East Africa, Tanzania levies a local
business tax named ‘City Service Levy’ at a fixed percentage on the firm’s turnover. In the rest of
Anglophone Africa, local business licensing generates between 5 and 30 per cent of local government
own revenues in urban councils (Fjeldstad, and Heggstad, 2012). More research is needed on how
local business taxes should be imposed, structured, and administered in order to maximize their
revenue potential and effectiveness. Such research must also acknowledge that corporate tax evasion
remains a major challenge for imposing local business taxes, especially in the case of transnational
companies that may apply methods such as transfer or trade mispricing to deceit national local tax
authorities.5
5 See Report of the High Level Panel on Illicit Financial Flows from Africa, 2015, commissioned by the AU/ECA Conference of Ministers of Finance, Planning and Economic Development.

24
Figure 2.4: Composition of local tax revenue in West African LDCs (Averages for 1995-2008)
* The global tax (impôt synthétique) is levied on small business and combines taxes on commercial
and industrial profits, business licenses and value added tax.
Source: IMF, 2015.
Box 2.1: Lessons learned from UNCDF‘s efforts to improve local revenue collection in West African LDCs In order to strengthen self-management capacities of the local authorities, especially in rural areas, the United Nations Capital Development Fund (UNCDF) developed the Local Authorities Financial and Institutional Analysis System (LAFIAS). The system was initially introduced in three West African countries, Guinea, Mali and Benin. Initial experiences with the progamme highlight the strong effect of improved local management on revenue raising capacity. The following conclusions are highlighted in the report:
1. A minimum level of organization and capacity of local authorities (own services and personnel) is
essential for local development.
2. A minimum level of information on the potential resources in their territorial jurisdictions is
important for local authorities to play a more important role in mobilizing own source revenues.
3. The local tax system in West African LDCs—Mali is a prime example—includes many rural taxes
that are difficult to mobilize and that yield low revenue in the urban context, while the largest
potential resource -urban property- remains largely untapped. In addition, a simplification of the tax
code and flat-rate taxation could be explored to further strengthen revenue collection.
4. Quality beats quantity. It is important that levies/taxes not be too numerous and dispersed to avoid
high transaction costs.

25
5. Great resource potential lies in market activities and facilities (markets, terminals and other
income-generating infrastructures). A proper management of these facilities will allow the authorities
to diversify and considerably improve their resources.
6. The existence of economic infrastructures is a determining factor in resource potential and
consequently, the revenue of local authorities. For example, a lack of economic infrastructure explains
the challenges of the Socoura commune, which has the largest population size in the standard
communes in Mali, but has the lowest level of local revenue.
7. The LAFIAS analyses showed the limitations of a true economic development within the rural
spaces that make up the local authorities. Creating inter-community cooperation between local
authorities based on “development hubs” or “local cooperation territories” can help take advantage of
the socio-cultural, geographical, historical and economic opportunities that two or several local
authorities share together.
8. Finally, investment per se cannot stimulate improvement in local finances; it must be supplemented
by taxation support measures, but also communal management and local governance.
Source: UNCDF (2012).
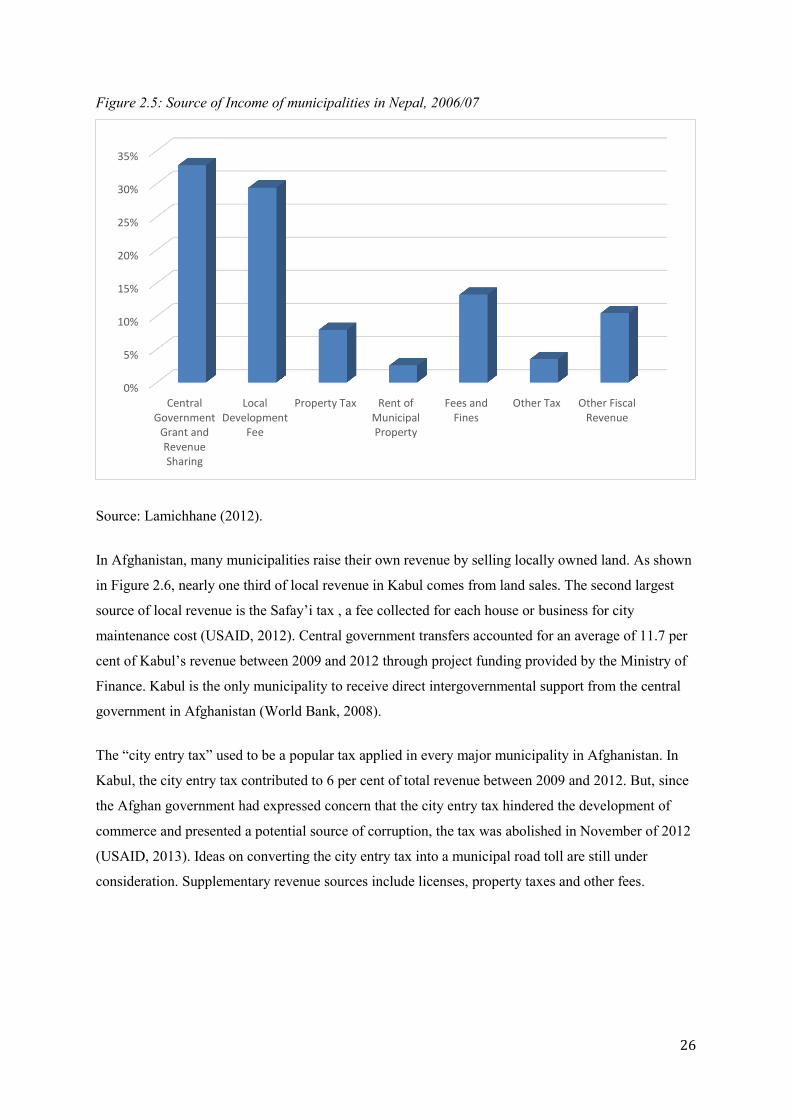
Examples of subnational revenue composition in Asian LDCs
As shown in Figure 2.5, one third of municipal income in Nepal comes from central government
grants and revenue sharing. The second largest source of municipal income in Nepal is the Local
Development Fee, which is being collected by the central government at the rate of 1 per cent on
certain imported goods (Lamichhane, 2012).
26
Figure 2.5: Source of Income of municipalities in Nepal, 2006/07
Source: Lamichhane (2012).
In Afghanistan, many municipalities raise their own revenue by selling locally owned land. As shown
in Figure 2.6, nearly one third of local revenue in Kabul comes from land sales. The second largest
source of local revenue is the Safay’i tax , a fee collected for each house or business for city
maintenance cost (USAID, 2012). Central government transfers accounted for an average of 11.7 per
cent of Kabul’s revenue between 2009 and 2012 through project funding provided by the Ministry of
Finance. Kabul is the only municipality to receive direct intergovernmental support from the central
government in Afghanistan (World Bank, 2008).
The “city entry tax” used to be a popular tax applied in every major municipality in Afghanistan. In
Kabul, the city entry tax contributed to 6 per cent of total revenue between 2009 and 2012. But, since
the Afghan government had expressed concern that the city entry tax hindered the development of
commerce and presented a potential source of corruption, the tax was abolished in November of 2012
(USAID, 2013). Ideas on converting the city entry tax into a municipal road toll are still under
consideration. Supplementary revenue sources include licenses, property taxes and other fees.
0%
5%
10%
15%
20%
25%
30%
35%
CentralGovernment
Grant andRevenueSharing
LocalDevelopment
Fee
Property Tax Rent ofMunicipalProperty
Fees andFines
Other Tax Other FiscalRevenue

27
Figure 2.6: Kabul Municipality Revenue *by Revenue Source (Averages for 2009-2012)
*Licenses include business license and vehicle license fees; Fees include market & parking fees and
construction fees
Source: USAID (2013).
Introduction of user charges, fees and licenses
User charges and fees comprise service charges (water, sewerage and parking), administrative fees
(building permits, registration) and business license fees. User charges are typically defined per unit
of consumption. They can promote an optimal level of consumption when the price equals the cost of
providing an additional unit of the service, which also referred to as marginal cost pricing. Some have
therefore argued that, “(whenever) possible, local public services should be charged for rather than
given away” (Bird 2001). However, getting prices right is easier said than done where the
infrastructure and capacity to set prices, measure usage, and collect fees are heavily constrained and
where many users live in abject poverty. Consequently, in a number of LDCs, user charges are
frequently set below costs, infrequently revised, and often inefficiently billed.
When setting their tariff structures, local governments typically try to take social justice concerns into
consideration and facilitate access to low-income households. Cross-subsidies, where richer segments
of the population subsidize access to services for the poor, have shown success in some countries.
0%
5%
10%
15%
20%
25%
30%
35%

28
One popular mechanism for cross-subsidies is a pricing system, whereby the per unit price of
consuming a municipal service, e.g. electricity, increases as more of it is consumed and may even be
free up to a designated level. Cross-subsidies are also possible between sectors. For example, cross-
subsidies are frequently used to reduce or eliminate user charges for health services, since these tend
to have a particular detrimental effect on the poor (Lagarde and Palmer, 2008). The elimination of
user charges for health services has led to significantly higher health system utilization rates. While
greater health care is likely to pay large dividends in the future, including through greater tax
revenues, the challenge for local governments is to replenish the lost revenue in the short and
medium-term through instruments like sectoral cross-subsidies, additional taxes or donor
contributions.
Whereas economic theory suggests that marginal cost pricing is the most efficient pricing method, it
works only in perfect market conditions where providers have complete information on the cost of the
product, as well as the opportunity cost. More practical methods include average cost pricing, where
expenditures required for providing a service are divided by the number of consumers or the volume
sold and average incremental pricing, which calculates how much it would cost to serve an additional
consumer based on the average cost price. There are also multipart tariffs, similar to those discussed
earlier, which include fixed charges for basic consumption and higher charges for greater
consumption and thus effectively cross-subsidize the consumption of low-income customers. Where a
clear pricing strategy is applied, average cost and multi-tariff bundling are more widespread than
marginal cost pricing, since these are easier to calculate and administer (World Bank, 2014).
The important role of intergovernmental transfers
There are no subnational governments in the world that can fully function without a certain level of
intergovernmental support. In practice, finance often does not follow function, and central
governments across the globe give local authorities more expenditure responsibilities than those can
finance from their own revenue sources. Generally, greater capacity to generate their own revenues
make subnational governments in developed countries less dependent on support from higher tiers of
governments than those in developing countries. Consequently, resource flows from higher to lower
tiers of governments average 70-72 per cent of local government funding in developing countries and
38-39 per cent in developed countries (Alam, 2014).
The traditional rationale for intergovernmental transfers is the objective for a welfare maximizing
government to reallocate resources between richer and poorer jurisdictions in order to reduce both
horizontal (same tiers of government) and vertical (different tiers of government) imbalances, and to
correct for externalities. The actual drivers for intergovernmental transfers can vary, however. Public
finance literature explores factors that are shaped by equity and efficiency considerations such as the

29
correction for vertical and horizontal imbalances. Public choice theory highlights how transfers can
become tools for political influence. Frequently, electoral concerns determine the distribution of fiscal
resources to local jurisdictions (Boex and Martinez-Vazquez, 2005). Political economy research
focuses on how intergovernmental transfers are shaped by political influence through the impact and
bargaining power of political interest groups. There is robust empirical evidence that local
governments with higher political representation per capita benefit from greater intergovernmental
transfers (Wright, 1974, Porto and Sanguinetti, 2001, Khemani, 2007, Caldeira, 2011).
The impact of intergovernmental transfers on local revenue generation remains under debate. Some
have argued that large unconditional intergovernmental grants lead to lump-sum tax reductions or
lower the incentives for local governments to collect fees and taxes, thus ‘crowding out’ own source
revenue mobilization. Others argue that most fiscal transfers are spent on the provision of public
goods and services, increasing local economic development and tax compliance, and consequently,
‘crowd in’ local tax revenues. Studies that highlight the crowding out effect mostly focus on more
developed countries with relatively well-developed fiscal systems and significant own source revenue
generation (Kalb, 2010; Zhuravskaya, 2000).
However, such capacity is highly constrained in most LDCs. In cases where local capacity to generate
own-source revenue is weak, intergovernmental transfers are a crucial lifeline and may further crowd
in local revenue generation. For example, evidence suggests that in Tanzania, a 1 per cent increase in
intergovernmental transfers leads to an extra 0.3-0.6 per cent increase in own source revenue
generation for local government authorities (LGAs) (Masaki, 2015). Moreover, intergovernmental
transfers are often the only regular source of local income for reasons of political interference in own
source revenue generation. In many LDCs, local governments are frequently dependent on central
government approval for taxes, fees and charges they wish to impose. In certain cases, local
governments may wait for years or even decades to get such approvals (see Lesotho Case Study).
Smoke (2015) argues that intergovernmental transfers make sense as part of smart division of
responsibilities between the central and local government based on their core advantages and
competencies. In this connection, the author highlights that “central governments have inherent
advantages in generating revenues and local and regional governments have inherent advantages in
providing certain key services, invariably necessitating intergovernmental transfers.” At the same
time, LRGs must be able to raise an adequate share of the resources to (i) reduce demands on central
budgets, (ii) create a fiscal linkage between benefits of local services and the costs of providing them,
and (iii) help repay loans on long-term capital investments (Smoke, 2015).

30
Intergovernmental transfers in LDCs
Figure 2.7 illustrates widely divergent sizes of intergovernmental transfers in LDCs, in particular in
Francophone and Anglophone Africa. Most Anglophone LDCs receive the majority of their income
through intergovernmental transfers. In Francophone and some other LDCs, the share of total local
resources to total public resources reveals some of the lowest ratios in the world (IMF, 2015).
Francophone countries tend to rely more on local taxes. However, those taxes are often set, collected
and disbursed by the central government, i.e. they are not “true” local taxes. The low levels of
transfers may also be the result of sectoral policies of the central governments that leave little
resources for local authorities, thus limiting resources and functions of local authorities and
compromising the decentralization process (UCLG, 2009).
Figure 2.7: Intergovernmental transfers in per cent of total local revenues in selected LDCs
Source: IMF Government Finance Statistics Database, accessed August 2016.
Yet, both groups of countries face enormous challenges in meeting their local expenditure, as
transfers are often neither adequate nor reliable and low central government support is not met with
adequate increases in local revenue generation. For example, in the case of Senegal, revenues at the
local level have increased over recent years but remain at a mere 6 per cent of the central tax
revenues. As a result, local resources remain insufficient to provide local basic public services.
Moreover, horizontal fiscal imbalances have become a problem: the resources of the ten poorest
0
20
40
60
80
100
Grey: Non-African LDCs Red: Francophone African LDCs Blue: Anglophone African LDCs

31
communes represent 1 per cent of the resources of the five richest ones (Caldeira, 2011)6. In Mali,
local taxes generate insufficient revenue and rely on a wide range of obsolete taxes that are
particularly difficult to collect.
The fact that LDCs with widely different transfer/total revenue ratios continue to face similar
development challenges at the local levels suggests that the share of central government transfers in
local revenues says little about the local authority’s capacity to generate sufficient own source
revenue. Whether the major source of subnational income comes from intergovernmental transfers or
local taxes does not matter if the total income is grossly inadequate. People will bear the
consequences in terms of poor quality and access of local service delivery. Cutting intergovernmental
transfer does not make sense where own-source revenue generation cannot fill the gap. To make
matters more complicated, international financial institutions, especially those that focus more on
overall macroeconomic stability than development, have frequently put pressure on LDCs to reduce
intergovernmental transfers in an effort to reduce central government deficits. Such a recommendation
must be weighed carefully against the adverse effects of lower transfers on access and quality of basic
services, especially where the capacity for own source revenue generation is low.
Surcharges as a complement to intergovernmental transfers
Surcharges are a form of subnational “piggybacking” on national or regional taxes, like income taxes.
For local surcharges, a higher level of government defines the tax base, collects both the tax and the
surcharge set by subnational governments, and remits the surcharge revenue to the local government.
While the national government collects the tax, surcharges are clearly local taxes in that local
governments are responsible for imposing the tax and spending the revenues.
This approach avoids the problems that occur when subnational jurisdictions define their tax base in
conflicting ways, use different apportionment formulas, and administer the tax in different ways. For
example, two local authorities may try to impose taxes on the same company since there are different
opinions as to where and in which subnational jurisdiction the firm operates. In such a case, it is more
practical for higher levels of governments to define the tax base and forward a share of the revenues
to the local authorities. However, surcharges are not a substitute for, but rather a complement to
intergovernmental transfers, since they do not provide for vertical or horizontal redistribution among
subnational jurisdictions. Looking ahead, more data and research is needed on how and to which
extent local surcharges are used effectively in LDCs.
6 Senegal is divided into eleven regions (règions) which are subdivided into 67 communes, 43 communes d’ arrondisements
which are further divided into 320 communautès Rurales (Caldeira, 2011).

32
The formulation of the most welfare-enhancing combination of local and central governments taxes is
a politically difficult balancing act. Another key challenge for central governments is to provide
incentives to local governments to collect all the taxes they are supposed to collect. While some
central government fund transfers have been linked to a reform agenda, there has been little
improvement in own source revenue collection in most cities (Habitat III, 2015). Frequently, politics
get in the way of empowering local governments to raise their own revenues (See Lesotho Case
Study).

33
(III) LDC experiences in improving municipal revenue generation
Lao PDR (1): Land titling as a road to better property taxation
Policy Lesson: Land titling initiatives must be accompanied by strong and transparent government
institutions in order to play a role in improving subnational revenue.
In 1975, the rise of the socialist government following a prolonged civil war meant that all land in
Laos became the property of the state. Despite this, land use rights became informally recognized over
time, and the government developed a system of administering and recording property transactions.
The decision in 1986 to turn towards market-oriented reforms in this sector was driven by the lack of
clear property rights and information as well as the fact that the majority of property transactions
occurred outside the purview of the government. In 1996, Laos’s national government, with donor
support, began a land titling project to provide a system of clear and enforceable land-use ownership
rights and developing a land valuation capacity. The project also supported national and provincial
governments in systematic land registration through mapping, computerization of land records,
development of a land registration system, and extensive training of government officials in the
process of land titling. It originally covered the Vientiane capital as well as urban and semi-urban
areas in four provinces, with four additional provinces added later. A second Land Titling Project,
also with donor support, built upon the first with efforts to further develop land policy and regulatory
framework, educate government officials, institute a land registration system, and accelerate land
titling through systematic registration. It also broadened the scope to all provinces of the country.
The first project resulted in the Law on Land of 1997, which formally established regulations for land
registration and administration. It also led to the registration of roughly 190,000 parcels of land,
which came at a time when registration was rare but fell significantly short of the original goal of
300,000. Efforts were hampered by initial shortages of government staff, technical issues, lack of
incentives for government officials, and lack of government funds. The nominal figures found in the
World Bank Implementation Completion and Results Report (ICR) suggest there was a remarkable
1087 per cent increase in government revenue from land taxes and land-related fees between fiscal
years 1995/1996 and 2004/2005; however, Laos’s high inflation over the period means that the real
gain in revenue was only 1.6 per cent over the entire nine year period and that land-based revenue
shrunk from .20 per cent of GDP to .14 per cent of GDP. The second project exceeded projections and
led to titling of approximately 382,000 parcels of land. It also coincided with an 86 per cent rise in
real land-related government revenue (FY 2002/2003-2008/2009); however, the rise was related
primarily to increases in land value determined to be unrelated to titling, and the project design did
not collect sufficient data to discern how much of an impact land titling had on government revenue.
Moreover, the revenue gains did not aid village and district revenue as much as they could have.
34
Anywhere between 4 and 60 per cent of the revenue stayed at the village level, of which 60 per cent
was used to pay the tax collector’s salary and 40 per cent is used to cover administrative expenditures.
At the district level, the money was used “mainly to pay for recurrent expenditures, including salary
and operational costs,” rather than service delivery or infrastructure projects. One issue is that Laos’s
government did not implement reforms or allocate special funding towards land administration and
tax collection, nor did donors successfully train government officials in these areas. Another is that
land registration fees varied wildly both between and within provinces, and they were not always
clearly stated, which called into question the integrity of the offices responsible for collecting them
and promoted informal transactions. Because the government of Laos did not commit to a long-term
land administration programme or allocate an adequate budget, the projects were donor-dependent
throughout their implementation, and with the withdrawal of donors in 2009, project sustainability has
come into serious doubt. Moreover, Laos has long struggled with transparency regarding land rights,
which severely limits the efficacy of land titles; there are even concerns that some land holders have
not received proper compensation when their land was expropriated by the government. There is no
evidence that either project led to a better regulatory framework or better enforcement of land rights,
or had discernible impacts on land values, local ability to borrow, or the frequency of land disputes.
A number of policy lessons emerge: For a land titling project to successfully impact government
revenues from land and property, government, from the local to national level, must first respect the
integrity of land rights, use eminent domain rationally and responsibly, and have clear legal and
regulatory systems in place to promptly settle disputes. Additionally, a government must commit to a
long-term programme of land administration and set up a transparent and well-funded body to ensure
sustainable impacts. Fees and taxes should be clear and uniform, and all concerned levels of
government should be mindful of administrative costs and have a plan to translate enhanced revenues
into better service and infrastructure delivery. Land titling must be introduced with broader policy and
regulatory reforms if it is to have any teeth. Lastly, in order to judge the impacts of a land titling
project, land values alone will not suffice; rather, a baseline survey, comparisons between titled and
untitled land, and data on the number of registered land transactions is necessary to determine whether
and how much titling matters. Land titling is a powerful tool for property/land tax efficacy, but it must
be treated as only one piece of the puzzle.
Sources: World Bank (2006. 2010a,b, 2016a,c)

35
Mozambique (1): Facilitating intergovernmental transfers through implementation of a treasury single account
Policy Lesson: Unifying public revenue and expenditure data through an electronic system can help
build trust with international donors and facilitate state-to-local government revenue transfers.
Over the past 18 years, Mozambique has embarked on a country-wide effort towards municipalisation
in order to bring the decision-making process for many government functions closer to the people
affected. When Mozambique began the process in 1998, 33 municipalities were established,
expanding to 53 in 2013. In Mozambique, municipalities are locally elected bodies that govern their
electorate directly and whose responsibilities generally include things such as service infrastructure,
public parks, public hospitals, and local roads. Mozambique has also strengthened and expanded its
use of districts governments, which are appointed by the federal government and responsible for
implementing federal policies at a more localized level.
One of the main challenges for Mozambique’s municipalities since decentralization has been trying to
match new revenue to new responsibilities, as the two often do not come hand in hand. Under current
law, municipalities are expected to make own-source revenue two thirds of their total, but most
struggle with poor revenue generation due to a lack of human, material, and financial resources as
well as poor tax implementation. The result is a lack of implementation capacity for basic services
including water, sanitation, electricity, roads, and housing; 45.5 per cent of urban residents lack access
to electricity, and 57.6 per cent lack access to improved sanitation. While there are laws on the books
for municipal taxes, the implementation of these laws is typically limited and haphazard. Municipal
property taxes and real estate transaction taxes in Mozambique are supposed to align with the current
market value of a given property, but property values for the most part have not been updated since
the colonial era (pre-1975), which means that many properties end up undervalued. Municipalities
own all land within their borders, which allows them to sell licenses for any land targeted for new
development, but this system is typically not coupled with a property tax registry, so often
municipalities receive a one-time windfall but not sustainable revenue. The last major potential
revenue source, the economic activity tax, is supposed to track commercial and industrial production
but instead is administered at a set rate by area, which limits its effectiveness.
With these limitations in place, most municipalities have failed to improve service delivery and many
refuse new responsibilities, knowing that they are often more of a burden than an opportunity. The
federal government’s response has been to put into place enhanced systems of government transfers
and accountability. It has established the Municipal Compensation Fund, which is a provision in the
federal budget that designates a minimum of 1.5 per cent of fiscal revenue for non-conditional use by
cities, as well as the Investment Fund for Municipal Initiative, which designates another 0.75 per cent

36
of federal fiscal revenue for conditional use, taking into account municipalities’ infrastructure needs
and justifications for funding requests. One of the main drivers behind the federal government’s push
for fiscal decentralization has been the implementation of a treasury single account (TSA) known as
e-SISTAFE, a unified electronic system that tracks the allocation, management, and spending of
government funds across all levels, from the ministry of finance down to municipal governments. The
legislation authorizing the development of e-SISTAFE was in part the result urgings by international
donors in 2002, and its implementation was aided by the IMF. It was fully implemented across all
levels of government in 2007. E-SISTAFE allows government (and international) officials to better
track where money is sent, helps budgets better align with regulations, and makes local governments
more accountable for the money they receive. This has helped make federal legislators and officials
more comfortable with the idea of increasing government transfers to local governments. State-to-
local government transfers went up from $23.4 million (1.17 billion Meticais) in 2010 to $60 million
(3.13 billion Meticais) in 2015. At the same time, much of the funding for federal initiatives has been
delegated to the district level. Between 2007 and 2016, district fiscal capacity increased from just 3
per cent of the total central government budget to 17 percent. Moreover, the transparency e-SISTAFE
provides has increased the willingness of international donor agencies to provide general budget
support to Mozambique’s government, rather than sector-specific or project-specific funding.
However, while it has helped improve the flow of government transfers, e-SISTAFE has not
addressed the other part of the revenue equation, local revenue generation. There is no such system to
track things like property valuations, commercial revenues, and land license fees; local own-source
revenues remain anemic. As a result, municipalities’ implementation capacities remain limited, access
to basic infrastructure has not significantly improved, citizens are frustrated, and they are not on a
path towards self-sustainability. E-SISTAFE is an example of how a treasury single account can play
a key role in decentralization efforts.
Sources: Pattanayak, Sailendra and Israel Fainboim(2010); World Bank, 2016c ; Dabán and Pesoa
(2007).
Ethiopia: Implementing a land value capture system during rapid urbanization
Policy Lesson: Land value capture systems differ among LDCs depending on the legal context, as
well as socio-economic and regulatory environment. Land value capture can provide additional
resources for local capital investments, but their implementation requires significant administrative
capacity. The tying of land value reform to the introduction and systematization of property taxes
would significantly increase the revenue potential of locally owned properties.
As of 2015, just 17.4 per cent of Ethiopia’s 86.6 million people live in urban areas, but this is rising
quickly and projected to reach 30 per cent by 2030. Urban governments in Ethiopia were first formed

37
in 1991 after decades of centralized rule. Ethiopia’s capital, Addis Ababa, and its second largest city,
Dire Dawa, were granted Charter City status at the time of decentralization, which places them
directly below the federal government and at the same level as the country’s nine regions, under
which the country’s other cities operate. An unusual feature of Ethiopian cities is that they possess
ownership of all land within their boundaries. The roots of this system trace back to 1974 with the rise
of the Derg, a Soviet-backed communist military dictatorship that placed all land in the hands of the
state; despite the Derg’s fall and political changes in the ensuing decades, land remained state
property and was delegated to city governments (where applicable) as part of the 1991
decentralization efforts.
This led to a land value capture system by which city governments either auction land leases off to
whoever makes the best offer or allocates the land at limited or no cost for institutions such as
government agencies, religious institutions, or certain manufacturing industries. Leases vary from 99
years for uses such as residential development to 5 years for short-term commercial use, and while the
land itself is leased, whatever is built on it is the property of the lessee. Federal law dictates that 90
per cent of lease revenue goes towards a general city fund for infrastructure and low-cost housing
developments. The most robust example of this system in action comes from Addis Ababa, whose 3.8
per cent growth rate makes it one of the fastest growing cities in the world and has tasked it with
rapidly expanding road, water, sanitation, and electrical infrastructure. All land targeted for
redevelopment in the Ethiopian capital goes through the auction or allocation process, which is used
both to raise revenue and to control the nature and pace of urban development.
However, despite the magnitude of this undertaking, revenues from land value capture represent just
six per cent of Addis Ababa’s revenue and nine per cent of infrastructure finance. Most of Addis
Ababa’s revenue comes from its tax sharing agreement with the federal government, which allowed it
to increase revenues from $50 million in 2003 to over $900 million in 2014. This money comes
primarily from VAT, income tax, and a tax on enterprises. The city spends 61 per cent of its revenue
on capital projects, but its infrastructure still cannot keep pace with the rapid pace of urbanization; in
2008, 80 per cent of the city’s settlements were considered slums by UN Habitat.
The lease system in Addis Ababa has helped it dramatically expand infrastructure, though it still has
not been able to keep up with demand. Water and electricity are available in almost the entire city but
are plagued by regular outages. Other services such as public transport and waste management are
also reaching more people but not keeping up with population gain. A major challenge is the lengthy
process the city government in Addis Ababa has to follow in preparing land for lease. Federal law
dictates that in order for land to be auctioned or allocated, the city first must negotiate with and
remove any existing users (typically farmers), pay them on the value of whatever property was there

38
before, and fully supply service infrastructure. These strict conditions together with low
implementation capacity caused by a lack of qualified government workers severely slows down the
process by which land comes to market in a city whose population and economy are expanding at a
breakneck pace. As a result, there is a very limited supply of land available for auction at any given
time, which inhibits private development and inflates the cost of any land that is available. This is part
of the reason that cooperatives represent just seven per cent of new residential construction and
private development just three percent. The other 90 per cent of residential development in recent
years has come in the form of public housing, though that too is hampered by the prerequisite of clear
and serviced land; as of 2015, over 900,000 households were on a waiting list to receive public
housing. With such a slow rate of land turnover and a dearth of private developers, Addis Ababa’s
growth potential is not being met. Most experts in the area agree that it is the implementation
challenge, rather than a lack of revenue, that represents the chokepoint in this expanding city.
However, it is still worth noting that systemized leasing has not given rise to systematized property
taxes; their sporadic enforcement means that the government captures very little value from existing
properties. This is not a particularly big issue now, but it could prove painful if the demand for new
development slows down at any point in the coming years. Despite these issues, the land value
capture system in place in Ethiopia is remarkable for being formal, systematized, and important to
municipal revenue. It has also helped produce tangible infrastructure improvements. Its potential for
improvement depends on the government’s ability to adapt is regulations and administration to better
deal with unrelenting urbanization.
Source: UK Aid and the African Centre for Cities, 2015.
Uganda (1): The role of grants and intergovernmental transfers in a second-tier city – perspectives from Busia Municipal Council
Policy lesson: Intergovernmental transfers and donor support could be more effective if they were less rigid, better timed, and designed in line with local needs and priorities.
Busia Municipal Council is one of the youngest of Uganda’s 22 municipal councils. It is located
200km east of the Ugandan capital city Kampala, and its population is about 100,000. The council
receives intergovernmental transfers from the central government on a quarterly basis. Conditional
transfers target road maintenance, health expenditures, school facilities, and other interest groups.
Unconditional transfers facilitate council sittings, garbage management, servicing of equipment's and
vehicles, and office management. Intergovernmental transfers are complemented by own-source
revenues that come from trading licenses, tendered out revenue sources of markets and transport
terminals, property taxes, local service taxes, hotel taxes, land registration tax, and building plan
approval fees. The Council also receives limited direct donor support for youth development and
traditional city functions like garbage disposal.
39
As a recipient of intergovernmental transfers and donor assistance, Busia has encountered a variety of
challenges. First and foremost, conditional intergovernmental transfers, which constitute about 85 per
cent of all local funds, are too low and only cover a small portion of the funds needed for wages and
salaries as well as service deliveries, which are particularly underfunded. Second, transfers are too
rigid as they do not allow municipalities to reallocate funds to new and emerging local priorities. Only
if the Council gets permission from specific line ministries can funds be reallocated for new purposes
and such permission involves a lengthy bureaucratic process. Another challenge is represented by the
delayed release of the funds. Frequently, transfers are only received one month before the close of the
financial year, and as a result, a significant portion of them is returned. As regards donor funds, most
donors support project lacks local government involvement at the design stage which can lead to
project failure and abandonment later. Moreover, there is also a tendency to impose projects on local
authorities that are not necessarily perceived as top priorities. To overcome these challenges, the
Council has recommended the following actions to the Ugandan Government and interested donors:
Conditional grants should be flexible and be allowed to adjust to local priorities and realities, the
general budget allocation for local governments should increase from 12 per cent to 30 per cent of the
national budget and funds should be released in a timely fashion, and donors should fully involve all
stakeholders at the project design stage.
Source: Municipal Council, Busia.
Lesotho: Local governments and revenue generation in Lesotho-Legally empowered but politically constrained
Policy lesson: Even where municipalities are legally empowered to raise revenues and borrow, political inertia can stand in the way of effective fiscal decentralization.
Lesotho is divided into ten districts, which are further subdivided into constituencies that consist of
64 local community councils and 11 urban councils. The prime agencies for collecting local revenues
at the district level are community and urban councils. The Lesotho Local Government Act (1997)
legally empowers councils to raise own revenues. Such revenues include taxes, rates and charges,
licenses and permits, fines and penalties, property taxes, and other commercial income generated from
the sale of district councils’ assets including natural resources. The law provides that “the Minister
shall publish in a gazette a list of items from which councils may collect revenues by way of tax or
levy of charge.” However, up until November 2015, the ministry did not publish such information.
Consequently, district councils have had no own source of revenue, which remains a major source of
frustration. The councils only act as collection agents for the central government. If a new source of
revenue is identified, the local authority is obliged to notify the central government, which will
provide guidance on the rates and their application. The role of the councils is limited to recording
and reporting revenue receipts and to remitting local revenues to the central government. According to
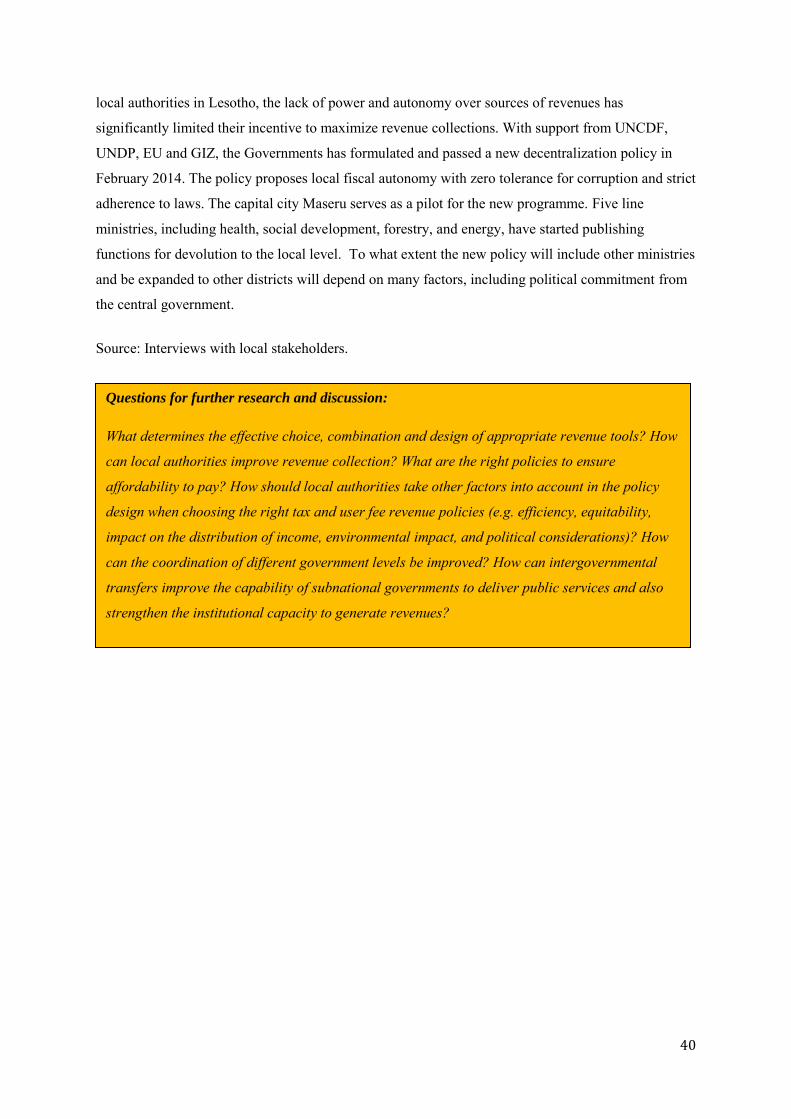
40
local authorities in Lesotho, the lack of power and autonomy over sources of revenues has
significantly limited their incentive to maximize revenue collections. With support from UNCDF,
UNDP, EU and GIZ, the Governments has formulated and passed a new decentralization policy in
February 2014. The policy proposes local fiscal autonomy with zero tolerance for corruption and strict
adherence to laws. The capital city Maseru serves as a pilot for the new programme. Five line
ministries, including health, social development, forestry, and energy, have started publishing
functions for devolution to the local level. To what extent the new policy will include other ministries
and be expanded to other districts will depend on many factors, including political commitment from
the central government.
Source: Interviews with local stakeholders.
Questions for further research and discussion:
What determines the effective choice, combination and design of appropriate revenue tools? How
can local authorities improve revenue collection? What are the right policies to ensure
affordability to pay? How should local authorities take other factors into account in the policy
design when choosing the right tax and user fee revenue policies (e.g. efficiency, equitability,
impact on the distribution of income, environmental impact, and political considerations)? How
can the coordination of different government levels be improved? How can intergovernmental
transfers improve the capability of subnational governments to deliver public services and also
strengthen the institutional capacity to generate revenues?
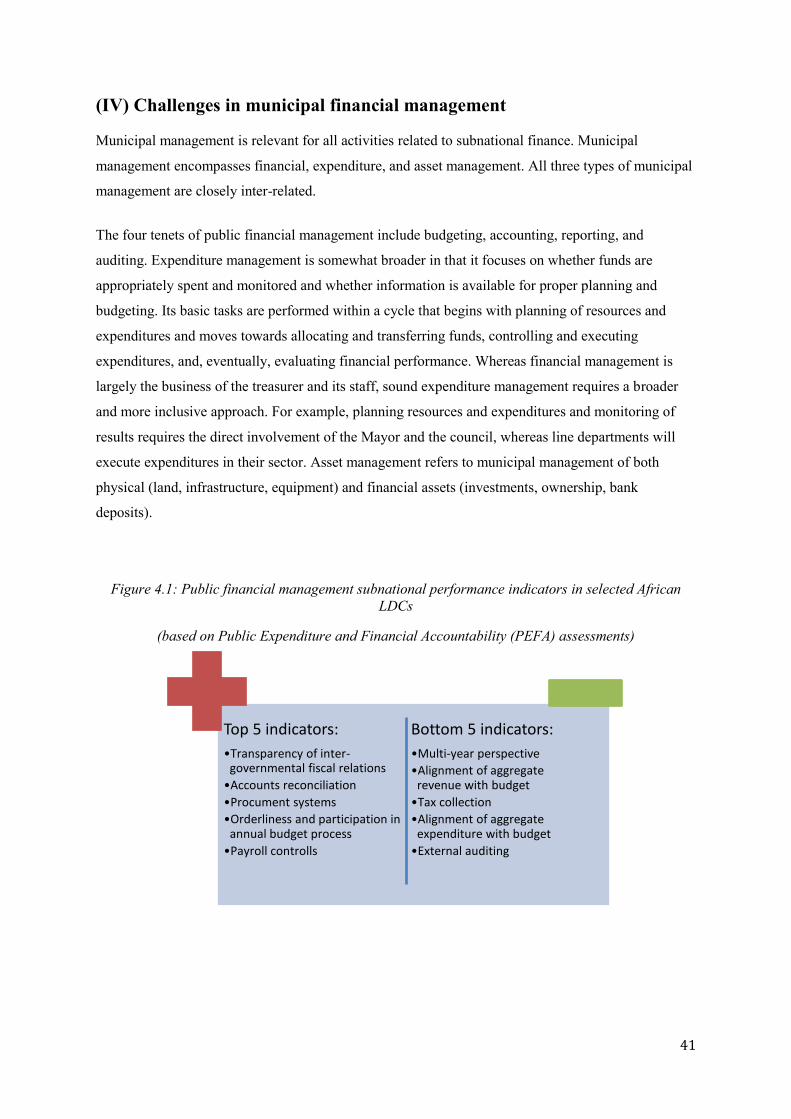
41
(IV) Challenges in municipal financial management
Municipal management is relevant for all activities related to subnational finance. Municipal
management encompasses financial, expenditure, and asset management. All three types of municipal
management are closely inter-related.
The four tenets of public financial management include budgeting, accounting, reporting, and
auditing. Expenditure management is somewhat broader in that it focuses on whether funds are
appropriately spent and monitored and whether information is available for proper planning and
budgeting. Its basic tasks are performed within a cycle that begins with planning of resources and
expenditures and moves towards allocating and transferring funds, controlling and executing
expenditures, and, eventually, evaluating financial performance. Whereas financial management is
largely the business of the treasurer and its staff, sound expenditure management requires a broader
and more inclusive approach. For example, planning resources and expenditures and monitoring of
results requires the direct involvement of the Mayor and the council, whereas line departments will
execute expenditures in their sector. Asset management refers to municipal management of both
physical (land, infrastructure, equipment) and financial assets (investments, ownership, bank
deposits).
Figure 4.1: Public financial management subnational performance indicators in selected African LDCs
(based on Public Expenditure and Financial Accountability (PEFA) assessments)
Top 5 indicators:
•Transparency of inter-governmental fiscal relations
•Accounts reconciliation
•Procument systems
•Orderliness and participation in annual budget process
•Payroll controlls
Bottom 5 indicators:
•Multi-year perspective
•Alignment of aggregate revenue with budget
•Tax collection
•Alignment of aggregate expenditure with budget
•External auditing

42
*Notes:
Countries included: Ethiopia, South Sudan, Burkina Faso, Madagascar, Senegal, Sierra Leone,
Tanzania
The data were averaged first among all rated subnational governments within a country, then
between the included countries.
No data for non-African LDCs is publicly available.
A comprehensive treatment of challenges in municipal management, of which there are many,
especially in LDCs, is beyond the scope of this chapter. Our focus is on municipal budgeting, as it
speaks to the core challenge of municipalities, namely, to allocate scarce resources to large and ever-
growing demands for essential public services, and to do so in an equitable and sustainable fashion.
Budgeting is also an area where exciting institutional changes are taking place, especially in the form
of participatory budget processes, which are highlighted in a number of brief case studies at the at end
of this chapter.
Municipal budgets should clearly delineate and quantify the different types of planned local
expenditures. They should explain what the money will be spent on and clarify how it will be funded.
Traditionally, budgets have been prepared with a one-year horizon. However, some LDCs have
moved to three to five year horizons in order to better link their local budgets to longer-term
development objectives. For example, municipalities in Tanzania are required by law to prepare
medium-term budget frameworks that are in line with national development strategies. To implement
the new requirement local government officials have received training in medium-term budgeting
processes, as well as in the use of relevant software that allow for better planning of longer-term
infrastructure investments.
However, many local authorities in LDCs and developing countries still lack a medium-term outlook
in their local budgets. The focus remains predominantly on current and operating expenditures, which
are captured in the current account. Infrastructure investments and other investments whose benefits
extend well beyond one year are often not accounted for, since many LDCs do not legislate capital or
development budgets at the local level. Creating a comprehensive budget is a complex task and
requires enormous amounts of information and data from different local units as well as consultations
with the community on spending priorities and possible changes in user fees and taxes. Planning
ahead and setting up a calendar is crucial so that each specific unit knows when to produce certain
types of data. Figure 3.1 shows a typical subnational budget process in a developed country.

43
Figure 4.2: Subnational budget process
Source: based on budget guidelines for municipalities in Washington State, US.
There are a range of challenges that LDCs face in the timely preparation of such a comprehensive
local budget. More than in developed countries and most other developing countries, budgets by local
authorities in LDCs are affected by central government budget constraints: Central governments in
LDCs are often highly dependent on ODA and revenues from commodity export and both sources are
of a volatile nature. As a result, intergovernmental transfers to local authorities may be reduced and
result in decreased local government programs and initiatives. The volatile nature of
intergovernmental transfers also limits the information available to local authorities to plan ahead.
Moreover, the central government often allocates budgets to line ministries instead of routing it
through local governments resulting in fragmented planning and tensions between local governments
and the line departments. Another challenge lies in the fact that budgets are not synchronized. For
example, it is typical for the central governments to approve development grants very early in the
fiscal year, rather than the year before, making it hard to include them in the planning process at the
local level and leading to unspent funds in many cases.
A common result of these complications is a high ”budget-actual variance” in many cities in LDCs,
i.e. actual expenses and those that were budgeted differ to a large degree that (often more than 10 per
cent in many local authorities in LDCs) (World Bank, 2014).
44
As mentioned earlier, an important step to improve the transparency of local budgets has been the
introduction of participatory budgeting processes
Participatory budgeting
Participatory budgeting (PB) allows non-elected citizens to participate in the allocation of public
finances. In local PB, citizens decide directly on how to spend all or a certain share of the sub national
budget. In certain cases, PB may go beyond determining spending priorities and encompass
democratic processes that allow community members to determine the actual design of the budgeting
process. The shape, depth, and breadth of PB varies across the world. For example, in some local
governments, entire municipal budgets are allocated through PB while many other local authorities
limit PB to a certain share of the budget or directly allocate a small amount to neighbourhoods, who
decide on their own spending priorities (see Maputo example).
Given the many shapes and forms PB can take, most experts and practitioners agree on five basic
criteria. PB is a process where: (1) budgetary decisions are made; (2) local authorities are involved;
(3) the process is not a one –off exercise, i.e. it has to be repeated; (4) there has to be public
deliberation on spending priorities; (5) accountability is required (Sintomer et al, 2010).
Within this broad definition, PB and its implementation varies significantly, but some common
threads can be identified. Decisions are usually made in regular local assemblies and meetings where
residents meet to discuss the most important local needs and identify spending ideas. A smaller
number of selected representatives (preferably those with some financial or budgeting expertise) then
develop concrete projects that address these priorities and present them to the residents (the Nepal
case study present a variation of this framework). Once residents vote which of the proposed projects
to fund, the local government allocates the funds to implement the chosen projects. Since
accountability for implementation lies with the local authority, the government should report back
regularly to local assemblies on the status of implementation. In short, the process can thus be
described as one of diagnosis, discussion, decision making, implementation, and monitoring.
There are various welfare, ethical, political, and economic arguments in favour of participatory
budgeting, sometimes also referred to as “participatory promises”: On the welfare side, it is argued
that PB produces better and more equitable service delivery as local residents know their own
priorities better than central or subnational government representatives.
Consequently, PB helps direct local government expenditures towards communities with the greatest
needs. If carried out effectively and in line with the principles described earlier, PB will result in
greater access to basic services and improved living conditions. From an ethical angle, PB is an end in

45
itself, as by its very nature PB stands for empowerment and emancipation. Citizen empowerment can
reduce the scope for catering to a limited clientele, elite capture, and corruption through greater public
oversight. PB also represents an important political tool both for governments and its citizens. New
structures and opportunities for participation promote community building and the understanding of
complex political issues. They can be important opportunities for experiencing democratic decision-
making from the ground up (see Bangladesh case study). Citizens may also feel more connected to
their city, leading to a “political stability” argument. Through PB, politicians can build closer
relationships with their constituents and vice versa which may help thwart civic unrest and violence in
unstable settings. As we will discuss below, such arguments may explain why PB has become popular
even in less mature democracies in LDCs. On the economic side, PB may help mobilize domestic
resources for development, especially at the subnational level. The willingness to pay taxes is likely to
increase where public money is spent on visible improvements in line with clearly defined priorities
of citizens.
The full-fledged PB was “invented” in the Brazilian city of Porto Alegre in 1989. Since then, as many
as 50,000 people have participated each year to decide on as much as 20 per cent of the Porto
Alegre’s budget. Since 1989, by some counts, PB has spread to over 1,500 cities in Latin America,
North America, Asia, Africa, and Europe. PB has also become a mainstay policy tool that has been
heavily promoted by United Nations Development Programme, including UNCDF, the World Bank
(see Mozambique case study), and regional development banks around the world.
PBs in LDCs have spread as a “result of a set of forces deployed by individuals and institutions, a
constant work of legitimating participatory governance, connecting players through international
events, training teams and producing technical material” (Nelson Dias,2014). Many instances are still
under development and more of a consultative nature than linked to actual decision-making at the
local level. The more advanced experiments of PBs are present mostly present in African LDCs (with
the exception of Cameron), namely, Madagascar, Senegal, and Mozambique. However important
steps toward greater participation in budgetary matters at the local level have also been taken in Asia
and the Pacific region.
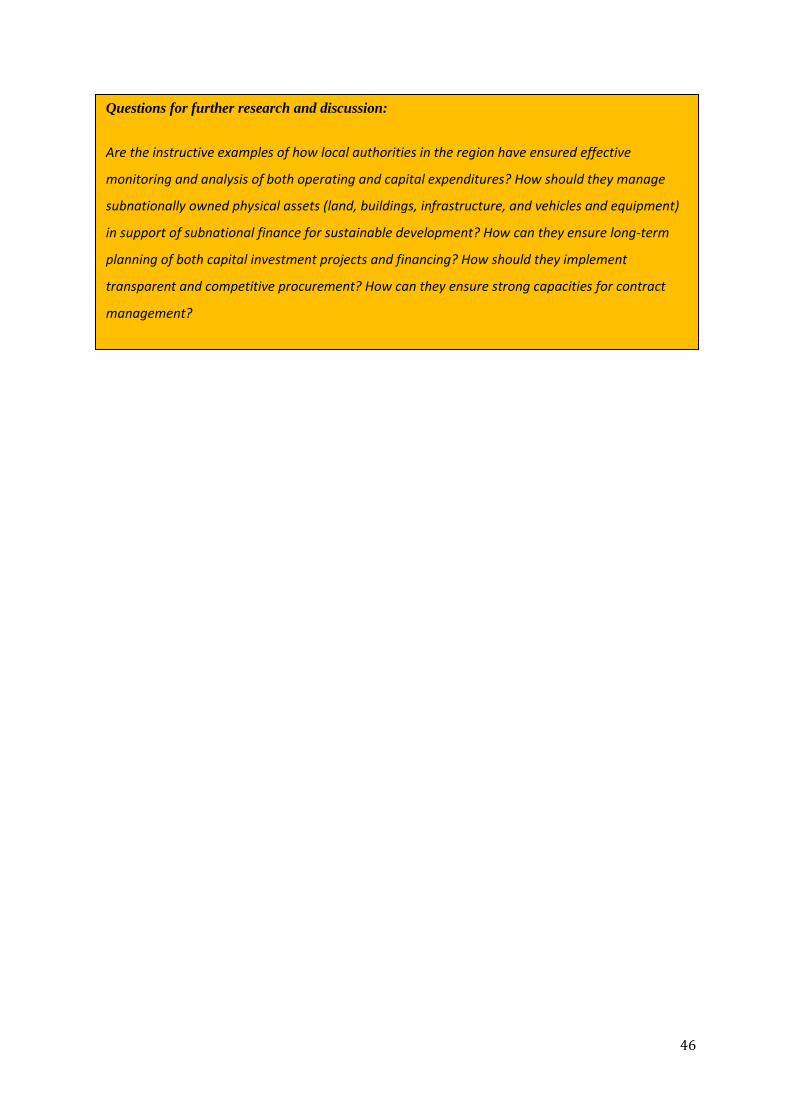
46
Questions for further research and discussion:
Are the instructive examples of how local authorities in the region have ensured effective
monitoring and analysis of both operating and capital expenditures? How should they manage
subnationally owned physical assets (land, buildings, infrastructure, and vehicles and equipment)
in support of subnational finance for sustainable development? How can they ensure long-term
planning of both capital investment projects and financing? How should they implement
transparent and competitive procurement? How can they ensure strong capacities for contract
management?

47
(V) LDC experiences in developing local participatory budgeting
Nepal: Increasing citizen participation with participatory planning (PP)
Policy lesson: Where structures for PBs are not in place, PP is an important first step. Similarly PB
initiatives can be piloted in certain sectors before they are scaled up.
Some LDCs have taken important steps toward citizen empowerment that have great potential to
evolve, over time, into more advanced engagements like PB. In Nepal, participatory planning (PP)
involves the local community in the strategic and management processes of urban planning, i.e.
community-level planning processes. The modern form of PP was ushered in through the “Local Self
Governance Act”, introduced in April of 1999. The act laid the foundation for increased citizen
participation and called for “the enjoyment of the fruits of democracy through the utmost participation
of the sovereign people in the process of governance by way of decentralization.” Since the
introduction of the Local Self Governance Act, development agencies, the UN system, as well as
international and local NGOs have been actively working with the Government of Nepal to provide
training for local citizens as well as strengthening the administrative capacity of local bodies in
support of greater participation in local decision-making processes, including planning and budgeting.
Participatory planning in Nepal varies across different villages, municipalities, and districts. In most
cases, community-based organizations are invited to deliberate policy and budget guidelines presented
through a Ward Committee, which comprises government-appointed officials. Deliberations are open
and take place in public spaces. The resultant recommendations are forwarded to the Ward Committee
office which then organizes a comprehensive workshop (Ward-Bhela) with selected representatives of
community-based organizations to further discuss the decisions at the community level. The Ward-
Bhela makes its own recommendations, which are forwarded to the municipal/village secretariat. The
municipality reviews all the proposals with regard to their technicality and financial viability. The
refined proposals are sent to an “Integrated Planning Formulation Committee” (IPFC) which
comprises all the representatives of communities, NGOs, and sectoral organizations. The outcome of
its deliberation on the refined proposals is then endorsed by the centrally appointed Ward officials. In
Nepal, participatory planning is therefore still ultimately in the hands of central government appointed
bureaucrats. To make PP even more inclusive, an important step could be to allow for local elections
of ward officials. Yet, local elections have not been taken place for a decade. However, given the
political and institutional constraints Nepal has faced through the past decades (see example on
political decentralization), the country has come a long way in empowering citizens at the local level.
In certain areas, especially the water sector, PP and PB are even further advanced. Indeed, many water
supply projects are initiated, financed, and implemented by water user communities through a
combination of central government grants, own source revenues, and loans.

48
Source: World Bank, 2014.
Bangladesh (1): Experimenting with inclusive budgetary processes at the local level
Policy lesson: Donors and NGOs (international and local) can “wet” citizens’ appetite for PB
through encouraging local authorities to experiment with different forms of inclusive budgetary
processes at the local level.
Bangladesh has made important strides in involving citizens in local decision-making through a range
of donor projects undertaken in collaboration with the Government. While falling short of
institutionalizing PB as a municipal management practice, these projects sparked great interest and
even enthusiasm for the idea of PB, which could pave the way for sustained citizen engagement in
local budgeting processes in the future. For example, as part of the Sirajganj Project in the early
2000s, co-sponsored by UNDP and UNCDF, participatory planning and budgeting meetings were
organized at a number of Union Parishads (UP), which are the smallest rural administrative and local
government units in Bangladesh. Also, The Hunger Project, a global NGO to combat hunger and
malnutrition, helped organize open budget session at UPs all over Bangladesh, giving citizens the
chance to convey concrete project proposals that would meet their practical needs. A local NGO
called Agrogati Sangstha carried out a similar type of exercise by organizing a meeting in which the
chairman of a UP declared the budget of the UP before some 500 local citizens, many of whom posed
concrete questions about revenue and development expenditures. Building on these experiences and
similar exercises, the Government in 2007 launched a national decentralization programme, known as
the Local Government Support Programme (LGSP), with the aim of improving local governance and
local service delivery. As the programme ended in December 2011, UNCDF and UNDP developed
the Union Parishad Governance Project (UPGP) and the Upazila Governance Project (UZGP), which
scale up promising innovations tested in previous pilots.
Solomon Islands: Tackling local governance challenges in a small island developing state
Policy lesson: PB faces particular challenges in Small Island Developing States (SIDS) due to
geographical constraints. As a result, capacity-building efforts must take into consideration how such
constraints affect local governance as well as the interaction between local and central governments.
The case of the Solomon Islands highlights the particular challenges of small island developing states
in promoting local participation in economic decision-making. It also shows the potential for
performance-based grants to promote good governance and lay the groundwork for participatory
budgeting approaches. The Solomon Islands’ population is culturally diverse with some 80 different
languages reflecting geographical dispersal across some 300- 400 inhabited islands. Experts have
identified some major challenges for participatory approaches to local governance. First,
49
transportation and communication links across the country are very poorly developed, restricting
opportunities for engagement in the formal economy. Second, the financial, technical, and human
resources available to provincial governments are severely below what is necessary to maintain basic
services, i.e. there is reportedly poor devolution of funds from central government to provincial
governments (Bennet et al, 2014). Third, there is complex institutional landscape of interventions at
the subnational level, which complicates local planning processes. Fourth, there are governance
challenges at the local level, including corruption and transparency issues.
The central government has taken concrete steps to tackle these challenges. For example, in April
2013, the Ministry of Provincial and Institutional Strengthening formally launched a process to
develop Ward Profiles for each of the 170 Wards and Strategic Plans for each Province. To promote
good governance at the local level, the Provincial Governance Strengthening Programme provides
access to the Provincial Capacity Development Fund ($33.5 million) for provinces that meet
minimum conditions for principles of transparency and accountability. Provinces that meet the
requirements (seven out of nine in 2015) can tap the fund for investments for small scale
infrastructure projects.
Senegal (1): The experience of PB experiments in Fissel and Ndiaganiao
Policy lesson: Embedding PB in a sound institutional and legal framework at the national level could
help it survive political change at the local level.
Senegal has a long tradition of decentralization dating back to 1972, and in 2003, the country
launched new PB experiments in Fissel and Ndiaganiao. Participatory budgeting in Fissel followed a
programme for strengthening citizen participation that had started in 2001 (Gaye, 2005, p.1). Fissel
also benefitted from having a long tradition of social mobilization through, for example, the launch of
community radio by grassroots organisations in the mid-1990s, and a local civil society organization
called Regroupement Communautaire pour le Développement (Recodef), played an important role in
launching the initiative. The Fissel experiment was successful *in improving local revenue
management because its citizens were consistently active and its politicians receptive,* and it
demonstrated that PB can be successful in a rural context. Since then, the major challenge has been to
establish PB as a permanent and accepted tool of governance. Frequently, as was the case in
municipalities like Matam and M’Bao, newly elected mayors abandon the concept because it is
associated with their predecessors. It is thus important to institutionalize the principles of PB. In order
to ensure that PB survives beyond election cycles, the national Constitution could make citizen
participation a legal requirement for municipalities rather than just encouraging it. 12 years after
Fissil, Senegal is embracing PB in earnest with legislative changes and new pilot projects with the
ultimate aim of ensuring that there is PB in all 45of its départements.

50
Source: Sintomer, Allegretti and Herzberg, 2012.
Madagascar: Building capacity for PB through donor support
Policy lesson: A one size fits-all approach to PB should be avoided.
Participatory budgeting in Madagascar started in 2008 with 9 municipalities, six of which were in
mining areas. As a result of PB, revenue collection increased dramatically in some areas: For
example, the Ambalavao rural municipality raised its revenues from land and property taxes more
than six fold to 52 percent, an impressive jump that has been attributed to citizens’ greater willingness
to contribute financially in PB scenarios. PB in mining areas also facilitated a more transparent and
fair management of mining royalties paid by mining companies to the State. Following the positive
initial experience, the Government of Madagascar’s Local Development Fund was
decentralized, participatory budgeting of 50 selected municipalities was rolled-out, and training of
206 community facilitators was financed. One shortcoming identified by stakeholders was that the
World-Bank-led project provided the same capacity building activities and amount of financial
resources to all municipalities. In this context, it was stressed that municipalities are heterogeneous in
terms of size, capacity, and commitment to reforms and that the one-size fits all approach adopted by
the project severely limited its impact.
Mozambique (1): Evolving PB approaches in Maputo
Policy lesson: Good governance is good politics
Mozambique has one of the largest urban populations in Africa, with a predicted 60 per cent of the
population living in urban areas by 2030. The emergence of PB in Maputo has been referred to as a
‘historical puzzle’ (Levi, 2010) given that Mozambique features a ‘party based authoritarian regime
that emerged out of violent, ideologically-driven conflict’ similar to other LDCs such as Eritrea,
Ethiopia, Uganda and Zimbabwe (Levi, 2010). In the context of concerns over stability of the regime
and the discovery of vast resources of coal and natural gas, Mozambique received increasing levels of
ODA and became a haven for FDI, with 40 per cent of its budget financed by its donor community
(However, development funds have come with strings attached, one of which committed the
government to implement a series of ‘good governance’ reforms, including PB. The current form of
PB in Maputo, which has evolved over the past decade, rotates through 16 neighbourhoods each year
on a three-year cycle, with each neighbourhood able to spend up to 1.5 million meticais (roughly US$
50 000) on its priority project(s). More recently, the World Bank doubled its funding and shortened
the cycle from three to two years. The Maputo model highlights that beyond the benefits a well-
51
framed PB brings to the population; it is also good politics as it helps reconnect the local party-state to
the population in a face-to-face manner with benefits going beyond the usual partisans.
Sources: Mozambique Economy Profile, 2013; Reaud, 2012, United Nations, cited in World Bank,
2009-update.
Questions for further research and discussion:
Are there instructive examples of how local authorities in the region have ensured effective
monitoring and analysis of both operating and capital expenditures? How should they manage
subnationally owned physical assets (land, buildings, infrastructure, and vehicles and equipment)
in support of subnational finance for sustainable development? How can they ensure long-term
planning of both capital investment projects and financing? How should they implement
transparent and competitive procurement? How can they ensure strong capacities for contract
management?

52
(VI) Challenges in accessing long-term finance for capital investments
Urbanization has led to enormous municipal infrastructure financing needs around the globe. While
own-source revenue generation and sound public financial management are crucial, domestic capital
markets may offer additional opportunities for cities and local authorities in LDCs to leverage their
budgetary resources to invest in infrastructure.
Figure 6.1:
Source: Pozhidaev and Farid (2016).
Capital markets are the part of a financial system concerned with raising capital for long-term
investment,which is the type of investment needed for infrastructure improvements at the local level.
Capital for long-term finance can be raised in the form of equity and debt.
Raising finance by selling equity to private investors by the project owner is more complex and
expensive than selling debt. It essentially requires a municipal company or a special purpose vehicle
to be listed on the stock exchange, where the entity can issue equity for sale to interested investors.
Such financial infrastructure is rarely in place in developing countries at the local level, let alone in
LDCs. However, as argued by Pozhidaev and Farid (2016), private equity may be attracted through
non-market mechanisms. For example, in Busia, Uganda, a private entity has committed equity
to a new infrastructure project through a project-based partnership arrangement with a
municipality (see Uganda case study (2) in this chapter).
Financial markets
Money
market
Foreign exchange
market
Capital market Commodities
market
Credit
market*
Bond and long-term
debt market
Equity
market
* The credit market is defined narrowly as a marketplace for trading, structuring, and investing in
the credit/credit risk of public and private borrowers through short-term lending or through credit
derivatives and structured credit products.

53
Since it is less complex and often cheaper, debt financing is much more common than equity
financing. There are two avenues for local governments to access municipal credit: bank lending and
municipal bonds. Out of these two options, long-term bank lending is by far the most common type of
local debt and represents the predominant form of municipal credit in most developed and developing
countries. Municipal bonds are less common and represent the most sophisticated instruments for
raising finance at the local level (the section on municipal bonds in this chapter provides a more
detailed discussion on their role and potential in developing countries and LDCs).
Municipal bonds
As of late, municipal bonds have received renewed attention in the international development
community as a potentially effective means to mobilize additional resources for local development
from private investors. However, whether they are a realistic pursuit, is subject to debate, as municipal
bonds belong to a set of government financing options (Table 4.2) that are typically applied in more
advanced financial economies with diverse and mature financial sectors .
Table 6.1: Advanced municipal finance tools
Government-based
Finance Options
General Obligation Bonds
Revenue Bonds
Industrial Revenue Bonds
Qualified Energy Conservation Bonds
Social Impact Bonds
Public Benefit Funds
Linked Deposit Programs
Energy Efficiency Loans
Property-Assessed Clean Energy Programs
Greenhouse Emissions Allowance Auctions
Development Exactions Dedication Requirements
Linkage Fees
Impact Fees
Public and Private
Options
Public-Private Partnerships
Pay for Performance
Securitization and Structured Finance
Private Sector
Leveraging
Loan Loss Reserve Funds
Debt Service Reserves
Loan Guarantees

54
Pooled Bond Financing
Pooled Lease- Purchasing Finance
Tax Increment Financing
Source: Center for Urban Innovation at Arizona State University, 2015.
For an informed discussion, it is beneficial to look at how common and successful these instruments
have been how around the world.
The US boasts a USD 3.7 trillion municipal bond market, representing more than 22 per cent of its
GDP, where even the smallest of towns have raised millions of dollars in bond issuances. A market of
such size remains unique in the world. Canada comes in a distant second with outstanding local debt
representing just under 3 per cent of its GDP. Indeed, municipal bonds are not the predominant source
of finance in most developed countries. Outside the US, most states, cities and towns that access the
financial market for credit do so through bank loans, often from government-owned financial
institutions, and banks, such as development banks, with which they have a long-standing
relationship. In middle and low-income countries, subnational access to capital markets is even more
limited and applies to selected larger cities at best. Many local authorities do not access private or
public credit at all and rely entirely on capital grants from the central governments to fund large-scale
investments. This is often due in part to federal laws restricting local borrowing. (Table 4.3))
Table 6.2: Limitations on LGs’ borrowing ability in selected Asian LDCs
Afghanistan Cities can only borrow from the Central Government.
Bangladesh LG borrowing from external sources is allowed with central government approval.
Urban Local governments can and do borrow from the Bangladesh Municipal
Development Fund.
Bhutan LGs may borrow funds through the Ministry of Finance or with its approval.
Nepal Municipalities can borrow using collateral or CG guarantees
Source: World Bank (2016b).
A cursive look at the BRICS, the group of the most advanced emerging markets, confirms the
immature stage of municipal bond markets around the developing world. The BRICS country with the
biggest potential for municipal bonds is China. After a subnational borrowing crisis in the early
1990s, municipalities were not allowed to take out direct credit. As a result, a plethora of semi-
autonomous local government investment vehicles emerged that borrowed on behalf of local
authorities. Local government debts issued through these financing vehicles amounted to 18 trillion

55
yuan ($2.9 trillion) in 2014, more than a quarter of China's GDP. Alarmed by this amount and set to
bring subnational borrowing out of the shadows, a handful of cities, including Beijing, were
authorized to issue almost 600 billion yuan ($90 billion) in bonds in 2015.Whereas for the time being
the municipal bond market remains small, representing only 1.3 per cent of its GDP, it could grow
significantly. Much depends on the extent to which these issuances can help reign in local government
debt and increase transparency.
Compared to other developing countries, India has a longstanding history of municipal bonds. In
1998, Ahmedabad became the first Indian city to sell municipal bonds to finance infrastructure
improvements. Yet, the municipal bond market has remained in a nascent stage. In the past decade
and a half only 25 municipal additional bonds have been issued.
In Brazil, the central government authorized 21 states to borrow up to 60 billion ($25 billion) from
2013 through 2014, a move that ended a ban on municipal debt that dated back to a 1997 after a
subnational debt crisis required a federal bailout. the central government authorized 21 states to
borrow up to 60 billion real ($25 billion) from 2013 through 2014 However, only a year after the ban
was lifted it was reinstated after two large international banks provoked a central government
backlash by collecting a federal government guarantee and charging the state of Minas Gerais more
than if Brazil would have sold its own sovereign bonds (collecting $140 million in fees in the
process).
In South Africa, municipal debt makes up less than two per cent of bonds listed on the Johannesburg
Stock Exchange, with only four metropolitan areas – Johannesburg, Cape Town, Pretoria and
eThekwini – able to access the market (albeit with government guarantees). In Russia, the volume of
municipal bond market amounted to 0.5 trillion Roubles, less than one per cent of its GDP.
As most of the economic powerhouses outside the OECD countries have only gradually entered the
municipal bond market and have done so at a deliberate pace (perhaps to avoid pitfalls, i.e. federal
bailouts from the past) it comes as no surprise that municipal bonds in poorer countries are far and
few between. For example, there is no municipal bond floating the market in Africa outside of South
Africa, Nigeria, and Cameroon. Table 6.3 provides an overview of subnational bond issuances in
developing countries, as defined by having membership in G77. Overall, 15 developing countries (out
of 134) have experiences in issuing bonds at the sub national level.
Table 6.3: Outstanding bond issuances in Developing Countries

56
Country Total Outstanding Subnational Bonds (million $)
Outstanding Dollar or Euro-Denominated Subnational Bonds (million $)
Outstanding Local Currency Subnational Bonds (Equivalent in million $)
Information
Argentina 14050 14050 0 This subnational bond market exclusively comprises provincial bonds
Belize 10 0 10 Belize city is the only subnational entity to with outstanding bonds
Bosnia and Herzegovina
284 0 284 The Municipality of Laktaši issued the country’s first municipal bond in 2008
Brazil* 1932 1932 0 Subnational debt rose from 1 percent of GDP in the early 1970s to 20 percent in the mid-1990s Excessive subnational debt and macroeconomic stability has led to three rounds of bailouts for Brazil’s states and two for its municipalities. The central government authorized 21 states to borrow up to 60 billion ($25 billion) from 2013 through 2014 However, only a year after the ban was lifted it was reinstated
China 1531 30 1501 China began its municipal bond market in 2015 with a $590 billion issuance Most of this money went towards debt swaps intended to reduce interest rates for local debt This previous debt, known as local government financing vehicle debt (LCFV), was the equivalent of 38 percent of China’s GDP in 2014
Costa Rica* 14 0 14 San Jose became its first municipality to issue bonds in 2002
El Salvador 43 0 43 The Fideicomiso de Restructuración de Deudas de las Municipalidades, created to restructure and consolidate municipal debt, sold $43 million worth of municipal bonds in 2011
India 7379 3500 3879 Municipal bond issuances were on the rise up until 2005 but have dropped sharply since
Nigeria 1664 0 1664 Nigerian states had $14.2 billion in debt as of December, 2014 This represents 21 percent of total government debt in the country History of state-level bonds dates back to 1978
Paraguay* 7 0 7
Peru* 220 0 220 The City of Lima issued a PEN 593 million ($220 million) bond in 2013, which was given a Baa3 rating by

57
Moody’s Philippines* 120 0 120 In 1998, created the Local
Government Unit Guarantee Corporation (LGUGC), which guarantees local government, water district, and electric cooperative bonds with financial assistance from USAID
South Africa 1359 0 1359 In 2004, Johannesburg became its first municipality to issue municipal bonds
Viet Nam* 875 0 875 Five cities/provinces have issued municipal bonds The first municipal bonds were issued in 2003
Zimbabwe 0 0 0 Zimbabwe had a thriving municipal bond market since the 1980s that declined together with the central government’s financial stability and the country’s macroeconomic stability in the early 2000s From 1990-1996, bonds funded about 20 percent of local capital budgets As of July, 2016 there, are plans in the capital city Harare to issue a $15 million in bonds
Totals 14912 4936 9976 *Numbers come from source other than Cbonds database.
Note: Zimbabwe is the only known least developed country in which subnational bonds have been
issued in the past 25 years, although there are currently no outstanding isssuances.
Sources: Abal, (2013), Asian Development Bank, Bevilaqua (2002), Cbonds, CentralAmericaData, City of Johannesburg, Ekpo (2015), LGUGC, Moody’s, Singh, Charan and Singh, Chiranjiv (2015), Stefania (2016) Tarik (2014), USAID, White and Glaser (2004)
Given the underdeveloped markets for municipal bonds in developing countries, the question beckons
as to whether and when municipal bonds are a realistic objective for raising long term finance in
LDCs.
When contemplating the issuance of a municipal bond, it is important to ask whether the national
government issues bonds, since those can serve as important pricing benchmarks for potential
investors in local debt. It is safe to say that municipal bond markets are unlikely to thrive where
central governments have not yet accessed domestic capital markets. More specifically, municipal
bonds (unless heavily guaranteed by external parties) are unlikely to break through the 'sovereign
ceiling’, i.e. in the vast majority of cases the creditworthiness of a subnational entity is likely to be
equal or less than that of the central government. Because municipalities are generally ill-advised to
take on exchange rate risk (given that their revenue streams are in local currency) they are likely to
contemplate municipal bond issuances in local (and not foreign) currency. It can therefore be argued
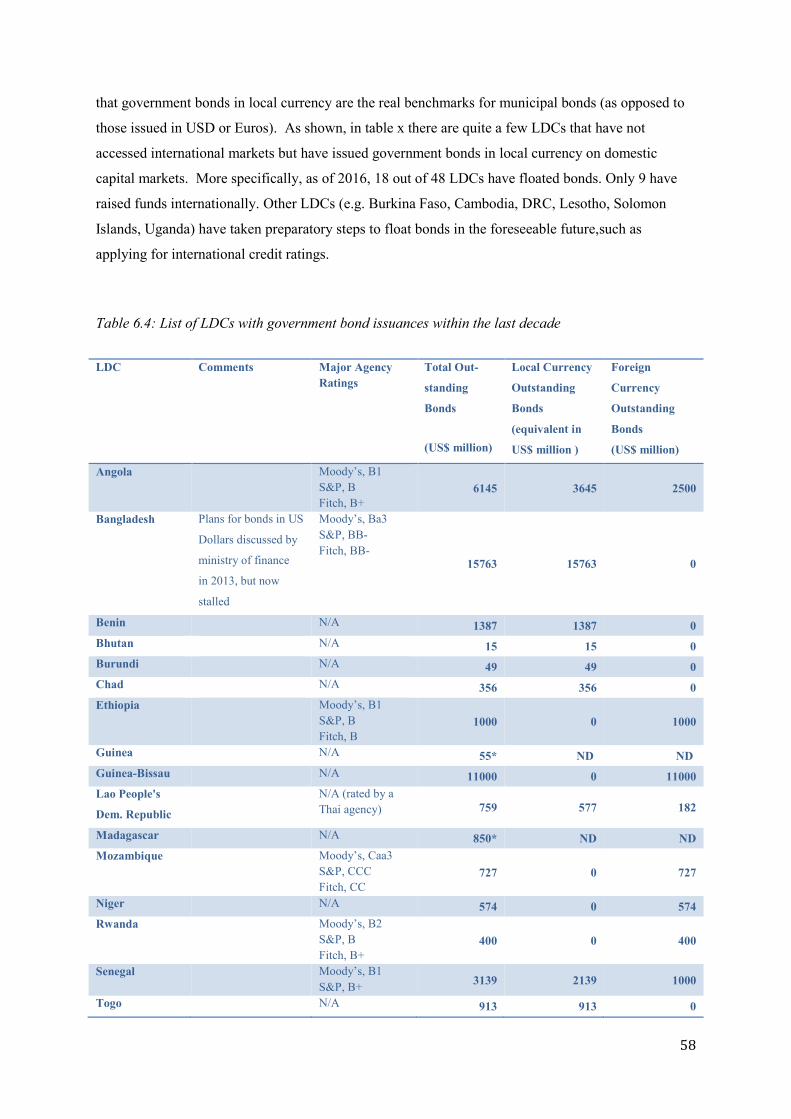
58
that government bonds in local currency are the real benchmarks for municipal bonds (as opposed to
those issued in USD or Euros). As shown, in table x there are quite a few LDCs that have not
accessed international markets but have issued government bonds in local currency on domestic
capital markets. More specifically, as of 2016, 18 out of 48 LDCs have floated bonds. Only 9 have
raised funds internationally. Other LDCs (e.g. Burkina Faso, Cambodia, DRC, Lesotho, Solomon
Islands, Uganda) have taken preparatory steps to float bonds in the foreseeable future,such as
applying for international credit ratings.
Table 6.4: List of LDCs with government bond issuances within the last decade
LDC Comments Major Agency Ratings
Total Out-
standing
Bonds
(US$ million)
Local Currency
Outstanding
Bonds
(equivalent in
US$ million )
Foreign
Currency
Outstanding
Bonds
(US$ million)
Angola Moody’s, B1 S&P, B Fitch, B+
6145 3645 2500
Bangladesh Plans for bonds in US
Dollars discussed by
ministry of finance
in 2013, but now
stalled
Moody’s, Ba3 S&P, BB- Fitch, BB-
15763 15763 0
Benin N/A 1387 1387 0 Bhutan N/A 15 15 0 Burundi N/A 49 49 0 Chad N/A 356 356 0 Ethiopia Moody’s, B1
S&P, B Fitch, B
1000 0 1000
Guinea N/A 55* ND ND Guinea-Bissau N/A 11000 0 11000 Lao People's
Dem. Republic
N/A (rated by a Thai agency) 759 577 182
Madagascar N/A 850* ND ND Mozambique Moody’s, Caa3
S&P, CCC Fitch, CC
727 0 727
Niger N/A 574 0 574 Rwanda Moody’s, B2
S&P, B Fitch, B+
400 0 400
Senegal Moody’s, B1 S&P, B+ 3139 2139 1000
Togo N/A 913 913 0

59
United Rep. of
Tanzania
N/A 600* ND ND
Zambia Moody’s, B3 S&P, B Fitch, B
3843 843 3000
Sources: Amadou (2015), Tyson (2015), DiBiasio (2015), Khmer Times (2014), Janssen (2015),
Kerdchuen (2015), Hammond (2015).
While the presence of local capital markets, where government debt can be bought and sold by
domestic investors on secondary markets, is an important prerequisite for issuing a municipal bond,
there are many other hurdles local authorities have to overcome to sell their debt to investors. To
begin with, issuing a bond is a complex and time-consuming process that requires a wide range of
preparatory steps, all of which pose distinct capacity and cost challenges, especially in an LDC
setting. The typical steps are: (a) the compilation of a corporate plan and capital improvement plan;
(b) the completion of a feasibility study; (c) the identification and involvement of all essential
stakeholders, including underwriter, legal advisor, financial advisor, auditor, trustee/paying agent,
notary and guarantor (if needed); (d) the completion of a public audit; (e) the preparation of
documents, including an offering circular that presents the basic terms of the transaction to potential
investors (prospectus), financial information on the issuer and a fiscal agency agreement (trust
indenture), containing legal rights of investors and obligations of issuer; (f) obtaining a rating from
national/international credit rating agency; (g) the registration with the responsible capital market
supervisory agency; and (i) the public sale or private placement of the bond.
At the time of writing, only one city in an LDC has come close to issuing a municipal bond. The
experience in Dakar, Senegal, (see case study) is encouraging. The example illustrates that with a
common goal in mind and well-coordinated donor support, even cities in the least developed countries
can come a long way in improving their finances through dedicated efforts to build fiscal
responsibility and creditworthiness. However, it shows that central government buy-in and sustained
support remains crucial when embarking on the ambitious project of a municipal bond.
Consequently, a more general goal of improving access of local governments to more market-based
borrowing principles is perhaps more attainable in most LDCs. For example, donors could provide
incentives for local governments to improve their capacity so that they can begin to borrow, initially
through special mechanisms such as subsidized lending and later on more market-based terms.
Ideally, this would help local governments develop borrowing practices over time and empower them
to fund their capital investment needed to meet their sustainable development objectives (Smoke
2015).

60
Other borrowing alternatives
A number of borrowing mechanisms have been used by municipalities that are not yet investment-
grade creditworthy but have undertaken significant efforts in this direction:
Municipal development funds operated by national or state government entities mobilize resources
from private lenders, the central government, and donor agencies, and on-lend these resources to
subnational governments to finance capital investment programs (see Bangladesh Case Study). Terms
are normally concessional, although capacity to repay debt obligations is an important criterion to
access these funds. More complex arrangements may pursue the dual objective of financing local
infrastructure investments and strengthening local credit markets. In Colombia, the Findeter Fund
used external borrowing to rediscount loans made by private commercial banks to public local
authorities and local private entities for investing in urban services and utilities. The success of a
model like Findeter depends on the depth of the local financial markets and the availability of capable
financial institutions that can take on credit risk related to municipal and urban services loans at a
substantial scale.
In poor countries, hybrid financing, a combination of market loans and grants, helps local authorities
keep debt service affordable. In Burkina Faso, the hybrid financing for the reconstruction of
Ouagadougou following the destruction of its central market by fire comprised access to long-term
resources from the Agence Française de Développement (AFD) and a €3 million grant, without using
a central government guarantee.
Many large cities across the globe have used land-based revenues to finance capital investments. In
the case of land development or concession development PPPs, land is sold to developers for the
construction and operation of an infrastructure facility (see section on PPPs and land value capture for
capital investments).
Assisted pooled financing holds potential in developing countries with heterogeneous municipalities.
In this case, a credible intermediary, such as the national or state government, issues a single debt
instrument backed by a diversified pool of loans to municipal utilities and covered by a pre-
established debt service fund. This scheme offers investors access to a diversified portfolio of
borrowers. For example, the State of Tamil Nadu, India, used a pooled financing facility to finance
water and sanitation projects for 13 small municipalities, at longer tenors and lower cost than would
have been otherwise possible. However, coordination costs could be high, and highly rated
subnational governments may be reluctant to participate. Combining pool financing with credit
enhancements supported by donors and private sector companies to identify and put together a pool of

61
investable infrastructure projects could allow access to local bank and capital market financing on a
non-recourse basis.
Policy interventions to strengthen long term finance at the local level
A wide range of factors influences a government’s capacity to access market-based, long-term
finance, as well as the investor’s willingness to invest into local capital. This section focuses on
challenges that lend themselves to immediate and concrete policy interventions. On the demand
(debtor) side, it emphasizes the importance of capacity for project development, debt service and
management, as well as the use of credit enhancements. On the supply or creditor side, it highlights
the importance of promoting a diversified (but not necessarily deep) financial sector, increasing
debtor familiarity and confidence, and providing a suitable regulatory and legal environment (Platz,
Painter 2010).
Infrastructure projects need to be carefully planned, engineered, and costed to be successfully debt
financed. This requires up-front investment in project development services from market demand
analysis to detailed engineering design. Most municipalities and public utilities in LDCs do not have
the resources to pay for this initial work. They may also lack the experience managing project
development. The lack of funds and management capacity means most cities cannot translate their
need for infrastructure into investible and good projects. To assist in overcoming this problem,
specialized “project development facilities” can be created. A project development facility can take
many forms and perform different roles depending on the need. In smaller or centralized countries, the
facility may be national in character. In larger or decentralized countries, the facility may operate at a
regional or state/provincial level. For instance, in the early 2000s, bilateral donors supported the
Municipal Infrastructure Investment Unit (MIIU) in South Africa, which then successfully provided
financial, technical, and managerial support to municipalities and public utilities. The project
development facility may also help to carefully structure and market the loan instruments (e.g., a sub-
sovereign bond) to meet domestic investor community needs. Greater project development capacities
should be part of a national sustainable development strategy, which focuses on the importance of
infrastructure plans, as emphasized in the Addis Ababa Action Agenda.
The capacity to support subnational debt depends on the ability of the borrower to maintain a reliable
surplus of revenues over expenditures. As previously discussed, the revenue potential of taxes in
LDCs is often low. Consequently, strengthening the revenue base and improving municipal
management are fundamental prerequisites for sustainable market borrowing.
Once a municipality is deemed fit to take out long–term loans, it should avoid potentially costly risk
exposure to exchange rate fluctuations driven by external factors. Local revenues are earned in local

62
currencies. Consequently, debt should be geared towards the domestic investor community and taken
out in local currency. Different forms of credit enhancements can help lower default risk. Credit
enhancement mechanisms can take on the form of revenue cushions for payback (e.g., “sinking funds”
in the US, “federal tax-sharing grants” in Mexico, or “bond service funds” in India), partial or 100 per
cent external guarantees for debt repayment (e.g., USAID partial guarantees for repayment of the first
Johannesburg bond), or the use of pooled financing, i.e. “pool” the debt of multiple municipalities or
other subnational entities in order to improve credit ratings, borrow more, or lower the cost of debt
(e.g. Philippines Local Government Unit Guarantee Corporation). . A well-structured bank loan or
bond may make use of several credit enhancement mechanisms at the same time.
Pooled financing could be particularly promising in developing countries with heterogeneous issuers.
In this scenario, a credible intermediary, such as the national or state government collects the
borrowing needs of a group of municipalities and issues a single debt instrument backed by a
diversified pool of loans to municipal utilities and covered by a debt service fund established before
the bond is issued. This technique offers investors access to a diversified, geographically dispersed
portfolio of borrowers, thus limiting exposure to narrowly focused credit problems. It is worthwhile to
explore whether a carefully calibrated pooled project finance approach combined with technical
assistance and credit enhancements, could help generate the municipal resources in LDCs. In that
context, some have proposed that local governments could follow a pooled project finance approach
and work with donors and private sector companies to identify and put together investible
infrastructure projects that can be financed by local banks and capital markets on a non-recourse basis
(Bond et al, 2012).
Some evidence suggests that financial sector composition matters more than relative size for the
emergence of a municipal debt market (Platz, 2009). Policies that help build active government and
corporate bond markets provide critical investment opportunities that can serve as benchmarks for
investors interested in sub-sovereign bonded debt. Moreover, central governments should consider
strengthening development banks. National development banks play a crucial role as they can lend to
municipalities directly under favourable conditions (both in terms of rates and maturities) when no
one else does. Their investments into local authorities will enable those to build up their credit
histories in the long-term. When municipalities are ready to access the markets, national development
banks (as well as regional or multilateral development banks) can also build investor confidence by
underwriting, guaranteeing or investing into municipal debt, including securities.
Another challenge relates to the lack of investor familiarity with the risk profile of local capital
investments. Rating agencies can help overcome this information gap. After the world financial and
economic crisis, rating agencies have come under increased scrutiny. As a result, world leaders have

63
called for increased competition, as well as measures to avoid conflict of interest in the provision of
credit ratings. Such measures are certainly necessary and would strengthen the rating industry. Yet at
the local level, the major challenge is not related to how these agencies conduct their business but
their lack of engagement in the first place. Indeed, even in developed countries outside the US (where
over 12 000 municipalities are rated by S&P alone) few subnational entities have ratings from any of
the three major rating agencies, which together hold more than 90 per cent of the global market share.
There is no rating for an LDC from any of the three major rating agencies at the sub-national level
(Figure 4.1). The relatively low number of subnational ratings worldwide can be explained by the fact
that most municipalities in developed countries do not access bond markets and rely on
intergovernmental transfers and long-standing relationships with local banks. For subnational entities
in LDCs and low-income countries, ratings are simply not affordable, as the major agencies are not
active in these countries.
The number of subnational ratings further decreased in developing countries after the world financial
and economic crisis. That decline may be due to a loss of confidence in the major rating agencies, less
demand at the local levels due to the direct adverse impact of the crisis on local finances, as well as
decreased interest of rating agencies in emerging market and developing economies.
However, a healthy and competitive local rating industry could play a crucial role in marketing
subnational debt to investors in LDCs. Domestic investors in LDCs, where subnational entities
attempt to tap private finance for capital investments for the first time, are typically not familiar with
subnational debt issuers and ratings may be a ‘sine qua non’ for their engagement. One of the major
reasons these agencies have not rated local authorities in LDCs is the extraordinary costs of
developing a national rating scale and adapting the rating methodology to data available in the
country. As a result, initial fees may be in the range of several hundred thousand dollars, despite
relatively small issuances. Consequently, even creditworthy local authorities in LDCs cannot afford to
pay for ratings.
Here, international development agencies can play a critical role in lowering the entry barrier for
rating agencies by paying for the first few municipal credit ratings so that the first issuers do not have
to bear the costs. Such a rating may be a confidential one that allows municipalities to get an
independent assessment of their financial marketability without deterring potential investors (see
Senegal Case Study 2). Indeed, it is strongly advisable to have confidential ratings at the earlier stages
as public negative ratings may do a lot of harm in the long term for municipalities that seek to
increase investor confidence.
Ideally, donors would focus their efforts on supporting the growth of local rating agencies. Increased
competition and greater issuer familiarity are important benefits of widening the market for local

64
rating agencies. At first, new linkages between local and international agencies could increase the
reputational capital of domestic ratings companies. After some time and with sufficient reputational
capital, local agencies can act more independently. Once a local industry develops, fees may decrease
dramatically.
Over recent years, a few regional rating agencies have emerged in Africa and gained reputational
capital with investors, such as the West African Ratings Agency (established in 2005) and Bloomfield
Financial (established in 2007) joining the ranks of older agencies, such as Agusto and Co. (1992) and
the Global Credit Ratings Company (GCR). Dakar (see case study) and Kampala in Uganda have
been among cities in LDCs that have received high ratings from local agencies. Kampala received an
A in the long term form GCR, its highest global rating. The high rating resulted from significant
progress the Kampala Capital City Authority (KCCA) has made in expanding its rates and fees base,
including through an improved property registry, and licensing taxis and other businesses. Combined
with improved debt collection these important steps led to a revenue increase of 80 per cent from
2012 to 2014.
Institutional investors: an untapped source for sub-national infrastructure investment?
As of late, much debate has centred on the potential of institutional investors (e.g., pension funds,
insurers, Sovereign Wealth Funds) as potential sources for long term investment, even though to date
such investment has been very limited and mostly directed towards developed countries. There are
three broad arguments that support greater engagement of pension funds in national and local
infrastructure. First, infrastructure investments are long-term investments that match the liability
profile of these investors. Second, infrastructure investments have performed well in comparison with
other asset classes such as equities and real estate securities; there is evidence that risks turned out to
be significantly lower for infrastructure investments than those for equities and real estate (Inderst,
2009). Third, in the case of domestic pension funds and insurers, these investments could raise the
productive capacity of the economy. Infrastructure investment from a domestic fund could raise
economic development and promote the living standard, well-being, and financial health of the work
force, i.e. the capacity for plan members themselves (figure 4.2). UN Member States acknowledged
these arguments by including a call to pension funds to allocate a greater percentage of their
investment to infrastructure in developing countries in the Addis Agenda (paragraph 47).
Figure 6.2: Domestic infrastructure investment and pension funds-the potential for a virtuous circle

65
Special emphasis has been put on pension funds since their number and size is likely to grow in
developing countries given the low effectiveness of current social security systems and a growing
ageing population. Moreover, there has also been a trend away from defined benefit and towards
mostly defined contribution plans, which are typically privately managed pension funds. This trend
may further raise the growth prospects for pension fund assets. Data on the size of pension funds in
LDCs is only partially available but numbers suggest a significant gap between LDCs and non-LDCs,
with some exceptions (figure 4.3). Data on the asset allocation of pension funds is not readily
available for LDCs. However, available evidence suggests that investment practices of pension funds
in LDCs traditionally favour short-term government securities, bank deposits and real estate. Those
pension funds in countries with the shallowest financial sectors invest most of their assets in large
illiquid assets.
Information on pension funds’ investment into different types of infrastructure projects remains sparse
since infrastructure is not listed as a separate asset class on their balance sheets. Yet, recent
information and anecdotal evidence point to a low ratio. Global estimates suggest that pension funds
invest less than 1 per cent of their deposits into listed and unlisted infrastructure. That ratio is likely to
be even lower in LDCs where the risk profile of infrastructure investments is usually much higher
than in developed countries. Yet, recent years have seen some modest headway. For example, while
most pension funds in LDCs in Africa have not directly invested into infrastructure projects, half a
dozen funds have invested in Harith General Partners Ltd., a Johannesburg-based infrastructure fund
that holds $630 million and has been involved in more than 70 African projects.
Table 6.5: Pension fund assets under management in selected LDCs
Country Assets under Management in US$ million

66
Burundi 13
Rwanda 557
Tanzania 3,800
Uganda 1,259
Zambia 1,609
Malawi 1,000
Bangladesh 4,007
Nepal 1,788
Bhutan 100
Myanmar 1,170
Cambodia* 0
Total for OECD countries 31,200,000
Sources: For African LDCs: Riscura, 2015; For Malawi: Pension Markets in Focus, 2015 edition; For
Nepal: Website of Employees Provident Fund (Sum of Provident fund and Reserve Fund), accessed
July 2016; For Bangladesh: Mansur, 2015 (Data estimate from 2013); For Bhutan: IMF Country
Report 14/178; For Myanmar: Thant 2015.
*The Government plans to introduce the country's first comprehensive national pension fund by 2020.
In addition to a conducive regulatory environment, more reliable data on the size, risk, return, and
correlations of infrastructure investments in LDCs would go a long way in incentivizing pension
funds and other institutional investors to allocate more of their assets in infrastructure investments at
the international, national, and local levels.
Figure 6.3: Number of local authorities worldwide that have received ratings from at least one of the
three major global agencies, by country* and income group (2009 and 2015)

67
Sources: Information provided by Fitch, Moody's, S&P.
* Note, in the US (not included in the figure) over 12000 municipalities are rated by one of three
major agencies.
The proper legal and regulatory environment can promote the development of a municipal debt
market. Effective judicial frameworks, including a government bankruptcy framework (Chapter 9 in
the US) helped sustain the municipal bond market in the US by protecting the rights and obligations
of creditors and debtors at the sub-national level. Moreover, debt ceilings, introduced in the earlier
stages of the US municipal bond markets, have helped keep municipal debt in check. However,
important exceptions to debt limits were made for essential revenue-generating public improvements,
like water supply systems. Overly stringent credit ceilings should not impede the development of the
municipal debt market, which can channel productive investment to providing essential local services
of municipalities that would otherwise have no access to long-term finance.
Other less market oriented type regulations may also help the development of the municipal debt
market in LDCs. For example, the Reserve Bank of India is obliged to invest 21.5 per cent of assets
into government-owned securities. Finally, in some countries, mandatory provisions for municipal
revenue cushions (“master trusts”) and mandatory issuer ratings have promoted investor interest in
municipal bonds and increased access of municipalities to long term bank loans. Regulatory changes
that enhance the creditworthiness of the issuer and promote the local rating industry are therefore
important reform measures to deepen the market for sub-sovereign debt.

68

69
(VII) LDC experiences in mobilizing long-term finance for capital investment
Uganda (2): A project-based partnership to finance municipal transportation in Busia
Policy lesson: In LDCs, private equity may be attracted through non-market mechanisms, such as
when a private entity (including an institutional investor) commits equity to a new infrastructure
project through a project-based partnership arrangement with a municipality
In Busia, Uganda (see case study 1 for more information on the local context), UNCDF facilitated a
municipal project,that includes a multi-purpose parking project in the District of Busia on the border
with Kenya. The project uses the strategic border location of the district and is designed to facilitate
cross-border movement and trade between Uganda and Kenya. UNCDF helped develop and design
the project as a tripartite public–private partnership among the local government, the Church of
Uganda, and a private investor (Agility Uganda Limited). De-risking the project through local
economic analyses, feasibility studies, and structuring and financial modelling resulted in leveraging
70 per cent of the total cost of this US$2.5 million project in private equity and debt. The project
(currently under implementation) will greatly improve traffic flow and improve the town’s
environment; boost business in the region; create over 100 jobs directly or indirectly; and, in addition
to the license fees collected from traders, allow the local government to receive 10 per cent of the
project revenue quarterly.
Figure 7.1: Rendering of multi-purpose parking project in Busia
70
Lao PDR (2): The Morphu Village water supply project: a local PPP done right
Policy lesson: Sometimes local PPPs in the water sector can add value, especially in the context of
small and scattered settlements. To succeed, they should be community-driven, subject to strong
oversight and have access to donor support. There should also be a high degree of trust between the
implementing partners.
The geographical conditions and dispersed nature of Lao towns are suited to small scale water supply
projects. An early example of a PPP in Lao PDR concerns such a small scale project in Morphu
Village, in the southern province of Champasack. Documentation from 2004 shows that the Build-
Operate-Transfer (BOT) project had a very short implementation time, with an initial meeting
between the community and the private partner in June 2000, a three-month construction period in
early 2001 and services commencing in April, 2001 (Aphaylath, 2004). The population of Morphu
Village consisted of 1,032 people living in 182 households. While the relatively small size of the
population rendered many water supply solutions uneconomical, it also allowed the village
community to find a solution to fit their own unique conditions. The PPP was therefore initiated by
the community, who requested a private building repair and construction company, the Phonekham
Construction Company (PCC), to provide a piped water supply system. PCC requested technical
support from government agencies as well as assistance with obtaining approval and permits. A
relatively simple system was constructed which consisted of a large water tank, a pump for
transferring groundwater into the tank, and pipes to convey the water to houses. Each household pipe
is connected to a meter. The Morphu Village water supply system was initially operated by PCC, but
this role was later transferred to the village authority. Although only 30 households were initially
connected to the water supply system, by 2004 water was being piped to 120 houses. Hailed as a
success in 2004, the Morphu Village project recovered construction costs earlier than expected. This
was attributed to strong support from the community. On transfer of management to the village, the
water system contributed revenue to the village community. Further outcomes noted include an
improvement in villagers’ health, increased free time for the community, employment opportunities,
and training for some villagers. Benefits to the private sector resulted in PCC carrying out similar
projects in other villages in surrounding areas. These projects are evidence of the success of PPPs at a
local level where a high degree of trust is present between partners. They also demonstrate the
effectiveness of local PPPs in the Lao context of small and scattered settlements.
Sources: Sakar, (2014), Aphaylath, (2004)

71
Bangladesh (2): Establishing a municipal development fund to finance local infrastructure
Policy lesson: Establishing a municipal development fund can help depoliticize intergovernmental transfers and build borrowing capacity at the local level, but its successful operation requires close coordination with a large number of stakeholders, project development capacity, and evidence of added value to secure sustained external funding.
There are 313 municipalities in four major cities in Bangladesh with populations ranging from 50,000
people up to 10 million in Dhaka municipality. Many municipalities lack the institutional capacity to
plan, finance, implement, and operate urban infrastructure services in an efficient and sustainable
manner. In response to this infrastructure financing gap, the Government of Bangladesh, with
technical and financial assistance from multilateral institutions, set up the Bangladesh Municipal
Development Fund (BMDF) in 2004. The BMDF is financed by loans from development partners to
the Government of Bangladesh and disburses loans to municipalities based on its own reviews of
project proposals. Its finance is a blend of grants, loans, and the municipality's own contribution for a
project. Over the course of the last decade, 154 municipalities have received BMDF financing for
infrastructure projects. The model has been fully driven by demand from municipalities, which has
limited political interference of the central government. In addition, the fund’s tax revenue
requirements and the competitive nature of its allocations have helped steer municipalities towards
increasing their tax revenue by an average of 17.5 percent, though this has fallen short of World Bank
targets due to considerable variability between the municipalities. The BMDF’s administrative costs
and consulting services have been low, drawing on only 3 per cent of the seed funds. However, the
Fund has also encountered challenges. Due to shortages of resources, BMDF projects have addressed
only a subset of municipalities. Many towns are overlooked or need to wait years for to receive
financing for another project. A related challenge has been the sustainability of the Fund, which
remains donor dependent. While BMDF has supported nearly 600 sub-projects in a variety of sectors,
donors can not clearly discern the added value of the BMFD, as little information on the level of
municipal investments (mostly financed by central government block grants) prior to BMDF has been
accessible. Consequently, due to such a perceived lack of added value and discomfort with disparate
investments, the BMDF has experienced periods when it was in danger of closure due to a lack of new
capital. There is also a need for closer coordination between the BMDF and other government driven
local development programmes. Moreover, technical assistance at the local level must be built into
projects like the BMDF, since many municipalities lack the capacity and expertise to formulate
investible project proposals, especially due to a lack of engineers.
Source: Independent evaluation reports from Asian Development Bank and World Bank; BMDF
website; expert interviews.

72
Tanzania: Dar es Salaam’s water supply: a local PPP gone wrong
Policy lesson: A local PPP that is financially viable and leads to improved services requires considerable municipal capacity to perform due diligence in selecting the right partner and understanding the allocation of risks in the contract.
In 2002, most of the water produced by the public Dar es Salaam water supplier DAWASA was lost
due to leaks, non-metered connections, and illegal usage. Water supply was sporadic in most areas.
Moreover, less than 10 per cent of the urban population was connected to a sewerage system. As a
result, the city suffered from outbreaks of water-borne diseases. To improve services, the city actively
looked for private partners to enter into a PPP. Following six years of negotiations with private
companies and two failed bidding processes the German/British company BGT was finally a awarded
a lease. Together with a Tanzanian investor, BGT created the operating company, City Water Services
Limited (CWS), of which BGT owned 51 per cent (the minimum required of the bidder) and the
Tanzanian investor Super Doll, 49 percent. The contract entered was a lease in which CWS was
obliged to provide the water supply and sewerage services and maintain assets, while DAWASA
remained responsible for funding and implementing capital investments. The project was mainly
financed through external loans, with CWS contributing $8.5 million. The major problems in this PPP
resulted from unmet obligations by the private provider. CWS set out to create a new customer
database and new billing software. However, only limited progress was made in cleaning up the
customer database (out of the 150000 contacts in the database, less than 25,000 were active and
potentially billable.) At the same time, the company failed to purchase 170,000 water meters, as
required by the Procurement of Goods (POG) subcontract. Less than 19,000 meters where purchased
and less than 2500 installed in the first year. As a result, the company's average monthly collections
were 21per cent lower than DAWASA's had been in 2002/03. By May 2005, Government arrears for
water and sewerage services amounted to US $1.5 million. In addition, the company did not pay the
Rental Fee to DAWASA regularly, periodically withheld tariff collections to pay its own operating
costs, and failed to deposit first time connection tariffs into the account for that program. In May of
2005, DAWASA served a notice of termination of the contract. However, in light of the fact that
CWS would not agree to the termination, the Minister of Water terminated the arrangement and
expelled its expatriate managers from the country. The experience highlights the need for a careful
consideration of key challenges that can make or break a successful PPP, such as the preparation of
the public-private partnership (PPP), the selection process, the allocation of risks in the contract, as
well as expectations regarding financial viability and service improvements.
Sources: World Bank (2012); expert interviews.

73
Senegal (2): Dakar’s experience in (almost) getting a municipal bond to the financial market
Policy lesson: Issuing a municipal bond can be a rallying point for concerted efforts to improve the financial situation of city but requires sustained political support from the central government.
Dakar’s experience in (almost) getting a municipal bond to the financial market provides invaluable
lessons for other cities. The reason the bond has not yet been sold is due to a last-minute intervention
by the ministry of finance. However, getting to the point where Dakar is technically ready to raise
market resources and overcome the long-term finance challenges discussed in this section, has been
the result of a concerted effort of a talented local municipal finance team and targeted and well-
coordinated donor support. First, through a consultative process with a wide range of stakeholders,
including district leaders and NGOs, the construction of a marketplace for more than 4,000 street
vendors was identified as the bankable project the bond would fund. It was envisaged that revenue for
the bond would come from affordable fees to street vendors relocating their business to the hall. A
municipal finance management team was put in place to get the city’s finances in order. The team
could build on a track record of solvency, since Dakar has been a reliable creditor to commercial
banks, the French Development Agency, and the West African Development Bank since 2009.
Moreover, political stability also helped build investor confidence. Efforts by the management team
were further guided by a confidential rating from Moody’s, which provided an independent
assessment of their work and pointed to areas of further improvement. Credit enhancements were
crucial as well, including a 50 per cent partial risk guarantee from USAID as well as the setting up of
separate fund by Dakar earmarked to pay the debt. All of these factors allowed Dakar to get a rating
of BBB+, a middle-tier ranking that qualifies as ‘investment grade’ from Bloomfield Investment, a
West African rating agency. The sale of the bond would also draw on a diversified financial sector
since Dakar planned to place it on the Bourse Régionale des Valeurs Mobilières, a common securities
market that allows institutional and other investors from 14 Francophone countries with common
currencies to buy debt without foreign exchange rate risk. However, the last minute objections from
the Ministry of Finance points to the challenges a large number of countries face in ensuring a
political environment suitable for subnational finance innovations.
Sources: Swope and Kasse (2015), expert interviews.
74
Questions for further research and discussion:
How can local authorities identify projects that are worthwhile to finance with market
(expensive) resources? What does it take to formulate investible project proposals and how can
they strengthen the capacity in project development? How should the macroeconomic
environment and financial sector depth shape the decision to borrow? What, if any, is the
potential for pooled finance to lower borrowing costs in LDCs? What potential do subnational
bonds hold in the most vulnerable countries, especially LDCs, where these instruments have not
yet been effectively utilized? How can development banks and development funds assist in
promoting access to market finance for subnational governments? What is the potential role for
public-private partnerships in reducing risks for issuer and investor (e.g. through guarantees and
other credit enhancements)? What are the experiences with different PPP models (build-operate-
transfer, build-own-operate-transfer, etc.)? How can the development of subnational ratings
agencies help build investor confidence? What is the prospect of PPP in LDC cities? What is the
potential for land value-capture as a source of revenue in LDCs? Is there any potential for
introducing innovative instruments on LDC markets? How can these instruments be
progressively introduced? Is there any risk of crowding out vis-a-vis more traditional financial
instruments? How can local authorities capture new funding sources such as philanthropic
foundations and sovereign wealth funds?
75
(VIII) International cooperation on municipal finance
Many of the challenges and policy recommendations described in this paper suggest the need for a
more concerted effort, greater coordination, and a calibrated interplay among subnational finance
stakeholders, such as municipal officials, relevant ministries, regulatory agencies, tax collectors,
investors, creditors, and citizens themselves. How does the call for more international cooperation on
municipal finance, as expressed in paragraph 34 of the Addis Agenda, fit into this largely domestic
agenda?
International cooperation on municipal finance in developing countries can take place at many
different levels. It includes knowledge-sharing, technical assistance, capacity building and direct or
indirect financial assistance in the form of grants, loans and guarantees. It may take on the form of
North-South, South-South, or triangular cooperation. It may focus on emerging market economies,
middle-income countries, low-income countries, or LDCs.
ODA to LDCs increased in 2015 for the first time in several years but still remains far below the
United Nations target of 0.15-0.20 per cent. Data on subnational finance are difficult to obtain and the
exact level of Official Development Assistance (ODA) directed towards municipal development
efforts remains unclear. The limited available evidence points to a very low share of total ODA for
urban projects (low cost housing, housing policy, urban development and management) in LDCs
(figure 8.1). Moreover, very little ODA has been directed towards capacity-building for municipal
finance.

76
Figure 8.1:
Source: OECD International Development Statistics.
Figure 8.2 presents the share of bi- and multilateral ODA commitments for urban projects by recipient
income group. The data show that more than 75 per cent of ODA for these projects goes to middle
income countries, while least developed countries (LDCs) receive less than a quarter of the funds.
Given that the proportion of the urban population in LDCs is expected to raise from 31 per cent in
2014 to 49 per cent in 2050, current ODA allocation levels will not suffice to bridge funding gaps and
build the required capacities.
Current ODA to LDCs:
$41 billion
Total ODA for urban projects in
LDCs: $0.3 billion
An insufficient share for capacity-
building for municipal
finance

77
Figure 8.2: Bi- and multilateral ODA commitments for urban projects (low-cost housing, housing policy, urban development and management) by recipient income groups
Source: OECD International Development Statistics.
Several multilateral organisations are active in the area of subnational finance and urban development;
the World Bank, regional development banks and the European Union being the most prominent. At
most, these organisations allocate about 8 per cent of their overall contributions to this area. Among
the bilateral donors, the US, Germany, the United Kingdom, France, and Japan have portfolios for
local development. These countries on average assign about 2.5 per cent of their overall ODA
contributions to urban development. Depending on the donor, between 5 and 25 per cent of their
contributions in this area goes to LDCs (Source: AidData).
However, these figures only provide a snapshot of international assistance to subnational levels and
actual amounts are likely to be higher. Many other bi- and multilateral assistance projects in other
sectors, e.g. water and sanitation, energy, health, education, transport, etc. will have more or less
direct impacts on cities. Some estimates suggest that including these projects would roughly double
the figures presented in Figure 8.2. Also, there is a lack of reliable data on South-South cooperation,
which is becoming an increasingly important factor, for example through infrastructure investments,
loans and knowledge exchange mechanisms.
Climate finance for subnational governments
There are no comprehensive estimates available on the amount of climate finance going to
subnational governments. Nevertheless, some data provide an initial indication of the available
24.4%
36.7%
38.4% Least Developed Countries,Total
Lower Middle IncomeCountries, Total
Upper Middle IncomeCountries, Total
78
resources. Mitigation accounted for 93 per cent of total climate finance in 2014, while adaptation
measures, which are often critical for cities especially in developing countries, reached only 7 per cent
(Climate Policy Initiative 2015). A survey of nine development banks showed that about 30.6 per cent
($19 billion) of the surveyed banks’ climate finance in 2014 was allocated to cities. On average, urban
climate finance accounted for 8.6 per cent of overall development bank financing commitments.
Similar to global climate finance trends, development banks’ urban climate finance also displayed a
much higher share (72 per cent) for mitigation measures, especially in energy and transport. The
remaining 28 per cent for adaptation measures was mainly spent on water and waste management.
Additional data from multilateral climate funds shows that out of over 700 projects, 47 focused
explicitly on urban mitigation or adaptation objectives. These projects had a combined value of $842
million, or $168 million on average per year. In total, this is just above 11 per cent of projects
approved by multilateral climate funds. More than 76 per cent of the contributions are from the Clean
Technology Fund. Less than 10 per cent was spent on cities in LDCs, and this share is dominated by a
major infrastructure project for coastal cities in Bangladesh (Cities Climate Finance Leadership
Alliance, 2015).
In general, approximately 75 per cent of climate finance is available at market rates (Cities Climate
Finance Leadership Alliance, 2015). However, many critical climate change resilience projects at the
urban level in developing countries do not offer adequate returns for this form of project finance. In
addition to increased total amounts of climate finance available to cities, a higher share of
concessional funding would be required to ensure support for resilient and environmentally sound
urban infrastructure in developing countries, especially LDCs.
How to strengthen international cooperation for subnational finance?
The low level of ODA and climate finance directed towards local authorities in LDCs cannot be
justified by a lack of success. In terms of their immediate development impact, the success of urban
projects seems to be equal to or greater than projects in other sectors. Moreover, for the World Bank’s
municipal development projects, performance in Africa and its LDCs is above average worldwide
(Kharas and Linn, 2013). However, whereas the overall impact is high, the sustainability of urban
projects has been significantly lower. The principal reason lies in the long-term financial viability of
the project. Weak subnational finance, i.e. inadequate local financial resources and capacities for asset
management may frustrate donors support. There is therefore a need to place greater emphasis on
urban and rural finance. Yet, donors have paid little attention to these aspects in the design,
implementation and evaluation of their development projects.
Bahl, Linn and Wetzel (2013) identify several key objectives for donors that, if met with success,
could significantly improve and enhance international cooperation on municipal finance, as called for
in the Addis Ababa Action Agenda. First and foremost, there is a greater need for partnership

79
development, better donor coordination and a more focused division of labour. The authors further
highlight that urban development requires long-term engagement on the side of the donors geared
towards a systematic hand-off to the local partner and/or other international partners to assure
sustainability and scaling up of successful interventions. In this connection, a longer-term, more
programmatic and better sequenced approach to donor engagement in local development is crucial.
Such an approach only works if there is central government buy-in, i.e. a convergence of views
between donor and recipient countries on the need for the empowerment of local authorities, as well
as rules-based, transparent and predictable intergovernmental transfers. Often, donor interventions
take place on a non-objection basis by the central government (see the example of Dakar) but lack its
sustained support. It is therefore crucial to realistically assess the government’s plan for
decentralization, looking both at the legal framework and its actual implementation. A longer-term,
more sequenced approach also requires a realistic comprehensive fiscal plan both at the central
government and at the local levels.
More focus could be put on adequate financial support for capacity building in urban financial
institutions with sustained assistance that goes beyond short-term training to helping develop policy
and implementation planning and management capacity. Capacity building could focus explicitly on
the urban finance dimension as a key element supporting sustainability of donor financed programs.
Consequently, future donor engagement could focus more on improved urban finance mobilization
and management, as well as judicious debt management and municipal borrowing practices. Another
important area for greater donor engagement in municipal finance is risk mitigation. For example,
market risks, including foreign exchange risk, need to be carefully assessed and either hedged or
removed from municipal responsibilities. Finally, donors could work together to establish clear results
metrics for financial outcomes as part of more effective monitoring and evaluation. There are thus
multiple entry points for more effective international cooperation on subnational finance that could
help pave the way for a successful implementation of the 2030 Agenda for Sustainable Development
at the local level.
80
Questions for further research and discussion:
How can donors ensure a holistic approach that addresses capacity, revenue and regulatory
constraints? With limited resources, which projects can add the highest value? How can the
international community best reconcile national, subnational and donor priorities? How should
the international community mainstream the 2030 Agenda and the Addis Agenda into
international cooperation on municipal finance? What steps can the international community
take for greater bilateral and multilateral collaboration and coordination? How can the
international community ensure donors extend their assistance beyond one-off engagements and
take a longer-term, systematic and sequenced approach to engagement of development partners?
Where is the greatest potential for South-South Cooperation and what role is it already playing?
How can we increase subnational access to ODA and climate finance? How can donors
coordinate more effectively with central governments on subnational priorities?

81
(IX) Bibliography
Abal, Patricio. “Municipal Bonds in Latin America.” Emerging Market Investors Association. November 29, 2013.
AidData Open Data for International Development.
Alam, Munawwar, 2014, “Intergovernmental Fiscal Transfers in Developing Countries- Case Studies
from the Commonwealth”, Commonwealth Secretariat Local Government Reform Series no. 5.
Amadou, N.R. Sy, 2015. "Trends and Developments in African Frontier Bond Markets", The
Brookings Institution Policy Paper 2015-01.
Asian Development Bank. “Viet Nam Bond Market Guide, Volume 1, Part 2.” February, 2012.
Aphaylath, K., 2004. Water supply in Morphu Village, Laos. UNESCAP.
Bahl, R., J. Linn and D. Wetzel, eds. 2013. “Financing Metropolitan Governments in Developing
Countries.” Cambridge, MA: Lincoln Institute of Land Policy.
Bahl, R. and J.Martinez-Vazquez, 2007. “The Property Tax in Developing Countries: Current Practice
and Prospects” 2007 Lincoln Institute of Land Policy Lincoln Institute of Land Policy Working Paper.
Bevilaqua, Afonso. “State Government Bailouts in Brazil.” Social Science Research Network. March, 2002.
Bird, Richard and Jorge Martinez-Vazquez, 2014. “Taxation and Development: The Weakest Link?:
Essays in Honor of Roy Bahl”, Edward Elgar Pub (1601).
Bird, Richard, 2010. “Subnational Taxation in Developing Countries A Review of the Literature”,
Policy Research Working Paper 5450.
Bird, Richard, 2006. ‘‘Local Business Taxes,’’ in: R. Bird and F. Vaillancourt, eds., Perspectives on
Fiscal Federalism (Washington: World Bank, 2006), 225-246.
Bird, Richard, 2001. “Setting the Stage-Municipal and intergovernmental finance”: In Challenges of
Urban Governments, edited by M. Freire and R. Stren. World Bank.
Bond, Daniel, Daniel Platz and Magnus Magnusson, 2012, “Financing small-scale infrastructure
investments in developing countries”, DESA Working Paper No. 114.
82
Boex, Jameson and Matitu C. Muga, 2009. “What determines the quality of local financial
management? The case of Tanzania”, IDG Working Paper No. 2009-02, Urban Institute Center in
International Development and Governance.
Bugembe, Joseph and Paul Donnelly, “Final Evaluation: UN Joint Program on Local Governance and
Decentralised Service Delivery in Somalia: Phase 1”. United Nations Joint Program on Local
Governance, March, 2014.
Byamugisha, Frank F.K., 2013. “Securing Africa’s Land for shared prosperity. A program to scale up
reforms and investments.’ Africa Development Forum, a co-publication of the Agence Française de
Développement and the World Bank.
Caldeira, Emili, 2011. “ Does the system of allocation of intergovernmental transfers in Senegal
eliminate politically motivated targeting?” Journal of African Economies 02/2011.
Cbonds Information Agency, Government and Municipal Bonds. Accessed September, 2016.
CentralAmericaData.COM, “Successful Sale of $43 Million in Municipal Bonds.” April 19, 2011.
Cumbe, Célia Ema, 2016. “Promoting local revenue sources for sustainable development to ensure
financial sustainability and affordability of services,” February 29, 2016.Cities Climate Finance
Leadership Alliance, 2015. “State of City Climate Finance 2015”.
Climate Policy Initiative, 2015. “Global Landscape of Climate Finance 2015”.
Commonwealth Secretariat, 2014. “Pension Funds and Private Equity: Unlocking Africa’s Potential”.
Crowe Horwath International, 2015. “Investing in Asia Pacific 2015: Maldives”.
Dabán, Teresa and Mario Pesoa. “IMF Survey: Budget Reform Holds Promise in Mozambique,” International Monetary Fund News. November 6, 2007.
Dhaka North City Corporation, 1986. “The City Corporation (Taxation) Rules, 1986”, Dhaka,
February 24, 1986.
DiBiasio Jame, 2015. “Missing: a Bangladesh sovereign bond”, September 13, 2015.
Dickenson-Jones, Giles, S Kanay De and Andrea Smurra, 2015. “State and Region Public Finance in
Myanmar”, Discussion Paper No. 8.
Ekpo, Akpan. “Issues in Sub-National Borrowing in Nigeria.” World Bank. March, 2015.

83
Fjeldstad, Odd-Helge, Kari Heggstad, 2012. Local Government Revenue Mobilisation in Anglophone
Africa, ICTD Working Paper 7.
Hammond, Clare, 2015. “Credit rating sought but no international bonds just yet”, Myanmar Times,
July 20, 2015.
Huda, Md.Samiul and Muhammad Rashidul Hasan, 2009. “Problems and Prospects of Municipal
Holding Taxation System: A Study on Bhairab Pourashava”, Journal of Bangladesh Institute of
Planners.
IMF Government Finance Statistics Yearbook database.
IMF, 2010. “Timor-Leste: Report on Observance of Standards and Codes (ROSC) – Fiscal
Transparency Module”, IMF Country Report No. 10.340.
IMF, 2013. “Enforcement Trends and Compliance Challenges: Bangladesh Perspective”, The Fourth
IMF-Japan High-Level Tax Conference, April 4, 2013
IMF, 2013. “Lao People’s Democratic Republic Peace Independence Democracy Unity Prosperity”,
The Fourth IMF-Japan High-Level Tax Conference, April 4, 2013.
IMF, 2014. “Bhutan: 2014 Article IV Consultation-Staff Report; Press Release; and Statement by the
Executive Director for Bhutan”, IMF Country Report No. 14/178.
IMF, 2015. “Mali - Technical Assistance Report: Local Taxation and Decentralization”, IMF Country
Report No. 15/291.
Inderst, G., 2009. "Pension Fund Investment in Infrastructure", OECD Working Papers on Insurance
and Private Pensions, No. 32, OECD.
Janssen, Peter, 2015. “Laos' capital market gets a leg up from Thailand”, Nikkei Asian Review, June
25, 2015.
Jibao, S.J., 2009. “Property Taxation in Anglophone West Africa: Regional Overview.” Working
Paper WP09AWA1 , Lincoln Institute of Land Policy.
Jomo, KS, Anis Chowdhurry, Krishnan Sharma and Daniel Platz, 2016, “PPPs and the 2030 Agenda
for Sustainable Development – fit for purpose?” DESA Working Paper 148.
84
Kalb, Alexander, 2010. "The impact of intergovernmental grants on cost efficiency: theory and
evidence from German municipalities", Economic Analysis & Policy 40 (1).
Kerdchuen, Wanant, 2015. “Laos plans fourth baht bond issue”, Bangkok Post, June 22, 2015.
Khadka, Rup, 2015. “The East African Tax System”, African Books Collective Limited.
Kharas, H. and J. Linn, 2013. "External Assistance for Urban Finance Development". Financing
Metropolitan Governments in Developing Countries, eds. Bahl, Roy W., Johannes F. Linn, and
Deborah L. Wetzel. Cambridge, MA: Lincoln Institute of Land Policy.
Khmer Times, 2014. “First Sovereign Bonds Planned for 2018”, November 17, 2014.
Kurbegović, Tarik. “Capital Market in Bosnia and Herzegovina: Unused Potential as Alternative Source of Financing.” Journal of Economic and Social Studies Volume 4, Number 2. Fall, 2014.
Lagarde M, Palmer N., 2008. “The impact of user fees on health service utilization in low- and
middle-income countries: how strong is the evidence?” Bulletin of the World Health Organization 86:
839–48.
Lamichhane, Hem Raj, 2012. “Fiscal Federalism and Local Government Finance in Nepal”,
Tribhuvan University, February 2012.
Local Government Unit Guarantee Corporation (LGUGC). “2016 Corporate Profile.”
Mansur, Ahsan H., 2015. “Financial market developments and challenges in Bangladesh”,
Background paper for the Seventh Five Year Plan, Policy Research Institute of Bangladesh.
Masaki, Takaaki, 2015. “The Impact of Intergovernmental Grants on Local Revenues in Africa:
Evidence from Tanzania”, Department of Government, Cornell University.
McCluskey, William J. and Riel C. D. Franzsen, 2013. “Property Taxes in Metropolitan Cities” in
Bahl, 2013.
National Assembly of Bhutan, 2009. “The Local Government Act of Bhutan, 2009”.
OECD International Development Statistics.
OECD, 2015. “Pension Markets in Focus”, 2015 edition.
Official Website of the City of Johannesburg. “The City’s Bonds.” June 27, 2007.

85
Palma, Stefania, “China’s Muni Bond Market Launches with a Bang.” Financial Times. April 1, 2016
Paulais, Thierry, 2012. “Financing Africa’s Cities: The Imperative of Local Investment”, co-
publication of the Agence Française de Développement and the World Bank.
Pattanayak, Sailendra and Israel Fainboim, 2010. “Treasury Single Account: Concept, Design and Implementation Issues,” International Monetary Fund.
Riscura , 2015. “Bright Africa Report 2015”.
Singh, Charan and Chiranjiv Singh. “Financing of Local Urban Bodies in India.” Indian Institute of Management, Banglaore. June, 2015.
Platz, Daniel and David Painter, 2010. “Sub-sovereign bonds for infrastructure investment”, G24,
Policy Brief No.50.
Platz, Daniel, 2009. “Infrastructure finance in developing countries—the potential of sub-sovereign
bonds”, DESA Working Paper No. 76.
Pozhidaev, Dmitry and Mohammad Farid, 2016. “Improving capital markets for municipal finance in
least developed countries in “Finance for city leaders”, UN Habitat, Oxford University Press.
Romeo, Leonardo, 2015. “Decentralization in Yemen”, The European Union’s ADM Multi
Programme, October 2015.
Sarkar, Avi, 2014. “Use of Public-Private Partnership (PPP) for the Provision of Water Supply in
Small Towns of Lao PDR”.
Shrestha, Manoj, 2002. “An Overview of Intergovernmental Fiscal Relations in Nepal”, International
Studies Program, Working Paper 02-05, April 2002.
Smoke, Paul (2015).“Financing Urban and Local Development: the Missing Link in Sustainable
Development Finance”, position paper produced in collaboration with the Global Taskforce of Local
and Regional Governments
Smoke, Paul, 2013."Why Theory and Practice are Different: The Gap Between Principles and Reality
in Subnational Revenue Systems". International Center for Public Policy Working Paper Series. Paper
51.

86
Taliercio, Robert R., 2005. “Subnational Own-Source Revenue: Getting Policy and Administration
Right”, East Asia Decentralization: Making Local Governments Work (Washington, DC: World
Bank, 2005), 107-128.
Thant, Htoo. “Budget concerns cripple pension expansion”, Myanmar Times, January 16, 2015.
Tyson, Judith E., 2015. “Sub-Saharan Africa International Sovereign Bonds”, Overseas Development
Institute.
UNCTAD, 2015.“The Least Developed Countries Report 2015”.
UNCDF, 2012. “Local Authorities Financial and Institutional Management System A support tool for decision making.”
United Cities and Local Governments, 2009. First Global Report on “Decentralization and local
democracy in the world”.
United Cities and Local Governments, 2010. “Local Government Finance: The Challenges of the 21st
Century”.
United Nations, 2015. “The Addis Ababa Action Agenda”.
United Nations, 2015. “2030 Agenda for Sustainable Development”.
United Nations, 2015. “Paris Agreement under the United Nations Framework Convention on Climate
Change.”
United Nations, Department of Economic and Social Affairs, Population Division, 2015. “World
Urbanization Prospects: The 2014 Revision”, (ST/ESA/SER.A/366).
UN Habitat, 2015. “Municipal Finance”, Habitat III Issue papers, New York, 31 May 2015.
Urban Management Centre, 2010. “Municipal Management Manual for Afghanistan”, Afghanistan
Thant, Htoo. “Budget concerns cripple pension expansion”, Myanmar Times, January 16, 2015.
U.S. Agency for International Development Bureau for Latin America and the Caribbean Office of Regional Sustainable Development, “Costa Rica Country Report.” June, 2004.
USAID, 2012. “Kabul City Initiative (KCI)”, Monthly Report (No. 21), November 1 – 30, 2012.
USAID, 2013. “Kabul City Initiative (KCI)”, Monthly Report (No. 23), February 1 – 28, 2013.

87
USAID, 2013. “Performance Evaluation of the Kabul City Initiative Project (KCI)”, Final Report,
July 2013.
White, Roland and Matthew Glaser. “Zimbabwe.” Subnational Capital Markets in Developing Countries: From Theory to Practice. World Bank. January, 2004.
World Bank, 2016a. “World Development Indicators: Improved Sanitation Facilities, Urban; Access
to Electricity”.
World Bank 2016b. Leveraging Urbanization in South Asia. Managing Spatial Transformation for
Prosperity and Livability. Peter Ellis and Mark Roberts
The World Bank Databank, 2016c. “World Development Indicators: Consumer Price Index and GDP”
(Nominal LCU), Country: Laos.”
World Bank, 2015. “Project performance assessment report: West Bank and Gaza” Second
Emergency Municipal Services Rehabilitation Project, Report no. 97405.
World Bank, 2014. “Municipal Finances: A Handbook for Local Governments”, Catherine
Farvacque-Vitkovic and Mihaly Kopanyi, Editors.
World Bank Independent Evaluation Group, 2014. “Implementation Completion Report (ICR)
Review - Local Urban Infrastructure Development Project [Niger].”
World Bank, 2012 “A case study of Public-private and public-public Partnerships in water supply and
Sewerage services in Dar es Salaam Water Papers No 69032, researched and written by Thelma
Triche.
World Bank Independent Evaluation Group, 2010a. “Implementation Completion Report (ICR)
Review – Second Land Titling Project [Lao PDR].”
World Bank Independent Evaluation Group, 2010b. “Project Performance Assessment Report (PPAR)
– Second Land Titling Project [Lao PDR].”
World Bank, 2008. “Intergovernmental Fiscal Relations and Subnational Expenditures in
Afghanistan”, August 2008.
World Bank Independent Evaluation Group, 2006. “Implementation Completion Report (ICR)
Review – Land Titling Project [Lao PDR].”
World Bank, 2006a. “Brazil: Inputs for a Strategy for Cities. A Contribution with a Focus on Cities
and Municipalities.” Report No. 35749- BR. World Bank, Washington, DC.

88
Zhuravskaya, E. V., 2000. “Incentives to Provide Local Public Goods: Fiscal Federalism, Russian
Style.” Journal of Public Economics 76(3): 337-368.


