71
STRENGTHENING THE EUROPEAN UNION EMISSIONS TRADING SCHEME AND RAISING CLIMATE AMBITION Facts, Measures and Implications Report by Öko-Institut Hauke Hermann, Felix Chr. Matthes

STRENGTHENING THE EUROPEAN UNION
EMISSIONS TRADING SCHEME
AND RAISING CLIMATE AMBITION
Facts, Measures and Implications
Report by Öko-Institut
Hauke Hermann, Felix Chr. Matthes


Öko-Institut (Institute for Applied Ecology) Strengthening the EU ETS
- 3 -
Executive Summary
EU energy and climate policy faces manifold challenges. The debate on tougher emis-
sions reduction targets for 2020 is gaining momentum, the need for an integrated
framework and long-term targets as well as consistent and interim targets for 2020 and
2030 is becoming clear and adjustments to the EU’s Emissions Trading Scheme (EU
ETS) seem to be indispensable to preserve its role as a central pillar of the EU’s ener-
gy and climate policy mix.
The EU is very close to fulfilling its recent greenhouse gas emission commitments for
2020. Including the committed and projected use of external emissions reduction cred-
its, only a gap of three percentage points remains, which is theoretically already gap-
filled with the cap of the EU ETS by 2020. The current situation is also challenging for
the EU ETS, which is facing significantly falling allowance prices. The fundamental rea-
son for this price trend is the massive supply of EU emission allowances (EUA) and
emission reduction credits which exceeds the demand significantly. This surplus was
950 million EUA in 2011, will reach approx. 2 billion EUA in 2013 and still amount to 1.4
billion EUA in 2020. It results from huge entitlements for the use of external emission
reduction credits from CDM and JI and the long-term impacts of the economic crisis.
Only a minor contribution to the surplus results from the support for renewable energy
sources (RES) with complementary policies to the EU ETS because the recent growth
plans for RES match quite well with the assumptions made for cap-setting in 2008.
Two different approaches were used to analyse potential interventions and adjustments
of the EU ETS. Firstly, a set aside of 1,400 million allowances combined with a tighter
cap for the EU ETS by increasing the linear reduction factor from a recent 1.74 % to
2.25 % from 2014 onwards. Secondly, the adjustment of the linear reduction factor was
derived from more ambitious goals for the total domestic emission reductions. An in-
crease of the linear reduction factor from 1.74 % to 2.6 % would be consistent with a
25 % domestic emission reduction, compared to 1990, and a linear reduction factor of
3.9 % would refer to a domestic target of -30 %. The analysis clearly shows that a sig-
nificant and timely reduction of the surplus is only possible with the combination of a
set aside and adjustments of the cap by increasing the linear reduction factor. Stand-
alone measures like a set aside on the one hand or the adjustments of the linear reduc-
tion factor on the other hand will have only extremely limited impacts on the surplus for
the next decade. However, set asides will only have an impact if the market partici-
pants believe that the respective amount of allowances will be held back for a sufficient
period of time (at least a decade) or will be retired. Furthermore, tighter caps for the EU
ETS will only achieve the intended effects if they are not complemented by an increase
in the entitlements for the use of external credits.
An assessment of the different options with a relatively simple allowance price model
enables key lessons on different types of interventions to emerge:
A stand-alone approach for a set aside which will be fully reintroduced to the
market before 2020 will have negligible price effects. The EUA price would re-
main at a level of less than 8 €/EUA in 2013 and approx. 14 €/EUA in 2020.

Strengthening the EU ETS Öko-Institut (Institute for Applied Ecology)
- 4 -
A set aside for a decade or longer will increase prices by about 2.50 €/EUA in
2013 and by about 4 €/EUA in 2020.
If the linear reduction factor is increased to 2.25 % alone, the price effect in
2013 would be very low (1 €/EUA) and slightly higher in 2020 (2 to 3 €/EUA).
If a long-term set aside is combined with a tighter linear reduction factor of
2.25 %, the price effects would be approx. 4.50 €/EUA for 2013 and about
15 €/EUA for 2020.
A tighter cap for aviation (applying the linear reduction factor of 2.25 % also to
the sub-cap for aviation) would further increase the EUA price by € 0.50.
The EUA price effects of a long-term set aside and an increase of the linear re-
duction factor to 2.6 % could increase the price in 2013 by about 5 €/EUA and
by up to 17 €/EUA in 2020.
The combination of a long-term set aside and an increase of the linear reduction
factor by 3.9 % would lift the EUA price by up to € 7 in 2013 and potentially and
with comparatively high uncertainties by more than € 20 by 2020.
Based on this analysis a set of four recommendations can be put forward for adjust-
ment of the EU ETS:
Firstly, a set aside can reduce the allowance surplus within the EU ETS in the
short term. However, the respective amount of allowances should be held back
for a period of a decade or more or retired at the earliest point in time.
Secondly, the long-term cap should be tightened by a significant increase of the
linear reduction factor, preferentially from 2014 onwards. The effective increase
is subject to fundamental political decisions on the overall emission reduction
targets. However, an increase of the linear reduction factor to less than 2.6 %
will be not consistent with overall targets of 25 % domestic emission reduction
and a factor of less than 3.9 % will not be consistent with an overarching target
of 30 % domestic action by 2020.
Thirdly, no additional entitlements for the use of external emission reduction
credits should be created in the process of tightening the EU ETS cap.
Fourthly, the implementation of high impact complementary policies (e.g. the
impact of the upcoming Energy Efficiency Directive on emissions in the EU ETS
sectors), a long-lasting change in fundamental drivers for baseline emissions
(e.g. a significantly lower economic growth for a longer period) or other changes
in the regulatory framework (e.g. the discontinuation of significant parts of the
aviation sector as net buyers in the market) should be reflected by a strictly
rule-based and high-threshold provision to lower the cap in the EU ETS.
These kinds of structural improvements could help to preserve the key role of the EU
ETS in an enabling policy mix for ambitious, effective and efficient climate policy.

Öko-Institut (Institute for Applied Ecology) Strengthening the EU ETS
- 5 -
Zusammenfassung
Die Energie- und Klimapolitik der Europäischen Union steht vor vielfältigen Herausfor-
derungen. Mit zunehmender Intensität werden ambitionierte Emissionsreduktionsziele
für 2020 diskutiert, die Notwendigkeit eines integrierten Ansatzes und langfristiger Kli-
maschutzziele sowie damit konsistenter Zwischenziele für 2020 und 2030 werden im-
mer deutlicher. Gleichzeitig erscheinen Veränderungen am Emissionshandelssystem
der Europäischen Union (EU ETS) unabdingbar, wenn dieses Instrument seine Rolle
als zentrales Element im Portfolio der europäischen Energie- und Klimapolitik behalten
soll.
Die bisherigen Treibhausgas-Emissionsminderungsziele für das Jahr 2020 hat die EU
bereits sehr weitgehend erfüllt. Unter Berücksichtigung der bereits realisierten und er-
wartbaren Minderungsgutschriften aus externen Projekten verbleibt nur noch eine Ziel-
erreichungslücke von etwa 3 Prozentpunkten, die faktisch durch das feste Emissions-
ziel des EU ETS bereits geschlossen ist. Aus dieser aktuellen Situation entsteht jedoch
für das EU ETS eine durchaus problematische Situation, vor allem angesichts massiv
zurückgehender Preise für die Emissionsberechtigungen des EU ETS (European Uni-
on Allowances – EUA). Fundamental sind diese Preisentwicklungen durch das sehr
große Angebot an Emissionsberechtigungen und externen Minderungsgutschriften
erklärbar, das den Bedarf erheblich überschreitet. Dieser Überschuss belief sich auf
950 Millionen EUA im Jahr 2011, wird bis 2013 auf etwa 2 Milliarden EUA ansteigen
und im Jahr 2020 immer noch 1,4 Milliarden EUS betragen. Hauptgründe dafür sind die
umfangreich zugelassene Nutzung externer Emissionsminderungsgutschriften aus
dem Clean Development Mechanism (CDM) und Joint Implementation (JI) sowie die
längerfristigen Auswirkungen der Finanz- und Wirtschaftskrise. Eine nur untergeordne-
te Rolle spielt dagegen der Überschuss, der sich aus der Förderung erneuerbarer
Energien mit Instrumenten jenseits des EU ETS ergibt, entsprechen doch die aktuellen
Ausbaupläne für erneuerbare Energien vergleichsweise gut den Annahmen, die im
Jahr 2008 bei der Festlegung des Emissionsziels für den EU ETS (Cap) getroffen wur-
den.
Die Analyse unterschiedlicher Veränderungen bzw. Anpassungen des EU ETS erfolgte
aus zwei unterschiedlichen Perspektiven. Erstens wurde die Herausnahme (Set aside)
von 1,4 Milliarden EUA aus dem EU ETS in Kombination mit einem ambitionierteren
Cap untersucht, die sich aus einer Erhöhung des linearen Reduktionsfaktors von bisher
1,74 % auf 2,25 % ab 2014 ergibt. Zweitens wurden Anpassungen des linearen Reduk-
tionsfaktors aus stärkeren Minderungszielen für die Gesamtemissionen der EU abge-
leitet. Eine ausschließlich in der EU erbrachte Emissionsminderung von 25 % gegen-
über 1990 entspricht dabei einer Erhöhung des linearen Reduktionsfaktors von 1,74
auf 2,6 %, eine Erhöhung des entsprechenden Ziels auf -30% wäre konsistent mit ei-
nem Anstieg des linearen Reduktionsfaktors auf jährlich 3,9 %. Die Analysen verdeutli-
chen, dass eine maßgebliche und rechtzeitige Rückführung des Überschusses an
Emissionsrechten nur mit der Kombination eines Set aside und einer Anpassung des
Caps mittels Verschärfung des linearen Reduktionsfaktors erreicht werden können.

Strengthening the EU ETS Öko-Institut (Institute for Applied Ecology)
- 6 -
Isolierte Ansätze wie ein Set aside für sich oder die Anpassung des linearen Redukti-
onsfaktors allein haben dagegen für die nächste Dekade nur sehr begrenzte Wirkun-
gen auf die Entwicklung des Überschusses an Emissionsberechtigungen. Dessen un-
geachtet kann ein Set aside nur dann eine Wirkung entfalten, wenn die Marktteilneh-
mer zu der Einschätzung gelangen, dass die entsprechenden Zertifikatsmengen für
einen ausreichend langen Zeitraum (mindestens eine Dekade) aus dem Markt ge-
nommen oder stillgelegt werden. Darüber hinaus werden verschärfte Caps im EU ETS
nur dann die intendierten Effekte zeitigen, wenn sie nicht mit einer Erhöhung der Nut-
zungsberechtigungen für externe Emissionsminderungsgutschriften einhergehen.
Die Bewertung der unterschiedlichen Modelle mit einem vergleichsweise einfachen
Modell zur Abschätzung von Preisen für Emissionsberechtigungen führt zu folgenden
zentralen Ergebnissen:
Ein Set aside ohne weitere Ergänzungen, das vor 2020 wieder vollständig dem
Markt zur Verfügung gestellt wird, hat nur vernachlässigbare Effekte auf den
Preis für Emissionsberechtigungen. Der Preis für Emissionsberechtigungen
würde auf einem Niveau von unter 8 €/EUA im Jahr 2013 und ungefähr
14 €/EUA im Jahr 2020 verbleiben.
Ein Set aside, das für eine Dekade oder länger aus dem Markt genommen wird,
erhöht die Zertifikatspreise um etwa 2,50 €/EUA im Jahr 2013 und ungefähr
4 €/EUA in 2020.
Wenn nur der lineare Reduktionsfaktor auf 2,25 % erhöht wird, ergibt sich für
das Jahr 2013 nur ein geringfügiger Preiseffekt (1 €/EUA) und für 2020 eine et-
was größere Zertifikatspreiserhöhung (2 bis 3 €/EUA).
Wenn ein längerfristig angelegtes Set aside mit einem verschärften linearen
Reduktionsfaktor von 2,25 % kombiniert wird, so ergeben sich Preiserhöhungen
von etwa 4.50 €/EUA für 2013 und ungefähr 15 €/EUA für 2020.
Ein ambitioniertes Cap für den Flugverkehr (über die Anwendung des linearen
Reduktionsfaktors von 2,25 % auch für diesen Teil des EU ETS) würde den
EUA-Preis um weitere 0,50 € erhöhen.
Als Effekt eines längerfristig angelegten Set aside in Kombination mit einer Er-
höhung des linearen Reduktionsfaktors auf 2,6 % könnte sich der Zertifikats-
preis im Jahr 2013 um 5 €/EUA und um bis zu 17 €/EUA im Jahr 2020 erhöhen.
Das Zusammenwirken eines längerfristig angelegten Set aside und einer Ver-
schärfung des linearen Reduktionsfaktors auf 3,9 % würde die EUA-Preise in
2013 um etwa 7 € und bis 2020 – bei vergleichsweise hohen Unsicherheiten –
um mehr als 20 € erhöhen.
Auf der Grundlage dieser Analysen ergeben sich für das EU ETS insgesamt vier Emp-
fehlungen:
Erstens kann mit einem Set aside der Zertifikatsüberschuss im EU ETS kurzfris-
tig reduziert werden. Die entsprechende Menge an Emissionsberechtigungen

Öko-Institut (Institute for Applied Ecology) Strengthening the EU ETS
- 7 -
sollte jedoch für eine Dekade oder mehr zurückgehalten oder frühestmöglich
stillgelegt werden.
Zweitens sollte das langfristige Cap über eine deutliche Erhöhung des linearen
Reduktionsfaktors verschärft werden, die vorzugsweise ab 2014 wirksam wer-
den sollte. Das Ausmaß dieser Erhöhung resultiert aus grundlegenden politi-
schen Entscheidungen zum übergeordneten Minderungsziel für die gesamten
Treibhausgasemissionen. Eine Erhöhung des linearen Reduktionsfaktors von
weniger als 2,6 % wäre jedoch nicht konsistent zu einem Minderungsziel für die
Emissionen in der EU von 25 %, eine Erhöhung um weniger als 3,9 % wäre
nicht konsistent mit einem Ziel für Emissionsminderungen in der EU von 30%
bis zum Jahr 2020.
Drittens sollten die Budgets für die Nutzung externer Emissionsminderungsgut-
schriften im Zuge einer Verschärfung des Caps für den EU ETS nicht erhöht
werden.
Viertens sollte die Umsetzung von zusätzlichen Politiken und Maßnahmen mit
weitreichenden Emissionsminderungswirkungen (z.B. die anstehende EU-
Richtlinie zur Energieeffizienz) sowie langfristig wirksame Veränderungen ent-
scheidender Treibergrößen für die Referenzentwicklung bei den Emissionen
(z.B. ein längerfristig deutlich verringertes Wirtschaftswachstum) oder andere
Änderungen (die z.B. den Wegfall eines Teils der Nachfrage aus dem Flugver-
kehr bewirken könnten) über eine entsprechende Eingriffsregelung für eine Ver-
ringerung des Caps berücksichtigt werden, die jedoch strikt regelbasiert sowie
mit hohen Eingriffsschwellen ausgestaltet werden sollte.
Solcherart ausgestaltete, strukturellen Verbesserungen könnten dazu beigetragen, die
Schlüsselrolle des EU ETS in einem nachhaltigen Portfolio ambitionierter, effektiver
und effizienter Klimapolitik zu bewahren.

Öko-Institut (Institute for Applied Ecology) Strengthening the EU ETS
- 9 -
Contents
Executive Summary .................................................................................................................... 3
Zusammenfassung ...................................................................................................................... 5
1 Introduction, scope and structure of the analysis ......................................................... 13
2 Trends and targets for the greenhouse gas emissions of the EU ................................ 16
2.1 Trends and targets for total greenhouse gas emissions of the EU .......................................... 16
2.2 Cap under the EU ETS from 2005 to 2020 and beyond .......................................................... 18
3 The recent problem: Allowance surplus from 2008 to 2011 .......................................... 23
3.1 Introduction, scope and structure of the analysis .................................................................... 23
3.2 Trend of verified emissions in the EU ETS for 2008 to 2011 ................................................... 23
3.3 Free allocation for 2008 to 2011 .............................................................................................. 24
3.4 Auctions and sales for 2008 to 2011 ....................................................................................... 24
3.5 Use of CDM and JI credits from 2008 to 2011 ........................................................................ 24
3.6 Demand and supply balance for 2008 to 2011 ........................................................................ 24
4 The future challenge: Projection for the EU ETS surplus until 2020 ........................... 26
4.1 Introduction, scope and structure of the analysis .................................................................... 26
4.2 Baseline emission trends for the EU ETS from 2012 to 2030 ................................................. 26
4.3 Free allocation from 2012 to 2020 ........................................................................................... 33
4.4 Auctions and sales from 2012 to 2020 .................................................................................... 34
4.5 Use of CDM and JI credits from 2012 to 2020 ........................................................................ 35
4.6 New entrant reserve for the second trading period ................................................................. 38
4.7 Total supply and demand balance for 2012 to 2020 ............................................................... 39
5 Interim summary: Demand and supply balance 2008 to 2020 ...................................... 41
6 Analysis of current proposals for intervention .............................................................. 44
6.1 Introduction, overview and structure of the analysis ................................................................ 44
6.2 Specification of the options for the analysis ............................................................................ 45
6.3 Reduction of the surplus in the EU ETS .................................................................................. 48
6.4 Potential range of price effects ................................................................................................ 50
6.4.1 Methodological approach .......................................................................................... 50
6.4.2 Results of the allowance price effects estimates ....................................................... 55
7 More ambitious greenhouse gas emission reduction targets for the EU:
Analysis of implications for the EU ETS ......................................................................... 57
8 Summary and conclusions ............................................................................................... 63
9 References ......................................................................................................................... 67
Strengthening the EU ETS Öko-Institut (Institute for Applied Ecology)
- 10 -
List of tables
Table 1 Cap references for the second trading period of the EU ETS ........... 18
Table 2 Comparison of approaches to quantify the cap for the third trading period of the EU ETS (scope of the second period), 2013-2020 ......................................................................................... 20
Table 3 Cap for the EU ETS in the third trading period, 2013-2020 .............. 21
Table 4 Surplus of allowances in the EU ETS, 2008-2011 ............................ 25
Table 5 Updated baseline emission trends for the EU ETS sectors, 2005-2030 ......................................................................................... 33
Table 6 Amount of free allocation, 2008-2020 ............................................... 33
Table 7 Amount of free allocation from the new entrant reserve, 2013-2020 ......................................................................................... 34
Table 8 Amount of allowance auctions and sales, 2008-2020 ....................... 35
Table 9 Entitlements for the use of CDM and JI credits for operating installations from the EU ETS scope II, 2008-2020 .......................... 36
Table 10 Total entitlements for the use of CDM and JI credits, 2008-2020 .................................................................................................. 38
Table 11 Comparison of cap, free allocation, auctions and sales, 2008-2012 ......................................................................................... 38
Table 12 Demand and supply balance, 2012-2020 ......................................... 39
Table 13 Demand and supply balance for the second and third trading period, 2008-2020 ............................................................................. 41
Table 14 Additional reduction efforts resulting from different options to reduce the surplus in the EU ETS, 2013-2030 ................................. 47
Table 15 Projection for the supply of Certified Emission Reductions (CERs) eligible under EU ETS rules from 2013 to 2020 ................... 52
Table 16 Allowance price projections for the EU ETS from the EU Energy Roadmap 2050, 2020-2040 .................................................. 53
Table 17 CO2 allowance price effects of the different options, 2013 and 2020 ........................................................................................... 55
Table 18 Key implications for the EU ETS from the back-casting calculations for the 25 % and 30 % domestic reduction targets by 2020 ................................................................................. 62

Öko-Institut (Institute for Applied Ecology) Strengthening the EU ETS
- 11 -
List of figures
Figure 1 Total greenhouse gas emission trends and goals for the European Union (excluding LULUCF and including international aviation), 1990-2050 ..................................................... 17
Figure 2 Evolution of the caps for the EU ETS, 2005-2050 ............................ 22
Figure 3 Comparison of GDP projections for ETS-relevant modelling exercises for the European Union, 2005-2030 ................................. 27
Figure 4 Comparison of CO2 emission abatement contributions from renewable energy sources in the power sector for the EU, 2005-2020 ......................................................................................... 29
Figure 5 Update of the baseline projection for the EU ETS (scope of the second trading period), 2020 ...................................................... 30
Figure 6 Comparison of historical CO2 emissions data and baseline projections for the EU ETS (scope of the second period and aviation), 2005-2030 ......................................................................... 31
Figure 7 Evolution of the surplus in the EU ETS, 2008-2020 .......................... 42
Figure 8 Comparison of the effects of different options to reintroduce the set aside on the surplus in the EU ETS at a cap level based on the linear reduction factor of 1.74 %, 2013 to 2030 .......... 48
Figure 9 Comparison of the effects of options to implement an increased linear reduction factor on the surplus in the EU ETS, 2013 to 2030 ............................................................................ 49
Figure 10 Price trends for European Union Allowances (EUA) and EUA-CER spreads, 2003-2012 ......................................................... 50
Figure 11 Discounted CO2 allowance prices for different periods of oversupply......................................................................................... 54
Figure 12 Total and domestic emission reductions according to the 2008 Climate and Energy Package, 2020 ........................................ 58
Figure 13 Adjustments of the ETS and the switch to more ambitious EU targets for greenhouse gas emission reductions in 2020 ........... 60

Öko-Institut (Institute for Applied Ecology) Strengthening the EU ETS
- 13 -
1 Introduction, scope and structure of the analysis
The climate and energy policy of the European Union (EU) and its Member States is
framed by the energy and climate package of 2008 which includes a set of binding tar-
gets for greenhouse gas emission reductions and the deployment of renewable energy
sources and a broad range of respective policies and measures. However, the Europe-
an climate and energy policy faces a series of challenges:
The EU has made significant progress towards meeting its unilaterally envis-
aged target of 20 % greenhouse gas reduction for the period from 1990 to
2020. However, the broad range of domestic action in many countries world-
wide, among them some important emerging countries (China, India, Brazil,
South Africa etc.) as well as key OECD countries (parts of the USA, Australia,
South Korea, Mexico etc.) challenge to the EU to tighten its emission reduction
efforts.
Due to several factors the greenhouse gas-based European Union Emissions
Trading Scheme (EU ETS) faces serious challenges in terms of its role as a
central and EU-wide pillar of the EU’s climate policy mix. The significant drop in
emission allowance prices and the obvious lack of scarcity in the market create
a need for appropriate action.
The EU ETS is thus at the core of a debate on the wider topic of future emissions re-
duction efforts of the EU (which are significantly framed by the EU ETS) as well as on
the EU ETS as a key economic instrument which combines environmental effective-
ness and economic efficiency:
The EU ETS generates a price on carbon dioxide (CO2) and other greenhouse
gases released into the atmosphere by the regulated entities. The market-
based price discovery for the costs of emission abatement creates a dynamic
long-term framework for emission reductions in the regulated sectors.
The EU ETS creates an extremely transparent quantitative framework for long-
term emission reduction strategies. The cap and its development over time
without a sunset clause provides clear signals for policy makers, the regulated
entities and the public of the trajectory of emissions and the contribution to
emission reduction that will be delivered by the regulated sectors.
The EU ETS will generate significant revenue streams after the main allocation
mechanisms of the scheme are shifted to the auctioning of allowances from
2013 onwards. Significant parts of these revenue streams should be available
for national, European and international climate financing.
This threefold role of the EU ETS should also be considered in the framework of the
recent challenges to the EU ETS.
After the significant price drop of CO2 allowances within the EU ETS (European
Union Allowances – EUA) after the financial and economic crisis, the price sig-
nal from the EU ETS no longer delivers sufficient price signals for investments

Strengthening the EU ETS Öko-Institut (Institute for Applied Ecology)
- 14 -
in low-carbon technologies. Given the emerging re-investment cycle for sectors
with long-lasting capital stocks (e.g. the power sector) this creates a major chal-
lenge for the EU ETS because of a risk of lock-in into CO2-intensive infrastruc-
tures.
The contributions of the EU ETS to climate financing will be much less signifi-
cant than originally assumed. This creates a problem for specific support pro-
grammes set up by the European Union (e.g. the financing of innovative tech-
nologies from the auctioning of 300 million allowances from the new entrants
reserve) as well as the wide range of climate financing efforts by the Member
States (e.g. the national and the international climate initiative from the German
energy and climate fund which will absorb fully the revenues from allowance
auctions in Germany).
The recent trajectory for the cap of the EU ETS is not fully consistent with the
long-term emission target of the EU to reduce greenhouse gas emissions by 80
to 95 % by the middle of this century, compared to 1990 levels, as well as con-
sistent interim emission reduction targets for 2020 and 2030, e.g. 30 % and
55 %, respectively. Furthermore, the emission reduction pathway of the EU
ETS is subject to change if the EU needs to increase its efforts in the context of
the activities abroad (which often include the set-up of EU ETS-like mecha-
nisms and underline the important function of the EU ETS as a role model).
After eight years of operation (2005-2012) and even after a major re-adjustment for the
trading periods from 2013 onwards, the EU ETS faces an emerging debate on how to
fix the problems mentioned above. However, these debates should reflect different
dimensions which interact with each other:
What are the main drivers for the recent problems that the EU ETS is facing?
What are the options for addressing these problems, which effects would these
options have over time and how could these options fit into the needs for ad-
justments of the overall climate policy framework?
The analysis presented in this study is based on a detailed analysis of a range of is-
sues, which are related to the two questions specified above:
In chapter 2 the most recent trends as well as the targets for total greenhouse
gas emissions and the evolution of the long-term cap for the EU ETS are de-
scribed in some detail.
Chapter 3 deals with the supply and demand for emission allowances and offset
credits in the first four years of the recent trading period and specifies the bal-
ance between demand and supply based on historical data.
In chapter 4 a comprehensive analysis is presented on the demand and supply
of allowances for the remaining year of the second period and the upcoming
third period up to 2020.

Öko-Institut (Institute for Applied Ecology) Strengthening the EU ETS
- 15 -
Chapter 5 summarizes the demand and supply situation for the whole period
from 2008 to 2020 and specifies the main sources for the surplus of emissions
allowances by 2020.
Chapter 6 presents the analysis of some options for adjustments of the EU ETS
to address the key challenges for the next decade, including the effects on al-
lowance prices which can be assumed. The starting points for this analysis are
prominent political proposals taken from the recent debates on the EU ETS.
In chapter 7 the approaches to addressing the specific EU ETS challenges are
set into context with tightened overall emission reduction targets for the Euro-
pean Union by 2020 and beyond. These proposals on adjustments for the EU
ETS are derived from ambitious greenhouse gas reduction targets for domestic
action by 2020 based on a back-casting approach.
Chapter 8 provides a series of conclusions derived from the quantitative and
qualitative analysis.
It should be highlighted that the analysis is focused on key issues of demand and sup-
ply of allowances in a longer-term perspective.
Broader options for approaching the EU ETS, like active price management
based on price floors or price corridors or a carbon market version of open mar-
ket policy (Grubb 2012, Perthuis/Trotignon 2012) are explicitly not subject to the
analysis presented in this study.
Within the framework of a more ambitious climate policy, broader approaches in
terms of appropriate targets as well as policies and measures will be necessary.
This is relevant for policies and measures beyond the EU ETS as well as for
policies and measures addressing sectors which are not regulated by the EU
ETS. These issues are not covered by the scope of the analysis presented in
this paper.
Last but not least, the issues handled in this paper are highly political and at the same
time highly technical ones. This tension creates a strong need for transparency. There-
fore the analysis and documentation presented in this paper has a two-fold purpose.
Firstly, the information should be usable as a compendium for key data and data links
which are important to navigate across the debates. Secondly, the findings should sup-
port specific action and thus be as explicit as possible.
The authors benefitted enormously from a broad range of discussions with many col-
leagues and partners and wish to thank them for this. This paper has been edited by
Vanessa Cook (Öko-Institut). However, any errors or inaccuracies remain the sole re-
sponsibility of the authors.

Strengthening the EU ETS Öko-Institut (Institute for Applied Ecology)
- 16 -
2 Trends and targets for the greenhouse gas emissions of
the EU
2.1 Trends and targets for total greenhouse gas emissions of the EU
The historical trends for greenhouse gas emissions of the European Union (27 Member
States) are characterized by three phases (Figure 1)1:
In the early 1990s the greenhouse gas emissions decreased significantly, main-
ly due to the transformation process in Eastern Germany and the Member
States who entered the EU in 2005 and 2007 (new Member States) and mainly
in sectors which have been regulated by the EU ETS since 2005. From 1990 to
1995 the emissions decreased by approx. 6 %.
During the period from 1995 to 2005 the emissions at the aggregate level tend
to stagnation or a slight decrease but indicate different sectoral patterns. For
the sectors regulated later under the EU ETS (power sector, energy intensive
industries) a slight increase occurred, the emissions from aviation increased
significantly and the emissions from the non-ETS sectors decreased. For the
whole period from 1990 to 2005 the total greenhouse gas emissions reduction
amounted to 7 %.
From 2005 the emissions drop significantly, in the first years exclusively from
non-ETS sectors and from 2008 dominantly in the ETS-regulated sectors
whereas the latter trend was obviously but not exclusively triggered by the fi-
nancial and economic crisis from 2008 onwards. In 2009 the total emissions re-
duction compared to 1990 reached 16 %, in 2010 the respective level was 14 %
below 1990 levels.
The EU ETS for stationary installations represents (at the scope of the scheme from
2013 onwards) a share of 42 - 45 % in the total greenhouse gas emissions, the inclu-
sion of the aviation sector (from 2012 onwards) increases this share to 45 - 48 %. The
European Union has defined a set of greenhouse gas reduction targets for different
time horizons:
1 For the purpose of consistency with the ETS-related analysis the quantitative analysis of
greenhouse gas emission trends includes the emissions from international aviation (which is not accounted for under the provisions of the Kyoto Protocol to the United Nations Frame-work Convention on Climate Change (UNFCCC) but excludes the emissions from land use, land use change and forestry (LULUCF)). However, it should be pointed out that the scope of the greenhouse gas inventories under the UNFCCC covers the fuel deliveries to aircrafts and differs from the emission accounting for aviation under the EU ETS. In order to make these two data sets compatible, relative change rates were applied when certain trends or patterns from the one database had to be transferred to the other one.

Öko-Institut (Institute for Applied Ecology) Strengthening the EU ETS
- 17 -
For 2020 the EU has committed itself to an emission reduction of 20 % below
1990 levels on a unilateral basis (CEU 2007, EU 2009a, EU 2009b). An in-
crease of the ambition level to 30 % is a subject of recent debate.
No formal commitment of the EU exists yet for 2030. However, the range from
40 to 55 % is discussed within the scope of debates surrounding the Low-
Carbon Economy Roadmap and the Energy Roadmap 2050 (CEC 2011d, CEC
2011e, Öko-Institut 2011).
The EU declared and re-affirmed on several occasions a long-term emission
reduction target of 80 to 95 % below 1990 levels by 2050 (CEU 2010, CEU
2011, EP 2010).
Figure 1 Total greenhouse gas emission trends and goals for the European Union
(excluding LULUCF and including international aviation), 1990-2050
0
1,000
2,000
3,000
4,000
5,000
6,000
1990 1995 2000 2005 2010 2015 2020 2025 2030 2035 2040 2045 2050
mln
t C
O2
e
Aviation (national &international)
Non-ETS sectors
EU ETS (proxy datafrom 1990 to 2004)
2020 Goal-20...-30%compared to 1990
2030 Goal-40...-55%compared to 1990
2050 Goal-80...-95%
compared to 1990
Source: UNFCCC, European Commission, calculations by Öko-Institut
The comparison of the historical emission patterns (Figure 1) and the medium- and
long-term emission reduction targets highlights on the one hand that the sectors regu-
lated by the EU ETS must deliver a significant share of the required reduction efforts.
On the other hand the general trajectory towards the long-term targets is not fully con-
sistent with the 2020 targets as defined and addressed in recent debates. Given the
fact that the EU ETS is essentially parameterized in the framework of the 20 % emis-
sions reduction target for 2020 (as laid down in the energy and climate package of
2008) it will potentially require adjustments to maintain the appropriate investments,
which fit into the long-term trajectory towards an 80 to 95 % emission reduction by
2050.

Strengthening the EU ETS Öko-Institut (Institute for Applied Ecology)
- 18 -
2.2 Cap under the EU ETS from 2005 to 2020 and beyond
The emissions target of the EU ETS – the cap – is determined by the total amount of
allowances (European Union allowances – EUA) which are available to the regulated
entities either from free allocation or purchases or auctions. However, for the second
period of the EU ETS the exact number of these allowances is subject to changes, de-
pending on the decisions on the National Allocation Plans (NAP) of the Member States
which form as a total the EU-wide cap for the second period from 2008 to 2012.
Table 1 Cap references for the second trading period of the EU ETS
NAP decisions
(2006/2007)
NAP table decisions
(2008, 2009, 2010)
CITL "NAP Info"
(2012)
Austria 30.70 30.73 30.96
Belgium 58.50 58.49 58.49
Bulgaria 42.30 38.09 39.29
Cyprus 5.48 5.25 5.35
Czech Republic 86.80 86.74 86.74
Denmark 24.50 24.50 24.50
Estonia 12.72 13.10 13.10
Finland 37.60 37.56 37.56
France 132.80 131.99 134.37
Germany 453.10 451.47 452.34
Greece 69.10 68.31 68.31
Hungary 26.90 26.65 26.65
Ireland 22.30 22.28 22.29
Italy 195.80 201.59 201.59
Latvia 3.43 3.41 6.25
Liechtenstein 0.00 0.02 0.02
Lithuania 8.80 8.58 8.58
Luxembourg 2.50 2.49 2.49
Malta 2.10 2.14 2.14
Netherlands 85.80 87.47 87.47
Norway 15.05 15.05 15.05
Poland 208.50 205.70 205.70
Portugal 34.80 34.81 34.81
Romania 75.90 74.06 74.05
Slovakia 30.90 32.54 32.54
Slovenia 8.30 8.30 8.29
Spain 152.30 152.25 152.25
Sweden 22.80 22.47 22.47
United Kingdom 246.20 245.62 245.62
EU-27 2080.93 2076.60 2084.21
All EU ETS countries 2095.98 2091.66 2099.28
mln EUA
Note: The cap for Austria was corrected downwards for the allowances purchased by the Austrian government to
replenish the new entrant reserve and that are included in the NAP table decision and the CITL “NAP Info” for
Austria. Reserves for the use of emissions reduction credits from Joint Implementation are not taken into account
when calculating the caps. The total for all EU ETS countries includes Norway and Liechtenstein.
Source: NAP decisions2, NAP table decisions
3, CITL “NAP Info”
4, calculations by Öko-Institut
2 http://ec.europa.eu/clima/policies/ets/allocation/2008/documentation_en.htm.
3 http://ec.europa.eu/clima/policies/ets/registries/documentation_en.htm.
Öko-Institut (Institute for Applied Ecology) Strengthening the EU ETS
- 19 -
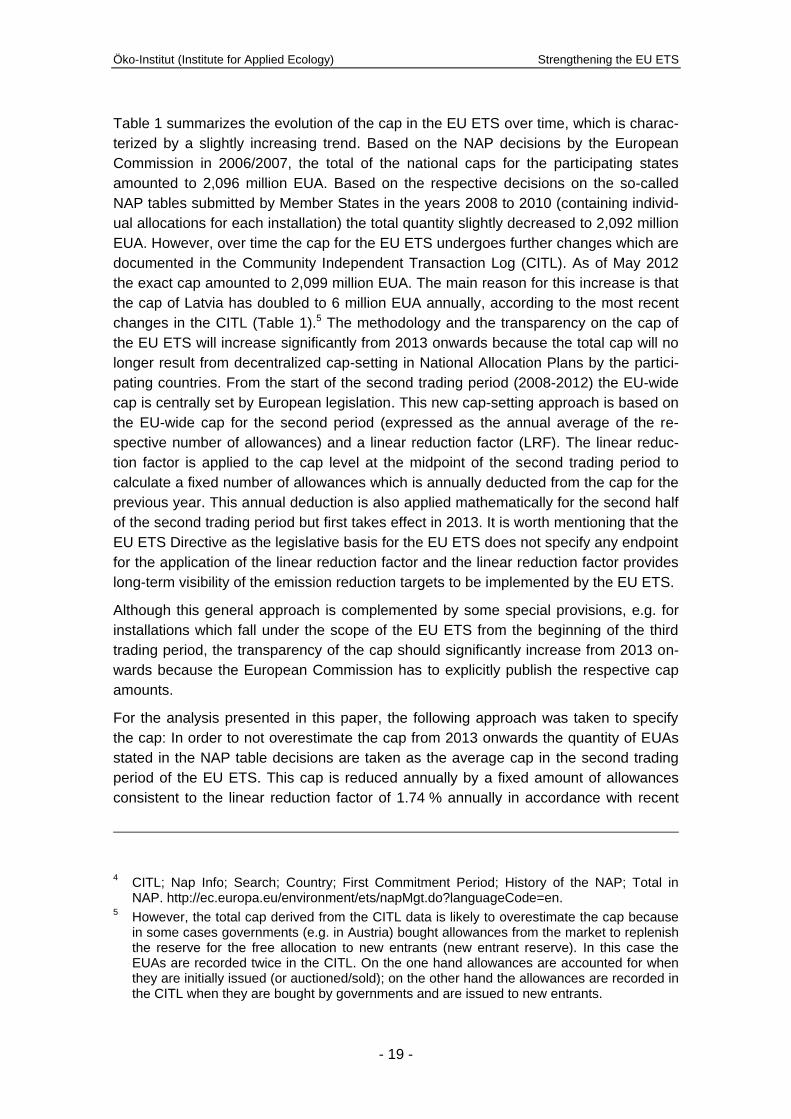
Table 1 summarizes the evolution of the cap in the EU ETS over time, which is charac-
terized by a slightly increasing trend. Based on the NAP decisions by the European
Commission in 2006/2007, the total of the national caps for the participating states
amounted to 2,096 million EUA. Based on the respective decisions on the so-called
NAP tables submitted by Member States in the years 2008 to 2010 (containing individ-
ual allocations for each installation) the total quantity slightly decreased to 2,092 million
EUA. However, over time the cap for the EU ETS undergoes further changes which are
documented in the Community Independent Transaction Log (CITL). As of May 2012
the exact cap amounted to 2,099 million EUA. The main reason for this increase is that
the cap of Latvia has doubled to 6 million EUA annually, according to the most recent
changes in the CITL (Table 1).5 The methodology and the transparency on the cap of
the EU ETS will increase significantly from 2013 onwards because the total cap will no
longer result from decentralized cap-setting in National Allocation Plans by the partici-
pating countries. From the start of the second trading period (2008-2012) the EU-wide
cap is centrally set by European legislation. This new cap-setting approach is based on
the EU-wide cap for the second period (expressed as the annual average of the re-
spective number of allowances) and a linear reduction factor (LRF). The linear reduc-
tion factor is applied to the cap level at the midpoint of the second trading period to
calculate a fixed number of allowances which is annually deducted from the cap for the
previous year. This annual deduction is also applied mathematically for the second half
of the second trading period but first takes effect in 2013. It is worth mentioning that the
EU ETS Directive as the legislative basis for the EU ETS does not specify any endpoint
for the application of the linear reduction factor and the linear reduction factor provides
long-term visibility of the emission reduction targets to be implemented by the EU ETS.
Although this general approach is complemented by some special provisions, e.g. for
installations which fall under the scope of the EU ETS from the beginning of the third
trading period, the transparency of the cap should significantly increase from 2013 on-
wards because the European Commission has to explicitly publish the respective cap
amounts.
For the analysis presented in this paper, the following approach was taken to specify
the cap: In order to not overestimate the cap from 2013 onwards the quantity of EUAs
stated in the NAP table decisions are taken as the average cap in the second trading
period of the EU ETS. This cap is reduced annually by a fixed amount of allowances
consistent to the linear reduction factor of 1.74 % annually in accordance with recent
4 CITL; Nap Info; Search; Country; First Commitment Period; History of the NAP; Total in
NAP. http://ec.europa.eu/environment/ets/napMgt.do?languageCode=en. 5 However, the total cap derived from the CITL data is likely to overestimate the cap because
in some cases governments (e.g. in Austria) bought allowances from the market to replenish the reserve for the free allocation to new entrants (new entrant reserve). In this case the EUAs are recorded twice in the CITL. On the one hand allowances are accounted for when they are initially issued (or auctioned/sold); on the other hand the allowances are recorded in the CITL when they are bought by governments and are issued to new entrants.

Strengthening the EU ETS Öko-Institut (Institute for Applied Ecology)
- 20 -
legislation. The respective cap from 2013 onwards has been published by DG Clima
(CEC 2010c and CEC 2010d) but it is important to note that this cap-setting is not the
final one. The most recent calculation of the cap (CEC 2010d) does not include allow-
ances from new entrant reserves that have not yet been allocated. This means that the
cap level published up to now is a preliminary one and it is very likely that it will be in-
creased in order to take into account allocations or auctions and sales from new en-
trant reserves.
Table 2 Comparison of approaches to quantify the cap for the third trading period
of the EU ETS (scope of the second period), 2013-2020
Total
average 2013 2014 2015 2016 2017 2018 2019 2020 2013-2020
Cap decision 2,039 1,932 1,897 1,861 1,826 1,790 1,755 1,719 1,684 14,464
Own calculation 2,077 1,968 1,932 1,896 1,860 1,824 1,788 1,751 1,715 14,734
Difference 38 36 35 35 34 33 33 32 31 269
2nd period 3rd trading period
Note: Own caculation is based on CITL data.
mln EUA
Source: CEC (2010b+d), calculations by Öko-Institut
Table 2 compares the cap from 2013 onwards for installations that already participated
in the second trading period (EU ETS II scope), including installations that opted-in to
the EU ETS in the second period (not including EUAs attributed to the non-EU coun-
tries Norway and Liechtenstein). The data compilation illustrates that compared to the
most recent cap decision it is likely that the final cap for the second and third trading
periods will increase by up to 38 million EUA per year.
Table 3 indicates the cap data estimates for the EU ETS from 2013 onwards which
were used for the analysis. It should be highlighted that the analysis must reflect the
fact that the scope of the EU ETS changes over time (increasingly broadening the
scope of stationary sources as well as the inclusion of new sectors like aviation). In
detail the cap estimates are based on the following data and assumptions:
The cap data for stationary installations already participating in the second trad-
ing period from 2008 to 2012 (Stationary ETS II scope) are taken from Table 2
(the “own calculation” column).
The quantity of allowances available for stationary installations participating
from the third trading period onwards (Stationary ETS III scope) is based on
CEC (2010d).
The quantity of allowances available for Norway and Liechtenstein is based on
a multiplication of the linear factor and the cap for the second trading period as
documented in Table 1.
The cap for aviation (which is included in the EU ETS from 2012 onwards) is
based on EEA JC (2011) and includes flights starting from or landing in the EU-
27, Iceland, Norway and Liechtenstein. It should be noted that the sub-cap for
Öko-Institut (Institute for Applied Ecology) Strengthening the EU ETS
- 21 -
aviation is not subject to an annual adjustment by the linear reduction factor and
remains constant in accordance with recent legislation.
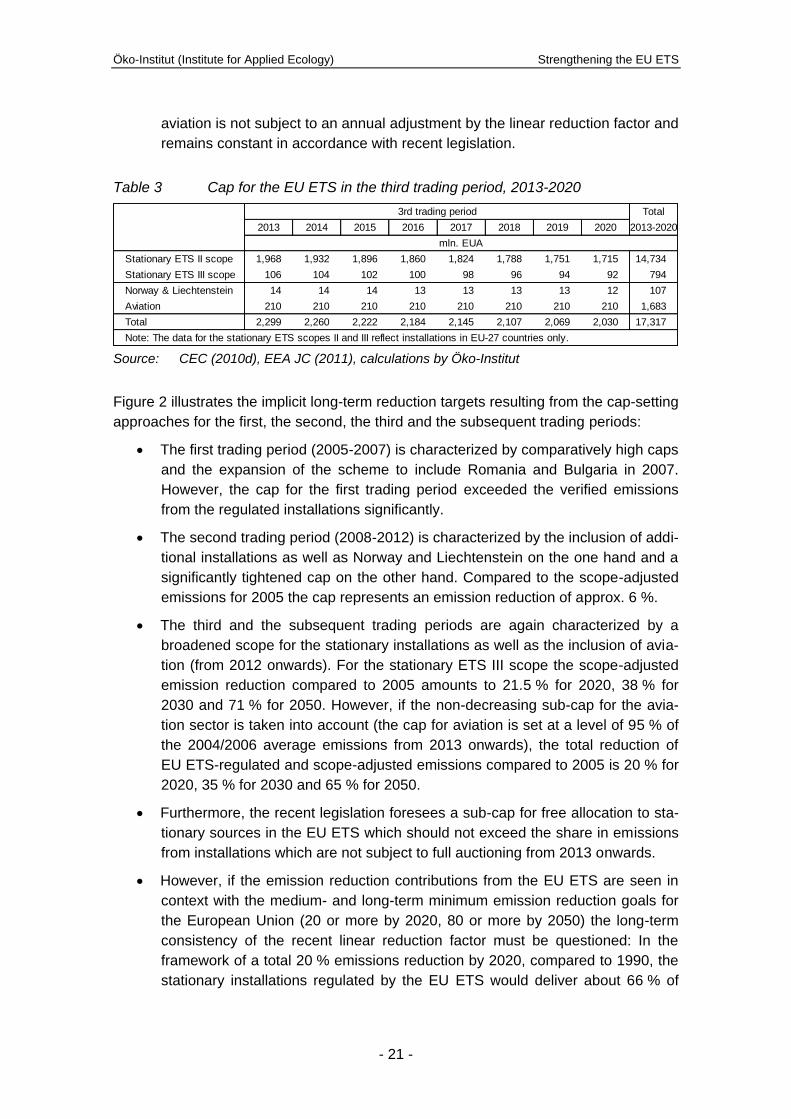
Table 3 Cap for the EU ETS in the third trading period, 2013-2020
Total
2013 2014 2015 2016 2017 2018 2019 2020 2013-2020
Stationary ETS II scope 1,968 1,932 1,896 1,860 1,824 1,788 1,751 1,715 14,734
Stationary ETS III scope 106 104 102 100 98 96 94 92 794
Norway & Liechtenstein 14 14 14 13 13 13 13 12 107
Aviation 210 210 210 210 210 210 210 210 1,683
Total 2,299 2,260 2,222 2,184 2,145 2,107 2,069 2,030 17,317
3rd trading period
Note: The data for the stationary ETS scopes II and III reflect installations in EU-27 countries only.
mln. EUA
Source: CEC (2010d), EEA JC (2011), calculations by Öko-Institut
Figure 2 illustrates the implicit long-term reduction targets resulting from the cap-setting
approaches for the first, the second, the third and the subsequent trading periods:
The first trading period (2005-2007) is characterized by comparatively high caps
and the expansion of the scheme to include Romania and Bulgaria in 2007.
However, the cap for the first trading period exceeded the verified emissions
from the regulated installations significantly.
The second trading period (2008-2012) is characterized by the inclusion of addi-
tional installations as well as Norway and Liechtenstein on the one hand and a
significantly tightened cap on the other hand. Compared to the scope-adjusted
emissions for 2005 the cap represents an emission reduction of approx. 6 %.
The third and the subsequent trading periods are again characterized by a
broadened scope for the stationary installations as well as the inclusion of avia-
tion (from 2012 onwards). For the stationary ETS III scope the scope-adjusted
emission reduction compared to 2005 amounts to 21.5 % for 2020, 38 % for
2030 and 71 % for 2050. However, if the non-decreasing sub-cap for the avia-
tion sector is taken into account (the cap for aviation is set at a level of 95 % of
the 2004/2006 average emissions from 2013 onwards), the total reduction of
EU ETS-regulated and scope-adjusted emissions compared to 2005 is 20 % for
2020, 35 % for 2030 and 65 % for 2050.
Furthermore, the recent legislation foresees a sub-cap for free allocation to sta-
tionary sources in the EU ETS which should not exceed the share in emissions
from installations which are not subject to full auctioning from 2013 onwards.
However, if the emission reduction contributions from the EU ETS are seen in
context with the medium- and long-term minimum emission reduction goals for
the European Union (20 or more by 2020, 80 or more by 2050) the long-term
consistency of the recent linear reduction factor must be questioned: In the
framework of a total 20 % emissions reduction by 2020, compared to 1990, the
stationary installations regulated by the EU ETS would deliver about 66 % of

Strengthening the EU ETS Öko-Institut (Institute for Applied Ecology)
- 22 -
the total required emissions reduction from 2005 to 2020. Aviation would deliver
about 1 % and the non-ETS sectors 33 %.
For an 80 % emission reduction by 2050 the EU ETS would deliver only 40 % of
the necessary emission reduction from 2005 to 2050. If the 2020 target would
be tightened to 30 % and the cap of the EU ETS, i.e. the linear reduction factor
would not be subject to change, the EU ETS would only deliver about 38 % of
the necessary emission reduction. Aviation would contribute less than 1 % and
the non-ETS sectors 60 % of the total emission reduction.
Figure 2 Evolution of the caps for the EU ETS, 2005-2050
0
500
1,000
1,500
2,000
2,500
3,000
2005 2010 2015 2020 2025 2030 2035 2040 2045 2050
mln
EU
A
EU ETS cap 1st period
EU ETS cap 2nd period
EU ETS cap 3rd+ periods (LRF 1.74%)
Sub-cap for free allocation (LRF 1.74%)
Sub-cap aviation
1st 2nd Period 3rd Period 4th+ Periods
Source: CEC 2010b, EU 2009a, calculations by Öko-Institut
Consequently the debate on EU ETS caps must focus on the short- and medium-term
aspects (cf. chapter 3 to 6) as well as the longer-term consistency (cf. chapter 7).

Öko-Institut (Institute for Applied Ecology) Strengthening the EU ETS
- 23 -
3 The recent problem: Allowance surplus from 2008 to
2011
3.1 Introduction, scope and structure of the analysis
The analysis presented in the following chapters focuses on the surplus of allowances
which occurred from 2008 to 2011. For this period a consistent set of historical data is
available for the EU ETS. The analysis does not reflect the respective data from the
first trading period of the EU ETS because banking was not allowed from the pilot peri-
od (2005-2007) to the second trading period (2008-2012) and is consequently not rele-
vant for the surplus analysis.
The specification of the surplus for the period from 2008 to 2011 is based on the follow-
ing analysis:
1. The trends of verified emissions in the EU ETS specify the demand for emis-
sions allowances by the regulated entities (cf. chapter 3.2).
2. The supply of emissions allowances or substitutes arises from different sources
which are documented separately:
a. A major share of emissions allowances were made available by free al-
location to the operators of the respective installations (cf. chapter 3.3).
b. Some allowances were supplied by auctions or government sales at
market prices (cf. chapter 3.4);
c. The operators were entitled to use a certain amount of lower-priced
emissions reduction credits from the Clean Development Mechanism
(CDM) and Joint Implementation (JI) as a substitute for EU emission al-
lowances (cf. chapter 3.5).
The comparison of demand and supply (cf. chapter 3.6) allows the surplus accumulat-
ed by the end of 2011 and its pattern to be specified.
3.2 Trend of verified emissions in the EU ETS for 2008 to 2011
Data on verified emissions is available from the Community Independent Transaction
Log (CITL) on an installation level. Data on an aggregated level is published by the
European Environment Agency (EEA) in its EU ETS Dataviewer (EEA 2012).
In its current scope the EU ETS covers the 27 EU Member States, Norway and Liech-
tenstein. Verified emissions of all installations covered by the EU ETS were 2,123 mil-
lion tons of carbon dioxide (t CO2) in the year 2008. Due to the economic crisis emis-
sions dropped to 1,888 million t CO2 in the year 2009 and recovered to a level of 1,939
million t CO2 in the year 2010 (EEA 2012). In 2011 emissions decreased again to a
level of 1,903 million t CO2.

Strengthening the EU ETS Öko-Institut (Institute for Applied Ecology)
- 24 -
3.3 Free allocation for 2008 to 2011
Data on free allocation is also available from the Community Independent Transaction
Log (CITL) on an installation level. Data on an aggregated level is published by the
European Environmental Agency (EEA) in its EU ETS Dataviewer (EEA 2012).
Free allocation as recorded in the EU ETS Dataviewer was 1,961 million t CO2 in the
year 2008, increasing to 1,976 million t CO2 in the year 2009, 1,998 million t CO2 in the
year 2010 and 2,001 million t CO2 in the year 2011.
3.4 Auctions and sales for 2008 to 2011
Data on auctioned or sold volumes of EUAs are not provided by the CITL or by another
comprehensive data compilation. However, Member States generally publish the
amount of allowances which were brought to the market by auctions or sales. In addi-
tion, the website of DG Clima also keeps track of the amount of EUAs auctioned by
Member States.
Based on the data compiled by EEA (2012) the amount of EUAs auctioned or sold in
2008 was 45 million EUAs, exclusively from Germany and the UK. In 2009 this volume
increased to nearly 80 million EUAs in 2009, 92 million EUAs in 2010 and 83 million
EUAs in 2011. However, in some Member States auctions or sales were planned but
the set-up of auctions and sales was and is still delayed.
3.5 Use of CDM and JI credits from 2008 to 2011
Data on the amount of CDM and JI credits surrendered by operators is recorded and
published by the Community Independent Transaction Log (CITL) on an installation
level. Data on an aggregated level is published by the European Environmental Agency
(EEA) in its EU ETS Dataviewer (EEA 2012). In the years 2008 to 2011 operators cov-
ered by the EU ETS surrendered a total of 456 million offset credits from the CDM
(Certified Emissions Reduction Units – CER) and a total of 99 million emission reduc-
tion units from JI (Emission Reduction Units – ERU) to the competent authorities. Total
use of flexible mechanisms equals to 556 million CERs and ERUs in the four years
from 2008 to 2011.
3.6 Demand and supply balance for 2008 to 2011
Table 4 compares the amount of EUAs, CERs and ERUs available in the years 2008 to
2011 with the verified emission data for this period. In 2009, 2010 and 2011 the verified
emissions were lower than the free allocation to operators. As EUAs were auctioned on
top and operators used CERs and ERUs to cover their emissions a significant surplus
of EUAs has been accumulated.

Öko-Institut (Institute for Applied Ecology) Strengthening the EU ETS
- 25 -
Table 4 Surplus of allowances in the EU ETS, 2008-2011
Total
2008 2009 2010 2011 2008-2011
1,961 1,976 1,998 2,001 7,938
45 79 92 83 300
83 81 137 255 556
2,090 2,137 2,227 2,340 8,793
2,123 1,882 1,939 1,903 7,846
-33 255 289 436 947
-33 222 510 947Cumulated surplus
2nd trading period
Free allocation
Auctions and sales
CDM & JI
Total available units
Verified emissions
Surplus
mln EUA, CER, ERU or t CO2
Source: Calculations by Öko-Institut
The cumulated surplus of EUAs at the end of 2011 was nearly 1,000 million units. The
major share of this surplus (556 million EUAs) can be attributed to the fact that opera-
tors were allowed to surrender CERs and ERUs despite the fact that verified emissions
were below the available amount of EUAs.
The rest of the surplus (about 400 million EUAs) stems from the reduced emissions in
the years 2009 to 2011. This can mainly be attributed to the economic crisis during this
period.

Strengthening the EU ETS Öko-Institut (Institute for Applied Ecology)
- 26 -
4 The future challenge: Projection for the EU ETS surplus
until 2020
4.1 Introduction, scope and structure of the analysis
In contrast to the period from 2008 to 2011 no historical data can be used to specify the
potential surplus of allowances for the period from 2012 onwards and a projection for
the supply and demand must be developed.
1. The key determinant on the demand side is the baseline projection for emis-
sions regulated by the EU ETS. With respect to the baseline, three aspects are
of special importance: firstly the underlying assumptions on economic growth as
a key driver for greenhouse gas emissions, secondly the penetration of renew-
able energies as well as energy savings as a result of complementary policies
to the EU ETS and thirdly the effects of the extended scope of the EU ETS from
2013 onwards (cf. chapter 4.2).
2. The supply side for allowances and offset credits is analysed in respect of the
different sources of supply:
a. The decreasing share of free EUA allocation to the operators of the
regulated installations (cf. chapter 4.3);
b. The increasing share of allowances supplied at market prices via auc-
tions (cf. chapter 4.4);
c. The qualitatively and quantitatively restricted supply of offset credits
from the CDM or JI at prices lower than for EUAs (cf. chapter 4.5);
d. The free allocation to eligible new entrants from the new entrant re-
serve (cf. chapter 4.6).
The compilation of all sources for demand and supply enables an integrated projection
for the balance of demand and supply from 2012 to 2020 (chapter 4.7).
4.2 Baseline emission trends for the EU ETS from 2012 to 2030
The emission reduction effort within the EU ETS results from the difference of the
emission levels in a baseline trend and the cap. The baseline scenario is the counter-
factual scenario of what would occur in a regulatory environment without a price on
greenhouse gas emissions. Key determinants for the baseline emission trend in the
sectors regulated by the EU ETS are:
the demographic and economic trends as essential driving forces;
the energy and investment costs as significant factors influencing energy supply
and demand patterns; and

Öko-Institut (Institute for Applied Ecology) Strengthening the EU ETS
- 27 -
the general regulatory framework and complementary instruments to the EU
ETS, especially separate support schemes for renewable energies and energy
efficiency.
The cap definition for the EU ETS from 2013 onwards was based on an integrated
analysis for the 2008 climate and energy package of the European Union (Capros et al.
2008) which reflected both the overarching greenhouse gas emission reduction targets
for the EU as well as the plans to increase the share of renewable energy sources in
the energy mix and particularly in the power sector.
Figure 3 Comparison of GDP projections for ETS-relevant modelling exercises for
the European Union, 2005-2030
80%
90%
100%
110%
120%
130%
140%
150%
160%
170%
180%
2000 2005 2010 2015 2020 2025 2030 2035
20
05
= 1
00
%
EU Energy & Climate Package analysis (2008)
EU Energy Roadmap 2050 analysis (2011)
1.8...2% GDP growth from 2014
1.5% GDP growth from 2014
Historical data
-14%
-13%
-19%
-17%
Source: Eurostat, European Commission, calculations by Öko-Institut
However, some of the assumptions for the integrated modelling exercise carried out in
2008 no longer reflect the real trends for some key determinants of the baseline sce-
nario.
First of all, the short-, medium- and long-term economic outlook for the EU-27 has
changed significantly since 2008. Figure 3 indicates a range of projections for the de-
velopment of the gross domestic product (GDP), the key indicator for economic activi-
ties in a country or region.
For the modelling exercises on the EU energy and climate package in 2008 the
assumption for GDP growth from 2005 to 2030 amounted to an increase of ap-
prox. 43 % by 2020 and 71 % by 2030;

Strengthening the EU ETS Öko-Institut (Institute for Applied Ecology)
- 28 -
For the numerical analysis on the EU Energy Roadmap 2050 in 2011 (CEC
2011d) the modelling assumption was a total GDP growth from 2005 to 2020 of
approx. 28 % by 2020 and 52 % by 2030;
With respect to the most recent developments and trends two additional vari-
ants were analysed, the return to an annual of growth of 1.8 to 2.0 % during the
next two decades and a rather slow economic growth of about 1.5 % annually,
which results in a total GDP growth of approx. 17 to 21 % by 2020 and 38 to
48 % by 2030.
As a result, the total economic activity represented by GDP will be 14 to 17 % lower by
2020 and 13 to 19 % lower by 2030 than assumed in the analysis for the 2008 EU en-
ergy and climate package and thus for the cap of the EU ETS. Such changes for one of
the major driving forces for the baseline emission trend must result in a major change
of the emission reduction effort built into the cap of the EU ETS.
Furthermore, the massive support of renewable energy sources (RES) in the frame-
work of the 2008 EU energy and climate package could have a major impact on the
respective emission reduction efforts to be delivered by the EU ETS. For renewable
energy the following dimensions must be considered:
In terms of the EU ETS the EU-wide target for the expansion of renewable en-
ergies will mainly have an effect on the power generation from renewable ener-
gy sources; the share of renewables in the heat and transport market is of much
less or of no significance for the installations regulated by the EU ETS.
When the modelling for the 2008 EU energy and climate package was conduct-
ed, the analysis was based on certain assumptions for the power generation
from renewable energy sources. Subsequently and within the framework of the
EU Directive on Renewable Energies (EU 2009c) the Member States developed
National Renewable Energy Action Plans (NREAP) which include sectoral tar-
gets and projections for the different sectors. The deployment trends and tar-
gets for the renewable energies are not necessarily consistent with the underly-
ing assumptions of the 2008 modelling exercises.
Last but not least, the historical data for the development of renewable energies
in the power sector must not necessarily fit into the projections in terms of levels
and structures of RES deployment.
In order to make the data comparable for the purpose of the analysis presented in this
paper, the power generation from different renewable energy sources was transformed
into avoided CO2 emissions based on the following assumptions6:
Power generation from solar energy was assumed to substitute natural gas-
fired power plants;
6 These assumptions are in line with our own modelling exercises as well as the respective
literature (ISI 2005+2009).

Öko-Institut (Institute for Applied Ecology) Strengthening the EU ETS
- 29 -
Power generation from hydro, biomass, geothermal heat and ocean energy was
assumed to substitute hard coal-fired power plants; and
Power generation from wind energy was assumed to substitute a mix of hard
coal-fired plants (75 %) and natural gas-fired power plants (25 %).
Figure 4 Comparison of CO2 emission abatement contributions from renewable
energy sources in the power sector for the EU, 2005-2020
0
200
400
600
800
1,000
1,200
1,400
2005 2010 2015 2020 Integratedpackage
Baseline Integratedpackage
Baseline
Historical data NREAP (2011) 2020 projection (2008) 2030 projection (2008)
mln
t C
O2
Geothermal
Solar & ocean
Wind
Biomass
Hydro
Source: Eurostat, European Commission, calculations by Öko-Institut
Figure 4 provides an overview of the RES deployment trends in the EU power sector
from the three data sources mentioned above:
The data indicate that the trend of historical data is all in all consistent with the
projections submitted by the Member States in the National Renewable Energy
Action Plans (NREAP) in 2011 (EEA 2011).
The 2008 modelling for the EU energy and climate package and its integrated
targets for greenhouse gas emission reduction, the revision of the EU ETS and
the deployment of renewable energy sources for 2020 indicate that the effects
of an increased support for renewable energy sources are significant in terms of
CO2 emission abatement.7
7 For the modelling of the “Integrated package” projection a broad range of policies and
measures was considered while the “Baseline” modelling describes a projection in absence of these new policies and measures at EU level. The “Integrated package” projection refers to the CSE scenario in the documentation of the modelling exercise (Capros et al. 2008) and the “Baseline” projection refers to the respective baseline case.
Strengthening the EU ETS Öko-Institut (Institute for Applied Ecology)
- 30 -
However, the result of this analysis shown in Figure 4 underlines that the projections
submitted by the EU Member States in their NREAPs represent in total a level of CO2
emission abatement which only differs slightly (approx. 40 Mt CO2 or 5 % in 2020) from
the assumptions for the 2008 modelling exercise conducted for the integrated energy
and climate package, which was also the basis for the cap setting within the EU ETS
from 2013 onwards. However, the data compilation also shows that the pattern of RES
deployment differs significantly (the NREAPs present a much more significant role of
wind and solar energy and a significantly lower share of biomass), but due to the differ-
ent substitution patterns this does not result in a major difference in emission abate-
ment effects by RES which would be relevant for the cap assessment.
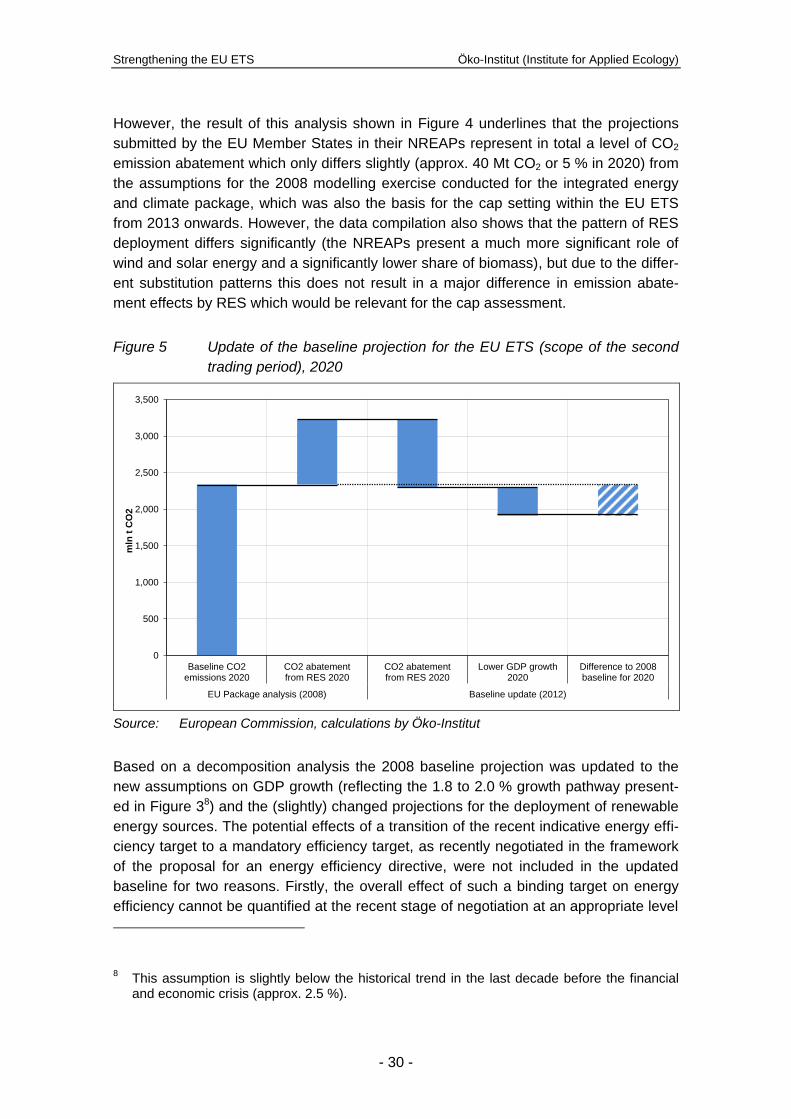
Figure 5 Update of the baseline projection for the EU ETS (scope of the second
trading period), 2020
0
500
1,000
1,500
2,000
2,500
3,000
3,500
Baseline CO2emissions 2020
CO2 abatementfrom RES 2020
CO2 abatementfrom RES 2020
Lower GDP growth2020
Difference to 2008baseline for 2020
EU Package analysis (2008) Baseline update (2012)
mln
t C
O2
Source: European Commission, calculations by Öko-Institut
Based on a decomposition analysis the 2008 baseline projection was updated to the
new assumptions on GDP growth (reflecting the 1.8 to 2.0 % growth pathway present-
ed in Figure 38) and the (slightly) changed projections for the deployment of renewable
energy sources. The potential effects of a transition of the recent indicative energy effi-
ciency target to a mandatory efficiency target, as recently negotiated in the framework
of the proposal for an energy efficiency directive, were not included in the updated
baseline for two reasons. Firstly, the overall effect of such a binding target on energy
efficiency cannot be quantified at the recent stage of negotiation at an appropriate level
8 This assumption is slightly below the historical trend in the last decade before the financial
and economic crisis (approx. 2.5 %).

Öko-Institut (Institute for Applied Ecology) Strengthening the EU ETS
- 31 -
of uncertainty. Secondly, and more importantly, it is rather impossible at the current
stage to translate the emerging additional energy efficiency efforts in additional green-
house gas emission abatement for the sources regulated by the EU ETS, especially
the electricity generation sector.
Therefore, the updated baseline assumes no further changes in energy and carbon
intensity (with the exception of the respective effects of renewable energies) and repre-
sents a difference to the originally used baseline of about 425 Mt CO2 for 2020 which
results essentially from the lower GDP growth assumptions and is significant with re-
spect to an assessment of the EU ETS cap.
Furthermore, the projection for the emissions from aviation was updated, considering
the different system boundaries of the aviation sector in energy balances and emission
inventories on the one hand and the scope of the EU ETS with respect to aviation. The
updated projection is based on the average emissions from 2004 to 2006 (220 Mt
CO2), which form the basis for the aviation-specific part of the cap in the EU ETS. The
projection for the emissions from aviation is based on this 2005 emission level and the
growth rates for the final energy use by aviation from the modelling exercise for the EU
Energy Roadmap 2050, which represents the most recent EU-wide trends for aviation
(CEC 2011d).
Figure 6 Comparison of historical CO2 emissions data and baseline projections
for the EU ETS (scope of the second period and aviation), 2005-2030
0
500
1,000
1,500
2,000
2,500
3,000
Baseline2008
Historicaldata
Historicaldata
Historicaldata
Baseline2008
Update2012
Baseline2008
Update2012
2005 2010 2011 2020 2030
mln
t C
O2
Aviation
Stationary ETS sectors (3rd period scope)
Source: European Commission, calculations by Öko-Institut
Figure 6 summarizes the historical data and the updated baseline projections for the
sectors regulated by the EU ETS for the scope of the second trading period as well as
the aviation sector which falls in the scope of the EU ETS since 2012. For the station-
Strengthening the EU ETS Öko-Institut (Institute for Applied Ecology)
- 32 -
ary part of the EU ETS the counterfactual (reflecting the updated GDP growth assump-
tions as well as the updated emission abatement from RES) is an emissions trend
which increases slightly over time but remains more or less at emission levels which
were observed during the last few years. The difference to the baseline trends used for
the definition of the cap from 2013 onwards amounts to 385 Mt CO2 in 2020 and 365
Mt CO2 in 2030 which equals a 16 % reduction. This significant reduction of the base-
line levels is partly compensated by an increased baseline assumption for the aviation
sector (+67 Mt CO2 in 2020 and +38 Mt CO2 in 2030). However, with respect to the fact
that the cap for aviation was derived separately and is based on data which have no
direct link to the 2008 modelling of the baseline, the offsetting effects of the increased
aviation baseline are not relevant for the assessment of the 2008 baseline assump-
tions.
Last but not least, emissions from new sectors will fall under the scope of the EU ETS
in 2013 (e.g. N2O from industrial gases, PFC from Aluminium and others). The starting
point for specifying the respective increase of the cap is 107 million EUA in 2013, which
reflects the fact that the UK, the Netherlands, Austria, Italy and Norway already opted
in their nitric acid and adipic acid production during the second trading period of the EU
ETS.
According to Article 9a (2) of the revised EU ETS Directive Member States had to notify
verified emissions of new installations entering the EU ETS from 2013 to determine the
increase of the cap. For non-CO2 gases Member States were allowed to “notify a lower
amount of emissions according to the reduction potential of those installations” (Article
9a (2)). Unfortunately there is no information available on the extent to which Member
States took the reduction potential into account when the cap increase for nitric acid
and adipic acid production was determined.
Recently implemented or announced JI projects for the abatement of N2O within the EU
have resulted in impressive emission reductions which are part of the baseline because
they were mainly triggered by non-ETS policies. Therefore, it can be expected that
emissions from nitric acid and adipic acid production will be drastically reduced in the
third trading period of the EU ETS. In 2008 N2O emissions from nitric acid and adipic
acid production was 33 million tons of carbon dioxide equivalent (t CO2e) in the EU-27
without installations opted in by the Netherlands and Austria (ETC/ACC 2010). Based
on data from ETC/ACC (2010) the emission reduction could be as high as 30 million t
CO2e in the years from 2013 onwards compared to emissions in the year 2008. If
Member States have taken this reduction potential into account, there will be no sur-
plus from installations entering the EU ETS from 2013 onwards. If Member States have
not taken this reduction potential into account, the annual surplus could be 30 million
EUA. It is assumed that half of the reduction potential was taken into account. Thus
emissions are estimated at a level of 91 million EUA for the years 2013 to 2020 (de-
ducting 15 million EUA from the level of 107 million EUA mentioned above).

Öko-Institut (Institute for Applied Ecology) Strengthening the EU ETS
- 33 -
Table 5 Updated baseline emission trends for the EU ETS sectors, 2005-2030
2005 2010 2011 2012 2013 2014 2015 2020 2025 2030
Stationary ETS II scope 2,230 1,939 1,903 1,892 1,886 1,898 1,912 1,954 1,954 1,954
Stationary ETS III scope - - - - 91 91 91 91 91 91
Aviation 221 - - 239 245 251 257 285 295 293
Total - - - - 2,222 2,240 2,260 2,330 2,340 2,338
mln t CO2e
Note: Due to the different scope of the EU ETS (stationary sources, aviation) no totals are given for the years before 2013. Source: Calculations by Öko-Institut
Table 5 summarizes the updated baseline emission trends for the different scopes of
the EU ETS. The total emissions in the baseline increase by 50 million t CO2 for sta-
tionary installations and by 54 million in the aviation sector by 2020 compared to the
current emission level (2011/2012). For 2030 the baseline emissions are almost con-
stant compared to the 2020 levels.
4.3 Free allocation from 2012 to 2020
As a starting point it is assumed that the free allocation for the year 2012 will be equal
to the free allocation in the year 2011. Thus free allocation would be 2,001 million t CO2
in the year 2012.
Table 6 Amount of free allocation, 2008-2020
Total
2008 2009 2010 2011 2012 2013 2014 2015 2020 2008-2020
Stationary ETS II scope 1,961 1,976 1,998 2,001 2,001 820 799 778 639 15,839
Stationary ETS III scope 77 77 77 72 607
Aviation 183 179 179 179 179 1,613
Power generators EU-12 221 190 158 0 885
Total 1,961 1,976 1,998 2,001 2,184 1,297 1,244 1,192 890 18,943
mln EUA
2nd trading period 3rd trading period
Source: Calculations by Öko-Institut
From 2013 onwards auctioning will be the rule for electricity generation. Free allocation
in the industrial sector and for heat generation will be based on benchmarks. Based on
Öko-Institut’s ARRA-Model9 the free allocation for installations that already participated
in the second trading period of the EU ETS will decrease from 820 million EUA in 2013
to 639 million EUA in 2020. According to Article 10c of the EU ETS Directive (EU
2009a) some (mainly eastern European) Member States can allocate free allowances
for electricity generators. Only the decisions for Cyprus, Estonia and Lithuania have
9 ARRA stands for Auctioning Revenues and Redistribution Analysis; the model provides pro-
jections for free allocation and auctioning revenues at the level of EU Member States.

Strengthening the EU ETS Öko-Institut (Institute for Applied Ecology)
- 34 -
been published (CEC 2012). Therefore, the free allocation to electricity generators in
the EU-12 was estimated (Table 6).10
Table 7 Amount of free allocation from the new entrant reserve, 2013-2020
Total
2013 2014 2015 2016 2017 2018 2019 2020 2013-2020
Stationary ETS II scope 13 25 38 51 64 76 89 102 457
Stationary ETS III scope 1 1 2 3 3 4 5 5 24
Total 13 27 40 54 67 80 94 107 482
mln EUA
3rd trading period
Source: Calculations by Öko-Institut
Additionally there will be free allocation to new entrants from industrial sectors from the
new entrant reserve. The total size of the new entrant reserve is 5 % of the cap for sta-
tionary installations. This equals 782 million EUA for the period from 2013 to 2020. Of
this total 300 million EUA will be auctioned to finance CCS and innovative renewable
projects. As a result 482 million EUA are available that can be allocated to new en-
trants for free (Table 7).
4.4 Auctions and sales from 2012 to 2020
In the year 2012 auctions and sales can be assessed based on the publication of auc-
tions on the DG Clima website or announcements by the member states. To calculate
the amount of auctions from 2013 onwards the free allocation and the new entrant re-
serve is deducted from the cap. In the aviation sector 15 % of the cap will be auctioned,
leading to annual auctions of 32 million units.
Of the new entrant reserve – equaling 5 % of the cap – 300 million EUAs will be auc-
tioned or sold to finance CCS and innovative renewable energy projects. A first tranche
of 200 million EUAs will already be auctioned or sold by October 2012 (CEC/EIB 2010).
However, as these allowances can only be used from 2013 onwards they are attributed
to the auctions and sales in 2013 (Table 8).
10
It is assumed that in 2013 allowances equal to 70 % of historic emissions in the power sector are allocated for free. This percentage decreases linearly to 10 % in 2019, leading to no free allocation to the power sector in 2020. In its guidance document (CEC 2011f) the European Commission has allowed slight deviations from the rule that free allocation has to decrease linearly. However, the assessment of decision for Cyprus, Estonia and Lithuania shows that for these countries deviations from the rule that free allocation has to decrease linearly are rather low. It will be necessary to update the estimated free allocation for power generation once all decisions are published.

Öko-Institut (Institute for Applied Ecology) Strengthening the EU ETS
- 35 -
Table 8 Amount of allowance auctions and sales, 2008-2020
Total
2008 2009 2010 2011 2012 2013 2014 2015 2020 2008-2020
Stationary ETS II scope 45 79 92 83 72 1,064 1,050 1,036 1,003 8,571
Stationary ETS III scope 24 22 20 16 147
Aviation 32 32 32 32 32 285
NER phase III auctions 300
Power generators EU-12 -221 -190 -158 0 -885
Total 45 79 92 83 105 898 914 929 1,050 8,118
2nd trading period 3rd trading period
mln EUA
Source: Calculations by Öko-Institut
Auctioning quantities are calculated as the difference between the cap and the free
allocation. As free allocation to electricity generation in the Central and Eastern Mem-
ber States decreases over time the total amount of EUAs available for auctioning in-
creases from 898 million EUAs in 2013 to 1,050 million EUAs in 2020.
4.5 Use of CDM and JI credits from 2012 to 2020
The total use of emission reduction credits from CDM or JI projects in the EU ETS for
the period from 2008 to 2020 is restricted in quantitative and qualitative terms. Article
11a paragraph 8 of the revised EU ETS Directive states that the overall use of these
credits shall not exceed 50 % of the reduction effort in the EU ETS compared to the
emissions in the year 2005 for the EU ETS scope II or compared to the emission levels
at the date of inclusion for further scope extensions of the EU ETS. This top-down
quantity restriction indicates an upper bound. The exact quantity of CDM or JI credits
(CERs or ERUs) that can be used by operators is regulated bottom-up on an installa-
tion level (Article 11a paragraph 8).
This provision sets the following rules for allocating the entitlements for the use of
CERs and ERUs to the operators:
All existing operators are allowed to use credits in the period 2008 to 2020 up to
the amount permitted to them in the second trading period according to the re-
spective provisions in the National Allocation Plans. Operators can also use the
left-overs from their entitlements for the second trading period in the third trad-
ing period. The National Allocation Plans for the second trading period define
the entitlements for the use of CERs and ERUs in general as a percentage of
the free allocation for each operator in the period 2008 to 2012. The exact per-
centage for each country is published in the NAP table decisions and varies
from 0 % in Estonia to 22 % in Germany. Based on the data on free allocation
from the CITL and the estimated allocation to new entrants (assuming that all
allowances from the new entrant reserve will be allocated for free) in the second
trading period the total allowance for the use of credits can be derived.
In some countries operators received comparatively low entitlements for the use
of CERs and ERUs for the second trading period (e.g. operators in the UK).
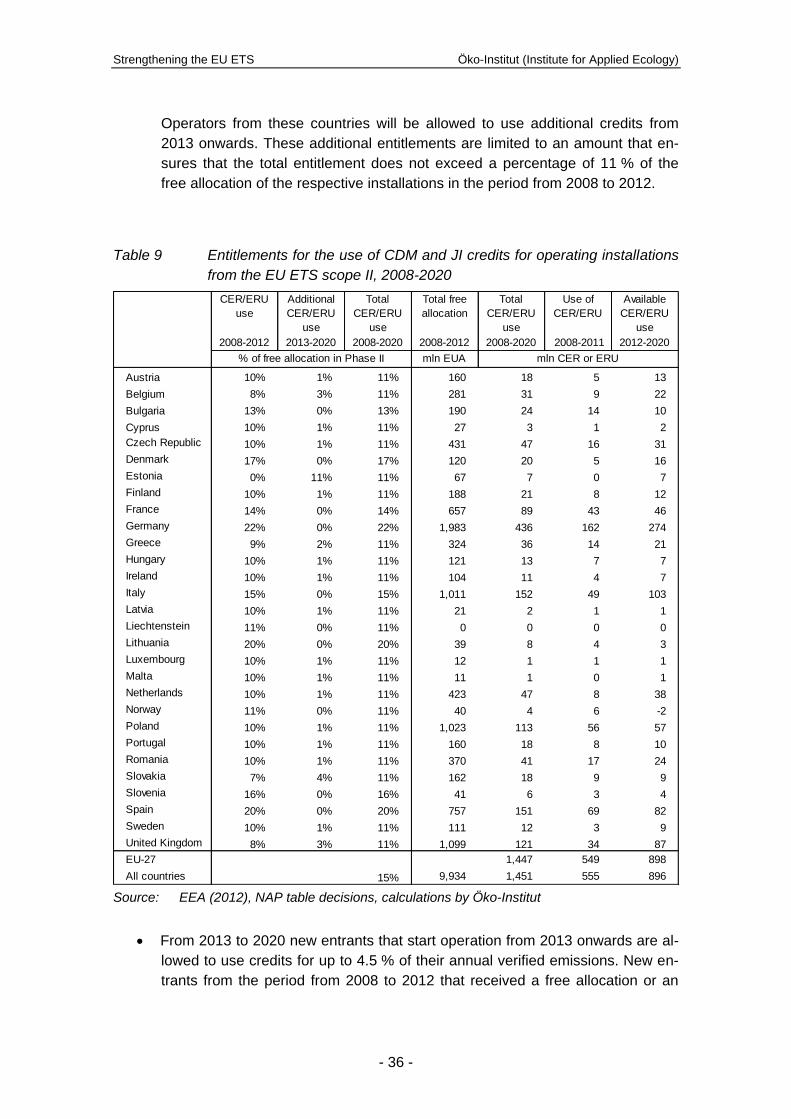
Strengthening the EU ETS Öko-Institut (Institute for Applied Ecology)
- 36 -
Operators from these countries will be allowed to use additional credits from
2013 onwards. These additional entitlements are limited to an amount that en-
sures that the total entitlement does not exceed a percentage of 11 % of the
free allocation of the respective installations in the period from 2008 to 2012.
Table 9 Entitlements for the use of CDM and JI credits for operating installations
from the EU ETS scope II, 2008-2020
CER/ERU
use
Additional
CER/ERU
use
Total
CER/ERU
use
Total free
allocation
Total
CER/ERU
use
Use of
CER/ERU
Available
CER/ERU
use
2008-2012 2013-2020 2008-2020 2008-2012 2008-2020 2008-2011 2012-2020
mln EUA
Austria 10% 1% 11% 160 18 5 13
Belgium 8% 3% 11% 281 31 9 22
Bulgaria 13% 0% 13% 190 24 14 10
Cyprus 10% 1% 11% 27 3 1 2
Czech Republic 10% 1% 11% 431 47 16 31
Denmark 17% 0% 17% 120 20 5 16
Estonia 0% 11% 11% 67 7 0 7
Finland 10% 1% 11% 188 21 8 12
France 14% 0% 14% 657 89 43 46
Germany 22% 0% 22% 1,983 436 162 274
Greece 9% 2% 11% 324 36 14 21
Hungary 10% 1% 11% 121 13 7 7
Ireland 10% 1% 11% 104 11 4 7
Italy 15% 0% 15% 1,011 152 49 103
Latvia 10% 1% 11% 21 2 1 1
Liechtenstein 11% 0% 11% 0 0 0 0
Lithuania 20% 0% 20% 39 8 4 3
Luxembourg 10% 1% 11% 12 1 1 1
Malta 10% 1% 11% 11 1 0 1
Netherlands 10% 1% 11% 423 47 8 38
Norway 11% 0% 11% 40 4 6 -2
Poland 10% 1% 11% 1,023 113 56 57
Portugal 10% 1% 11% 160 18 8 10
Romania 10% 1% 11% 370 41 17 24
Slovakia 7% 4% 11% 162 18 9 9
Slovenia 16% 0% 16% 41 6 3 4
Spain 20% 0% 20% 757 151 69 82
Sweden 10% 1% 11% 111 12 3 9
United Kingdom 8% 3% 11% 1,099 121 34 87
EU-27 1,447 549 898
All countries 15% 9,934 1,451 555 896
% of free allocation in Phase II mln CER or ERU
Source: EEA (2012), NAP table decisions, calculations by Öko-Institut
From 2013 to 2020 new entrants that start operation from 2013 onwards are al-
lowed to use credits for up to 4.5 % of their annual verified emissions. New en-
trants from the period from 2008 to 2012 that received a free allocation or an
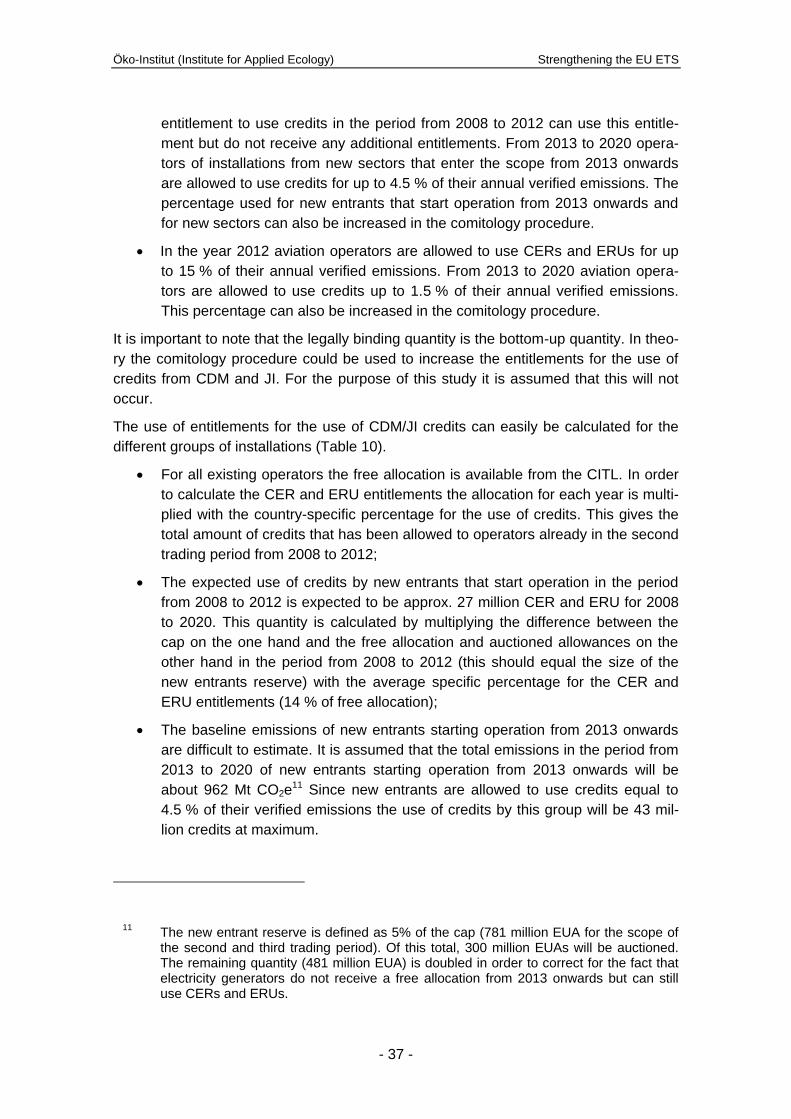
Öko-Institut (Institute for Applied Ecology) Strengthening the EU ETS
- 37 -
entitlement to use credits in the period from 2008 to 2012 can use this entitle-
ment but do not receive any additional entitlements. From 2013 to 2020 opera-
tors of installations from new sectors that enter the scope from 2013 onwards
are allowed to use credits for up to 4.5 % of their annual verified emissions. The
percentage used for new entrants that start operation from 2013 onwards and
for new sectors can also be increased in the comitology procedure.
In the year 2012 aviation operators are allowed to use CERs and ERUs for up
to 15 % of their annual verified emissions. From 2013 to 2020 aviation opera-
tors are allowed to use credits up to 1.5 % of their annual verified emissions.
This percentage can also be increased in the comitology procedure.
It is important to note that the legally binding quantity is the bottom-up quantity. In theo-
ry the comitology procedure could be used to increase the entitlements for the use of
credits from CDM and JI. For the purpose of this study it is assumed that this will not
occur.
The use of entitlements for the use of CDM/JI credits can easily be calculated for the
different groups of installations (Table 10).
For all existing operators the free allocation is available from the CITL. In order
to calculate the CER and ERU entitlements the allocation for each year is multi-
plied with the country-specific percentage for the use of credits. This gives the
total amount of credits that has been allowed to operators already in the second
trading period from 2008 to 2012;
The expected use of credits by new entrants that start operation in the period
from 2008 to 2012 is expected to be approx. 27 million CER and ERU for 2008
to 2020. This quantity is calculated by multiplying the difference between the
cap on the one hand and the free allocation and auctioned allowances on the
other hand in the period from 2008 to 2012 (this should equal the size of the
new entrants reserve) with the average specific percentage for the CER and
ERU entitlements (14 % of free allocation);
The baseline emissions of new entrants starting operation from 2013 onwards
are difficult to estimate. It is assumed that the total emissions in the period from
2013 to 2020 of new entrants starting operation from 2013 onwards will be
about 962 Mt CO2e11 Since new entrants are allowed to use credits equal to
4.5 % of their verified emissions the use of credits by this group will be 43 mil-
lion credits at maximum.
11
The new entrant reserve is defined as 5% of the cap (781 million EUA for the scope of the second and third trading period). Of this total, 300 million EUAs will be auctioned. The remaining quantity (481 million EUA) is doubled in order to correct for the fact that electricity generators do not receive a free allocation from 2013 onwards but can still use CERs and ERUs.

Strengthening the EU ETS Öko-Institut (Institute for Applied Ecology)
- 38 -
In order to make a conservative estimate for the use of credits by new sectors it
is assumed that the emissions of the new sectors entering the scope of the EU-
ETS will be reduced to a level of 91 Mt CO2e up to 2020. Since new sectors are
allowed to use credits equal to 4.5 % of their verified emissions the use of cred-
its by this group could be about 4 million CERs and ERUs annually.
In 2012 aviation operators are allowed to use credits for up to 15 % of their an-
nual verified emissions. From 2013 to 2020 aviation operators are allowed to
use credits up to 1.5 % of their annual verified emissions. Based on the as-
sumption that the emissions of the aviation sector will increase by 29 % by 2020
compared to 2005 (CEC 2011d) the allowed use of CDM/JI credits amounts to
68 million credits in the period from 2008 to 2020.
Table 10 Total entitlements for the use of CDM and JI credits, 2008-2020
2008-2020
mln CER or ERU
Stationary ETS II scope 1,522
of this existing installations 1,451
of this new entrants in phase II 27
of this new entrants in phase III 43
Stationary ETS III scope 33
Aviation 68
Total 1,622 Source: Calculations by Öko-Institut
The entitlements for the use of flexible mechanisms total more than 1,600 million CERs
and ERUs from 2008 to 2020 (Table 10). As 555 million CERs and ERUs have already
been surrendered by operators under the EU ETS in the four years from 2008 to 2011,
a further 1,065 million CERs and ERUs are available for surrender from 2012 to 2020.
4.6 New entrant reserve for the second trading period
Table 11 compares the cap in the second trading period with the amount of EUAs allo-
cated for free and auctioned or sold. A key finding from this comparison is that the total
cap for the second trading period from 2008 to 2012 is 185 million EUAs higher than
the amount of EUAs allocated for free and auctioned.
Table 11 Comparison of cap, free allocation, auctions and sales, 2008-2012
2008 2009 2010 2011 2012 total
Cap 2,099 2,099 2,099 2,099 2,099 10,496
Free allocation -1,961 -1,976 -1,998 -2,001 -2,001 -9,939
Auctions and Sales -45 -79 -92 -83 -72 -372
Difference (= reserves) 93 43 9 15 25 185
2nd trading period
mln EUA
Source: CITL, EEA (2012), calculations by Öko-Institut

Öko-Institut (Institute for Applied Ecology) Strengthening the EU ETS
- 39 -
The reasons for this difference are not fully clear. One important explanation is that
there are still allowances in the new entrant reserves which were not yet allocated to
operators. However, there are very likely other factors that explain this difference (for
example that not all new entrant allocations are recorded in the CITL). In order to cal-
culate a full demand and supply balance, these 185 million EUAs are attributed to the
year 2012.
4.7 Total supply and demand balance for 2012 to 2020
Table 12 provides an overview of the available amount of emissions allowances (EUA)
as well as the entitlements for the use of credits from CDM or JI projects (CERs or
ERUs) and the projected baseline emissions for 2012 to 2020.
From 2012 to 2020 a total of approx. 20,860 emissions allowances or CDM or JI credits
will be available for the operators regulated by the EU ETS. Although free allocation is
significantly reduced from 2013 onwards, the total free allocation (free allocation to
existing installations as well as free allocation from the new entrant reserves) exceeds
half of all available units for 2012 to 2020 (55 % for 2012 to 2020 and 51 % for the third
trading period). The allocation at market prices via auctions and sales represents about
40 % of the total supply of allowances (39 % for 2012 to 2020 and 44 % for the third
period).
A total amount of 1,066 million CER and ERU, i.e. low-cost emissions credits from
CDM and JI will be available for surrender in the EU ETS from 2012 to 2020. This
amount exceeds significantly the projected oversupply by 2020. Without further enti-
tlements for the use of CERs and ERUs there would have been a scarcity (and a high-
er price) in the EU ETS from 2014 onwards.
Table 12 Demand and supply balance, 2012-2020
2012 2013 2014 2015 2016 2017 2018 2019 2020 Total
2012-20
2,184 1,297 1,244 1,192 1,140 1,085 1,019 954 890 11,006
105 898 914 929 945 963 993 1,022 1,050 7,818
0 300 0 0 0 0 0 0 0 300
278 98 98 98 99 99 99 99 99 1,066
0 13 27 40 54 67 80 94 107 482
185 0 0 0 0 0 0 0 0 185
2,752 2,606 2,283 2,260 2,237 2,214 2,191 2,168 2,145 20,857
2,131 2,222 2,240 2,260 2,278 2,293 2,307 2,322 2,330 20,382
620 384 43 0 -41 -78 -116 -154 -185 475
620 1,005 1,048 1,049 1,007 929 813 659 475
from 2008 1,567 1,952 1,995 1,995 1,954 1,876 1,760 1,606 1,422
mln EUA, CER and ERU
Free allocation NER III
Left-over NER II
Cumulated surplus
Baseline emissions
Free allocation
Auctions and sales
NER auctions phase III
CDM and JI credits
Surplus
Total available units
Source: Calculations by Öko-Institut

Strengthening the EU ETS Öko-Institut (Institute for Applied Ecology)
- 40 -
The baseline emissions reach the level of allowance and credit supply in 2015 and ex-
ceed this level from 2016 onwards. In other words: without the availability of the surplus
from the period before 2015 a scarcity would occur for the years after 2015.
The surplus created from 2012 to 2020 peaks in 2015 and reaches a level of approx.
1,050 million EUAs. Due to the decreasing cap the oversupply is reduced over time
and reaches a level of less than 475 million EUAs by 2020. However, the surplus cre-
ated from 2008 to 2011 must also be considered, which adds up to a total surplus of
about 1,425 million units in 2020.

Öko-Institut (Institute for Applied Ecology) Strengthening the EU ETS
- 41 -
5 Interim summary: Demand and supply balance 2008 to
2020
The balance for supply and demand from 2008 to 2020 is shown in Table 1. It clearly
shows that even the supply from free allocations in the second trading will exceed the
total emissions and all other supplies will further increase the surplus of this period,
which amounts to 16 % of the total demand from 2008 to 2012. For the third trading
period the total fresh supply of allowances and offset credits will be only 0.8% less than
the baseline emissions from 2013 to 2020. Due to the significantly increased share of
auctions in the total supply of allowances in third trading period, 44 % of all available
units will be available at the full prices only. However, for the whole period from 2008 to
2020 the supply still exceeds demand by 5 %. Three quarters of the demand for allow-
ances will be available free of charge or at low prices (free allocation and CDM/JI cred-
its, respectively).
Table 13 Demand and supply balance for the second and third trading period,
2008-2020
3rd period
Historical data
2008-2011 2012 2013-2020
% of demand
Free allocationa 7,938 2,184 9,304 19,425 68.8%
Auctions and salesb 300 105 8,013 8,418 29.8%
CDM and JI credits 556 278 789 1,622 5.7%
Left-over NER II - 185 - 185 0.7%
Total available units 8,793 2,752 18,106 29,650 105.0%
Emissionsc 7,846 2,131 18,251 28,229 100.0%
Surplus 947 620 -146 1,422 5.0%
Cumulated surplus 947 1,567 1,422
Notes: a Including free allocation from NER in the 3rd period. - b Including auctions from NER in the 3rd period (NER
300 autions). - c Verified emissions for 2008-2011, baseline emissions from 2012-2020.
2nd period
mln EUA, CER, ERU or t CO2e
Projection
Total
2008-2020
Source: Calculations by Öko-Institut
Figure 7 summarizes the different factors contributing to the surplus of allowances and
emissions reduction credits in the EU ETS. The cumulated surplus at the end of 2011
amounts to 1,000 million EUAs. The major share of the surplus accrued by 2011 (555
million EUA) is a result of the use of CDM and JI credits. The effects of the economic
crisis in the period from 2008 to 2011 (the number of available allowances exceeded
significantly the verified emissions) contributed a share of approx. 400 million EUAs to
the surplus.
According to the recent legislation the surplus will continue to increase by 2015 and will
still be significant in 2020.
The major reason for the increase of the surplus is that 1,000 million additional
CDM and JI credits can be surrendered by operators from 2012 to 2020;

Strengthening the EU ETS Öko-Institut (Institute for Applied Ecology)
- 42 -
This additional inflow of credits is only partly complemented by an additional
scarcity from ETS-regulated entities. It is worth mentioning that the major scar-
city from 2012 onwards will be created by the growing emissions from aviation
and only a comparatively low share results from the fact that the EUA supply is
lower than the baseline emissions from stationary sources under the scope of
the EU ETS.
Figure 7 Evolution of the surplus in the EU ETS, 2008-2020
0
500
1,000
1,500
2,000
2,500
Hisorical use ofCDM & JI credits
Crisis Future use ofCDM & JI credits
Demandaviation
Demandstationary sectors
Totalsurplus
2008 to 2011 2012 to 2020
mln
EU
A,
CE
R o
r E
RU
Source: Calculations by Öko-Institut
Overall the surplus in the EU ETS will be 1,420 million EUAs in 2020. The uncertainties
about the size of the surplus from 2008 to 2011 are obviously rather low. The effects of
the economic crisis and the total use of CDM and JI credits can be quantified well. For
the period beyond 2011 the uncertainties are significantly higher, namely on the de-
mand side of the balance:
The aviation sector contributes to a reduction of the surplus as cumulative
emissions are estimated to be approx. 450 million t CO2 higher than the number
of allowances provided by the sub-cap for the aviation sector from 2012 to
2020. If the aviation sector does not deliver the projected demand because sig-
nificant carriers pull out of the EU ETS (as a result of a political deal or because
other states take comparable action which would make the respective carriers
no longer subject to regulation by the EU ETS), the surplus of the EU ETS
would exceed the level of 1,400 million allowances significantly.
As emissions from stationary sources are projected to increase the available
number of allowances will be about 129 million t CO2 lower than baseline emis-

Öko-Institut (Institute for Applied Ecology) Strengthening the EU ETS
- 43 -
sions. If the economic recovery in the EU lasts longer than projected for the up-
dated baseline, this would also increase or prolong the surplus.
It is important to note that the majority of the projected surplus in the EU ETS results
from the additional inflow of emission reduction credits from CDM and JI projects. For
many of these projects the additionality of emission reductions has been questioned.
The major share of CDM credits surrendered under the EU ETS since 2008 was creat-
ed by projects which are now excluded from use under the EU ETS because of major
integrity concerns (Öko-Institut 2010, CEC 2011c). Although some more qualitative
restrictions apply for the use of CDM credits from 2013 onwards (EU 2009a), this chal-
lenge will remain a significant one and should be reflected in the debate on the future
use of emission reduction credits in the EU ETS.
Strengthening the EU ETS Öko-Institut (Institute for Applied Ecology)
- 44 -
6 Analysis of current proposals for intervention
6.1 Introduction, overview and structure of the analysis
If countermeasures are to be taken to deal with the existing or the emerging surplus of
allowances within the EU ETS, these interventions could address different issues:
The baseline emissions could be adjusted. With regard to the fundamental driv-
ers of the baseline emission trends (GDP etc.) this is obviously not a real option
but could be an option with a view to the complementary policies and measures
which are part of the baseline. If the complementary support for renewable en-
ergies or energy efficiency (or for other low-carbon options) is limited or re-
moved the efforts within the EU ETS would increase and the surplus would dis-
appear more quickly. However, given the existing political and legal framework
which explicitly addresses complementary measures (for strong and good rea-
sons) this is neither an appropriate nor a realistic way to take action on the EU
ETS surplus.
The cap could be tightened. If the number of available allowances is significant-
ly reduced (over time), this could accelerate the reduction of the surplus. Within
the architecture of the EU ETS from 2013 onwards the mechanism for tighten-
ing the cap is an increase of the linear reduction factor. Provisions for an ad-
justment of the linear reduction factor for various reasons exist in the recent EU
ETS legislation and could be applied without major problems if the political will
exists.
The restrictions on the inflow of external units which are fungible to EU ETS al-
lowances could be tightened, which means that the entitlements for using emis-
sion reduction credits would be reduced. Against the background of the very
disparate distribution of entitlements for using these credits in the second trad-
ing period a limitation of these entitlements for the period from 2013 to 2020
would lead to major distributional effects between operators in different Member
States and is probably one of the options which is difficult to implement.
As a temporary measure a share of the allowances could be held back (set
aside) and brought back to the market later or retired in the context of, for ex-
ample, a tightened cap for the EU ETS.
Two of these four general options are prominently subject to recent debates on sur-
plus-related adjustments of the EU ETS:
The European Parliament’s Committee on the Environment, Public Health and
Food Safety (ENVI) has tabled the concept of a set aside in its opinion on the
draft directive on energy efficiency (EP 2012). According to this proposal 1,400
EUAs would not be auctioned to the market and held back for future use or re-
tirement. Technically this proposal would be implemented by an adjustment of
the auctioning calendar laid down the auctioning regulation on the EU ETS.

Öko-Institut (Institute for Applied Ecology) Strengthening the EU ETS
- 45 -
In the same document ENVI proposed an adjustment of the linear reduction fac-
tor from 1.74 % to 2.25 annually. An adjustment of the linear reduction factor
would require a respective revision of the EU ETS Directive.
Both proposals have received support as well as resistance from both policy makers
and stakeholders. Therefore the analysis presented in this paper is focused on these
two options, their combination and different implementation approaches. It is structured
as follows:
Both proposals need specification to enable a more in-depth analysis. In chap-
ter 6.2 different implementation options and their combination are specified for
the following analysis.
In chapter 6.3 the effects of these options and their combinations on the EU
ETS surplus are analysed, based on the data and data structures presented in
the previous chapters.
The potential effects of the different options and their combinations on the EUA
prices are analysed in chapter 6.4, based on a simple methodological approach
presented in section 6.4.1. The results of this analysis are documented in sec-
tion 6.4.2.
The specification variants for the two general options mentioned above or their para-
metrization as well as the potential combinations are manifold. For the sake of pragma-
tism and illustration the analysis refers to the proposals specified by the European Par-
liament.
6.2 Specification of the options for the analysis
The analysis of the set aside requires three specifications: the number of allowances
held back, the respective change in the auctioning calendar and the plan for bringing
the allowances back to the market or to retire them.
The analysis of the set aside option and its combination with other options is based on
the following assumptions:
1. The set aside is defined as a total of 1,400 million EUAs;
2. It is built up from four equal tranches in four years from 2013 to 2016;
3. For the key question on the treatment of the set aside three approaches are de-
fined:
a. The set aside is brought back to the market during the third trading peri-
od, e.g. in four equal tranches from 2017 to 2020;
b. The set aside is reintroduced to the market with a ten year delay, in
equal tranches from 2023 to 2026;
c. The set aside is retired and is not brought back to the market.

Strengthening the EU ETS Öko-Institut (Institute for Applied Ecology)
- 46 -
The analysis of the adjustment for the linear reduction factor and its combination to
other options is based on the following assumptions:
Based on the proposal from the European Parliament the linear reduction factor
is increased from 1.74 % to 2.25 %. As a result the cap will be decreased an-
nually by 50 million EUA instead of 38 million EUA from 2014 onwards.
The increased linear reduction factor is applied for the years from 2014 onwards
as was proposed by the European Parliament with respect to the necessary
legislative process12. Compared to 2005 this equals an emission reduction of
25 % for the EU ETS-regulated stationary installations by 2020 and in the ab-
sence of any further changes of the cap a reduction of 89 % by 2050.
The increased linear reduction factor is applied to the stationary ETS-regulated
installations; for a variant it is assumed that the sub-cap for aviation is also ad-
justed annually with the linear reduction factor.
The additional reduction efforts triggered by a set aside and an increase of the linear
reduction factor are shown in Table 14. This compilation indicates some key aspects:
A set aside of 1,400 million EUA has an immediate effect on the reduction effort
and could reduce the surplus within a rather short time frame, especially if com-
pared to the effects of an increased linear reduction factor.
However, the schedule for the return of the set aside is of key importance. A re-
turn of the set aside within the third trading period would have no significant ef-
fect on the surplus.
The adjustment of the linear reduction factor delivers major effects over a longer
period of time. An increase from 1.74 % to 2.25 % leads to an additional cumu-
lated emission reduction of 315 million t CO2e from 2013 to 2020 and approx.
1,720 million t CO2e from 2013 to 2030.
In the long term the application of a more ambitious linear reduction factor to the
ETS-regulated aviation sectors can significantly increase the effort built into the
EU ETS. Applying the adjusted linear reduction factor of 2.25 % also for the
aviation sector increases the cumulated reduction effort by 139 million t CO2e
for 2013 to 2020 and approx. 762 million t CO2e for 2013 to 2030.
As an interim conclusion it can be stated that both interventions can be effective on a
significant scale (approx. 1.4 to 1.7 billion EUAs) for the next two decades on the one
hand. But on the other hand the time horizon for the respective effects is significantly
different. A set aside can deliver an increased effort within the EU ETS at a scale of 1.4
billion EUAs in a time frame of a few years whereas the increase of the linear reduction
12
It makes a significant difference if the adjusted linear factor reduction factor is applied from 2010 onwards or later. The reduction effort until 2020 is 315 million EUA with a linear factor starting in 2014 and 584 million EUAs with a linear factor starting in 2010; the difference be-tween these two options is 269 million EUAs from 2013 to 2020.

Öko-Institut (Institute for Applied Ecology) Strengthening the EU ETS
- 47 -
factor to tighten the cap is effective on this scale in a time frame of about 15 years.
However, an increased linear reduction factor would lead to much greater reduction
efforts for a period of two decades or more.
Table 14 Additional reduction efforts resulting from different options to reduce the
surplus in the EU ETS, 2013-2030
Annual 2013 2014 2015 2016 2017 2018 2019 2020
delayed 4 years 350 350 350 350 -350 -350 -350 -350
delayed 10 years 350 350 350 350
retired 350 350 350 350
EU ETS scope II 0 11 21 32 43 53 64 75
EU ETS scope III 0 1 1 2 2 3 3 4
Aviation 0 5 10 15 20 25 30 35
2021 2022 2023 2024 2025 2026 2027 2028 2029 2030
delayed 4 years
delayed 10 years -350 -350 -350 -350
retired
EU ETS scope II 85 96 107 117 128 139 149 160 171 181
EU ETS scope III 5 5 6 6 7 7 8 9 9 10
Aviation 40 45 50 55 60 65 70 75 80 85
Cumulative 2013 2014 2015 2016 2017 2018 2019 2020
delayed 4 years 350 700 1,050 1,400 1,050 700 350 0
delayed 10 years 350 700 1,050 1,400 1,400 1,400 1,400 1,400
retired 350 700 1,050 1,400 1,400 1,400 1,400 1,400
EU ETS scope II 0 11 32 64 107 160 224 299
EU ETS scope III 0 1 2 3 6 9 12 16
Aviation 0 5 15 30 50 75 105 139
2021 2022 2023 2024 2025 2026 2027 2028 2029 2030
delayed 4 years 0 0 0 0 0 0 0 0 0 0
delayed 10 years 1,400 1,400 1,050 700 350 0 0 0 0 0
retired 1,400 1,400 1,400 1,400 1,400 1,400 1,400 1,400 1,400 1,400
EU ETS scope II 384 480 587 704 832 971 1,120 1,280 1,451 1,632
EU ETS scope III 21 26 31 38 44 52 60 68 78 87
Aviation 179 224 274 329 389 453 523 598 678 762
Set-
aside
Increase
LRF to
2.25%
mln EUA
Set-
aside
Increase
LRF to
2.25%
Set-
aside
Increase
LRF to
2.25%
Set-
aside
Increase
LRF to
2.25%
mln EUA
mln EUA
mln EUA
Source: Calculations by Öko-Institut
With respect to the different time horizons and the scale of the existing and projected
surplus a series of combinations were analysed:
1. The three variants for a set aside of 1,400 million EUAs (returning 2017/2020,
returning 2023/2026, retired) for a cap based on the recent linear reduction fac-
tor of 1.74 % for stationary sources regulated by the EU ETS;
2. The three variants for a set aside of 1,400 million EUAs (returning 2017/2020,
returning 2023/2026, retired) for a cap based on an adjusted linear reduction
factor of 2.25 % as the base case and an application of this linear reduction
factor for the aviation sector from 2014 onwards.

Strengthening the EU ETS Öko-Institut (Institute for Applied Ecology)
- 48 -
All analysis reflects the third trading period of the EU ETS (2013-2020) as well as the
subsequent decade.
6.3 Reduction of the surplus in the EU ETS
The starting point for the analysis of interventions to reduce the surplus of allowances
in the EU ETS is the surplus of approx. 2,000 million EUAs in 2013. Without any inter-
vention (Base case) the EU ETS will be characterized by a surplus until 2024 (Figure
8). In other words: no scarcity will occur in the scheme before 2024. Even in 2020 the
surplus will amount to approx. 1,400 million EUAs.
Figure 8 Comparison of the effects of different options to reintroduce the set
aside on the surplus in the EU ETS at a cap level based on the linear
reduction factor of 1.74 %, 2013 to 2030
-2,000
-1,500
-1,000
-500
0
500
1,000
1,500
2,000
2,500
2014 2016 2018 2020 2022 2024 2026 2028 2030
mln
EU
A
Base case(no intervention)
Linear reduction factor 1.74%,set-aside retired
Linear reduction factor 1.74%,set-aside reintroduced 2017/2020
Linear reduction factor 1.74%,set-aside reintroduced 2023/2026
Source: Calculations by Öko-Institut
Figure 8 provides an overview of the effects of those intervention options which do not
include any adjustment of the cap, i.e. the linear reduction factor:
The set aside reduces the surplus in the scheme to 500 million EUAs in 2016.
If the set aside is brought back to the market before 2020, the turning point to-
wards scarcity in market is not reached and the surplus trajectory remains the
same as in the base case. There will still be a surplus in 2024 for this approach.
If the auctioning of the set aside is delayed for 10 years, the surplus will be fully
removed by 2020. A reintroduction of the set aside from 2023 onwards will not
lead to a surplus; the scarcity of allowances in the scheme would be main-
tained. The emission reduction effort in the EU ETS will slightly decrease by

Öko-Institut (Institute for Applied Ecology) Strengthening the EU ETS
- 49 -
2026 when the trajectory of cumulated demand is identical to the base case
again.
If the set aside were finally retired in 2023 a more ambitious emission reduction
trajectory would apply for the subsequent years.
Figure 9 Comparison of the effects of options to implement an increased linear
reduction factor on the surplus in the EU ETS, 2013 to 2030
-2,000
-1,500
-1,000
-500
0
500
1,000
1,500
2,000
2,500
2014 2016 2018 2020 2022 2024 2026 2028 2030
mln
EU
A
Base case(no intervention)
Linear reduction factor 2.25%,no set-aside
Linear reduction factor 1.74%,set-aside reintroduced 2023/2026
Linear reduction factor 2.25%,set-aside reintroduced 2023/2026
Linear reduction factor 2.25%(incl. aviation), set-asidereintroduced 2023/2026
Source: Calculations by Öko-Institut
Figure 9 illustrates the potential for reducing the surplus by an increase of the linear
reduction factor to 2.25 % from 2014 onwards and the combination of this intervention
with a set aside.
An isolated increase in the linear factor to 2.25 % delivers a long-term effect but
the point in time when the surplus turns into scarcity of allowances is only shift-
ed by about one year. In this case the surplus would be maintained by 2023.
If the increase of the linear reduction factor is combined with a set aside of
1,400 million EUAs from 2013 which enters the market ten years later, the sur-
plus is completely reduced by 2019, i.e. one year earlier than for the same set
aside approach combined with the linear reduction factor of 1.74 %. This differ-
ence seems to be small but the further trajectory of the scarcity of allowances in
the scheme indicates a significantly higher effort for the subsequent years. The
same effect occurs at a slightly higher level of ambition if the set aside is retired.
If the latter option is combined with a steady reduction of the cap for the aviation
sector by applying the linear reduction factor of 2.25 % to this cap as for the sta-
tionary sources, the scarcity is slightly increased again.
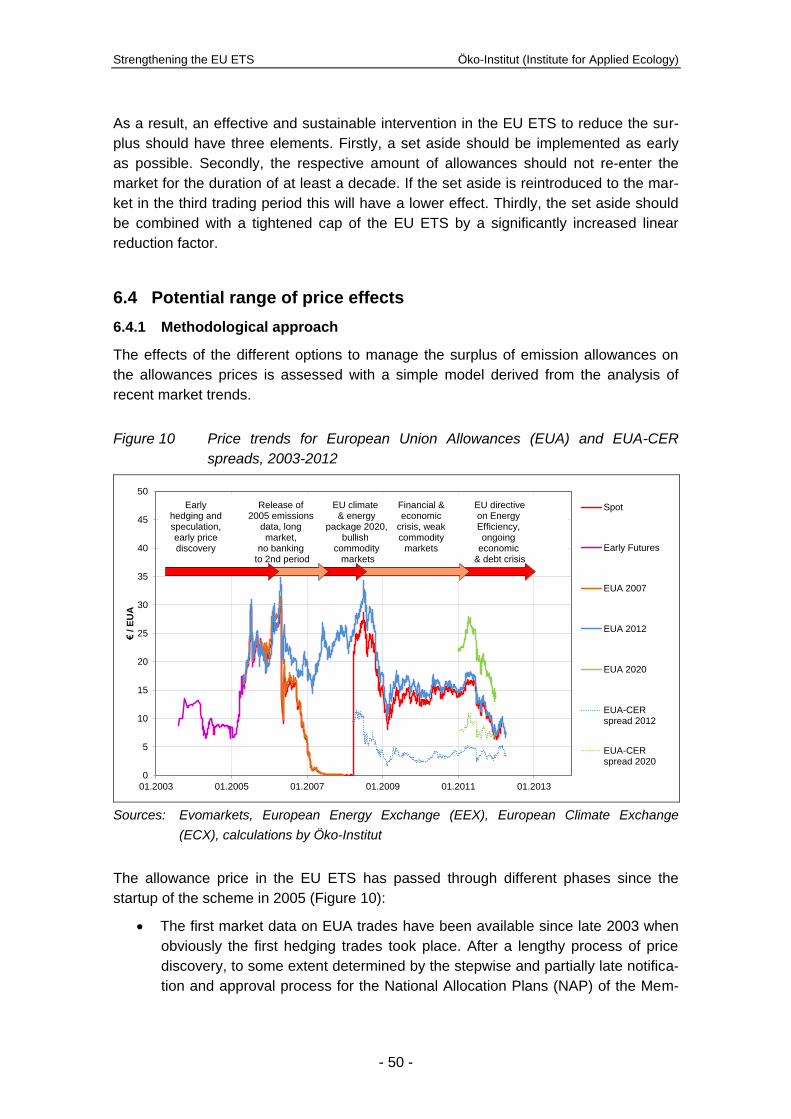
Strengthening the EU ETS Öko-Institut (Institute for Applied Ecology)
- 50 -
As a result, an effective and sustainable intervention in the EU ETS to reduce the sur-
plus should have three elements. Firstly, a set aside should be implemented as early
as possible. Secondly, the respective amount of allowances should not re-enter the
market for the duration of at least a decade. If the set aside is reintroduced to the mar-
ket in the third trading period this will have a lower effect. Thirdly, the set aside should
be combined with a tightened cap of the EU ETS by a significantly increased linear
reduction factor.
6.4 Potential range of price effects
6.4.1 Methodological approach
The effects of the different options to manage the surplus of emission allowances on
the allowances prices is assessed with a simple model derived from the analysis of
recent market trends.
Figure 10 Price trends for European Union Allowances (EUA) and EUA-CER
spreads, 2003-2012
0
5
10
15
20
25
30
35
40
45
50
01.2003 01.2005 01.2007 01.2009 01.2011 01.2013
€/
EU
A
Spot
Early Futures
EUA 2007
EUA 2012
EUA 2020
EUA-CERspread 2012
EUA-CERspread 2020
Release of 2005 emissions
data, long market,
no banking to 2nd period
Early hedging and speculation, early price discovery
Financial & economic
crisis, weak commodity
markets
EU climate & energy
package 2020,bullish
commoditymarkets
EU directiveon Energy Efficiency, ongoing
economic & debt crisis
Sources: Evomarkets, European Energy Exchange (EEX), European Climate Exchange
(ECX), calculations by Öko-Institut
The allowance price in the EU ETS has passed through different phases since the
startup of the scheme in 2005 (Figure 10):
The first market data on EUA trades have been available since late 2003 when
obviously the first hedging trades took place. After a lengthy process of price
discovery, to some extent determined by the stepwise and partially late notifica-
tion and approval process for the National Allocation Plans (NAP) of the Mem-

Öko-Institut (Institute for Applied Ecology) Strengthening the EU ETS
- 51 -
ber States, the EUA price reached levels of € 20 to 25 in 2005 and from € 25 to
30 in the first months of 2006.
After the first information on the level of verified emissions for the EU ETS-
regulated installations were made available in April 2006 it became clear that
the scheme would face a massive surplus of allowances and no scarcity of
emission allowances would exist for the pilot phase of the EU ETS. Given the
fact that banking was not allowed between the first and the second trading peri-
od, the price collapsed and decreased to levels of almost zero up to the end of
2007.
The start of the second trading period was characterized by significantly tight-
ened caps and by a bullish market for many commodities, specifically sharply
increasing prices for key fundamentals for the allowance price (petroleum prod-
ucts and natural gas) as well as a growing interest in speculation with emission
allowances from the EU ETS. EUAs were traded for € 25 to 30 for most of the
time but peaked at € 35 (for 2012 future contracts) in July 2008.
After the crash of the financial and commodity markets in the second half of
2008 and the following financial and economic crisis, the EUA price dropped to
€ 10 and recovered to levels of around € 15 by mid-2010.
In summer 2010 it became clear that the economic crisis in Europe would last
much longer than expected and that the cumulated surplus of emission allow-
ances would not disappear for a longer term. At the same time a proposal for an
ambitious energy efficiency directive was tabled which could result in additional
emission reductions in the EU ETS sectors. The EUA price dropped to levels of
around € 7.
With a view to the large surplus the question arises of why the EUA prices did not drop
to zero as observed between the first and the second trading period.
It could be argued that a major share of the cumulative surplus resulted from
the observed and estimated inflow of offsets from the CDM and JI and the re-
spective CER or ERU prices could work as a bottom line for the price decrease
for EUAs. However, Figure 10 indicates that the spread between EUA and CER
prices has been rather constant during the last three years. For 2012 deliveries,
the difference between EU ETS allowances and offsets from the CDM was in a
comparatively narrow range from € 3 to 5. With a view to the (future) supply of
CERs (Table 15), which exceeds significantly the entitlements for use in the EU
ETS, the availability of CERs cannot be assumed to be a price stopper for EUA
prices.

Strengthening the EU ETS Öko-Institut (Institute for Applied Ecology)
- 52 -
Table 15 Projection for the supply of Certified Emission Reductions (CERs) eligi-
ble under EU ETS rules from 2013 to 2020
Available offsets from
CDM projects eligible
under EU ETS rules
from 2013
mln CER
From existing least-developed country (LDC) projects produced before 2013 3
produced 2013-2020 116
From future least-developed country (LDC) projects May 2012 to end 2020 100
From existing allowed registered projects in non-LDC countries 2,230
From new allowed registered projects in non-LDC countries May 2012 to end 2012 100
Total 2,549
Memo items
From existing higher efficiency coal power plants 200
From existing hydro power projects >20 MW 1,300 Source: UNEP Risoe CDM/JI Pipeline Analysis and Database, May 1st 2012
The recent EUA price could be a result of medium-term hedging strategies.
Against the background of a steadily decreasing cap, according to the recent
legislation based on a linear reduction factor of 1.74 % annually, there will be a
point in time when the allowance surplus turns into a scarcity, additional and
significant emission reduction will be necessary and the EUA price formation
will return to fundamentals. In this case, investors could be interested in acquir-
ing allowances at the recent low price levels and bank them until the need for
additional emission abatement triggers higher EUA prices again. Operators with
a long EUA positions could bank EUAs with the expectation of higher prices in
the future. The recent price levels for allowances would result from a discount-
ing of future values of EUAs.
Last but not least, the recent EUA price could already reflect the future option of
increasing the level of ambition of the underlying EU climate policy and as a re-
sult tightened caps and higher or earlier scarcities in the allowance market.
However, this explanation is extremely difficult to validate and the most recent
trends indicate the opposite: Although the debate on adjustments of the EU
ETS cap emerged significantly during the last months, it has not been reflected
by any move in the allowance markets.
Against this background the numerical analysis of price responses to different options
to adjust the EU ETS is based on a rather simple model. According to the second op-
tion discussed above, the recent price depends on three factors:
The point in time when the surplus of allowances turns into scarcity is a key in-
put parameter. The information on this point in time can be derived from the de-
tailed analysis in the previous chapters.
The assumption of the allowance price at this point in time must reflect the fun-
damentals for emission abatement in the subsequent period of time. The range

Öko-Institut (Institute for Applied Ecology) Strengthening the EU ETS
- 53 -
of recent analysis on this is broad but the range of respective price forecasts for
the time horizon of 2020 shows a comparatively narrow range.
Table 16 shows the EUA prices resulting from the recent modelling for the EU
Energy Roadmap 2050 (CEC 2011d), other analysis (BNEF 2012, Deutsche
Bank 2011) conclude comparable, scarcity-driven price levels.
Furthermore, the data shown in Table 1 indicate the links between emissions
reduction efforts in the EU ETS and the respective allowance prices. As general
and approximate rules the following rough parameters were derived from the
EU Energy Roadmap 2050 modelling exercises: Emission reduction efforts of
about 20 % (by 2020), compared to 2005, are consistent to prices levels of 15
to 20 €/EUA; emissions reduction efforts of about 30 % (by 2020) refer to price
levels of 20 to 25 €/EUA; emissions reduction efforts of about 40 % (by 2030) to
35 to 40 €/EUA and reduction efforts of about 50 % (by 2030) are consistent
with prices levels of 50 to 60 €/EUA.13
Table 16 Allowance price projections for the EU ETS from the EU Energy
Roadmap 2050, 2020-2040
2020 2030 2040 2020 2030 2040
Reference Scenario 18 40 52 -23% -37% -55%
Current Policy Initiative Scenario 15 32 49 -28% -38% -52%
High Efficiency Scenario 15 25 87 -32% -51% -74%
High Renewables Scenario 25 35 92 -32% -56% -76%
High Nuclear / Delayed CCS Scenario 25 55 190 -32% -54% -76%
High CCS / Low Nuclear Scenario 20 63 100 -30% -51% -74%
Diversified Supply Options Scenario 25 52 95 -32% -53% -74%
Note: The reduction efforts refer to stationary sources regulated by the EU ETS.
€(2008) / EUA compared to 2005
EUA price Reduction effort
Source: European Commission
For the discount factor a wide range of options exists. Figure 11 shows the in-
teraction of different discount factors, three different fundamentally based
abatement cost levels, different periods of time for the oversupply of allowances
and the recent range of allowance prices. For a period of 11 years until the
oversupply of allowances in the EU ETS will be removed under the recent legis-
lation, the recent price levels would be consistent with a 10 % discount rate and
a scarcity-based price level of 25 €/EUA or a 12.5 % discount rate and a future
price of 20 €/EUA or a 7.5 % discount rate and future price of 30 €/EUA.
13
It should be highlighted that the CO2 prices are significantly determined by the range and the intensity of complementary measures to the EU ETS. In the High Efficiency and the High Renewables Scenario of the analysis for the EU Energy Roadmap 2050 the role of such complementary policies is more significant than in the other scenarios. Consequently the al-lowance prices for these scenarios are lower compared to the other scenarios.

Strengthening the EU ETS Öko-Institut (Institute for Applied Ecology)
- 54 -
Figure 11 Discounted CO2 allowance prices for different periods of oversupply
0
5
10
15
20
25
30
35
0 5 10 15 20 25
€/
EU
A
Years of EUA oversupply
20 €/t CO2 @ 7.5%
20 €/t CO2 @ 10.0%
20 €/t CO2 @ 12.5%
25 €/t CO2 @ 7.5%
25 €/t CO2 @ 10.0%
25 €/t CO2 @ 12.5%
30 €/t CO2 @ 7.5%
30 €/t CO2 @ 10.0%
30 €/t CO2 @ 12.5%
EUA price 2013
Best guess for the duration of
the surplus in the EU ETS
without intervention
Source: Calculations by Öko-Institut
Based on these classifications, the numerical analysis is based on the following as-
sumptions:
Future scarcity-based allowance price levels from 20 to 30 €/EUA, the lower
range representing the lower (recent) ambition level and the upper range re-
flecting tighter caps (e.g. in the framework of a 25 % domestic reduction target
for the total greenhouse gas emissions of the EU).
Discount rates of 7.5 % for the 20 €/EUA trajectory and 10 % for the higher
range of scarcity-based allowance prices.
The model calculates EUA prices at 2012 prices levels, depending on the point in time
when the surplus of allowances turns into a scarcity of allowances, compared to base-
line emissions.
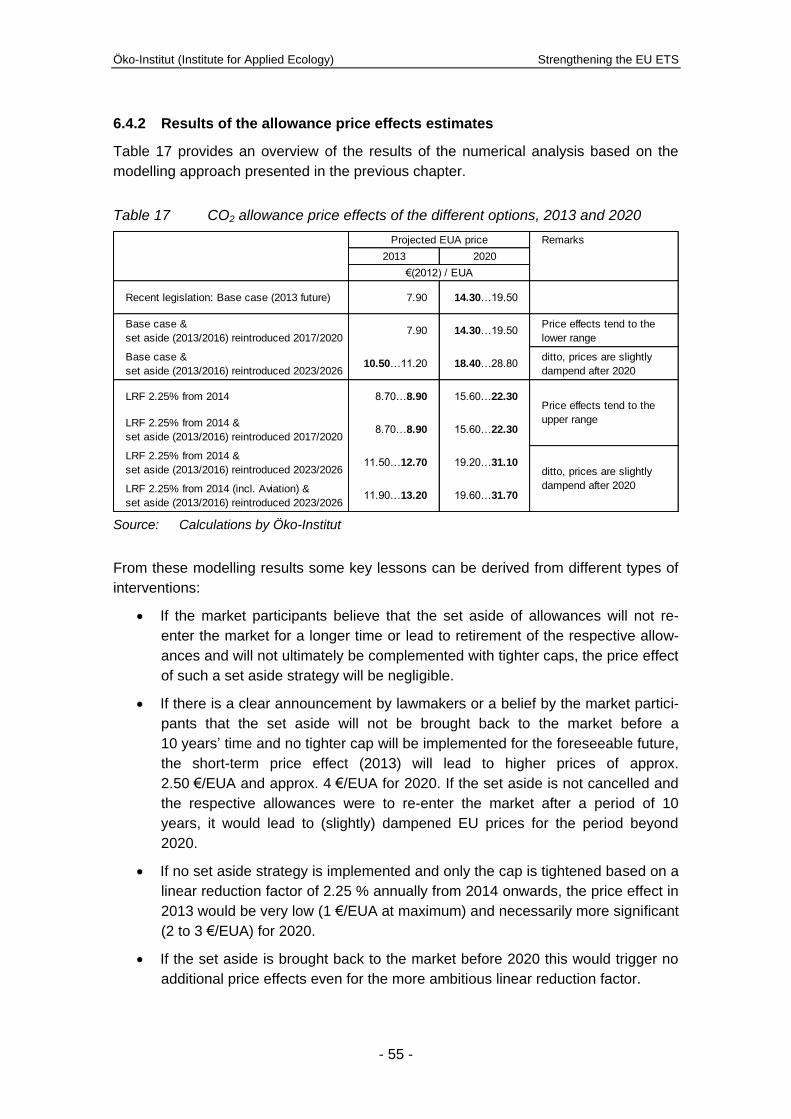
Öko-Institut (Institute for Applied Ecology) Strengthening the EU ETS
- 55 -
6.4.2 Results of the allowance price effects estimates
Table 17 provides an overview of the results of the numerical analysis based on the
modelling approach presented in the previous chapter.
Table 17 CO2 allowance price effects of the different options, 2013 and 2020
Remarks
2013 2020
Recent legislation: Base case (2013 future) 7.90 14.30…19.50
Base case &
set aside (2013/2016) reintroduced 2017/20207.90 14.30…19.50
Price effects tend to the
lower range
Base case &
set aside (2013/2016) reintroduced 2023/202610.50…11.20 18.40…28.80
ditto, prices are slightly
dampend after 2020
LRF 2.25% from 2014 8.70…8.90 15.60…22.30
LRF 2.25% from 2014 &
set aside (2013/2016) reintroduced 2017/20208.70…8.90 15.60…22.30
LRF 2.25% from 2014 &
set aside (2013/2016) reintroduced 2023/202611.50…12.70 19.20…31.10
LRF 2.25% from 2014 (incl. Aviation) &
set aside (2013/2016) reintroduced 2023/202611.90…13.20 19.60…31.70
Price effects tend to the
upper range
ditto, prices are slightly
dampend after 2020
Projected EUA price
€(2012) / EUA
Source: Calculations by Öko-Institut
From these modelling results some key lessons can be derived from different types of
interventions:
If the market participants believe that the set aside of allowances will not re-
enter the market for a longer time or lead to retirement of the respective allow-
ances and will not ultimately be complemented with tighter caps, the price effect
of such a set aside strategy will be negligible.
If there is a clear announcement by lawmakers or a belief by the market partici-
pants that the set aside will not be brought back to the market before a
10 years’ time and no tighter cap will be implemented for the foreseeable future,
the short-term price effect (2013) will lead to higher prices of approx.
2.50 €/EUA and approx. 4 €/EUA for 2020. If the set aside is not cancelled and
the respective allowances were to re-enter the market after a period of 10
years, it would lead to (slightly) dampened EU prices for the period beyond
2020.
If no set aside strategy is implemented and only the cap is tightened based on a
linear reduction factor of 2.25 % annually from 2014 onwards, the price effect in
2013 would be very low (1 €/EUA at maximum) and necessarily more significant
(2 to 3 €/EUA) for 2020.
If the set aside is brought back to the market before 2020 this would trigger no
additional price effects even for the more ambitious linear reduction factor.

Strengthening the EU ETS Öko-Institut (Institute for Applied Ecology)
- 56 -
If a more long-term set aside is combined with a tighter cap the price effects for
2013 will be significant for both the 2013 (4.50 €/EUA) and the 2020 (approx.
15 €/EUA) time horizon. Again, if the set aside is not cancelled and the respec-
tive allowances were to re-enter the market after a period of 10 years, this
would lead to (slightly) dampened EU prices for the period beyond 2020.
A tighter cap for the aviation sector within the EU ETS would further increase
the EUA price by € 0.50.
The ranges shown in Table 17 also indicate that the price effects are obviously subject
to uncertainties, depending on the parametrization of the model, which reflects the dif-
ferent assumptions on future trends of key fundamentals for abatement costs:
future price levels and price patterns for fuels and energy (especially the ratio
between natural gas and hard coal prices as well the ratio between hard coal
and lignite in the continental European market); and
future investment price levels for installations and plants regulated by the EU
ETS.
However, some sensitivity analysis shows that the central results described above are
rather robust.
Last but not least, it should be pointed out that the increase of the linear reduction fac-
tor from 1.74 % to 2.25 % (reflected by a scarcity-based allowance price increase from
€ 20 to 30 by the time when scarcity would occur) is complemented by the assumption,
that no additional entitlements for the use of offsets from CDM or JI would be intro-
duced. Otherwise the oversupply of allowances would be maintained for a longer time
and the allowance price effects indicated above would significantly overestimate the
EUA price increase.
Öko-Institut (Institute for Applied Ecology) Strengthening the EU ETS
- 57 -
7 More ambitious greenhouse gas emission reduction
targets for the EU: Analysis of implications for the EU
ETS
The analysis presented in chapter 6 is based on a specific starting point: two prominent
proposals from the European Parliament on a set aside and an adjustment of the linear
reduction factor from 1.74 to 2.25 %. The key motivation behind these proposals is to
fix the recent problems in the EU ETS.
However, this approach is only one of a broad range of alternative or complementary
options to provide a solution to the recent problems in the EU ETS. This chapter pre-
sents analysis which is based on a different starting point. In a back-casting exercise
two options were analysed on their implications on the EU ETS, both options are based
on stronger ambitions of the EU climate policy and the corresponding targets:
For the first option it was assumed that the EU would strengthen the overall
greenhouse gas emissions reduction target from 20 % to 25 % by 2020, com-
pared to 1990 levels. However, this option also includes a change in the archi-
tecture of the target. Whereas the existing 20 % target includes the (restricted)
use of emission reduction credits from abroad, the 25 % emissions reduction
target is understood as a domestic reduction target. In other words, the 25 %
emissions reduction should be achieved exclusively within the EU.
For the second option the domestic target for the EU is set at 30 % by 2020.
This means that emitters in the EU must reduce their emissions in total by 30 %
for the period from 1990 to 2020.
As for the whole analysis in this study, these targets are understood as reduction goals
for all greenhouse gases, including the whole aviation sector14 but excluding the emis-
sions from land use, land use change and forestry.
As the focus of the analysis presented in this chapter is on domestic emission reduc-
tions, the first step is to quantify the domestic emission reductions that will be achieved
by the Climate and Energy Package agreed in 2008:
The starting point of the analysis is the total emissions reduction achieved from
1990 to 2005, including the emission trends from aviation.
The total contribution of the EU ETS is defined by the cap. The use of emission
reduction credits from abroad must be separated to differentiate between total
14
In the Climate and Energy Package emissions from international aviation have been includ-ed in the reduction target of the EU-27. In order to address this, the 2020 targets discussed in this chapter are compared to 1990 emissions of the EU-27 including emissions from inter-national aviation (flights departing from the EU as reported in the inventories). In order to compare the contribution of different sectors to achieving the emissions reduction target all emission reductions are expressed as a share of 1990 emissions including international aviation.

Strengthening the EU ETS Öko-Institut (Institute for Applied Ecology)
- 58 -
and domestic emission reduction efforts. However, this data is available and
transparent from the entitlements for the use of CERs and ERUs within the EU
ETS.
The legally binding targets for the emission sources not regulated by the EU
ETS (effort sharing targets) are also defined. The domestic contributions must
also be separated from the total emission reduction efforts for these sectors.
The maximum amount of offsets from CDM and JI which could be used by the
Member States for their contribution to the effort sharing targets is also legally
defined and transparent.
Figure 12 Total and domestic emission reductions according to the 2008 Climate
and Energy Package, 2020
-25%
-20%
-15%
-10%
-5%
0%
Scope of KyotoProtocol
Internationalaviation
EU ETS(LRF 1.74%)
Non-ETSemission limits
EU ETSse of CDM & JI
Non-ETSuse of CDM & JI
Historic trend 1990-2005 Climate and Energy Package 2020
red
ucti
on
s c
om
pa
red
to
to
tal
19
90
em
iss
ion
s
Source: Calculations by Öko-Institut
Figure 12 provides an overview of the different contributions to the emission reductions
for the period from 1990 to 2020:
The EU-27 had achieved an emission reduction of 8 % below 1990 levels by
2005, based on the accounting rules of the Kyoto Protocol which exclude emis-
sions from international aviation. Taking into account the significantly increased
emissions from international aviation, the total emissions reduction from 1990 to
2005 decreases to 7 %.
With the agreed targets for the EU ETS and the non-ETS emission limits laid
down in the Effort Sharing Decision, the EU-27 will achieve an emission reduc-
tion of 20 % below 1990 levels by 2020. The EU ETS contributes approx. 9 per-
centage points of emissions reduction, based on the linear reduction factor of

Öko-Institut (Institute for Applied Ecology) Strengthening the EU ETS
- 59 -
1.74 %. The sectors not regulated by the EU ETS have to achieve an additional
emission reduction of about 4 percentage points.
However, the additional emission reductions from 2005 to 2020 also include the
use of emissions reduction credits from CDM and JI. Total offset use in the EU
ETS from 2008 to 2020 can be estimated at 1,622 million CERs or ERUs. This
is an equivalent of 2 percentage points in the total emission reduction.15 For the
non-ETS sectors the use of offsets is limited to 3 or 4 % of the 2005 non-ETS
emissions (EU 2009b). Expressed as the contribution to the 2020 target it is
equivalent to approx. 1 percentage point of the total emission reduction.16
With respect to these contributions the domestic emission reduction effort from the
2008 Energy and Climate Package amounts to 17 % by 2020, compared to the 1990
levels.
The adjustments for the EU ETS analysed in the previous chapter obviously has an
impact on the emission reductions by 2020.
An increase of the linear reduction factor from 1.74 to 2.25 % increases the
emission reduction effort by 2020, which equals an additional reduction of ap-
prox. 1.5 percentage points.
If the set aside of 1,400 million EUAs is calculated as an average annual effort
for 2013 to 2020, it equals an emission reduction of about 3 percentage points.
This assumption is based on a long-term approach for the set aside, which
means that the set aside or parts of it are not introduced to the market before
2020.
Under the assumption that these additional provisions for the EU ETS will not be com-
plemented by additional efforts in the non-ETS sectors, the total emissions reduction
from 1990 to 2020 would amount to almost 24 % in total and approx. 21 % at the do-
mestic level. However, if the set aside is not retired after 2020 it would result in a need
for additional emission reduction efforts for the decade beyond 2020 (e.g. an increased
reduction effort of 2.5 percentage points in 2030).
In this context two additional provisions for the EU ETS and the non-ETS sectors were
analysed:
The EU commits to a 25 % domestic emission reduction by 2020, the share of
the EU ETS in the additional reduction efforts would continue to be two thirds of
15
In order to quantify the contribution of offsets to emission reductions in 2020 the total allowed offset use in the EU ETS was calculated as the annual average use for the 13 years from 2008 to 2020.
16 According to the recent policies it was assumed that Germany, the UK and France will not
use offsets to reach their non-ETS targets. Therefore, the potential use of offsets by these countries was not taken into account in this calculation. The use of offsets for the remaining countries was considered as the annual average of the total allowed use for the period from 2013 to 2020.

Strengthening the EU ETS Öko-Institut (Institute for Applied Ecology)
- 60 -
the total additional effort (CEC 2011d+e, Öko-Institut 2011) and a set aside of
1,400 million EUA would be separated from the market and not introduced be-
fore 2020.
The EU sets a target of a 30 % domestic emission reduction by 2020, the share
of the EU ETS in the additional reduction efforts would also continue to be two
thirds (CEC 2011d+e, Öko-Institut 2011) of the total additional effort and a set
aside of 1,400 million EUA would be separated from the market and not intro-
duced before 2020.
Based on these assumptions the implications for the EU ETS can be derived with a
back-casting approach.
For the case of the 25 % domestic emission reduction the linear reduction factor
must be increased to 2.6 % from 2014 onwards. This represents an annual de-
crease of the cap by 57 million EUA. Without consideration of the set aside the
scope-adjusted cap of the EU ETS would represent an emission reduction of
27 % from 2005 to 2020 and the complete abatement of greenhouse gas emis-
sions by 2050.
For the case of the 30 % domestic emission reduction goal the implicit linear re-
duction factor is 3.9 % from 2014 onwards, representing an annual decrease of
the cap by 86 million EUA. Without the effects of the set aside this would result
in an emission reduction of 36 % from 2005 to 2020. The emissions from
sources regulated by the EU ETS must be completely abated by 2038, in a pe-
riod of 25 years from now.
Figure 13 Adjustments of the ETS and the switch to more ambitious EU targets for
greenhouse gas emission reductions in 2020
-35%
-30%
-25%
-20%
-15%
-10%
-5%
0%
by 2005 Package 2008 Set aside LRF 2.6% Set aside LRF 3.9%
reductions Energy ETS Non-ETS ETS Non-ETS
Emission Climate and Domestic 25% target (compared to 1990) Domestic 30% target (compared to 1990)
red
ucti
on
s c
om
pa
red
to
to
tal
19
90
em
iss
ion
s
Source: Calculations by Öko-Institut

Öko-Institut (Institute for Applied Ecology) Strengthening the EU ETS
- 61 -
Figure 13 provides an overview of the different contributions to the overall domestic
reduction. Starting from a domestic emissions reduction of about 17 % compared to
1990 levels, the emissions reductions would be allocated as follows:
The set aside would again represent a contribution of 3 percentage points
(based on the emission levels of 1990);
The increase of the linear reduction factor from 1.74 to 2.6 % would represent
an emission reduction of about 2 percentage points (referring to the total emis-
sions in 1990). Depending on the emission reduction delivered by the EU ETS
the reduction efforts in the non-ETS sectors (buildings, transport, agriculture,
waste management etc.) would amount to 2.5 percentage points;
If the linear reduction factor is increased to 3.9 % the respective emission re-
duction amounts to 6 percentage points by 2020. Accordingly the contribution of
the non-ETS sectors increases to 4.5 percentage points.
With a set aside in the EU ETS of 1,400 million EUA, an increase of the linear reduc-
tion factor from 1.74 to 2.6 % for the EU ETS cap and increased efforts in the non-ETS
sectors the EU would be able to achieve a domestic emission reduction of 25 % below
1990 levels by 2020.17 The additional efforts in the non-ETS sectors represent one third
of the additional reduction effort to step up to a more ambitious reduction target of 25 %
domestically. With an increased linear reduction factor of 3.9 % for the cap of the EU
ETS and consistently increased efforts in the non-ETS sectors, the EU would able to
achieve domestic emission reduction of 30 % below 1990 levels by 2020.18
However, it should be carefully considered that the emissions reductions from the set
aside of about 3 percentage points of the total target of 25 or 30 % are non-permanent
if the set aside is not retired. Otherwise the reintroduction of the set aside (after 2020)
to the market would have to be compensated in the next decade by additional efforts.
The significantly tightened caps for the EU would obviously have price effects in the
market for emission allowances. Considering the efforts and the methodological ap-
proach used in this study two reflections are necessary:
The model and its parametrization can be used for the case of a linear reduction
factor of 2.6 % (consistent to the domestic reduction target of 25 %) for the
short-term price effects as well as the price projection for 2020.
For the case of an increase of the linear reduction factor to 3.9 % the model can
only be used for the estimation of the rather short-term price effects. For the
17
The reduction effort of the set aside in 2020 is calculated by distributing the total size of the set aside (1,400 million EUA) equally to the eight years of the third trading period. An in-crease of the linear reduction factor to 2.6 % delivers an emission reduction of 133 million t CO2 in 2020. Expressed as a share of 1990 emissions including international aviation this translates into an emission reduction of 2.3 percentage points in 2020.
18 Again the non-ETS sectors cover one third of the additional reduction effort to step up to a
more ambitious reduction target of 30 %.
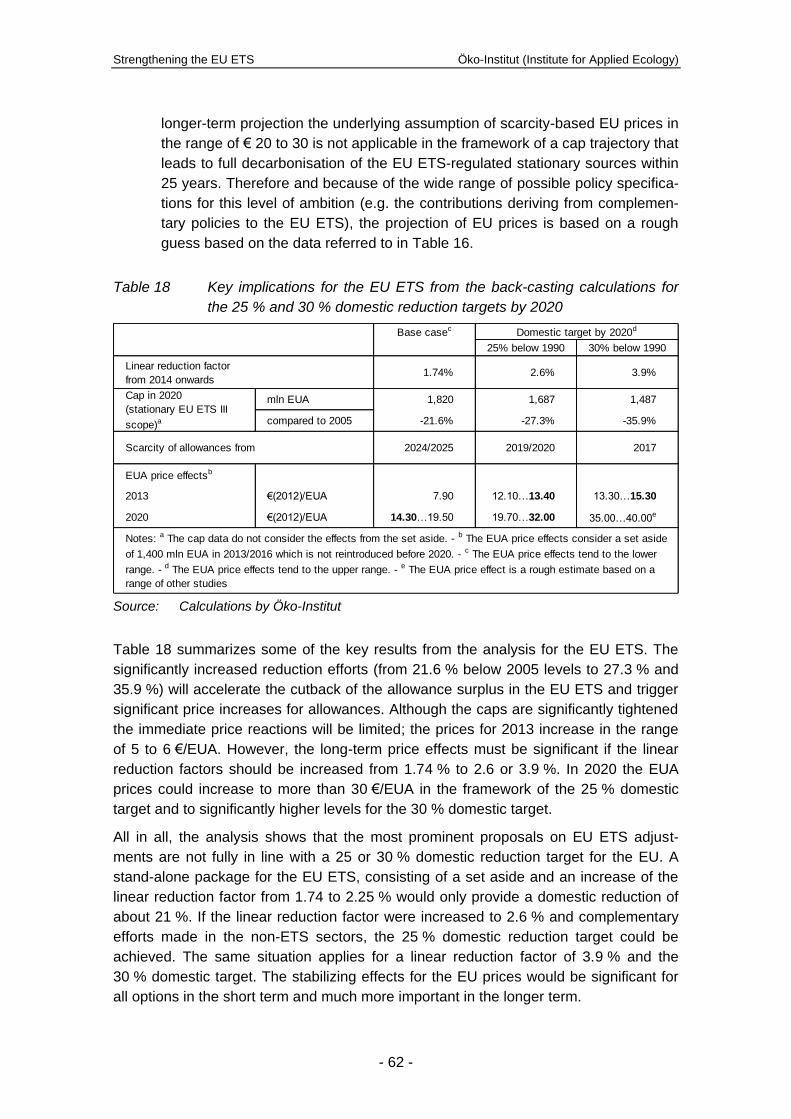
Strengthening the EU ETS Öko-Institut (Institute for Applied Ecology)
- 62 -
longer-term projection the underlying assumption of scarcity-based EU prices in
the range of € 20 to 30 is not applicable in the framework of a cap trajectory that
leads to full decarbonisation of the EU ETS-regulated stationary sources within
25 years. Therefore and because of the wide range of possible policy specifica-
tions for this level of ambition (e.g. the contributions deriving from complemen-
tary policies to the EU ETS), the projection of EU prices is based on a rough
guess based on the data referred to in Table 16.
Table 18 Key implications for the EU ETS from the back-casting calculations for
the 25 % and 30 % domestic reduction targets by 2020
Base casec
25% below 1990 30% below 1990
Linear reduction factor
from 2014 onwards1.74% 2.6% 3.9%
mln EUA 1,820 1,687 1,487
compared to 2005 -21.6% -27.3% -35.9%
Scarcity of allowances from 2024/2025 2019/2020 2017
EUA price effectsb
2013 €(2012)/EUA 7.90 12.10…13.40 13.30…15.30
2020 €(2012)/EUA 14.30…19.50 19.70…32.00 35.00…40.00e
Domestic target by 2020d
Cap in 2020
(stationary EU ETS III
scope)a
Notes: a The cap data do not consider the effects from the set aside. - b The EUA price effects consider a set aside
of 1,400 mln EUA in 2013/2016 which is not reintroduced before 2020. - c The EUA price effects tend to the lower
range. - d The EUA price effects tend to the upper range. - e The EUA price effect is a rough estimate based on a
range of other studies Source: Calculations by Öko-Institut
Table 18 summarizes some of the key results from the analysis for the EU ETS. The
significantly increased reduction efforts (from 21.6 % below 2005 levels to 27.3 % and
35.9 %) will accelerate the cutback of the allowance surplus in the EU ETS and trigger
significant price increases for allowances. Although the caps are significantly tightened
the immediate price reactions will be limited; the prices for 2013 increase in the range
of 5 to 6 €/EUA. However, the long-term price effects must be significant if the linear
reduction factors should be increased from 1.74 % to 2.6 or 3.9 %. In 2020 the EUA
prices could increase to more than 30 €/EUA in the framework of the 25 % domestic
target and to significantly higher levels for the 30 % domestic target.
All in all, the analysis shows that the most prominent proposals on EU ETS adjust-
ments are not fully in line with a 25 or 30 % domestic reduction target for the EU. A
stand-alone package for the EU ETS, consisting of a set aside and an increase of the
linear reduction factor from 1.74 to 2.25 % would only provide a domestic reduction of
about 21 %. If the linear reduction factor were increased to 2.6 % and complementary
efforts made in the non-ETS sectors, the 25 % domestic reduction target could be
achieved. The same situation applies for a linear reduction factor of 3.9 % and the
30 % domestic target. The stabilizing effects for the EU prices would be significant for
all options in the short term and much more important in the longer term.

Öko-Institut (Institute for Applied Ecology) Strengthening the EU ETS
- 63 -
8 Summary and conclusions
EU energy and climate policy faces manifold challenges. The debate on tougher emis-
sions reduction targets for 2020 is emerging, the need for an integrated framework and
long-term targets as well as consistent and interim targets for 2020 and 2030 is becom-
ing obvious and the adjustments to the EU ETS seem to be indispensable to preserve
its role as a central pillar of the EU’s energy and climate policy mix.
The EU is on its way to meeting its recent greenhouse gas emission targets for 2020.
In 2010 the total greenhouse gas emissions were at a level of 14 % below the 1990
levels. Including the contributions from the entitlements for the use of emission reduc-
tion credits from abroad, namely the Clean Development Mechanism (CDM) and Joint
Implementation (JI), in the EU ETS the total compliance effort increases to 16 %. The
foreseeable use of foreign credits by the governments to comply with their non-ETS
emission reductions adds another percentage point; the total progress in compliance to
the 20 % reduction target in 2020 totals 17 %. The remaining effort of 3 % is theoreti-
cally already gap-filled with the cap of the EU ETS by 2020.
The current situation is also challenging for the EU ETS, which is facing significantly
falling allowance prices. These price trends and the emerging investment needs in the
European power markets raise the question of the fundamental reasons for this price
development as well as the concern of whether the EU ETS will be able to maintain its
role as a central pillar of climate policy in the EU. The key reason is the massive supply
of emission allowances and emission reduction credits, which exceeds the demand
significantly. From 2008 to 2011 a surplus of about 950 million allowances was accu-
mulated and creates major impacts on the markets. A detailed analysis of demand and
supply indicates that this surplus of supply will continue for the next decade or more if
no adjustments to the EU ETS are implemented. The major reasons for the massive
supply are the huge entitlements for the use of external emission reduction credits from
CDM and JI as well as the long-term impacts of the financial and economic crisis,
which changed the baseline emission trend and consequently reduced the emission
reduction effort built into the EU ETS in its actual parameterization. By 2020 the major
share of the remaining surplus19 will stem from the inflow of external credits and a
smaller part can be attributed to the economic crisis. Only a minor contribution to the
surplus results from the support for renewable energy sources with complementary
policies to the EU ETS. The recently projected contribution of renewable energies to
emissions reduction in the sectors regulated by the EU ETS matches more or less per-
fectly with the assumptions made for the cap-setting in the integrated analysis for the
Energy and Climate Package in 2008. However, this matching results from diverging
trends for the deployment of different sources of power generation from renewable en-
19
Purchases of EUAs from the aviation sector that will reduce the surplus are not yet sub-stracted here.
Strengthening the EU ETS Öko-Institut (Institute for Applied Ecology)
- 64 -
ergies, which are coincidently compensating each other. This coincidence must not
necessarily also occur in the future, i.e. for the time horizon beyond 2020.
However, the need for some adjustments of the parametrization of the EU ETS is
emerging. Two approaches were used to analyse potential interventions.
The first approach refers to a prominent proposal in the recent debate, put forward by
the European Parliament and consisting of two key elements. This proposal includes
firstly a set aside of 1,400 million allowances and secondly a tighter cap for the EU
ETS, implemented by an increase of the linear reduction factor from a recent 1.74 % to
2.25 % from 2014 onwards.
The second approach starts from a more ambitious emissions reduction target for the
overall greenhouse gas emissions for the EU by 2020, i.e. a reduction of 25 % and
30 % by domestic measures, based on 1990 emission levels. Such overarching emis-
sion reduction targets can be translated into an increase of the linear reduction factor
from 1.74 % to 2.6 % (25 % target domestically) and 3.9 % (30 % target for domestic
emission reductions).
The analysis clearly shows that a significant reduction of the surplus is only possible
with the combination of a set aside and adjustments of the cap by increasing the linear
reduction factor. Stand-alone measures like a set aside on the one hand or the adjust-
ments of the linear reduction factor on the other hand will have only extremely limited
impacts on the surplus for the next decade. However, the effectiveness of both inter-
ventions is subject to some caveats:
A set aside will only have an impact if the market participants believe that the
respective amount allowances will be held back for a sufficient period of time (at
least until the surplus is fully removed) or will be retired.
Tighter caps for the EU ETS will only achieve the intended effects if not com-
plemented by an increase of the entitlements for the use of external credits,
which would increase the surplus again and decrease the allowance prices.
An assessment of the different options with a relatively simple allowance price model
(which nevertheless explains the recent price levels comparatively well) leads to some
key lessons on different types of interventions:
If the market participants believe that the set aside of allowances will re-enter
the market or will not be retired and will not ultimately be complemented by
tighter caps, the price effect of such a set aside strategy will be negligible.
If there is a clear announcement by lawmakers or a belief by the market partici-
pants that the set aside will not be brought back to the market before a 10 year
time period has passed and no tighter cap will be implemented for the foresee-
able future, the short-term price effect (2013) will lead to higher prices of ap-
prox. 2.50 €/EUA and approx. 4 €/EUA for 2020. If the set aside is not cancelled
and the respective allowances were to re-enter the market after a period of 10
years, it would lead to (slightly) dampened EU prices for the period beyond
2020.

Öko-Institut (Institute for Applied Ecology) Strengthening the EU ETS
- 65 -
If only the cap is tightened based on a linear reduction factor of 2.25 % annually
from 2014 onwards, the price effect in 2013 would be very low (1 €/EUA at the
maximum) and necessarily more significant (2 to 3 €/EUA) for 2020.
If the set aside is brought back to the market before 2020 it would trigger no ad-
ditional price effects even for the more ambitious linear reduction factor.
If a more long-term set aside is combined with a tighter linear reduction factor of
2.25 %, the price effects for 2013 will be significant for both the 2013
(4.50 €/EUA) and the 2020 (approximately 15 €/EUA) time horizon. Again, if the
set aside is not cancelled and the respective allowances were to re-enter the
market in the medium term, it would lead to (slightly) dampened EU prices in fu-
ture.
A tighter cap for aviation (applying the linear reduction factor of 2.25 % also to
the sub-cap for aviation) would further increase the EUA price by € 0.50.
The EUA price effects of a set aside, not re-entering the market before 2020,
and a tighter cap based on an increase of the linear reduction factor from
1.74 % to 2.6 % could increase the price in 2013 by approx. 5 €/EUA and by up
to 17 €/EUA in 2020.
The combination of a set aside, which is held back for a decade or more or is fi-
nally retired, and an increase of the linear reduction factor from 1.74 % to 3.9 %
from 2014 onwards would lift the EUA price by up to € 7 in 2013 and potentially
by more than € 20 by 2020. However, the uncertainties regarding the assess-
ment of price effects for this option are comparatively high because of specific
modelling issues and the wide range of potential policy specifications for these
kinds of emission reduction trajectories.
Based on this analysis a set of four recommendations can be put forward for adjust-
ments of the EU ETS:
Firstly, a set aside can reduce the allowance surplus within the EU ETS in the short
term. However, the respective amount of allowances should be held back for a period
of a decade or more or retired at the earliest point in time.
Secondly, the long-term cap should be tightened by a significant increase of the linear
reduction factor, preferentially from 2014 onwards. The effective increase is subject to
fundamental political decisions on the overall emission reduction targets. However, an
increase of the linear reduction factor to less than 2.6 % will be not consistent with
overall targets of a 25 % domestic emission reduction and a factor of less than 3.9 %
will not be consistent with an overarching target of 30 % domestic action by 2020.
Thirdly, no additional entitlements for the use of external emission reduction credits
should be created in the process of tightening the EU ETS cap.
Fourthly, the implementation of high impact complementary policies (e.g. the impact of
the upcoming Energy Efficiency Directive on emissions in the EU ETS sectors), a long-
lasting change in fundamental drivers for baseline emissions (e.g. a significantly lower

Strengthening the EU ETS Öko-Institut (Institute for Applied Ecology)
- 66 -
GDP growth for a longer period) or other changes in the regulatory framework (e.g. the
discontinuation of significant parts of the aviation sector as net buyers in the market)
should be reflected by a strictly rule-based and high-threshold provision to lower the
cap in the EU ETS.
These kinds of structural improvements could help to preserve the key role of the EU
ETS in an enabling policy mix for ambitious, effective and efficient climate policy.

Öko-Institut (Institute for Applied Ecology) Strengthening the EU ETS
- 67 -
9 References
Bloomberg New Energy Finance (BNEF) (2012): The cost of meeting a 30 % emission
reduction target in Europe. 16 March 2012.
Capros, P., Mantzos, L., Papandreou, V., Tasios, N. (2008): Model-based Analysis of
the 2008 EU Policy Package on Climate Change and Renewables. Economics-
Energy-Environment Modelling Laboratory (E3MLab), National Technical Univer-
sity of Athens.
Commission of the European Communities (CEC) (2010a): Analysis of options to move
beyond 20 % greenhouse gas emission reductions and assessing the risk of car-
bon leakage. Communication from the Commission to the European Parliament,
the Council, the European Economic and Social Committee and the Committee
of the Regions. COM(2010) 265 final, Brussels, 26.5.2010.
Commission of the European Communities (CEC) (2010b): NAP tables decisions –
published at:
http://ec.europa.eu/environment/climat/emission/citl_en_phase_ii.htm
Commission of the European Communities (CEC) (2010c): Commission Decision of
July 2010 on the Community-wide quantity of allowances to be issued under the
EU Emission Trading Scheme for 2013. C(2010) 4658 final, Brussels, 09.07.2010
Commission of the European Communities (CEC) (2010d): Adjusting the Union-wide
quantity of allowances to be issued under the Union Scheme for 2013 and re-
pealing Commission Decision 2010/384/EU. C(2010) 7180 final. Brussels,
22.10.2010.
Commission of the European Communities (CEC) (2010e): EU energy trends to 2030
— UPDATE 2009; EUROPEAN COMMISSION Directorate-General for Energy in
collaboration with Climate Action DG and Mobility and Transport DG; completed
on 4 August 2010.
Commission of the European Communities (CEC) (2011a): Commission decision of
27 April 2011 determining transitional Union-wide rules for harmonised free allo-
cation of emission allowances pursuant to Article 10a of Directive 2003/87/EC of
the European Parliament and of the Council pursuant to Article 10a of Directive
2003/87/EC of the European Parliament and of the Council.
Commission of the European Communities (CEC) (2011b): Commission Decision of
11 November 2011 amending Decisions 2010/2/EU and 2011/278/EU as regards
the sectors and subsectors which are deemed to be exposed to a significant risk
of carbon leakage (notified under document C(2011) 8017).
Commission of the European Communities (CEC) (2011c): Commission Regulation
(EU) No 550/2011 of 7 June 2011 on determining, pursuant to Directive
2003/87/EC of the European Parliament and of the Council, certain restrictions
applicable to the use of international credits from projects involving industrial
gases.

Strengthening the EU ETS Öko-Institut (Institute for Applied Ecology)
- 68 -
Commission of the European Communities (CEC) (2011d): Communication from the
Commission to the European Parliament, the Council, the European Economic
and Social Committee and the Committee of the Regions. Energy Roadmap
2050. COM(2011) 885. Brussels, 15.12.2011.
Commission of the European Communities (CEC) (2011e): Communication from the
Commission to the European Parliament, the Council, the European Economic
and Social Committee and the Committee of the Regions. A Roadmap for moving
to a competitive low carbon economy in 2050. COM(2011) 112 final. Brussels,
8.3.2011.
Commission of the European Communities (CEC) (2011f): Communication from the
Commission, Guidance document on the optional application of Article 10c of Di-
rective 2003/87/EC (2011/C 99/03), 31.3.2011.
Commission of the European Communities (CEC) (2012): Emissions Trading: Com-
mission clears temporary free allowances for power plants in Cyprus, Estonia and
Lithuania; MEMO/12/350; Brussels, 16 May 2012.
Commission of the European Communities (CEC), European Investment Bank (EIB)
(2010): Cooperation agreement on the implementation of Commission Decision
C(2010) 7499 between the European Commission and the European Investment
Bank (2010/C 358/01). Official Journal of the European Union, 31.12.2010.
Council of the European Union (CEU) (2007): Presidency Conclusions 8/9 March 2007.
http://www.consilium.europa.eu/ueDocs/cms_Data/docs/pressData/en/ec/93135.
Council of the European Union (CEU) (2010): Climate change: Follow-up to the Co-
penhagen Conference (7-19 December 2009). Council (Environment) Conclu-
sions, 7562/10, Brussels, 15 March 2010.
Council of the European Union (CEU) (2011): Conclusions – 4 February 2011;
http://www.consilium.europa.eu/uedocs/cms_data/docs/pressdata/en/ec/119175.
pdf.
de Perthuis, C., Trotignon, R. (2012): The European CO2 allowances market: issues in
the transition to Phase III. Les Cahiers de la Chaire Economie du Climat, Infor-
mation and debates Series, no. 14, Paris, March 2012.
Deutsche Bank (2011): EU Emissions: What is the value of a Political Option? 29 No-
vember 2011.
European Economic Area Joint Committee (EEA JC) (2011): Decision of the EEA Joint
No 93/2011 of 20 July 2011 amending Annex XX (Environment) to the EEA
Agreement.
European Environment Agency (EEA) (2011): National Renewable Energy Action Plan
(NREAP) Data, http://www.eea.europa.eu/data-and-maps/figures/national-
renewable-energy-action-plan.

Öko-Institut (Institute for Applied Ecology) Strengthening the EU ETS
- 69 -
European Environment Agency (EEA) (2012): EU ETS data EEA greenhouse gas data
viewer,
http://dataservice.eea.europa.eu/pivotapp/pivot.aspx?pivotid=473http://dataservic
e.eea.europa.eu/PivotApp/pivot.aspx?pivotid=475.
European Parliament (EP) (2010): Towards a new Energy Strategy for Europe 2011 –
2020. Resolution 2010/2108(INI), Brussels, 25 November 2010.
European Parliament (EP) (2012): Opinion of the Committee on the Environment, Pub-
lic Health and Food Safety for the Committee on Industry, Research and Energy
on the proposal for a directive of the European Parliament and of the Council on
energy efficiency and repealing Directives 2004/8/EC and 2006/32/EC
(COM(2011)0370-C7-0168/2011 – 2011/0172(COD)). Brussels, 18.1.2012.
European Topic Centre on Air and Climate Change (ETC/ACC) (2010): Cap adjust-
ments in the EU-ETS according to Article 9a of the EU-ETS Directive. ETC/ACC
Technical Paper 2010/2, June 2010.
European Union (EU) (2009a): Directive 2009/29/EC of the European Parliament and
of the council of 23 April 2009 amending Directive 2003/87/EC so as to improve
and extend the greenhouse gas emission allowance trading scheme of the
Community. Official Journal of the European Union, 5.6.2009.
European Union (EU) (2009b): Decision No 406/2009/EC of the European Parliament
and of the council of 23 April 2009 on the effort of Member States to reduce their
greenhouse gas emissions to meet the Community’s greenhouse gas emission
reduction commitments up to 2020. Official Journal of the European Union,
5.6.2009.
European Union (EU) (2009c): Directive 2009/28/EC of the European Parliament and
of the Council of 23 April 2009 on the promotion of the use of energy from re-
newable sources and amending and subsequently repealing Directives
2001/77/EC and 2003/30/EC. Official Journal of the European Union, 5.6.2009.
Fraunhofer Institut für Innovations- und Systemforschung (ISI) (2005): CO2-Minderung
im Stromsektor durch den Einsatz erneuerbarer Energien. Karlsruhe, Januar
2005.
Fraunhofer Institut für Innovations- und Systemforschung (ISI) (2009): CO2-Minderung
im Stromsektor durch den Einsatz erneuerbarer Energien im Jahr 2006 und
2007. Karlsruhe, Februar 2009.
Grubb, M. (2012): Strengthening the EU ETS. Creating a stable platform for EU energy
sector investment. Climate Strategies, Cambridge.
Öko-Institut (2010): Free allocation of emission allowances and CDM/JI credits within
the EU ETS. Analysis of selected industries and companies in Germany. Study
for WWF Germany, Berlin, December 14, 2010.
Öko-Institut (2011): The Vision Scenario for the European Union - 2011 Update for the
EU-27. Berlin, January 2011.


Öko-Institut Institute for Applied Ecology
Contacts: Hauke Hermann
Felix Chr. Matthes Schicklerstrasse 5-7
D-10179 Berlin Tel.: +49-(0)30-40 50 85-380
[email protected] www.oeko.de
Greenpeace Germany Contact:
Stefan Krug Marienstrasse 19-20
D-10117 Berlin Tel: +49-(0)30-308899-20
[email protected] www.greenpeace.de
Greenpeace EU Unit
Contact: Joris den Blanken
Belliardstraat 199 Rue Belliard B-1040 Brussels
Tel: +32-(0)2-2741919 [email protected]
www.greenpeace.org/eu-unit/en/
WWF Germany Contacts:
Regine Günther Juliette de Grandpré Reinhardtstrasse 14
D-10117 Berlin Tel: +49-(0)30-311777-223
[email protected] www.wwf.de
WWF European Policy Office
Contact: Sam Van Den Plas
168 avenue de Tervuren B-1150 Brussels
Tel: +32 (0)2-7400932 [email protected]
www.wwf.eu
Berlin, June 2012


