Cellular & Molecular Pharmacology Research Group Streptococcus pneumoniae infections in a context of Chronic obstructive pulmonary disease (COPD) Study of the factors contributing to the recurrence of the disease Thesis public defense Nathalie M. Vandevelde Supervisor : Professor Françoise Van Bambeke - Brussels, October 13, 2014 -
Transcript
Cellular & Molecular Pharmacology Research Group
Streptococcus pneumoniae infections in a context of Chronic obstructive pulmonary disease (COPD)
Study of the factors contributing to the recurrence of the disease
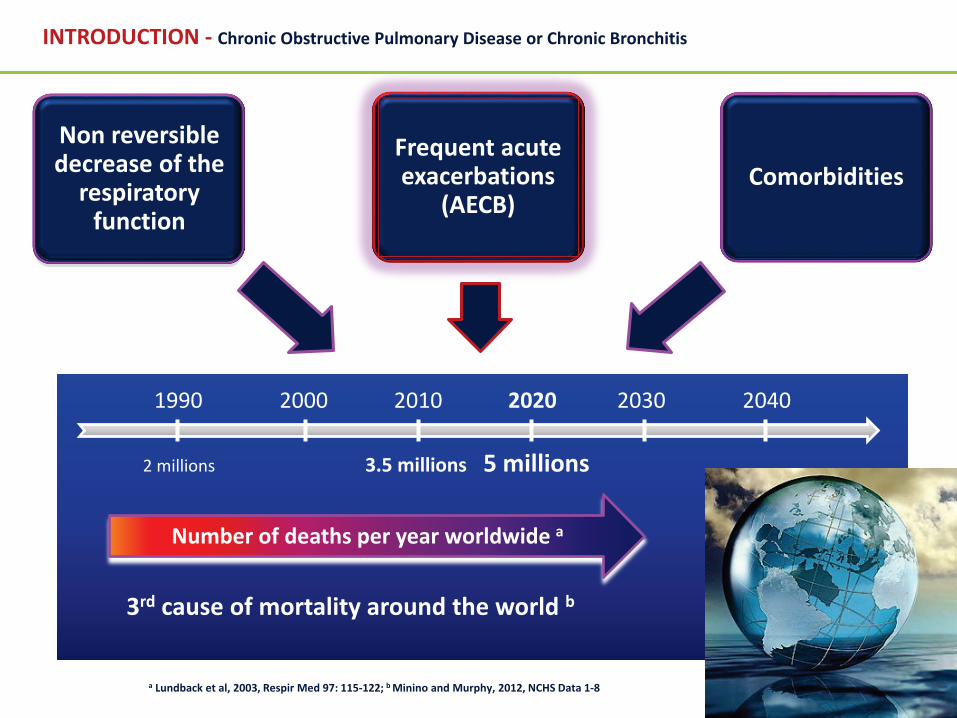
a Lundback et al, 2003, Respir Med 97: 115-122; b Anthonisen et al, 2007,Can Respir J, 14:432-434; c Dos Santos et al, 2012, Am J Physiol Lung CellMol Physiol, 303:627-633; d Sin etal, 2006, Eur Respir J 28: 1245-1257
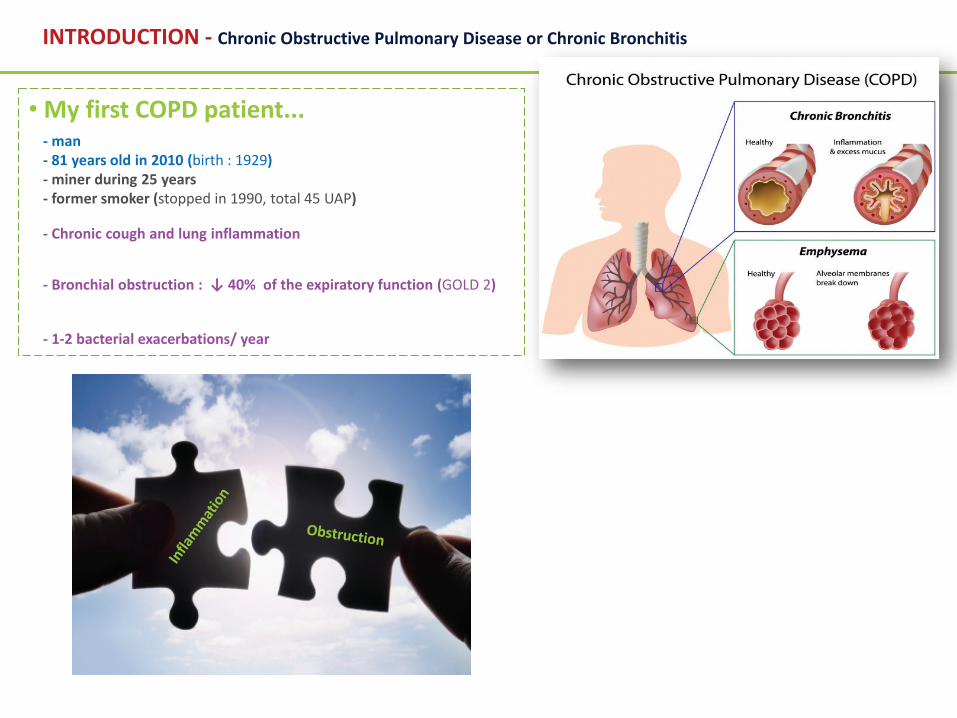
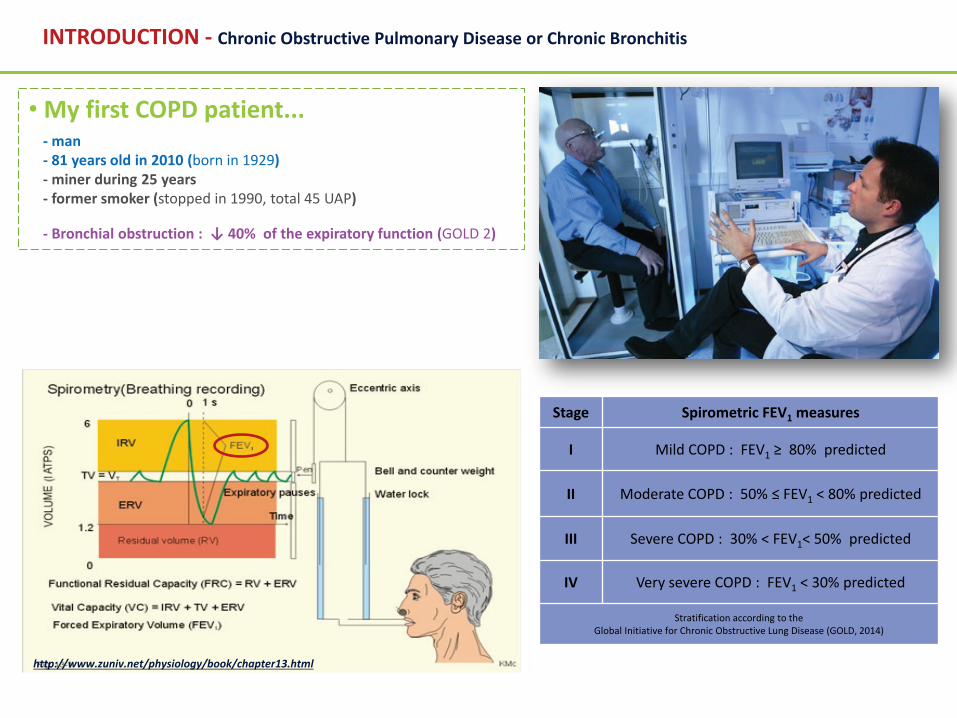
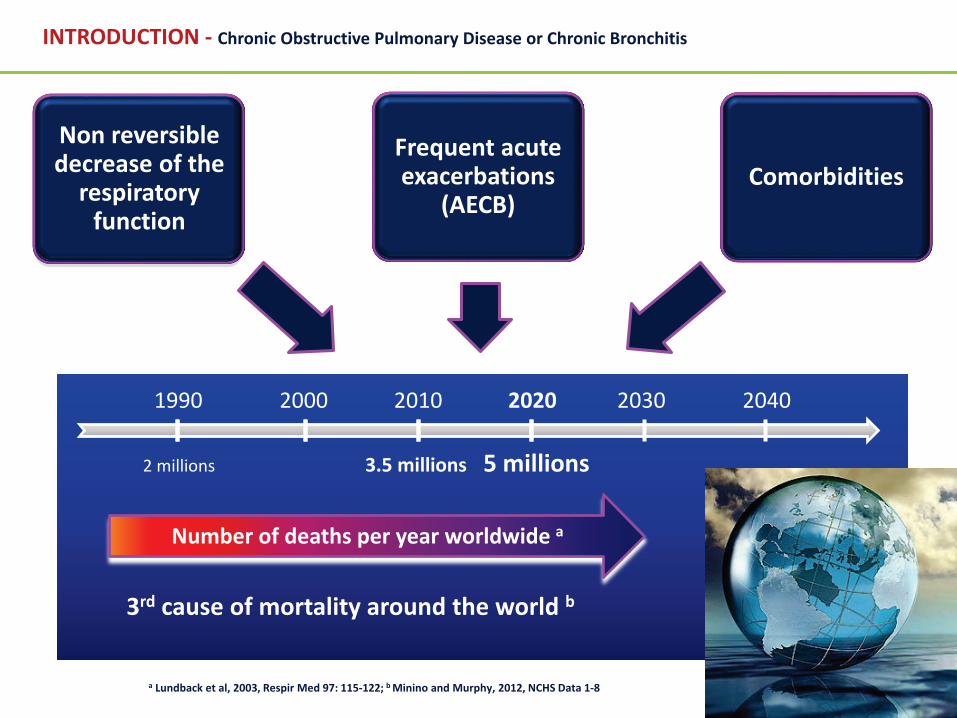
Non-reversible decrease of the respiratory function
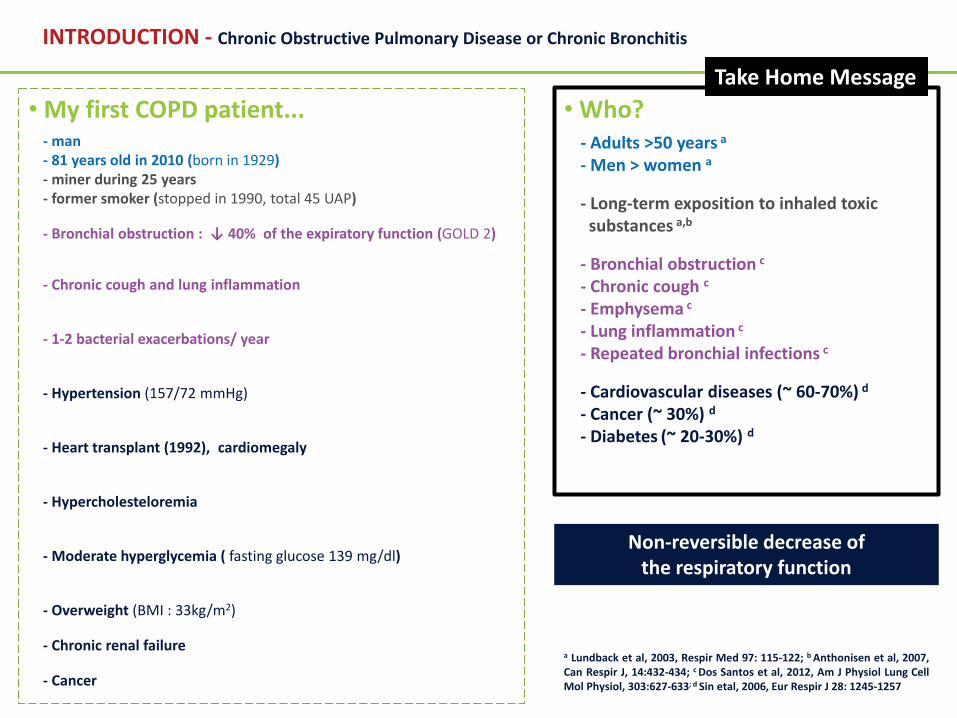
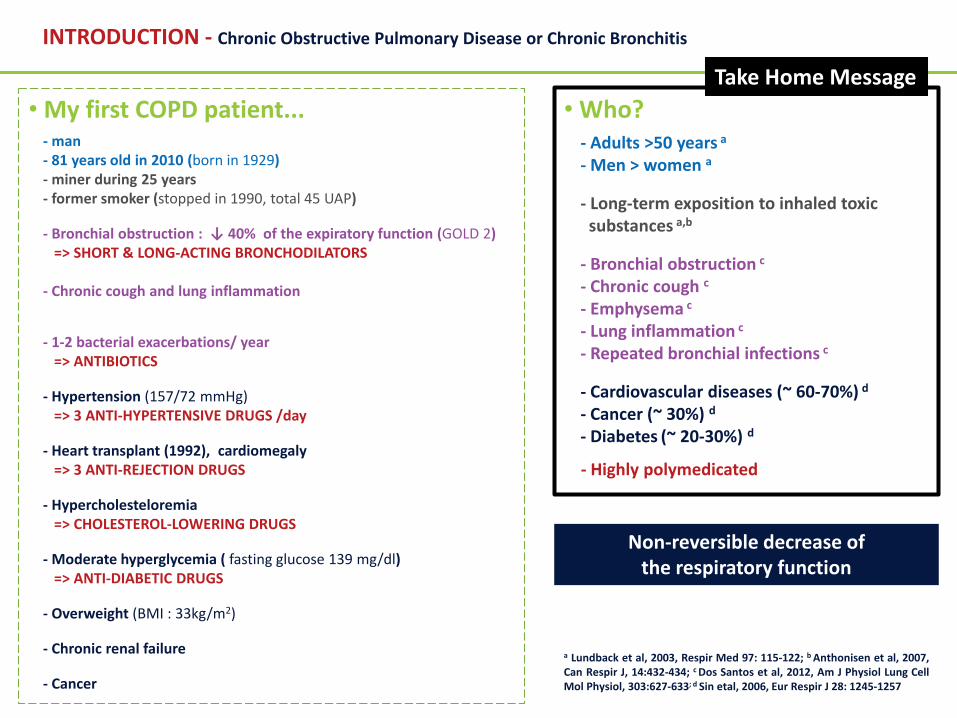
• Who?- Adults >50 years a
- Men > women a
- Long-term exposition to inhaled toxicsubstances a,b
- Bronchial obstruction c
- Chronic cough c
- Emphysema c
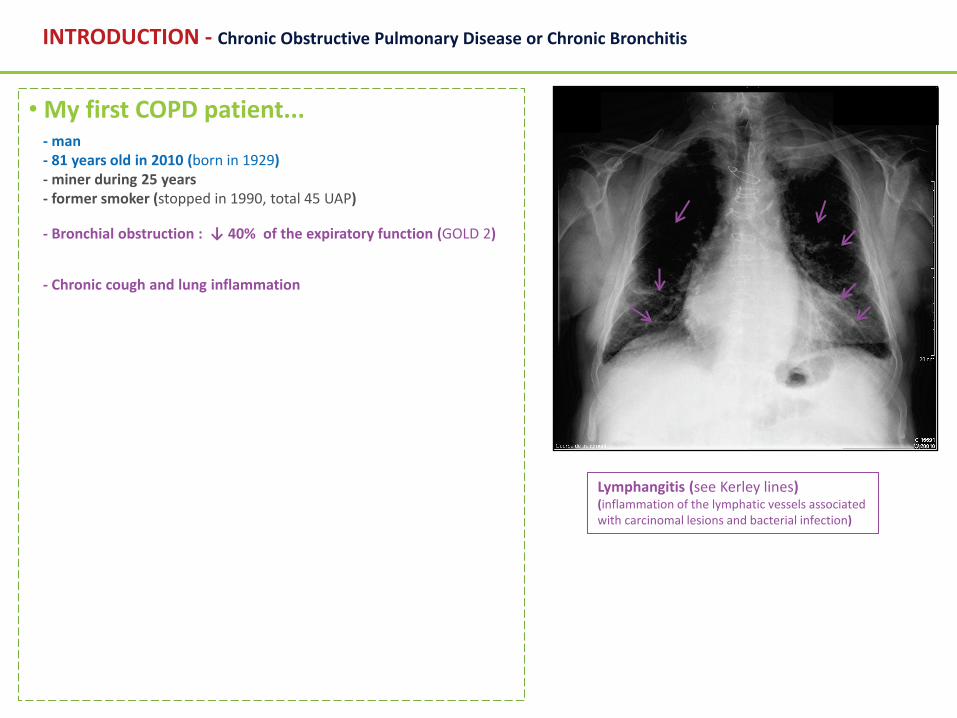
- Lung inflammation c
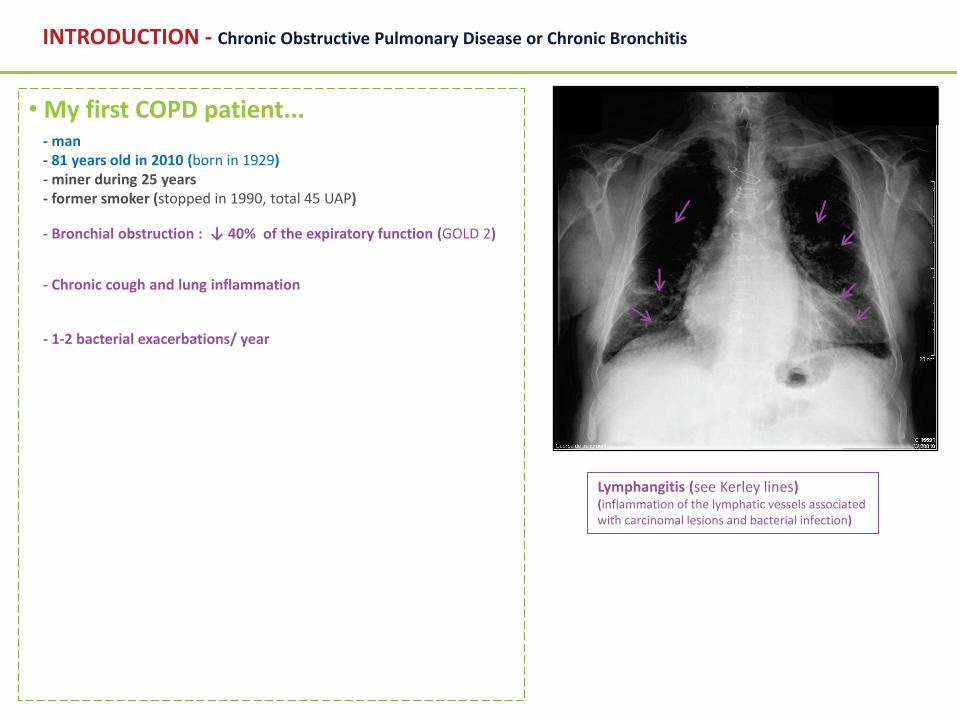
- Repeated bronchial infections c
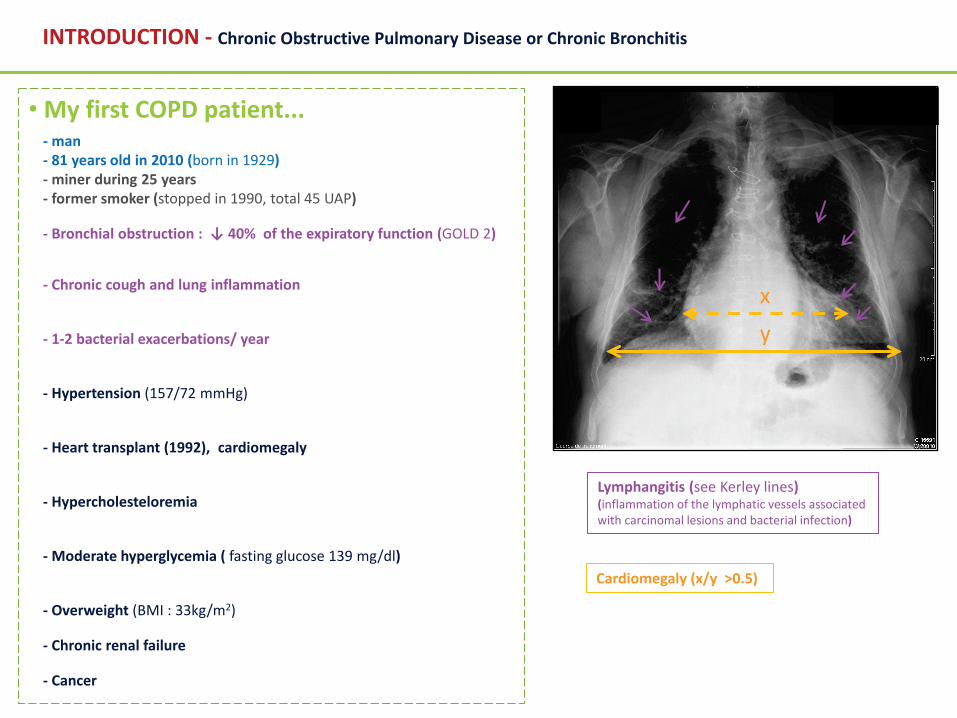
- Cardiovascular diseases (~ 60-70%) d
- Cancer (~ 30%) d- Diabetes (~ 20-30%) d
- Highly polymedicated
Take Home Message
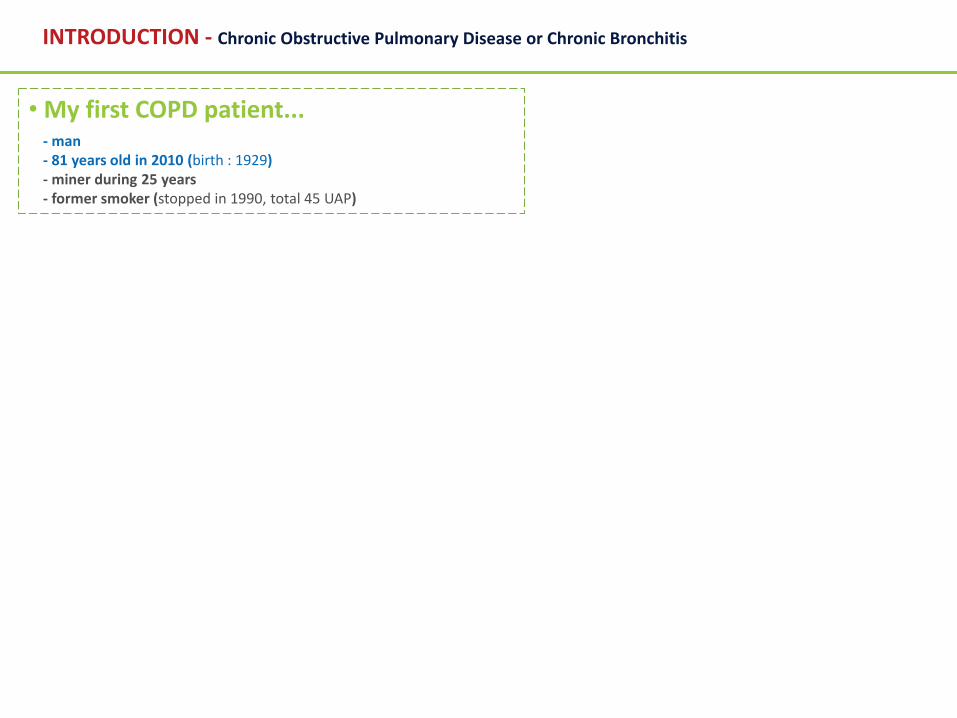
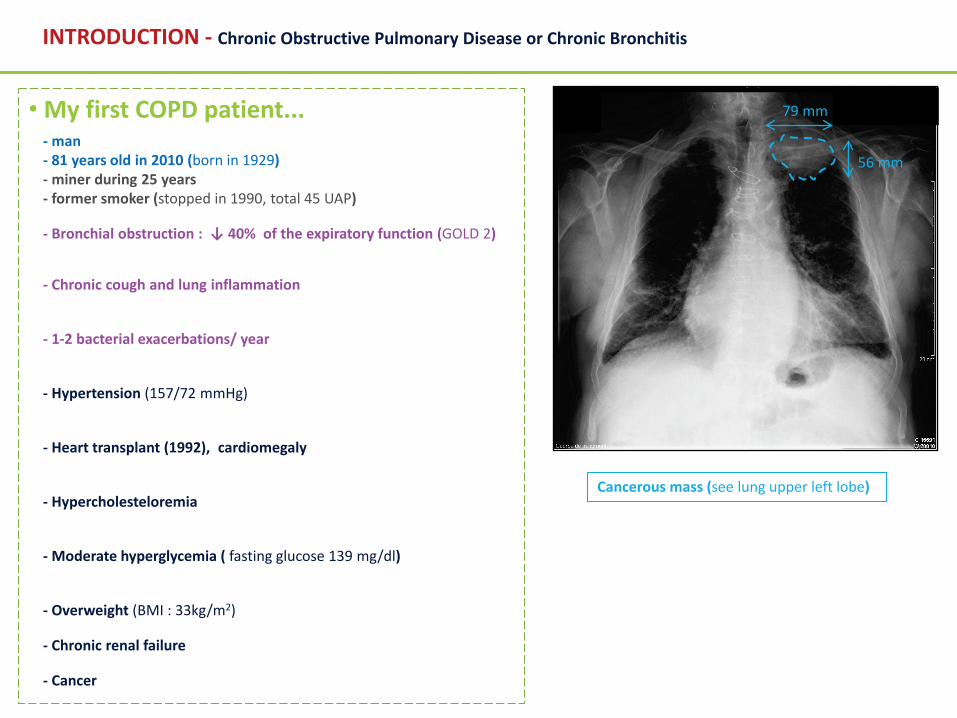
INTRODUCTION - Chronic Obstructive Pulmonary Disease or Chronic Bronchitis
a Lundback et al, 2003, Respir Med 97: 115-122; b Anthonisen et al, 2007,Can Respir J, 14:432-434; c Dos Santos et al, 2012, Am J Physiol Lung CellMol Physiol, 303:627-633; d Sin etal, 2006, Eur Respir J 28: 1245-1257
Non-reversible decrease of the respiratory function
• Who?- Adults >50 years a
- Men > women a
- Long-term exposition to inhaled toxicsubstances a,b
- Bronchial obstruction c
- Chronic cough c
- Emphysema c
- Lung inflammation c
- Repeated bronchial infections c
- Cardiovascular diseases (~ 60-70%) d
- Cancer (~ 30%) d- Diabetes (~ 20-30%) d
- Highly polymedicated
INTRODUCTION - Chronic Obstructive Pulmonary Disease or Chronic Bronchitis
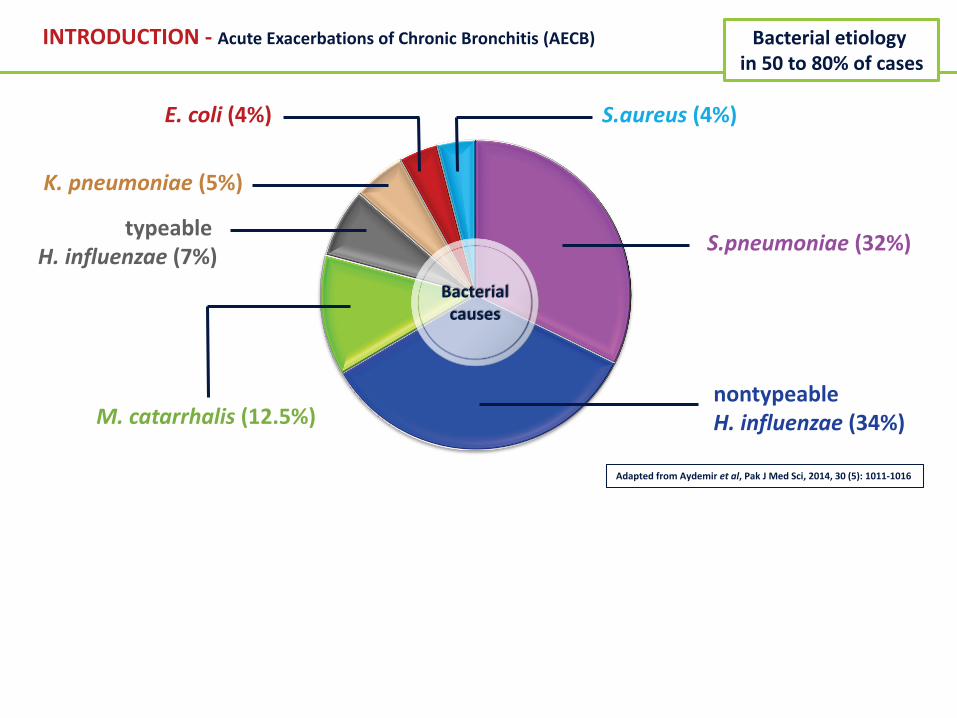
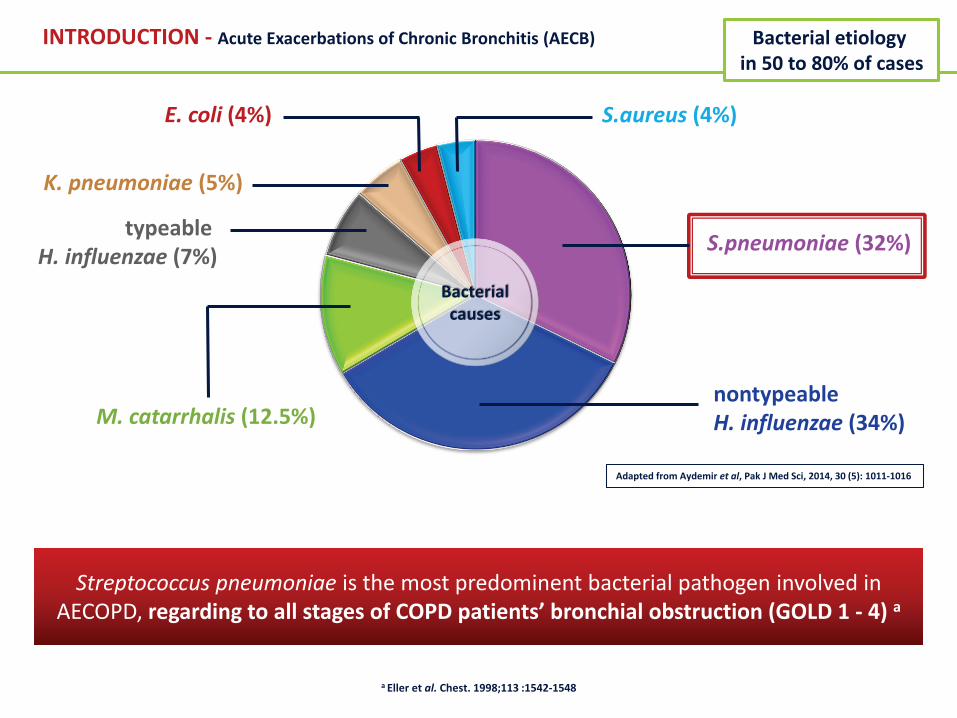
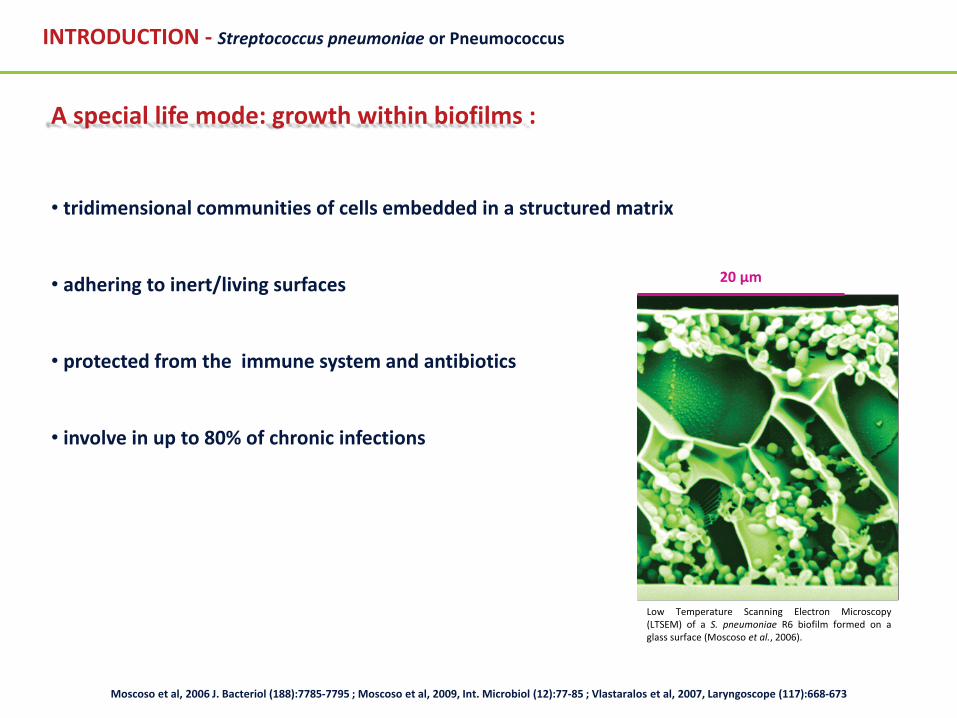
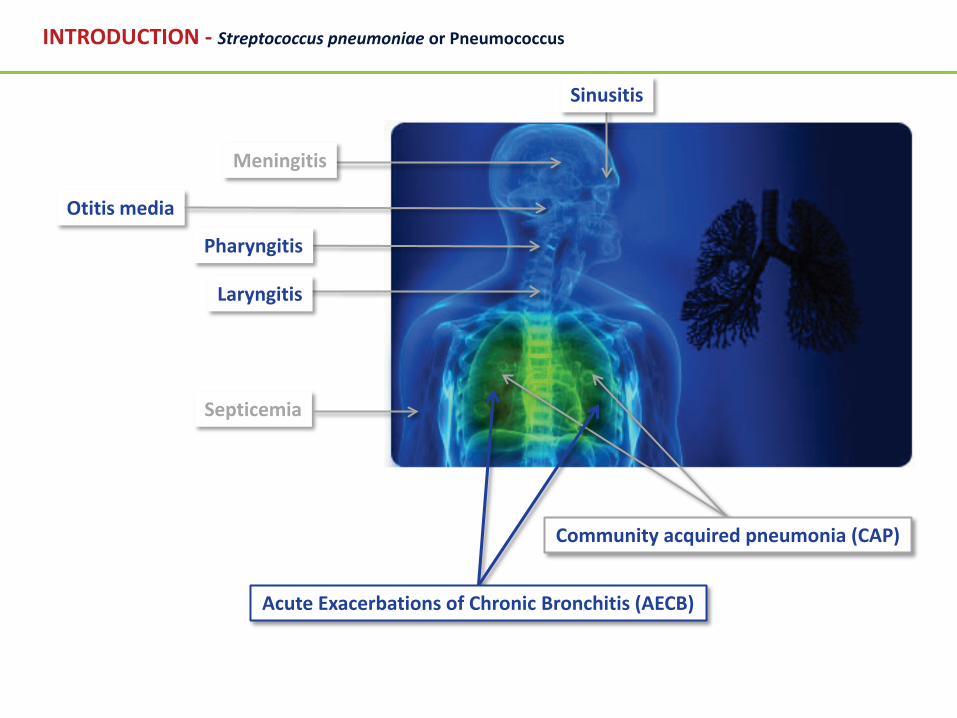
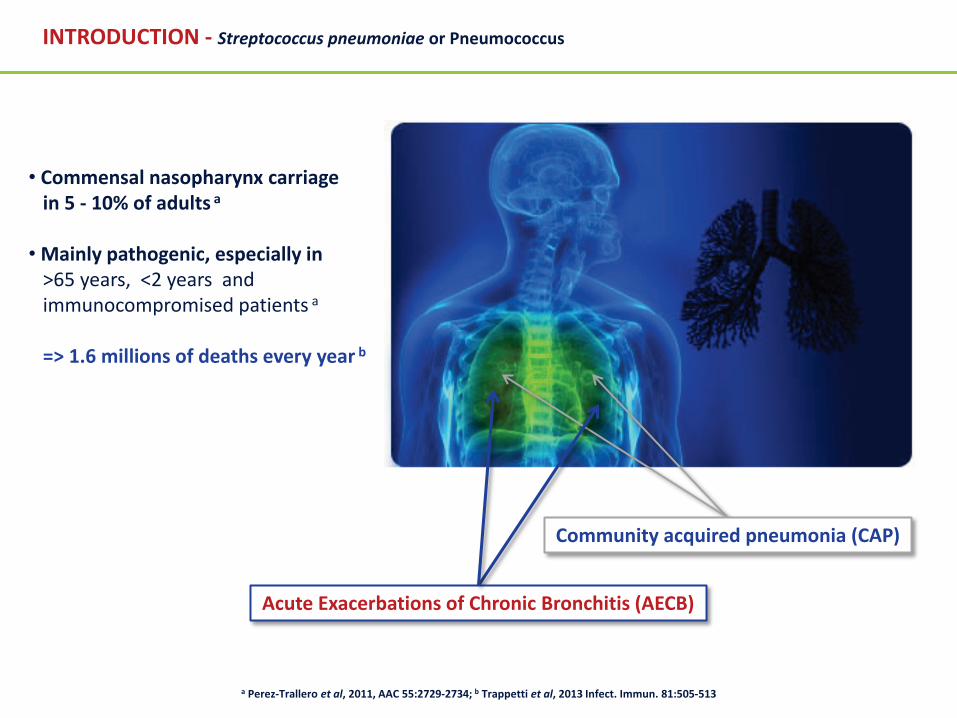
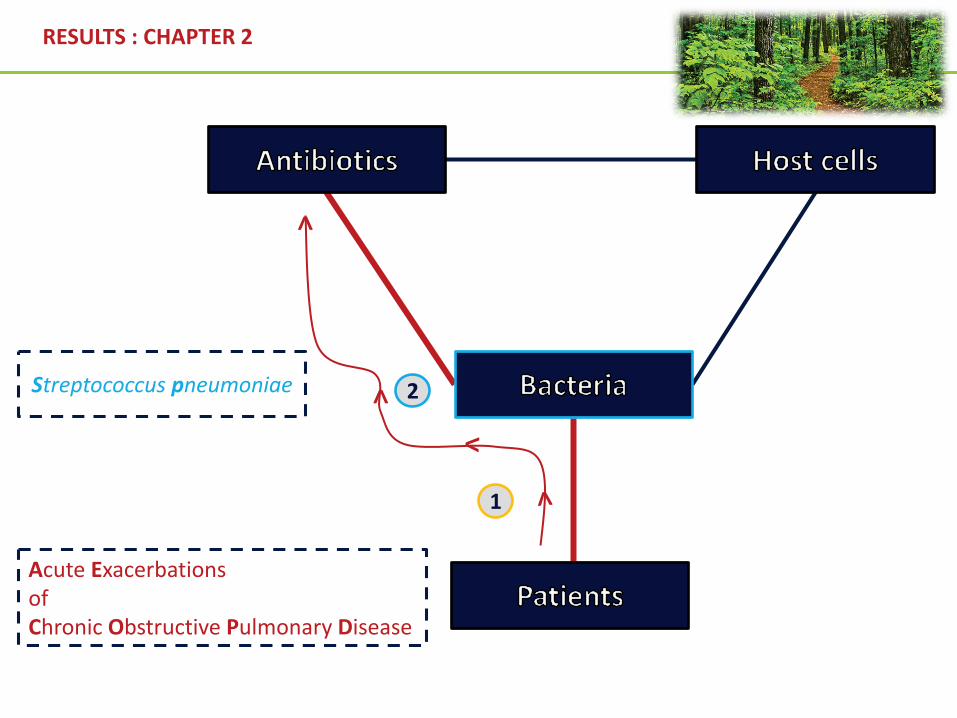
INTRODUCTION - Acute Exacerbations of Chronic Bronchitis (AECB)
S.pneumoniae (32%)
nontypeableH. influenzae (34%)
S.aureus (4%)E. coli (4%)
M. catarrhalis (12.5%)
typeableH. influenzae (7%)
K. pneumoniae (5%)
Adapted from Aydemir et al, Pak J Med Sci, 2014, 30 (5): 1011-1016
Bacterialcauses
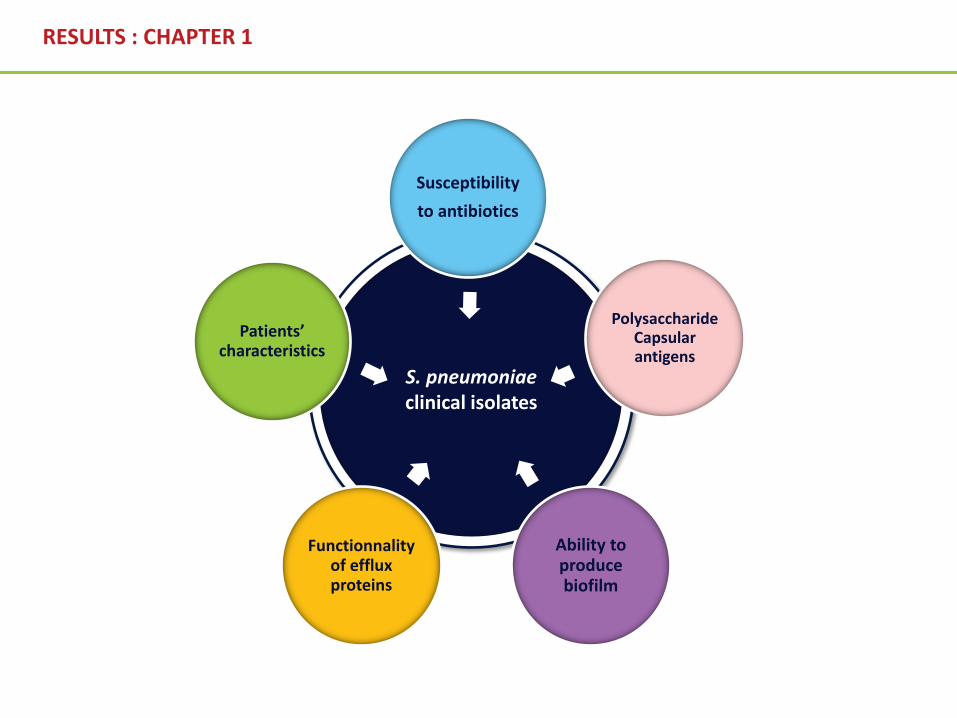
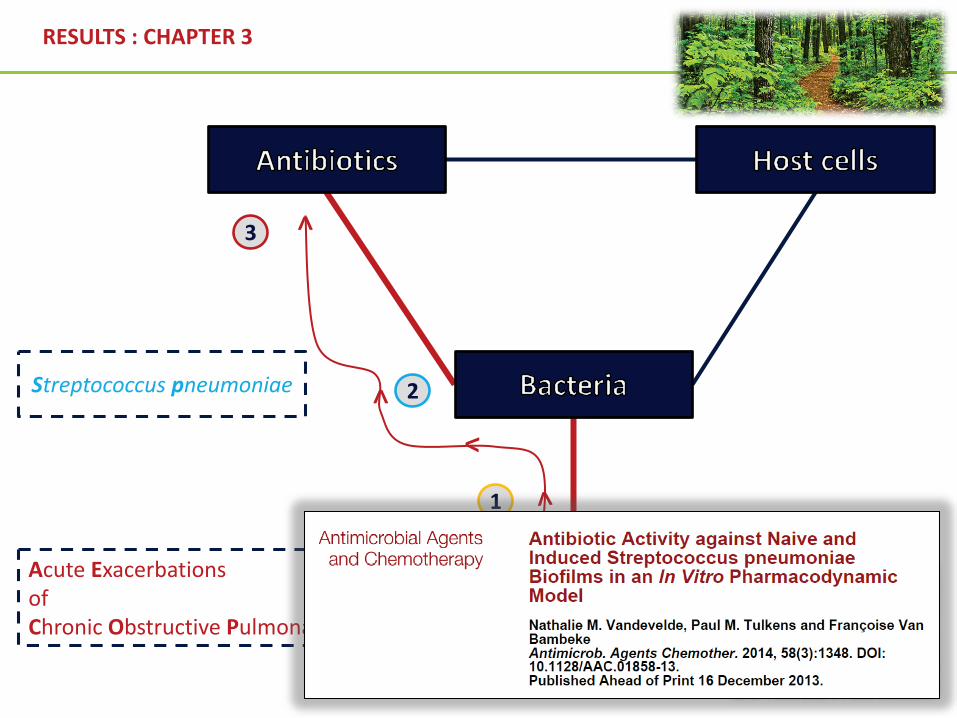
Streptococcus pneumoniae is the most predominent bacterial pathogen involved in AECOPD, regarding to all stages of COPD patients’ bronchial obstruction (GOLD 1 - 4) a
Antibiotics mode of action Antibiotic classes Antibiotic
molecules
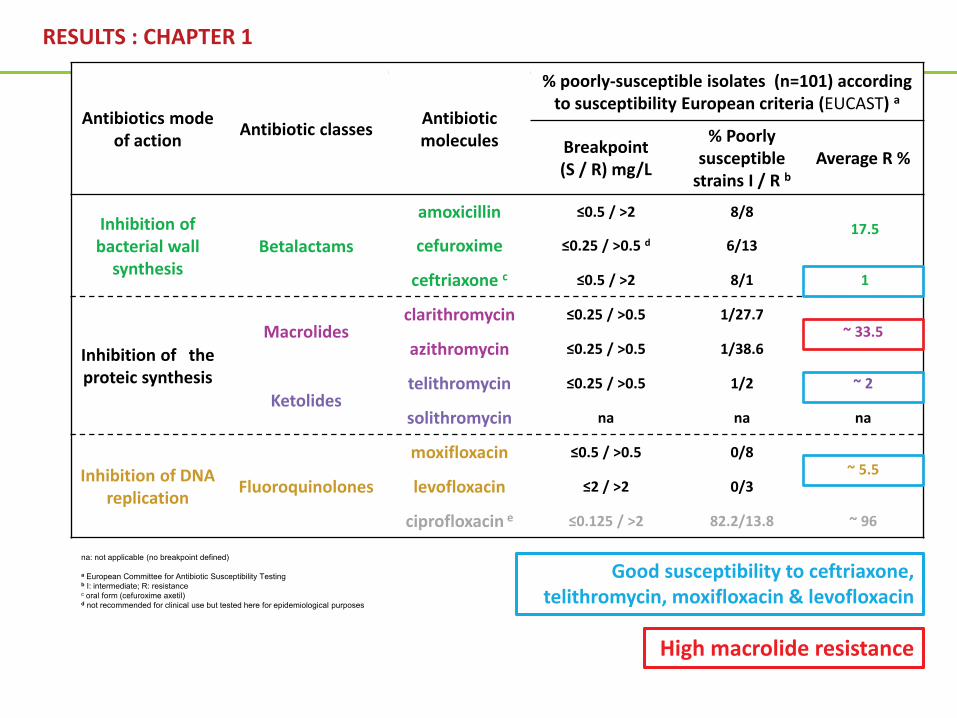
% poorly-susceptible isolates (n=101) accordingto susceptibility European criteria (EUCAST) a
Breakpoint (S / R) mg/L
% Poorlysusceptible
strains I / R bAverage R %
Inhibition of bacterial wall
synthesisBetalactams
amoxicillin ≤0.5 / >2 8/817.5
cefuroxime ≤0.25 / >0.5 d 6/13
ceftriaxone c ≤0.5 / >2 8/1 1
Inhibition of the proteic synthesis
Macrolidesclarithromycin ≤0.25 / >0.5 1/27.7
~ 33.5 azithromycin ≤0.25 / >0.5 1/38.6
Ketolidestelithromycin ≤0.25 / >0.5 1/2 ~ 2
solithromycin na na na
Inhibition of DNA replication Fluoroquinolones
moxifloxacin ≤0.5 / >0.5 0/8~ 5.5
levofloxacin ≤2 / >2 0/3
ciprofloxacin e ≤0.125 / >2 82.2/13.8 ~ 96
na: not applicable (no breakpoint defined)
a European Committee for Antibiotic Susceptibility Testingb I: intermediate; R: resistancec oral form (cefuroxime axetil)d not recommended for clinical use but tested here for epidemiological purposes
Antibiotics mode of action Antibiotic classes Antibiotic
molecules
% poorly-susceptible isolates (n=101) accordingto susceptibility European criteria (EUCAST) a
Breakpoint (S / R) mg/L
% Poorlysusceptible
strains I / R bAverage R %
Inhibition of bacterial wall
synthesisBetalactams
amoxicillin ≤0.5 / >2 8/817.5
cefuroxime ≤0.25 / >0.5 d 6/13
ceftriaxone c ≤0.5 / >2 8/1 1
Inhibition of the proteic synthesis
Macrolidesclarithromycin ≤0.25 / >0.5 1/27.7
~ 33.5 azithromycin ≤0.25 / >0.5 1/38.6
Ketolidestelithromycin ≤0.25 / >0.5 1/2 ~ 2
solithromycin na na na
Inhibition of DNA replication Fluoroquinolones
moxifloxacin ≤0.5 / >0.5 0/8~ 5.5
levofloxacin ≤2 / >2 0/3
ciprofloxacin e ≤0.125 / >2 82.2/13.8 ~ 96
na: not applicable (no breakpoint defined)
a European Committee for Antibiotic Susceptibility Testingb I: intermediate; R: resistancec oral form (cefuroxime axetil)d not recommended for clinical use but tested here for epidemiological purposes
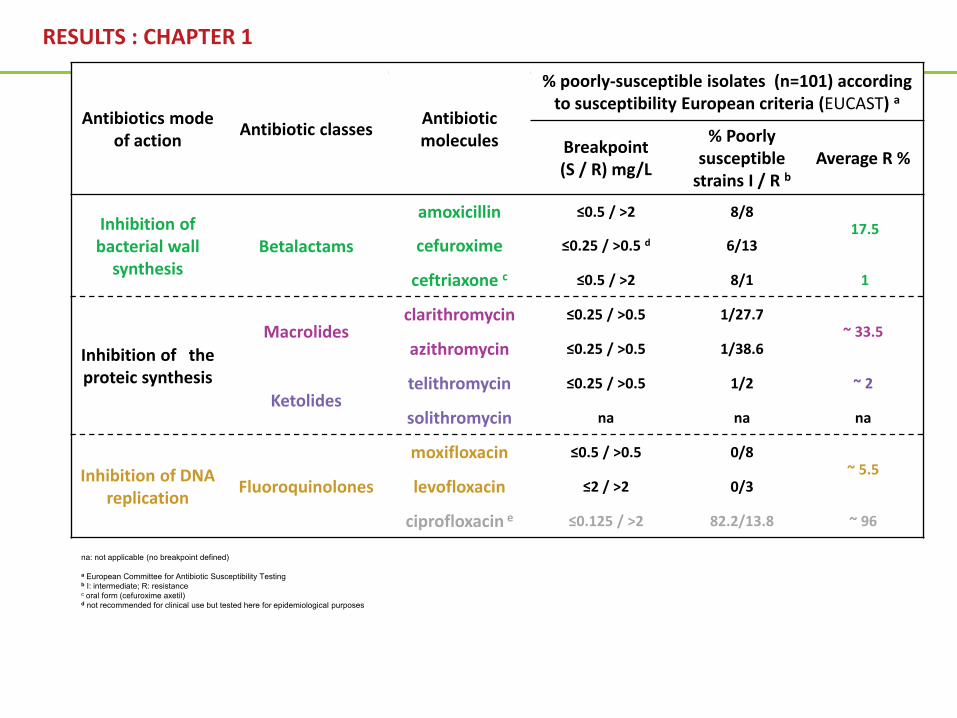
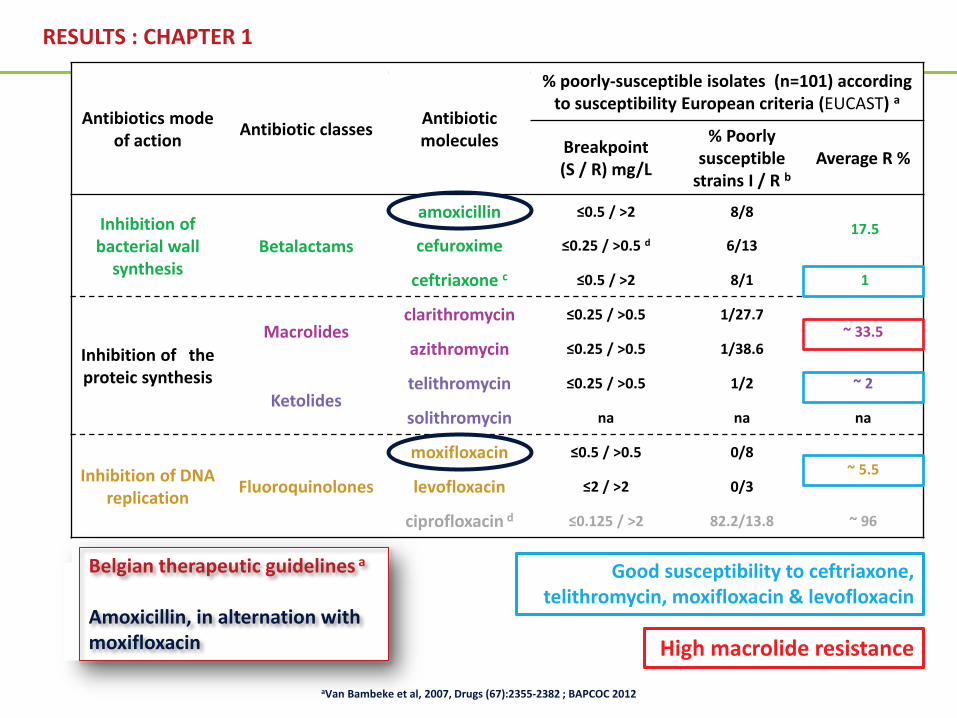
High macrolide resistance
Good susceptibility to ceftriaxone,telithromycin, moxifloxacin & levofloxacin
a European Committee for Antibiotic Susceptibility Testingb I: intermediate; R: resistancec oral form (cefuroxime axetil)d not recommended for clinical use but tested here for epidemiological purposes
RESULTS : CHAPTER 1
Antibiotics mode of action Antibiotic classes Antibiotic
molecules
% poorly-susceptible isolates (n=101) accordingto susceptibility European criteria (EUCAST) a
Breakpoint (S / R) mg/L
% Poorlysusceptible
strains I / R bAverage R %
Inhibition of bacterial wall
synthesisBetalactams
amoxicillin ≤0.5 / >2 8/817.5
cefuroxime ≤0.25 / >0.5 d 6/13
ceftriaxone c ≤0.5 / >2 8/1 1
Inhibition of the proteic synthesis
Macrolidesclarithromycin ≤0.25 / >0.5 1/27.7
~ 33.5 azithromycin ≤0.25 / >0.5 1/38.6
Ketolidestelithromycin ≤0.25 / >0.5 1/2 ~ 2
solithromycin na na na
Inhibition of DNA replication Fluoroquinolones
moxifloxacin ≤0.5 / >0.5 0/8~ 5.5
levofloxacin ≤2 / >2 0/3
ciprofloxacin d ≤0.125 / >2 82.2/13.8 ~ 96
High macrolide resistance
Good susceptibility to ceftriaxone,telithromycin, moxifloxacin & levofloxacin
Belgian therapeutic guidelines a
Amoxicillin, in alternation withmoxifloxacin
aVan Bambeke et al, 2007, Drugs (67):2355-2382 ; BAPCOC 2012
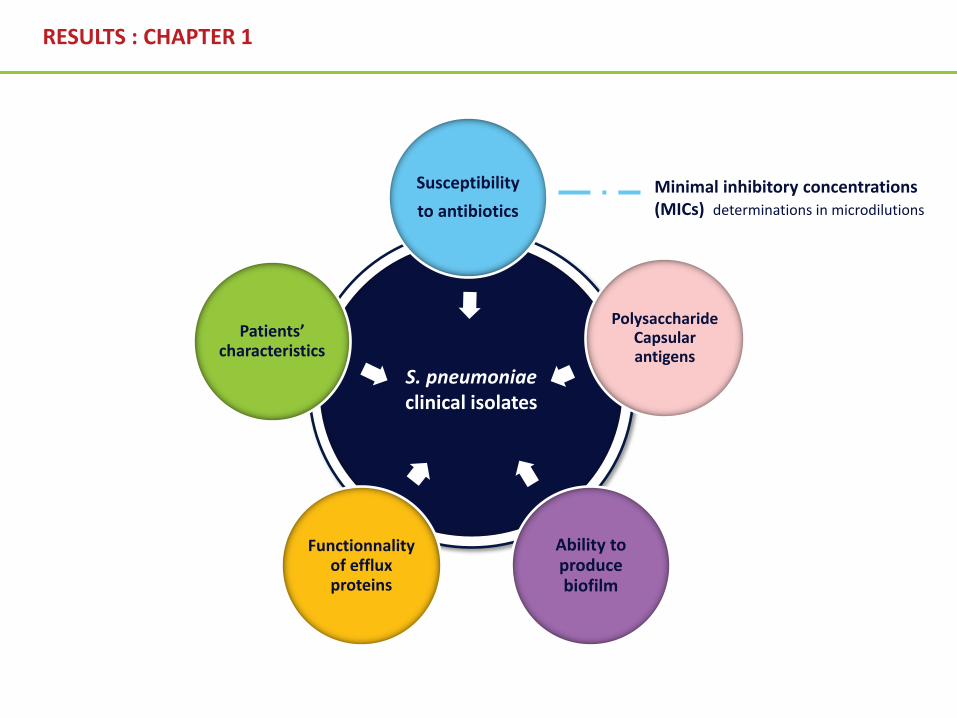
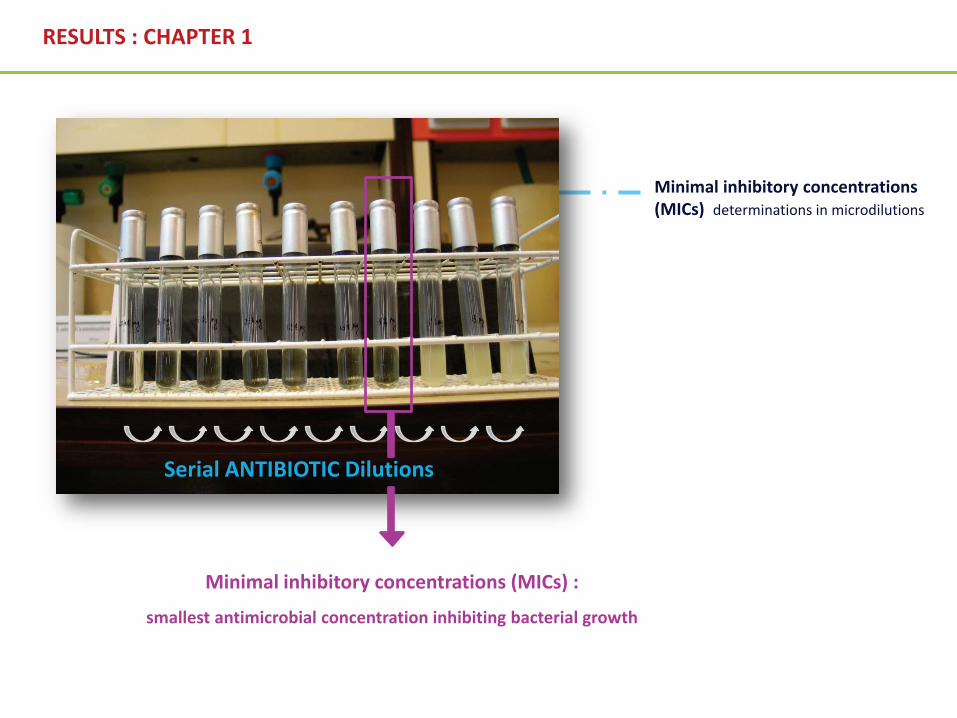
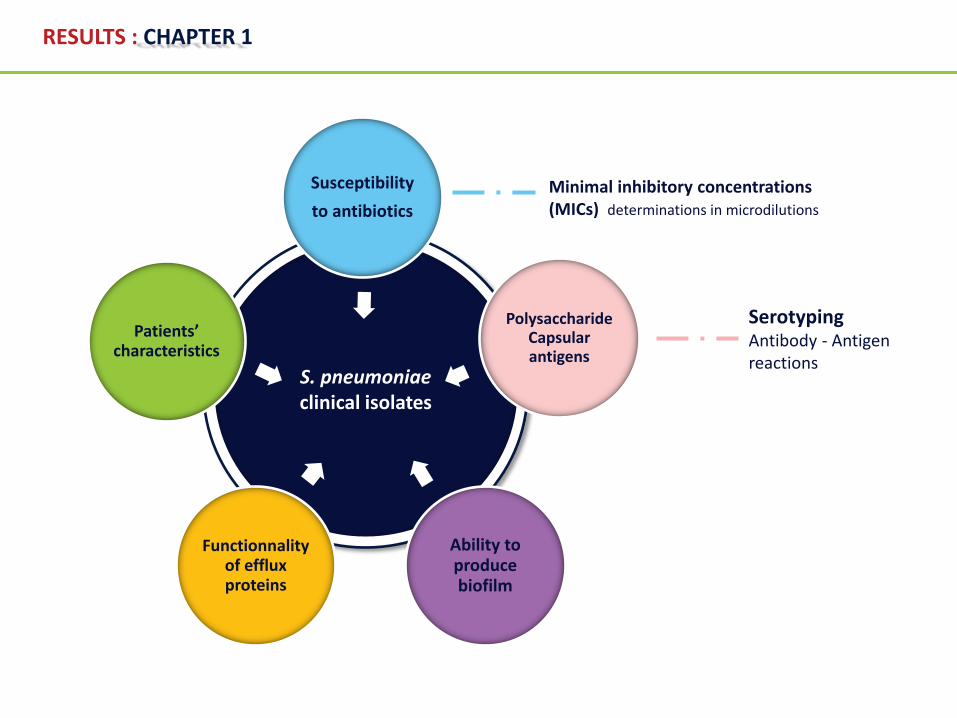
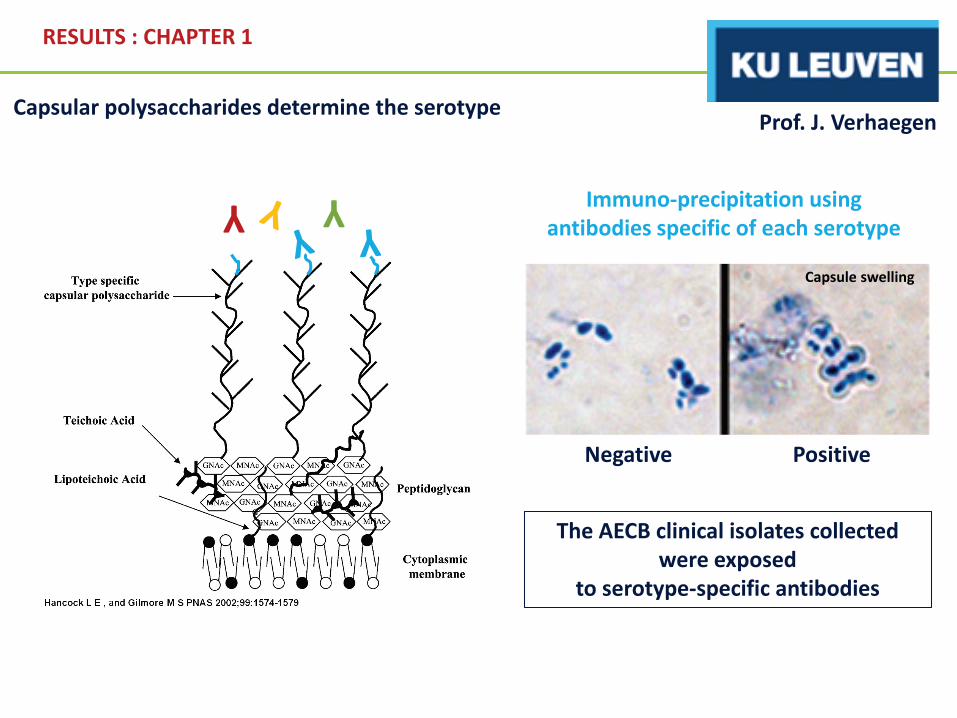
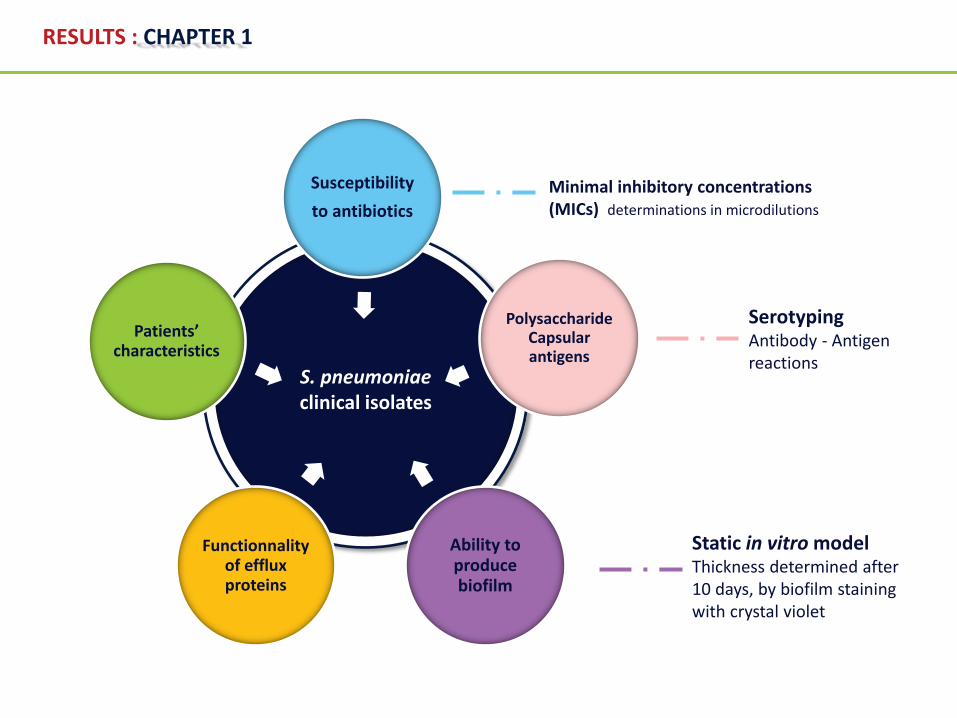
Minimal inhibitory concentrations (MICs) determinations in microdilutions
SerotypingAntibody - Antigenreactions
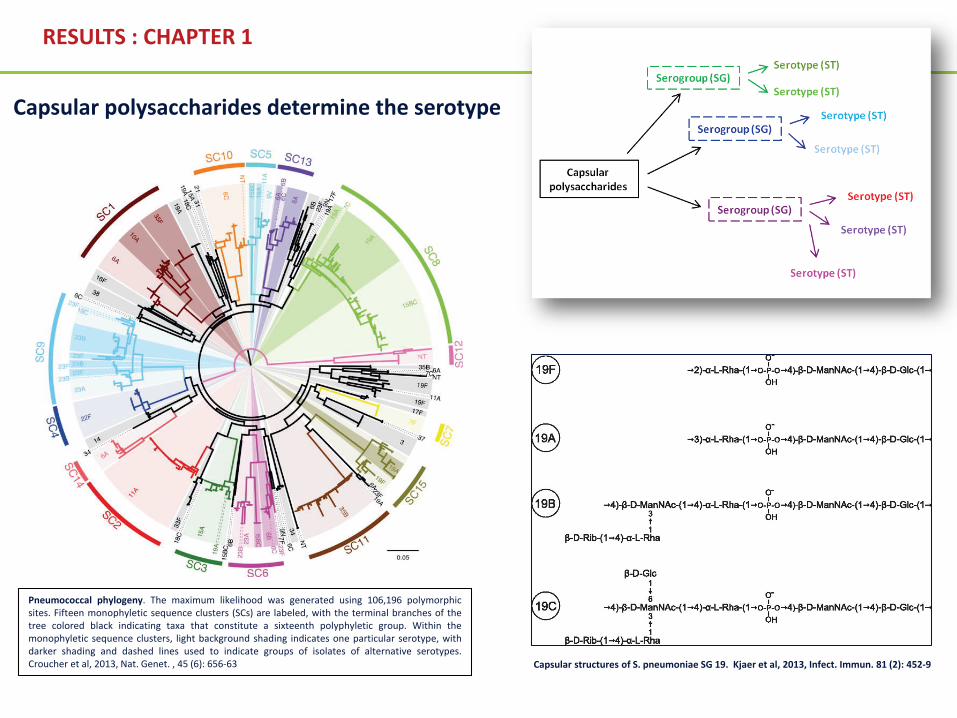
Pneumococcal phylogeny. The maximum likelihood was generated using 106,196 polymorphicsites. Fifteen monophyletic sequence clusters (SCs) are labeled, with the terminal branches of thetree colored black indicating taxa that constitute a sixteenth polyphyletic group. Within themonophyletic sequence clusters, light background shading indicates one particular serotype, withdarker shading and dashed lines used to indicate groups of isolates of alternative serotypes.Croucher et al, 2013, Nat. Genet. , 45 (6): 656-63 Capsular structures of S. pneumoniae SG 19. Kjaer et al, 2013, Infect. Immun. 81 (2): 452-9
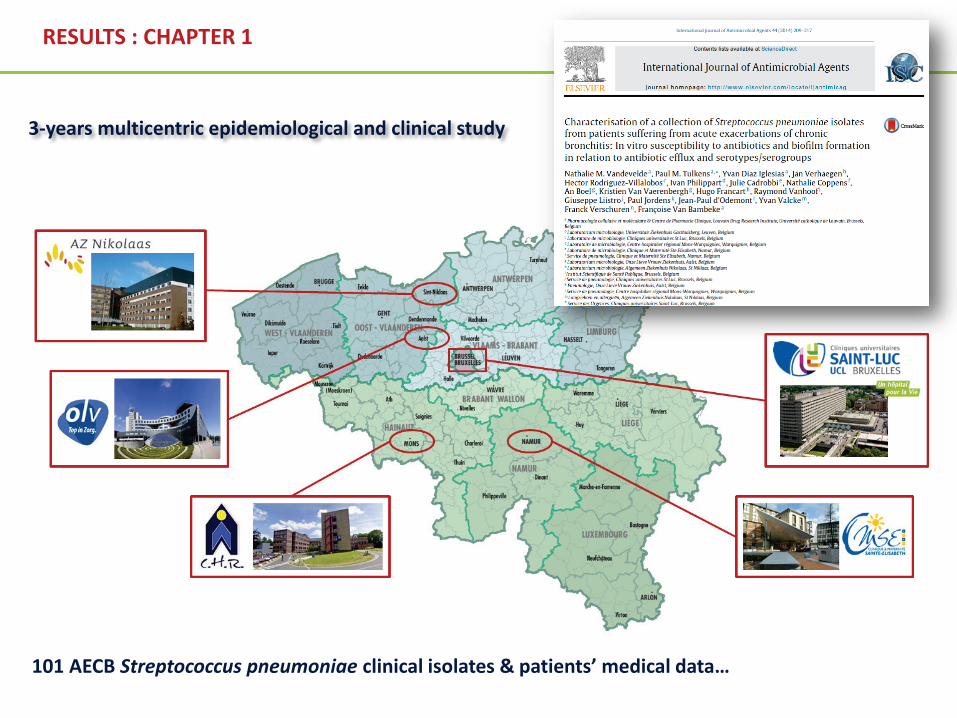
RESULTS : CHAPTER 1 : 3-years epidemiological study
ST
19A
SG
9S
G 1
9S
T 14
SG
33
SG
15
ST
5S
G 2
7S
G 3
4S
T 20
SG
6S
G 3
5 S
T 3
ST
4S
G 2
2S
G 1
7S
G 1
8S
G 2
4S
G 1
1 S
G 1
2 S
T 8
ST
35B
SG
31
ST
10S
G 2
3S
G 2
9S
G 7
9.8×10-042.0×10-033.9×10-030.0078130.015625
0.031250.0625
0.1250.25
0.51248
163264
128256512
clarithromycin
Serotypes (ST) or serogroups (SG)
Min
imal
inhi
bito
ryco
ncen
trat
ions
(mg/
L)
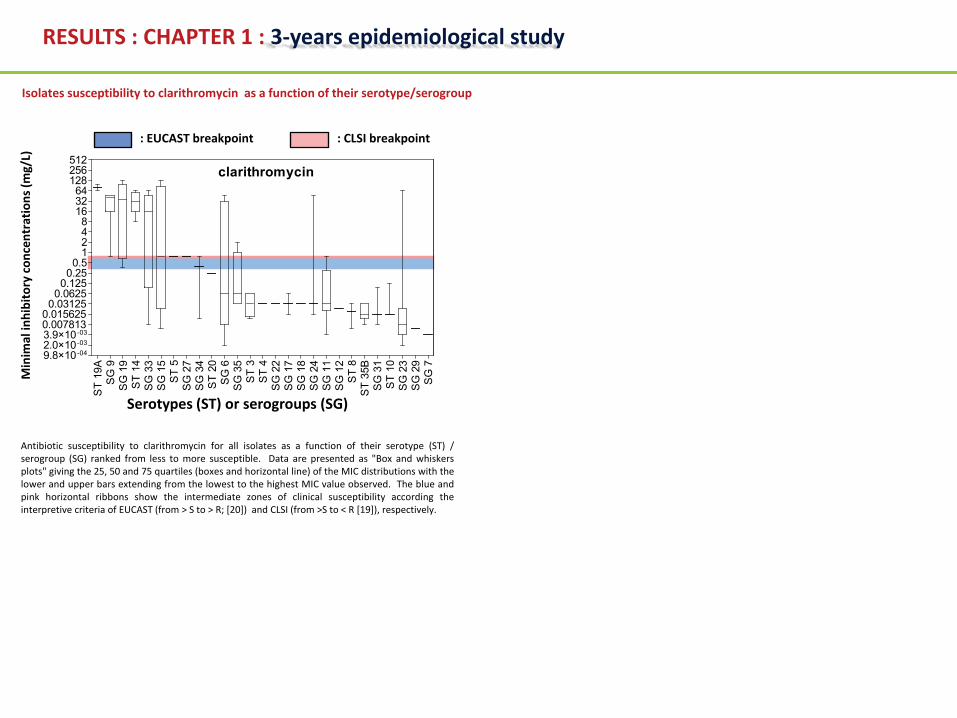
Antibiotic susceptibility to clarithromycin for all isolates as a function of their serotype (ST) /serogroup (SG) ranked from less to more susceptible. Data are presented as "Box and whiskersplots" giving the 25, 50 and 75 quartiles (boxes and horizontal line) of the MIC distributions with thelower and upper bars extending from the lowest to the highest MIC value observed. The blue andpink horizontal ribbons show the intermediate zones of clinical susceptibility according theinterpretive criteria of EUCAST (from > S to > R; [20]) and CLSI (from >S to < R [19]), respectively.
Isolates susceptibility to clarithromycin as a function of their serotype/serogroup
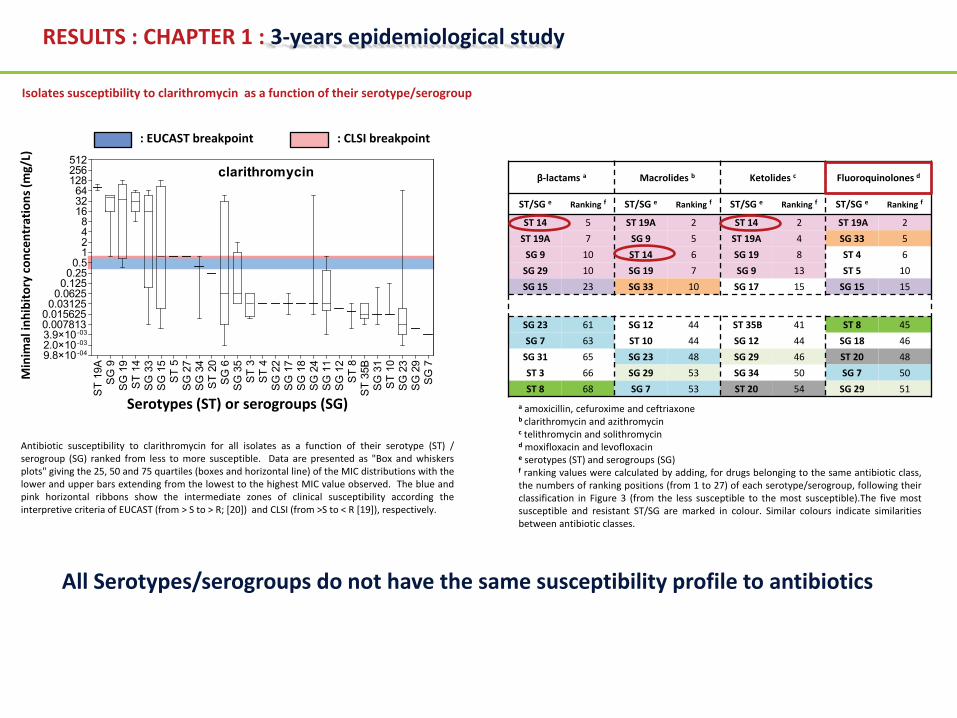
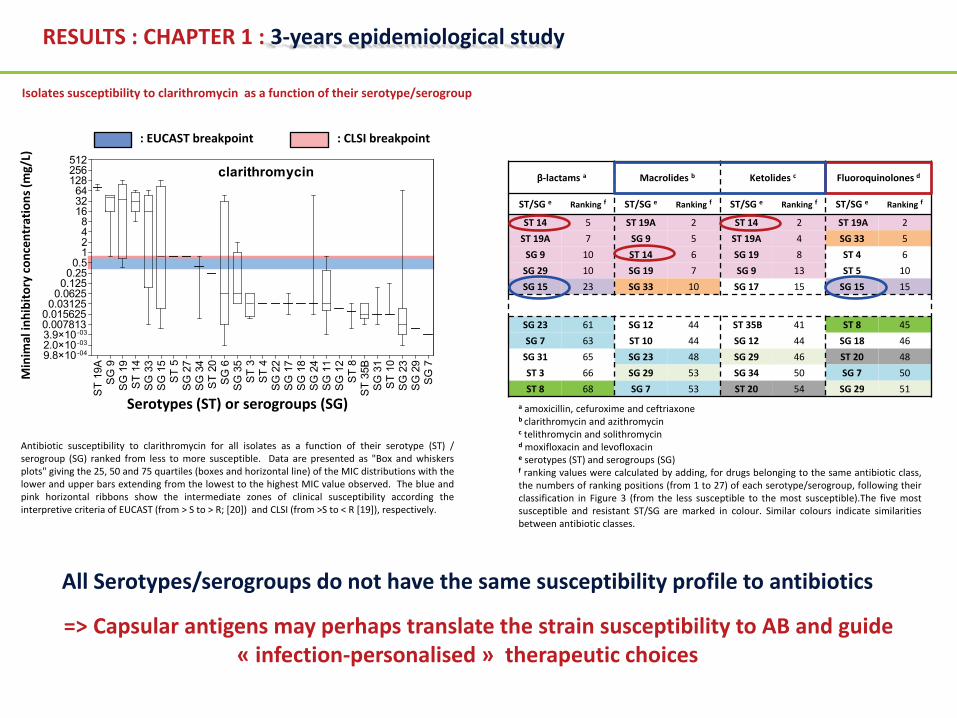
a amoxicillin, cefuroxime and ceftriaxoneb clarithromycin and azithromycinc telithromycin and solithromycind moxifloxacin and levofloxacine serotypes (ST) and serogroups (SG)f ranking values were calculated by adding, for drugs belonging to the same antibiotic class,the numbers of ranking positions (from 1 to 27) of each serotype/serogroup, following theirclassification in Figure 3 (from the less susceptible to the most susceptible).The five mostsusceptible and resistant ST/SG are marked in colour. Similar colours indicate similaritiesbetween antibiotic classes.
All Serotypes/serogroups do not have the same susceptibility profile to antibiotics
Isolates susceptibility to clarithromycin as a function of their serotype/serogroup
Antibiotic susceptibility to clarithromycin for all isolates as a function of their serotype (ST) /serogroup (SG) ranked from less to more susceptible. Data are presented as "Box and whiskersplots" giving the 25, 50 and 75 quartiles (boxes and horizontal line) of the MIC distributions with thelower and upper bars extending from the lowest to the highest MIC value observed. The blue andpink horizontal ribbons show the intermediate zones of clinical susceptibility according theinterpretive criteria of EUCAST (from > S to > R; [20]) and CLSI (from >S to < R [19]), respectively.
a amoxicillin, cefuroxime and ceftriaxoneb clarithromycin and azithromycinc telithromycin and solithromycind moxifloxacin and levofloxacine serotypes (ST) and serogroups (SG)f ranking values were calculated by adding, for drugs belonging to the same antibiotic class,the numbers of ranking positions (from 1 to 27) of each serotype/serogroup, following theirclassification in Figure 3 (from the less susceptible to the most susceptible).The five mostsusceptible and resistant ST/SG are marked in colour. Similar colours indicate similaritiesbetween antibiotic classes.
Isolates susceptibility to clarithromycin as a function of their serotype/serogroup
Antibiotic susceptibility to clarithromycin for all isolates as a function of their serotype (ST) /serogroup (SG) ranked from less to more susceptible. Data are presented as "Box and whiskersplots" giving the 25, 50 and 75 quartiles (boxes and horizontal line) of the MIC distributions with thelower and upper bars extending from the lowest to the highest MIC value observed. The blue andpink horizontal ribbons show the intermediate zones of clinical susceptibility according theinterpretive criteria of EUCAST (from > S to > R; [20]) and CLSI (from >S to < R [19]), respectively.
All Serotypes/serogroups do not have the same susceptibility profile to antibiotics
=> Capsular antigens may perhaps translate the strain susceptibility to AB and guide « infection-personalised » therapeutic choices
RESULTS : CHAPTER 1 : 3-years epidemiological study
SG 2
2 (n
=2)
ST 2
0 (n
=1)
SG 9
(n=4
)
SG 2
7 (n
=1)
SG 1
8 (n
=1)
ST
8 (n
=2)
SG 3
3 (n
=4)
SG 3
1 (n
=3)
SG 2
3 (n
=11)
SG 1
5 (n
=8)
SG 3
5 (n
=10)
SG 1
9 (n
=8)
SG 3
4 (n
=2)
SG
12
(n=1
)
SG
6 (n
=11)
SG 1
7 (n
=3)
SG 2
4 (n
=3)
SG 1
1 (n
=9)
ST 1
4 (n
=5)
ST 1
0 (n
=3)
ST
4 (n
=1)
ST
3 (n
=5)
SG 7
(n=1
)
SG 2
9 (n
=1)
ST 5
(n=1
)
ATC
C49
619
0
50
100
150
200
250
**** 0
50
100
150
200
250
Serotypes (ST)/Serogroups (SG)
Bio
film
thic
knes
s (C
V ab
s 57
0nm
)
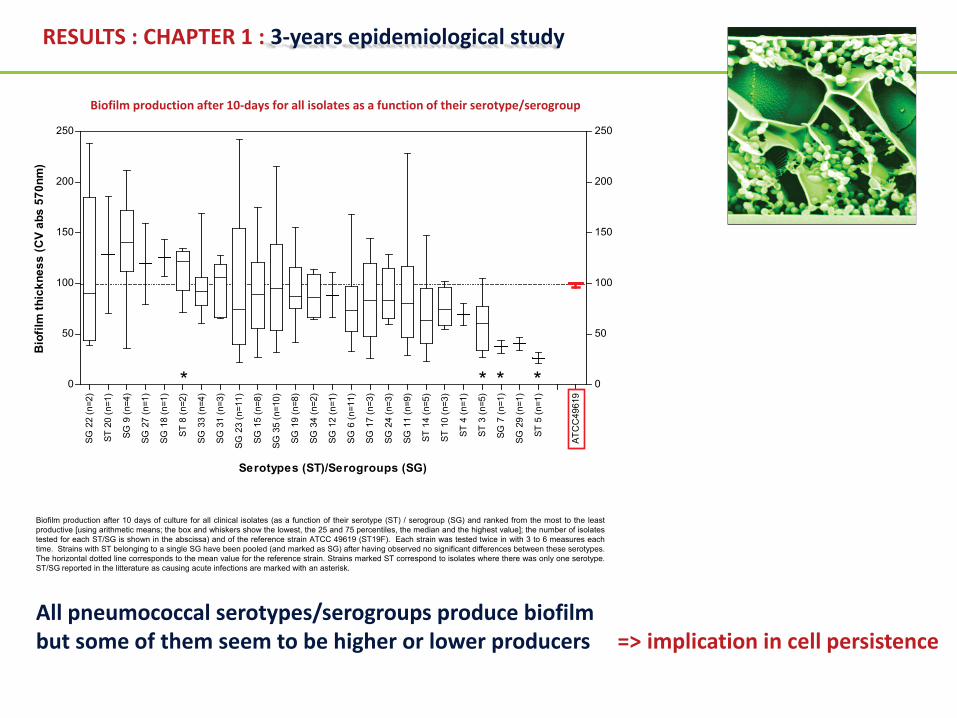
Biofilm production after 10 days of culture for all clinical isolates (as a function of their serotype (ST) / serogroup (SG) and ranked from the most to the leastproductive [using arithmetic means; the box and whiskers show the lowest, the 25 and 75 percentiles, the median and the highest value]; the number of isolatestested for each ST/SG is shown in the abscissa) and of the reference strain ATCC 49619 (ST19F). Each strain was tested twice in with 3 to 6 measures eachtime. Strains with ST belonging to a single SG have been pooled (and marked as SG) after having observed no significant differences between these serotypes.The horizontal dotted line corresponds to the mean value for the reference strain. Strains marked ST correspond to isolates where there was only one serotype.ST/SG reported in the litterature as causing acute infections are marked with an asterisk.
Biofilm production after 10-days for all isolates as a function of their serotype/serogroup
All pneumococcal serotypes/serogroups produce biofilmbut some of them seem to be higher or lower producers => implication in cell persistence
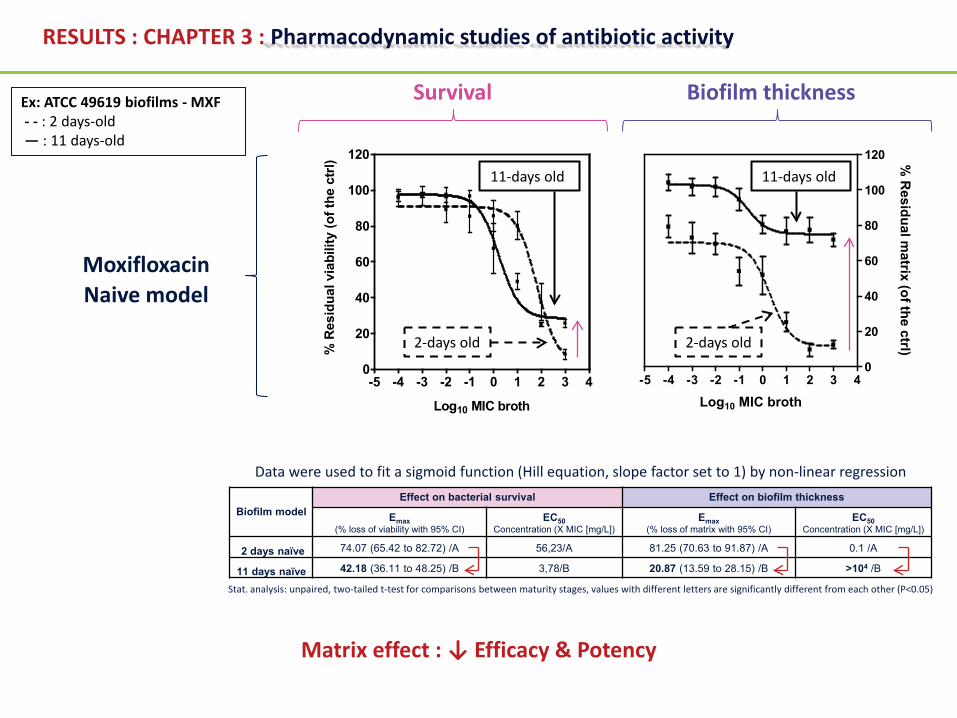
Data were used to fit a sigmoid function (Hill equation, slope factor set to 1) by non-linear regression
Biofilm modelEffect on bacterial survival Effect on biofilm thickness
Emax(% loss of viability with 95% CI)
EC50Concentration (X MIC [mg/L])
Emax(% loss of matrix with 95% CI)
EC50Concentration (X MIC [mg/L])
2 days naïve 74.07 (65.42 to 82.72) /A 56,23/A 81.25 (70.63 to 91.87) /A 0.1 /A
11 days naïve 42.18 (36.11 to 48.25) /B 3,78/B 20.87 (13.59 to 28.15) /B >104 /B
Stat. analysis: unpaired, two-tailed t-test for comparisons between maturity stages, values with different letters are significantly different from each other (P<0.05)
RESULTS : CHAPTER 3 : Pharmacodynamic studies of antibiotic activity
Naive model
Biofilm thickness
RESULTS : CHAPTER 3 : Pharmacodynamic studies of antibiotic activity
AMX CLR SOL LVX MXF
0
20
40
60
80
100
120
2d-naive2d-induced
a
aa a
a
a,b
b
b b
aa
a,b
cc
a
ac
ac
c
A B B B A B C B A B C C A B B C A A B B
a
AMX CLR SOL LVX MXF
11d-naive11d-induced
0
20
40
60
80
100
120
a a
a
a
b b
a
c c
a,b
c
a,b
b
dd
b
A A B C A A A B A A B C A B C C A A B B
a
a a a
Emax
(per
cent
age
redu
ctio
n in
via
bilit
y)Em
ax (percentage reduction in matrix)ATCC 49619
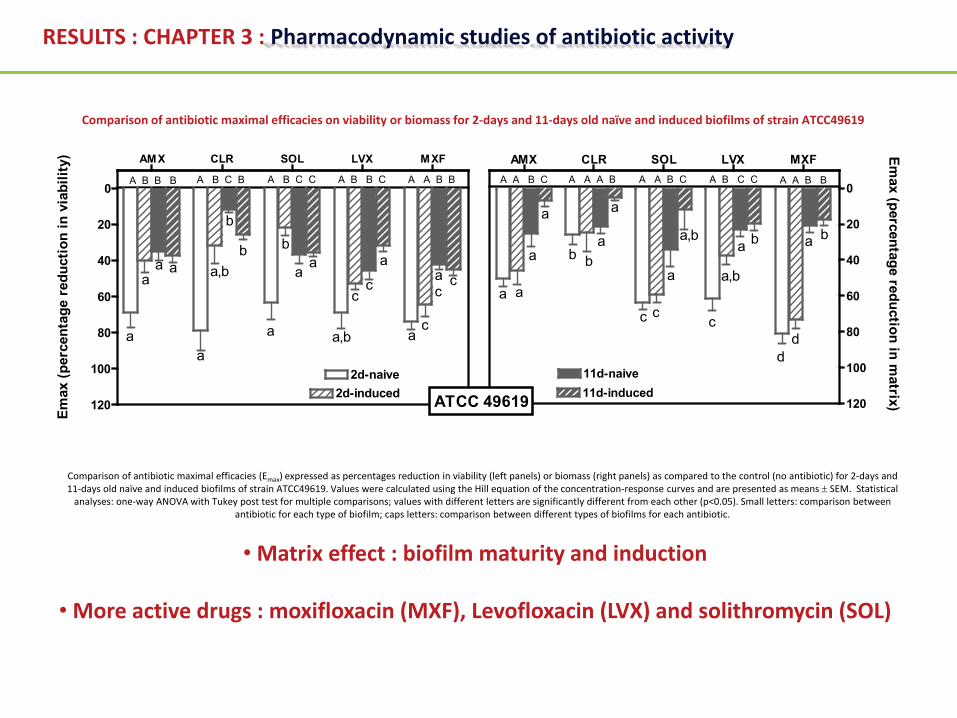
Comparison of antibiotic maximal efficacies (Emax) expressed as percentages reduction in viability (left panels) or biomass (right panels) as compared to the control (no antibiotic) for 2-days and 11-days old naïve and induced biofilms of strain ATCC49619. Values were calculated using the Hill equation of the concentration-response curves and are presented as means ± SEM. Statistical
analyses: one-way ANOVA with Tukey post test for multiple comparisons; values with different letters are significantly different from each other (p<0.05). Small letters: comparison between antibiotic for each type of biofilm; caps letters: comparison between different types of biofilms for each antibiotic.
Comparison of antibiotic maximal efficacies on viability or biomass for 2-days and 11-days old naïve and induced biofilms of strain ATCC49619
• Matrix effect : biofilm maturity and induction
• More active drugs : moxifloxacin (MXF), Levofloxacin (LVX) and solithromycin (SOL)
0 2 4 6 8 10 12 14 16 18 20 220.125
0.250.5
1248
163264
128256512
Bio
mas
s (c
ryst
al v
iole
t OD
570n
m)
RESULTS
2 7 10 14-120
-100
-80
-60
-40
-20
0
a
a
b b
a
a
b b
2 7 10 14-120
-100
-80
-60
-40
-20
0
b
a
b
b
a
b
c
d
Biofilm maturity (days) Biofilm maturity (days)E m
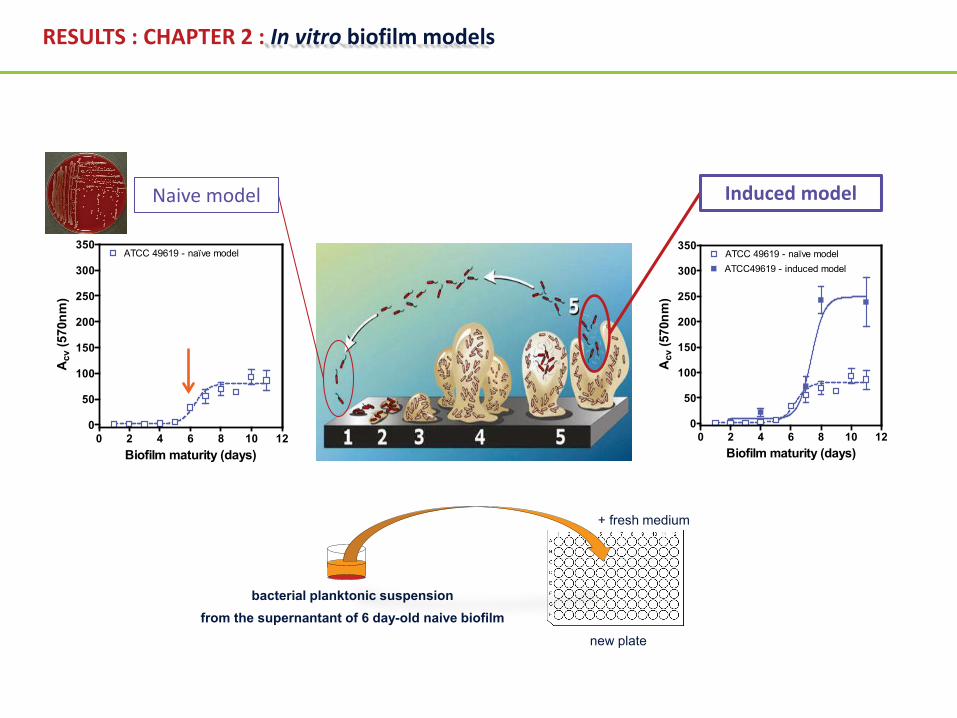
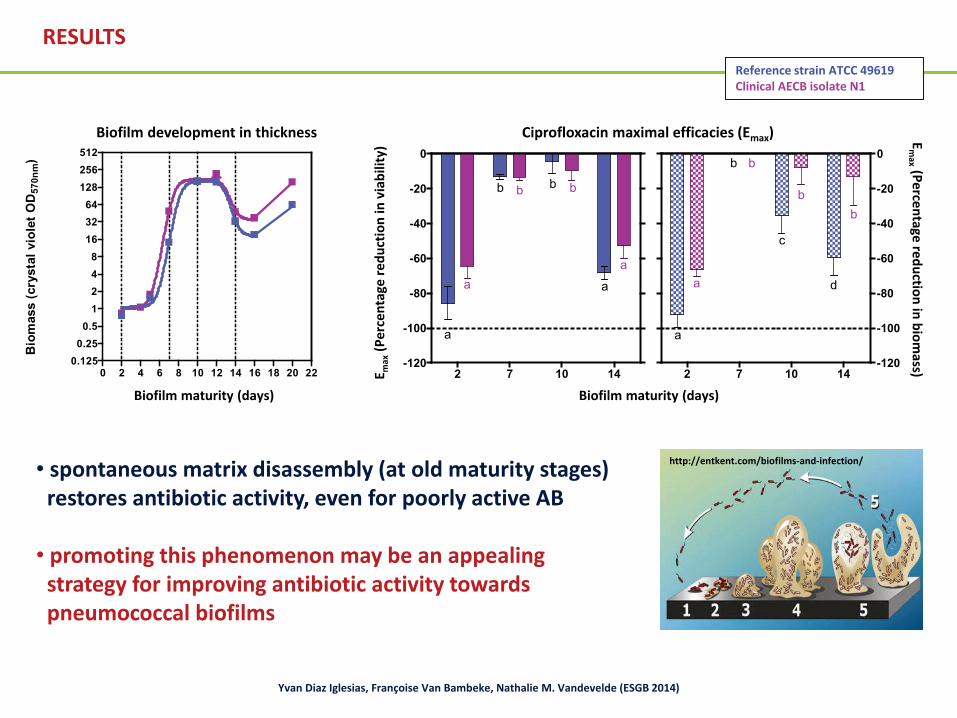
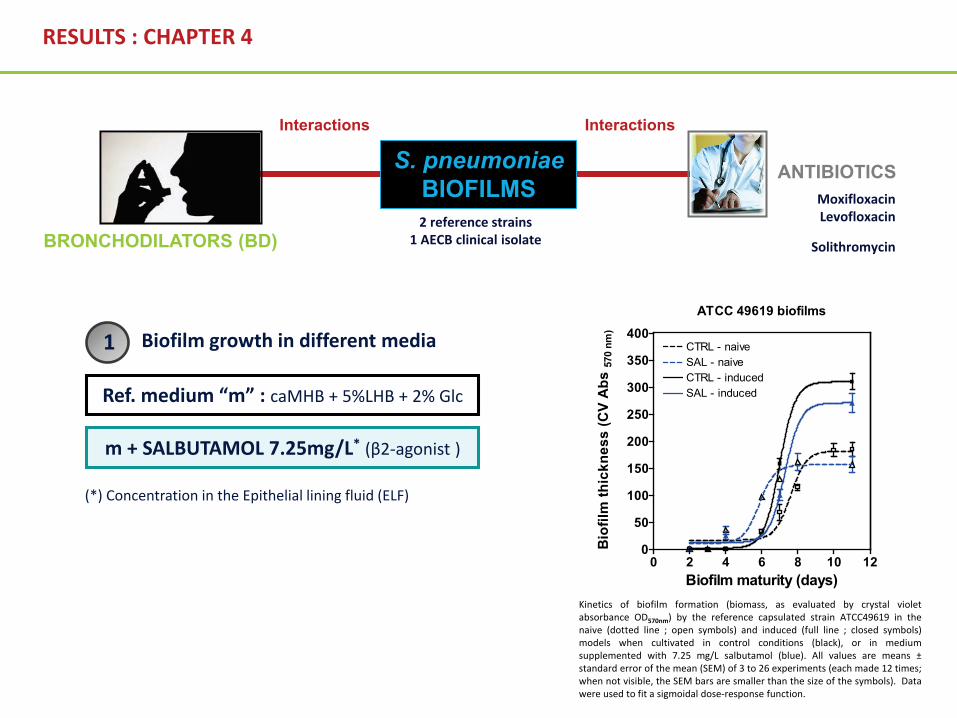
Kinetics of biofilm formation (biomass, as evaluated by crystal violetabsorbance OD570nm) by the reference capsulated strain ATCC49619 in thenaive (dotted line ; open symbols) and induced (full line ; closed symbols)models when cultivated in control conditions (black), or in mediumsupplemented with 7.25 mg/L salbutamol (blue). All values are means ±standard error of the mean (SEM) of 3 to 26 experiments (each made 12 times;when not visible, the SEM bars are smaller than the size of the symbols). Datawere used to fit a sigmoidal dose-response function.
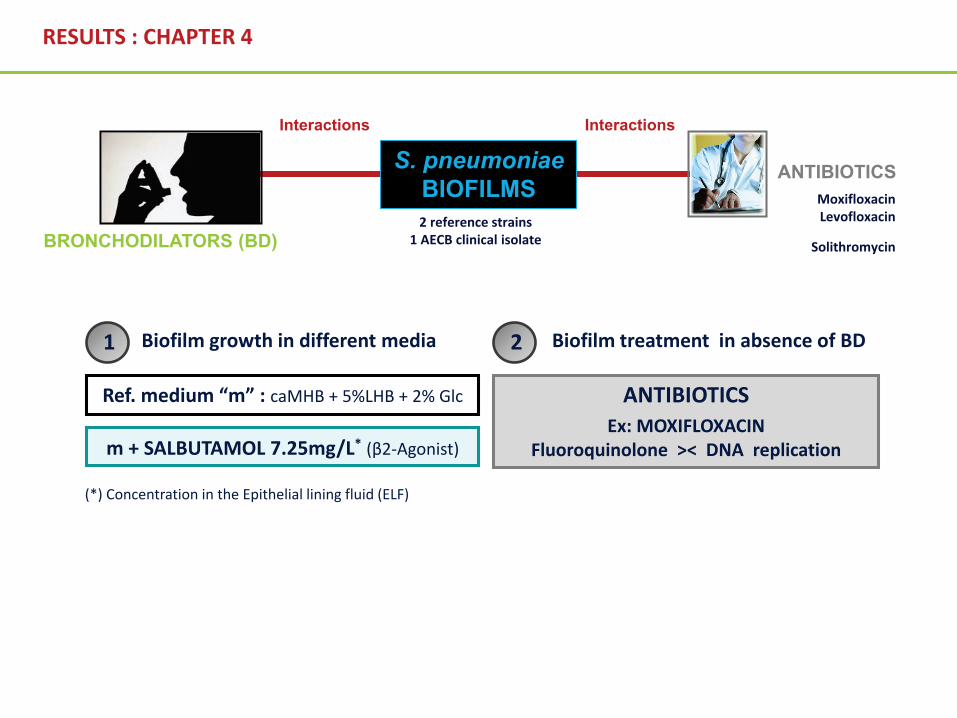
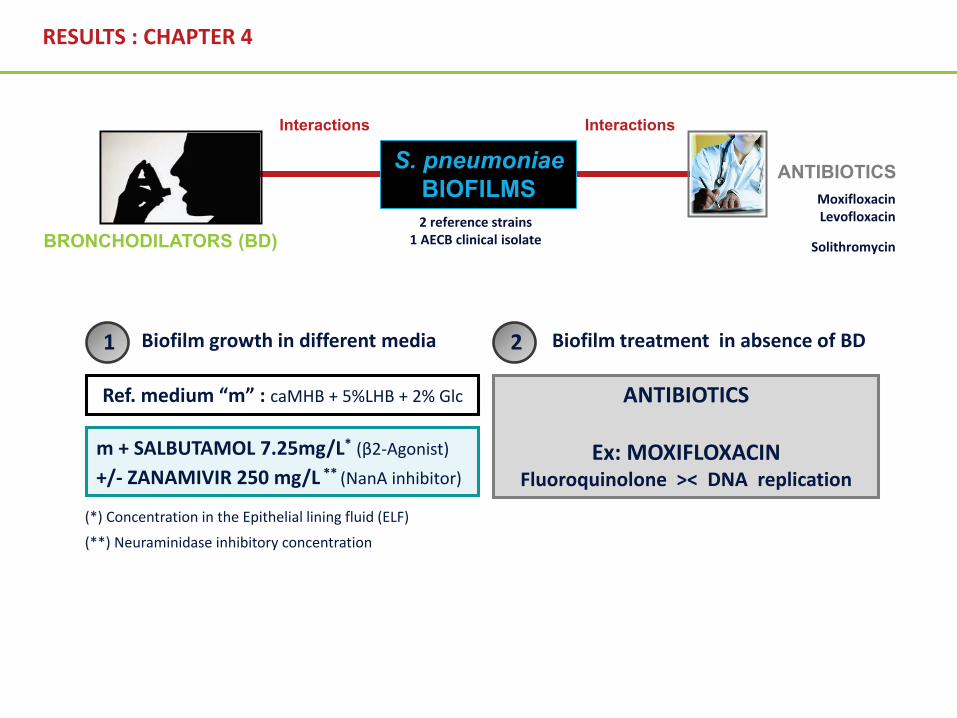
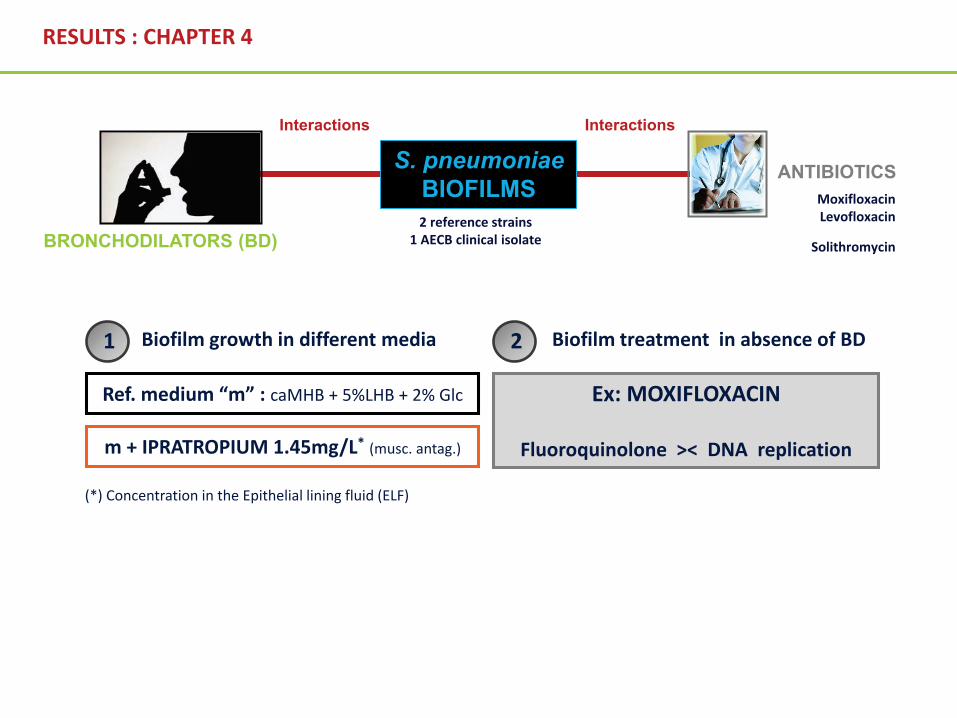
Fluoroquinolone >< DNA replicationm + SALBUTAMOL 7.25mg/L* (β2-Agonist)
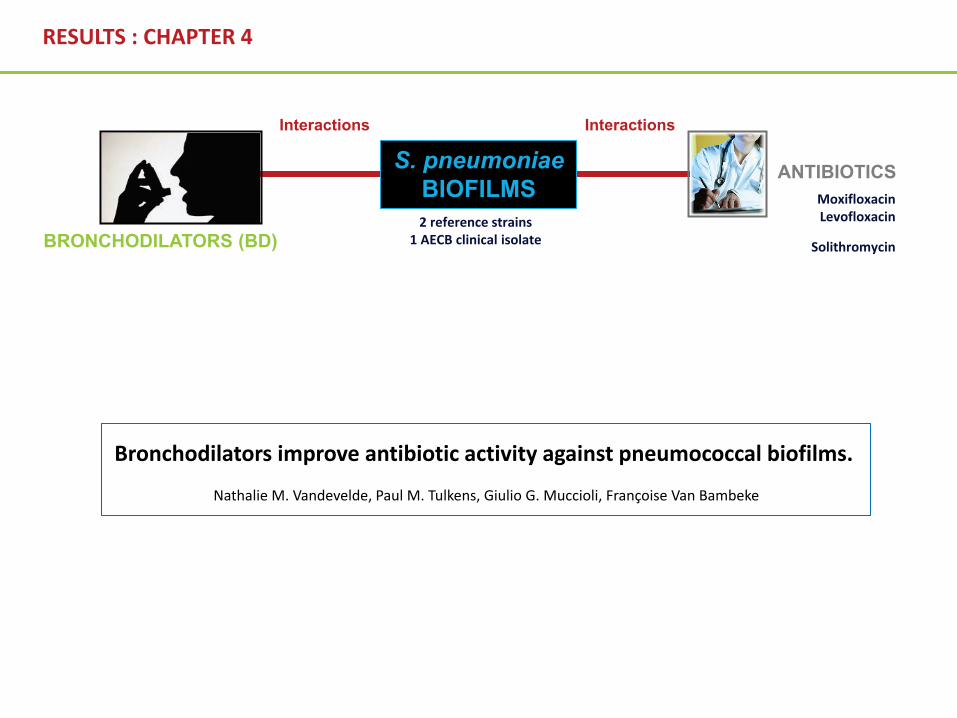
BRONCHODILATORS (BD)
Interactions
Ref. medium “m” : caMHB + 5%LHB + 2% Glc
1 2Biofilm growth in different media Biofilm treatment in absence of BD
RESULTS : CHAPTER 4
MoxifloxacinLevofloxacin
Solithromycin
2 reference strains1 AECB clinical isolate
(*) Concentration in the Epithelial lining fluid (ELF)
CTRL SAL SAL+ZAN IPR SAL+IPR
0
20
40
60
80
100
120
140
160
2d-naive2d-induced
A B C C A A A B A B C C A A A A A B A A,B
a,b
a
b a
a a
bb b
b
c
b
a a
bba,b a,b
aa
100
CTRL SAL SAL+ZAN IPR SAL+IPR
11d-naive11d-induced
0
20
40
60
80
100
120
140
160
A A B B A A B B A B C C A B B B A B
a a a a
b
a a,bb
cc
aa
b
c
a a
b
c
a
AA
a
Moxifloxacin
Strain ATCC 49619
E max
(Per
cent
age
redu
ctio
n in
via
bilit
y)E
max (Percentage reduction in biom
ass)
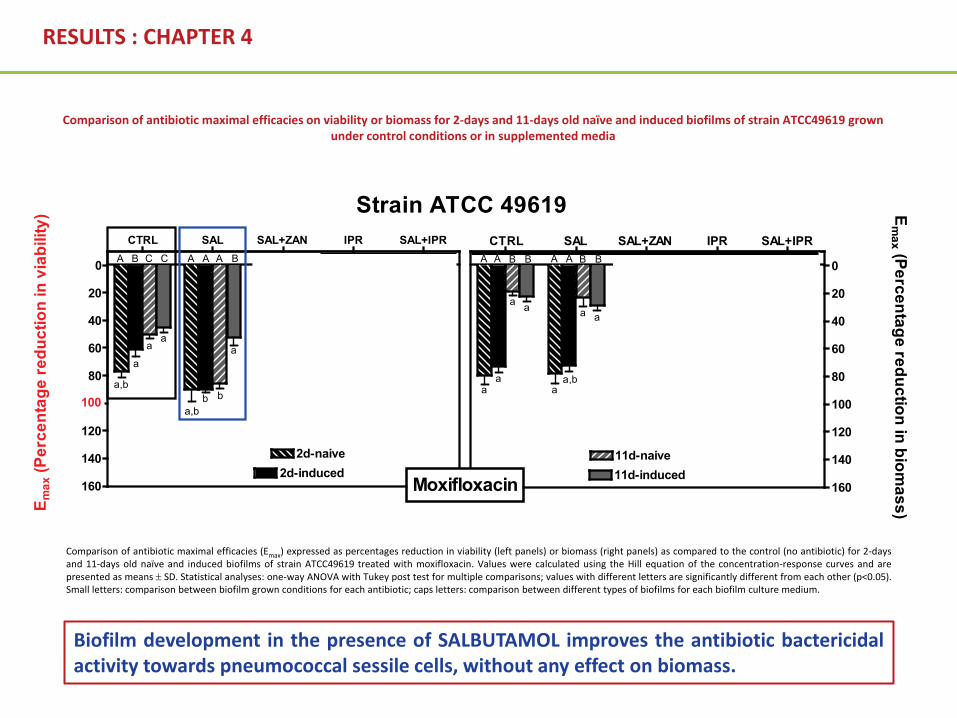
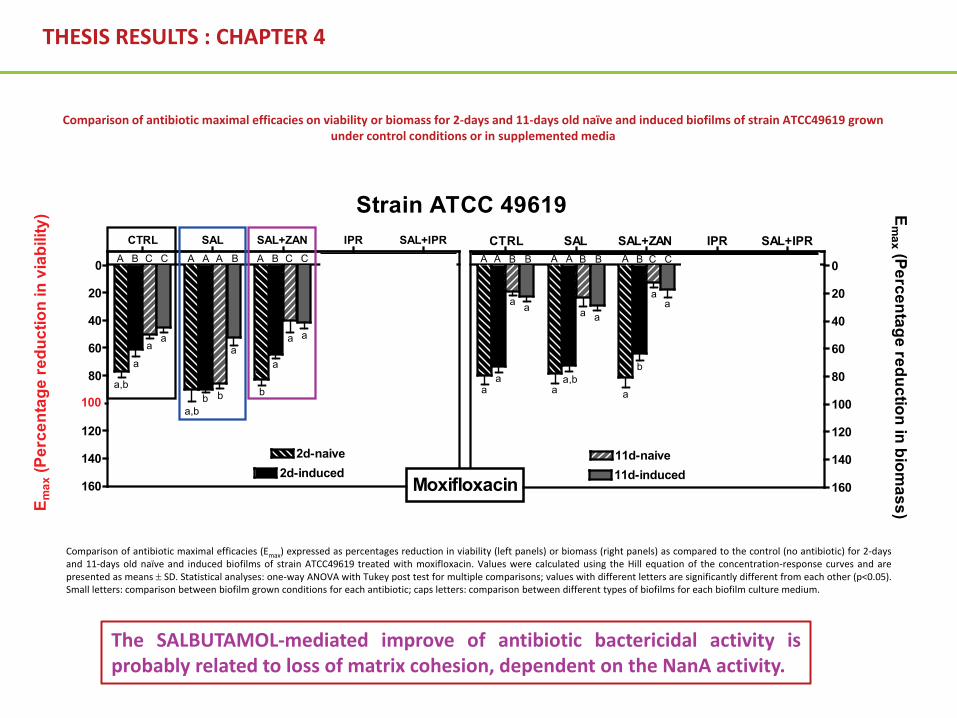
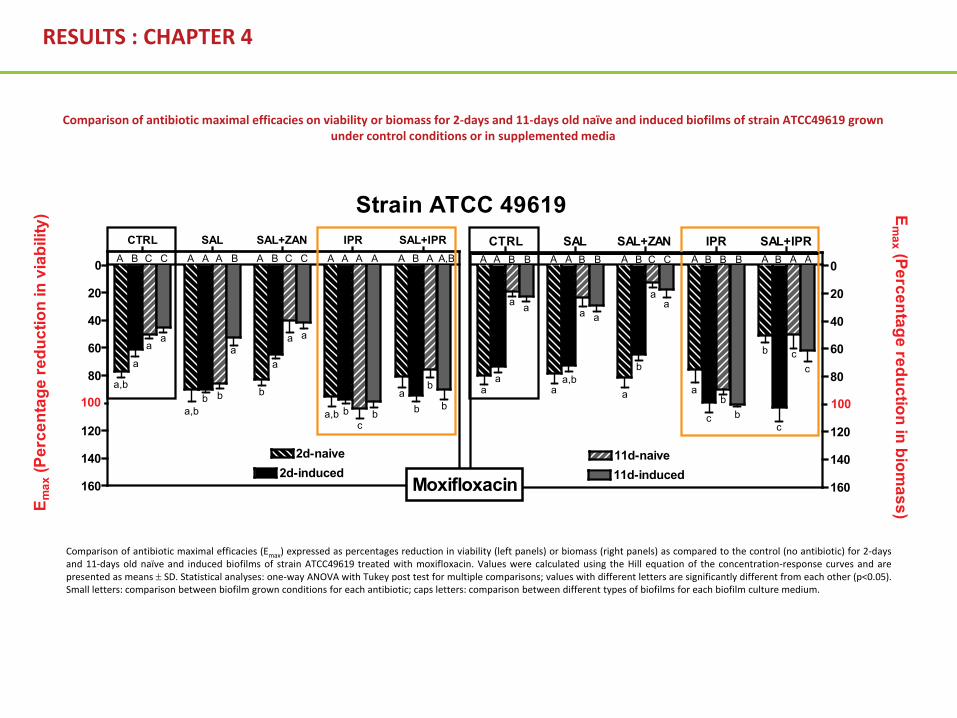
Comparison of antibiotic maximal efficacies (Emax) expressed as percentages reduction in viability (left panels) or biomass (right panels) as compared to the control (no antibiotic) for 2-daysand 11-days old naïve and induced biofilms of strain ATCC49619 treated with moxifloxacin. Values were calculated using the Hill equation of the concentration-response curves and arepresented as means ± SD. Statistical analyses: one-way ANOVA with Tukey post test for multiple comparisons; values with different letters are significantly different from each other (p<0.05).Small letters: comparison between biofilm grown conditions for each antibiotic; caps letters: comparison between different types of biofilms for each biofilm culture medium.
Comparison of antibiotic maximal efficacies on viability or biomass for 2-days and 11-days old naïve and induced biofilms of strain ATCC49619 grown under control conditions or in supplemented media
Biofilm development in the presence of SALBUTAMOL improves the antibiotic bactericidalactivity towards pneumococcal sessile cells, without any effect on biomass.
11-days old naive biofilms 11-days old induced biofilms
a
b
b
a
ATCC49619 11-days old biofilms
RESULTS : CHAPTER 4fr
ee si
alic
acid
in s
uper
nata
nt (m
g/L)
CTRLSAL
SAL+ZANCTRL
SAL
SAL+ZAN0
10
20
30
40
50ATCC49619 2-days old biofilms
2-days old naive biofilms 2-days old induced biofilms
b
a
b
a
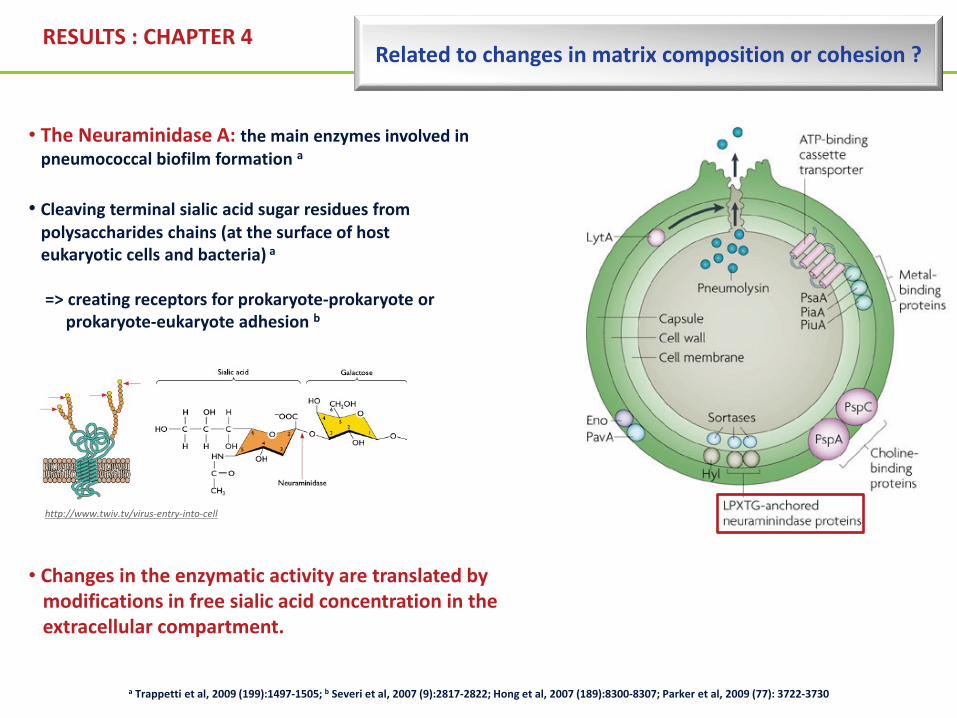
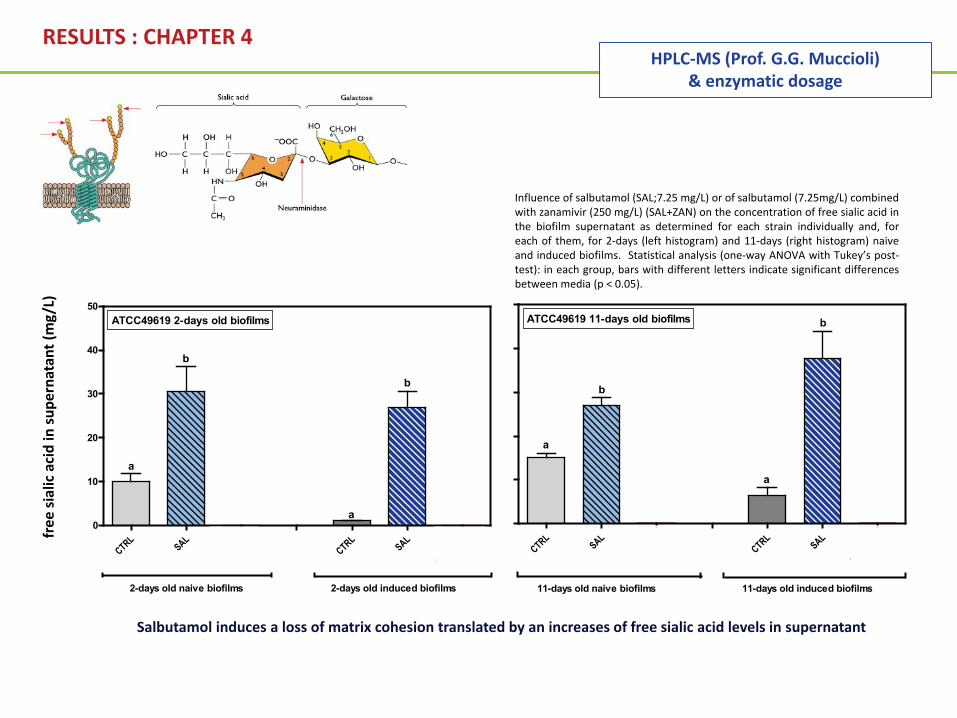
Salbutamol induces a loss of matrix cohesion translated by an increases of free sialic acid levels in supernatant
Reverted by zanamivir, an inhibitor of the neuraminidase A implicated in changes of matrix tridimensional structure
Influence of salbutamol (SAL;7.25 mg/L) or of salbutamol (7.25mg/L) combinedwith zanamivir (250 mg/L) (SAL+ZAN) on the concentration of free sialic acid inthe biofilm supernatant as determined for each strain individually and, foreach of them, for 2-days (left histogram) and 11-days (right histogram) naiveand induced biofilms. Statistical analysis (one-way ANOVA with Tukey’s post-test): in each group, bars with different letters indicate significant differencesbetween media (p < 0.05).
11-days old naive biofilms 11-days old induced biofilms
a
b
c
b
a
a
ATCC49619 11-days old biofilms
free
sial
icac
id in
sup
erna
tant
(mg/
L)
CTRLSAL
SAL+ZANCTRL
SAL
SAL+ZAN0
10
20
30
40
50ATCC49619 2-days old biofilms
2-days old naive biofilms 2-days old induced biofilms
b
a
a
b
aa
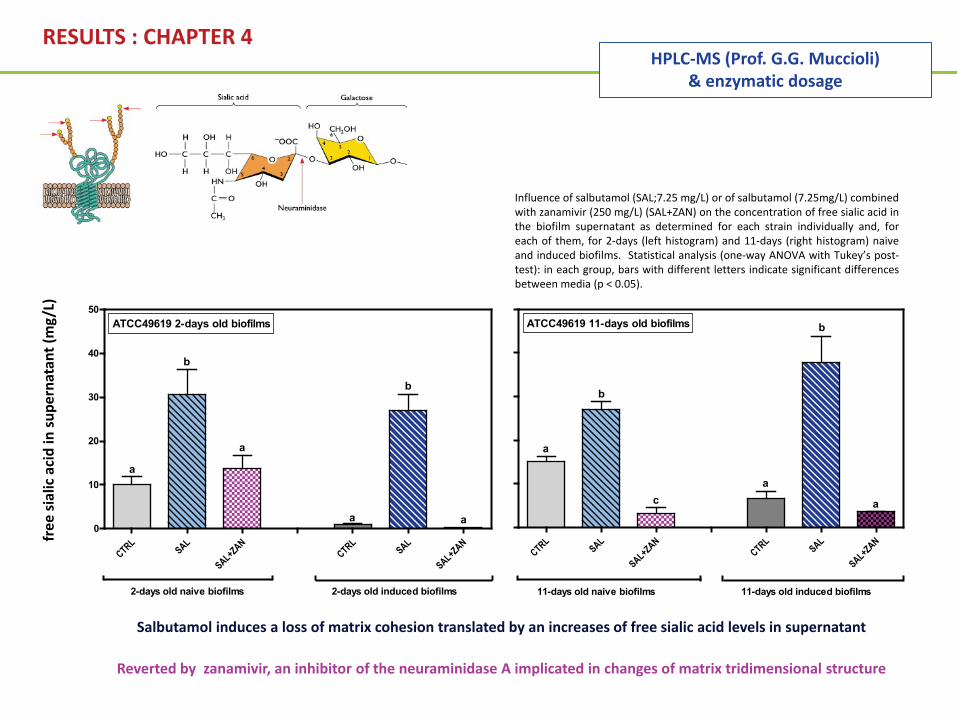
Salbutamol induces a loss of matrix cohesion translated by an increases of free sialic acid levels in supernatant
Reverted by zanamivir, an inhibitor of the neuraminidase A implicated in changes of matrix tridimensional structure
Influence of salbutamol (SAL;7.25 mg/L) or of salbutamol (7.25mg/L) combinedwith zanamivir (250 mg/L) (SAL+ZAN) on the concentration of free sialic acid inthe biofilm supernatant as determined for each strain individually and, foreach of them, for 2-days (left histogram) and 11-days (right histogram) naiveand induced biofilms. Statistical analysis (one-way ANOVA with Tukey’s post-test): in each group, bars with different letters indicate significant differencesbetween media (p < 0.05).
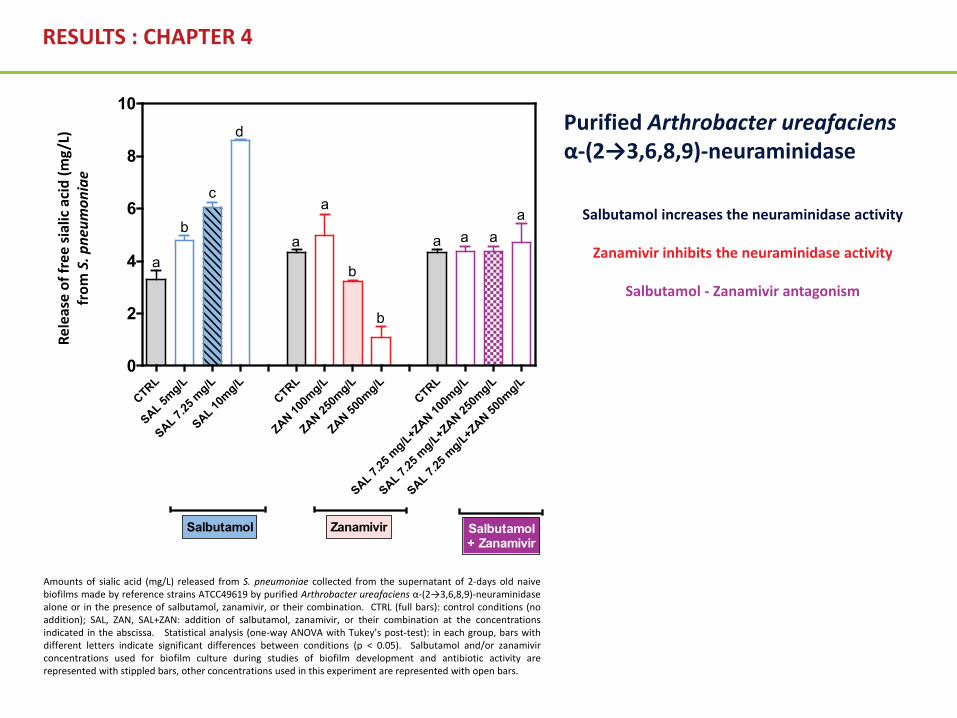
Amounts of sialic acid (mg/L) released from S. pneumoniae collected from the supernatant of 2-days old naivebiofilms made by reference strains ATCC49619 by purified Arthrobacter ureafaciens α-(2→3,6,8,9)-neuraminidasealone or in the presence of salbutamol, zanamivir, or their combination. CTRL (full bars): control conditions (noaddition); SAL, ZAN, SAL+ZAN: addition of salbutamol, zanamivir, or their combination at the concentrationsindicated in the abscissa. Statistical analysis (one-way ANOVA with Tukey’s post-test): in each group, bars withdifferent letters indicate significant differences between conditions (p < 0.05). Salbutamol and/or zanamivirconcentrations used for biofilm culture during studies of biofilm development and antibiotic activity arerepresented with stippled bars, other concentrations used in this experiment are represented with open bars.
1 2Biofilm growth in different media Biofilm treatment in absence of BD
RESULTS : CHAPTER 4
MoxifloxacinLevofloxacin
Solithromycin
2 reference strains1 AECB clinical isolate
(*) Concentration in the Epithelial lining fluid (ELF)
(**) Neuraminidase inhibitory concentration
THESIS RESULTS : CHAPTER 4
CTRL SAL SAL+ZAN IPR SAL+IPR
0
20
40
60
80
100
120
140
160
2d-naive2d-induced
A B C C A A A B A B C C A A A A A B A A,B
a,b
a
b a
a a
bb b
b
c
b
a a
bba,b a,b
aa
100
CTRL SAL SAL+ZAN IPR SAL+IPR
11d-naive11d-induced
0
20
40
60
80
100
120
140
160
A A B B A A B B A B C C A B B B A B
a a a a
b
a a,bb
cc
aa
b
c
a a
b
c
a
AA
a
Moxifloxacin
Strain ATCC 49619
E max
(Per
cent
age
redu
ctio
n in
via
bilit
y)E
max (Percentage reduction in biom
ass)
Comparison of antibiotic maximal efficacies (Emax) expressed as percentages reduction in viability (left panels) or biomass (right panels) as compared to the control (no antibiotic) for 2-daysand 11-days old naïve and induced biofilms of strain ATCC49619 treated with moxifloxacin. Values were calculated using the Hill equation of the concentration-response curves and arepresented as means ± SD. Statistical analyses: one-way ANOVA with Tukey post test for multiple comparisons; values with different letters are significantly different from each other (p<0.05).Small letters: comparison between biofilm grown conditions for each antibiotic; caps letters: comparison between different types of biofilms for each biofilm culture medium.
Comparison of antibiotic maximal efficacies on viability or biomass for 2-days and 11-days old naïve and induced biofilms of strain ATCC49619 grown under control conditions or in supplemented media
The SALBUTAMOL-mediated improve of antibiotic bactericidal activity isprobably related to loss of matrix cohesion, dependent on the NanA activity.
(*) Concentration in the Epithelial lining fluid (ELF)
0 2 4 6 8 10 120
50
100
150
200
250
300
350
400
IPR - induced
CTRL - naiveIPR - naiveCTRL - induced
Biofilm maturity (days)
Bio
film
thic
knes
s (C
V A
bs57
0 nm
)
ATCC 49619 biofilms
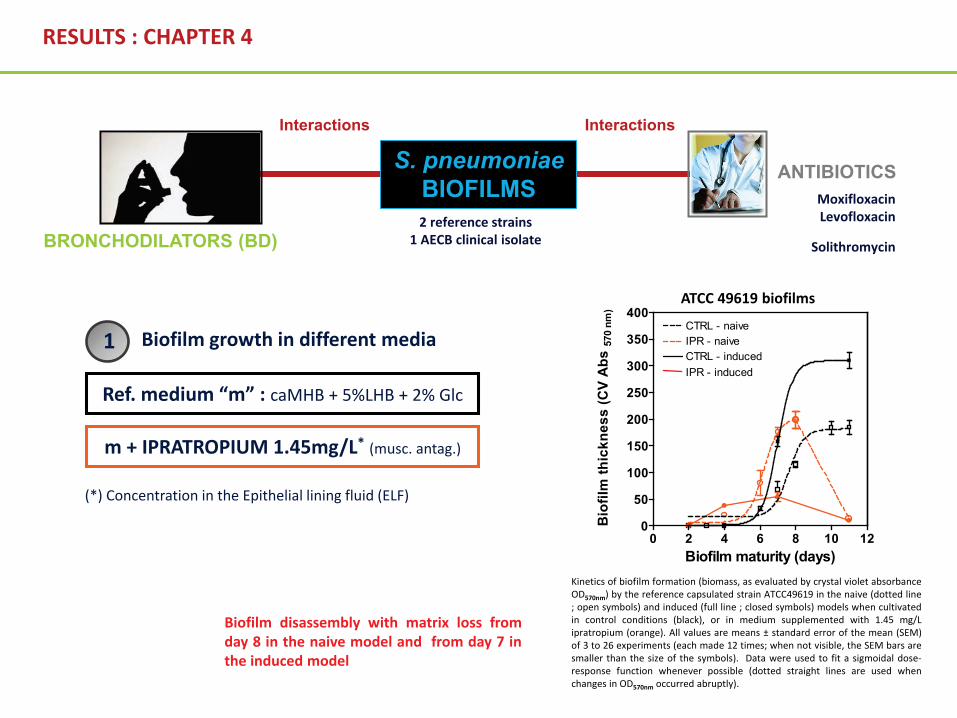
Biofilm disassembly with matrix loss fromday 8 in the naive model and from day 7 inthe induced model
Kinetics of biofilm formation (biomass, as evaluated by crystal violet absorbanceOD570nm) by the reference capsulated strain ATCC49619 in the naive (dotted line; open symbols) and induced (full line ; closed symbols) models when cultivatedin control conditions (black), or in medium supplemented with 1.45 mg/Lipratropium (orange). All values are means ± standard error of the mean (SEM)of 3 to 26 experiments (each made 12 times; when not visible, the SEM bars aresmaller than the size of the symbols). Data were used to fit a sigmoidal dose-response function whenever possible (dotted straight lines are used whenchanges in OD570nm occurred abruptly).
RESULTS : CHAPTER 4
CTRLSAL
SAL+ZAN IPRCTRL
SAL
SAL+ZAN IPR
11-days old naive biofilms 11-days old induced biofilms
a bc
ba a
ATCC49619 11-days old biofilms
d
d
free
sial
icac
id in
sup
erna
tant
(mg/
L)
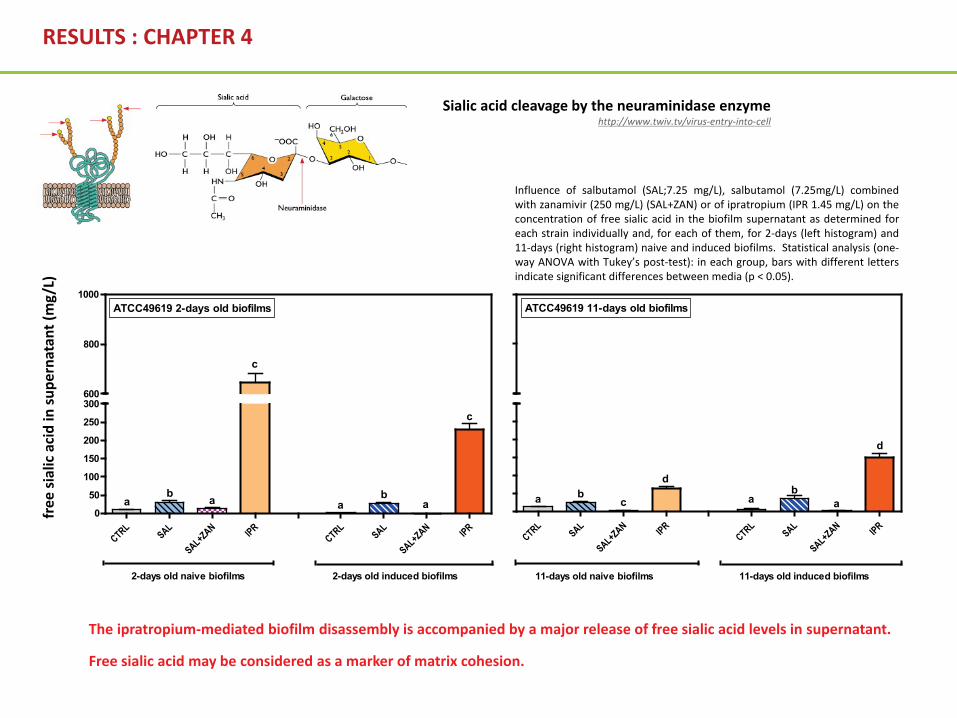
The ipratropium-mediated biofilm disassembly is accompanied by a major release of free sialic acid levels in supernatant.
Free sialic acid may be considered as a marker of matrix cohesion.
CTRLSAL
SAL+ZAN IPRCTRL
SAL
SAL+ZAN IPR0
50
100
150
200
250
300
ATCC49619 2-days old biofilms
2-days old naive biofilms 2-days old induced biofilms
b aa baa
600
800
1000
c
c
Sialic acid cleavage by the neuraminidase enzymehttp://www.twiv.tv/virus-entry-into-cell
Influence of salbutamol (SAL;7.25 mg/L), salbutamol (7.25mg/L) combinedwith zanamivir (250 mg/L) (SAL+ZAN) or of ipratropium (IPR 1.45 mg/L) on theconcentration of free sialic acid in the biofilm supernatant as determined foreach strain individually and, for each of them, for 2-days (left histogram) and11-days (right histogram) naive and induced biofilms. Statistical analysis (one-way ANOVA with Tukey’s post-test): in each group, bars with different lettersindicate significant differences between media (p < 0.05).
Fluoroquinolone >< DNA replicationm + IPRATROPIUM 1.45mg/L* (musc. antag.)
Ref. medium “m” : caMHB + 5%LHB + 2% Glc
1 2Biofilm growth in different media Biofilm treatment in absence of BD
(*) Concentration in the Epithelial lining fluid (ELF)
CTRL SAL SAL+ZAN IPR SAL+IPR
0
20
40
60
80
100
120
140
160
2d-naive2d-induced
A B C C A A A B A B C C A A A A A B A A,B
a,b
a
b a
a a
bb b
b
c
b
a a
bba,b a,b
aa
100
CTRL SAL SAL+ZAN IPR SAL+IPR
11d-naive11d-induced
0
20
40
60
80
100
120
140
160
A A B B A A B B A B C C A B B B A B
a a a a
b
a a,bb
cc
aa
b
c
a a
b
c
a
AA
a
100
Moxifloxacin
Strain ATCC 49619
E max
(Per
cent
age
redu
ctio
n in
via
bilit
y)E
max (Percentage reduction in biom
ass)
Comparison of antibiotic maximal efficacies (Emax) expressed as percentages reduction in viability (left panels) or biomass (right panels) as compared to the control (no antibiotic) for 2-daysand 11-days old naïve and induced biofilms of strain ATCC49619 treated with moxifloxacin. Values were calculated using the Hill equation of the concentration-response curves and arepresented as means ± SD. Statistical analyses: one-way ANOVA with Tukey post test for multiple comparisons; values with different letters are significantly different from each other (p<0.05).Small letters: comparison between biofilm grown conditions for each antibiotic; caps letters: comparison between different types of biofilms for each biofilm culture medium.
Comparison of antibiotic maximal efficacies on viability or biomass for 2-days and 11-days old naïve and induced biofilms of strain ATCC49619 grown under control conditions or in supplemented media
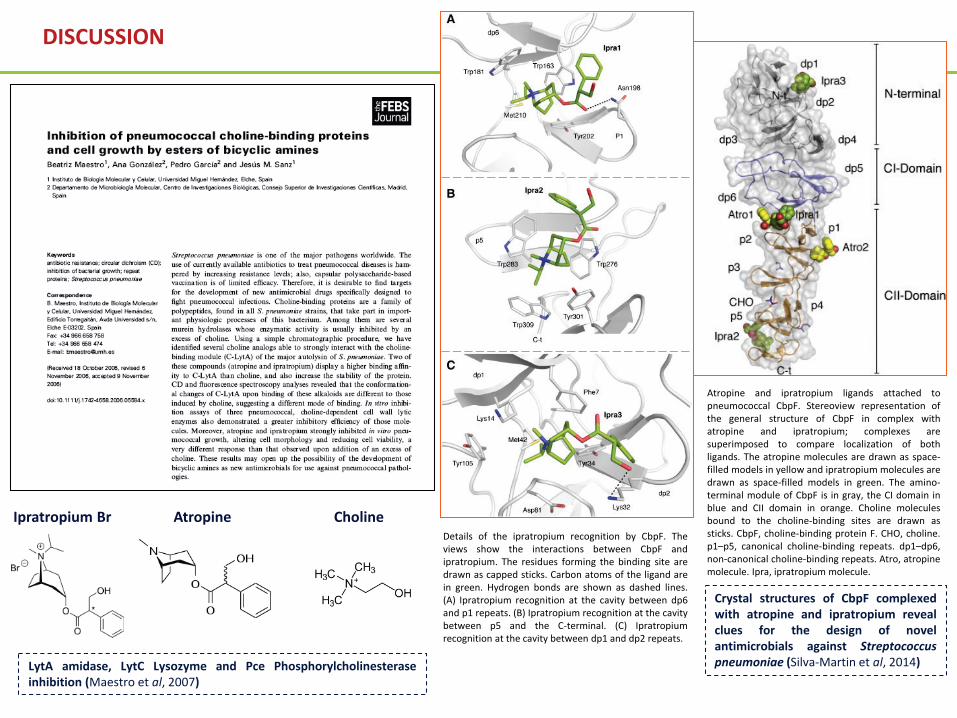
Atropine and ipratropium ligands attached topneumococcal CbpF. Stereoview representation ofthe general structure of CbpF in complex withatropine and ipratropium; complexes aresuperimposed to compare localization of bothligands. The atropine molecules are drawn as space-filled models in yellow and ipratropium molecules aredrawn as space-filled models in green. The amino-terminal module of CbpF is in gray, the CI domain inblue and CII domain in orange. Choline moleculesbound to the choline-binding sites are drawn assticks. CbpF, choline-binding protein F. CHO, choline.p1–p5, canonical choline-binding repeats. dp1–dp6,non-canonical choline-binding repeats. Atro, atropinemolecule. Ipra, ipratropium molecule.
Details of the ipratropium recognition by CbpF. Theviews show the interactions between CbpF andipratropium. The residues forming the binding site aredrawn as capped sticks. Carbon atoms of the ligand arein green. Hydrogen bonds are shown as dashed lines.(A) Ipratropium recognition at the cavity between dp6and p1 repeats. (B) Ipratropium recognition at the cavitybetween p5 and the C-terminal. (C) Ipratropiumrecognition at the cavity between dp1 and dp2 repeats.
Crystal structures of CbpF complexedwith atropine and ipratropium revealclues for the design of novelantimicrobials against Streptococcuspneumoniae (Silva-Martin et al, 2014)LytA amidase, LytC Lysozyme and Pce Phosphorylcholinesterase
• Ma promotrice de thèse, le Professeur Françoise Van Bambeke
• The members of the jury and thesis committee
• Le Professeur Paul Tulkens
• Le Professeur Marie-Paule Mingeot
• Les cliniciens et microbiologistes ayant participé à mon étude clinique
• L’ensemble des membres du laboratoire FACM
• Les membres du groupe de recherche CLIP
• Les autres doctorants et post-doctorants du LDRI
• Les chercheurs avec qui j’ai travaillé:
Dr. Julia BauerProfesseur Giulio G. Muccioli
• Ma famille Merci à tous du fond du cœur !!
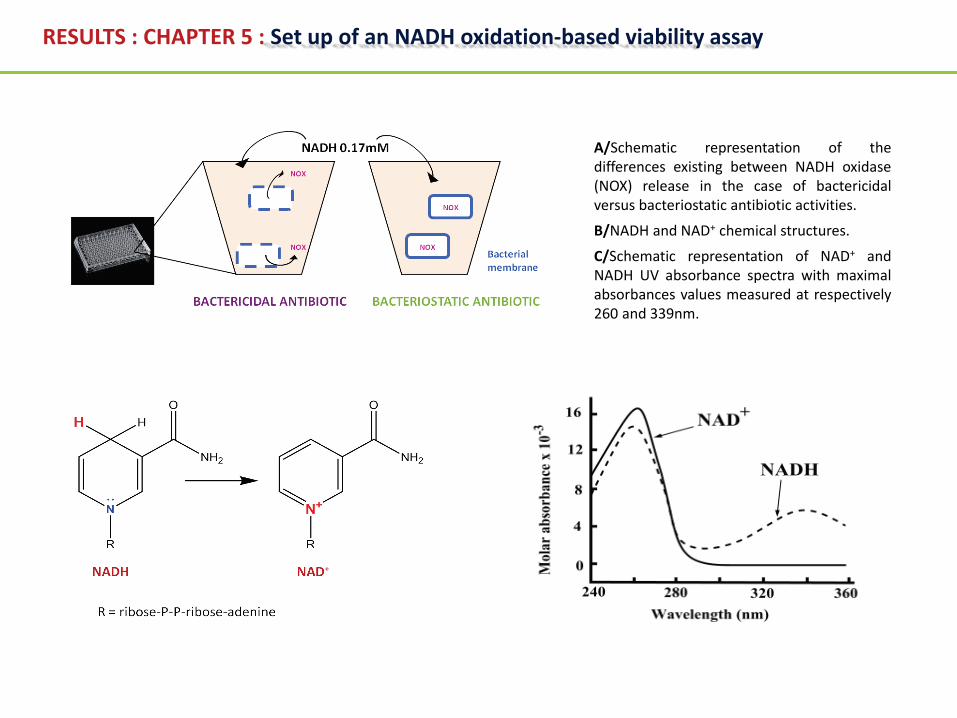
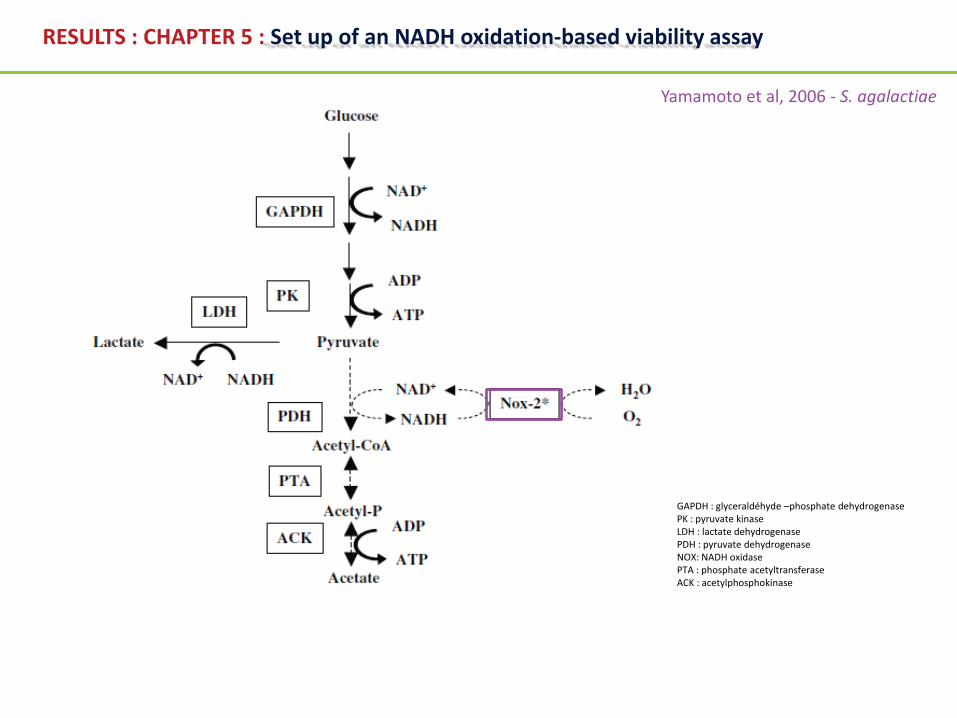
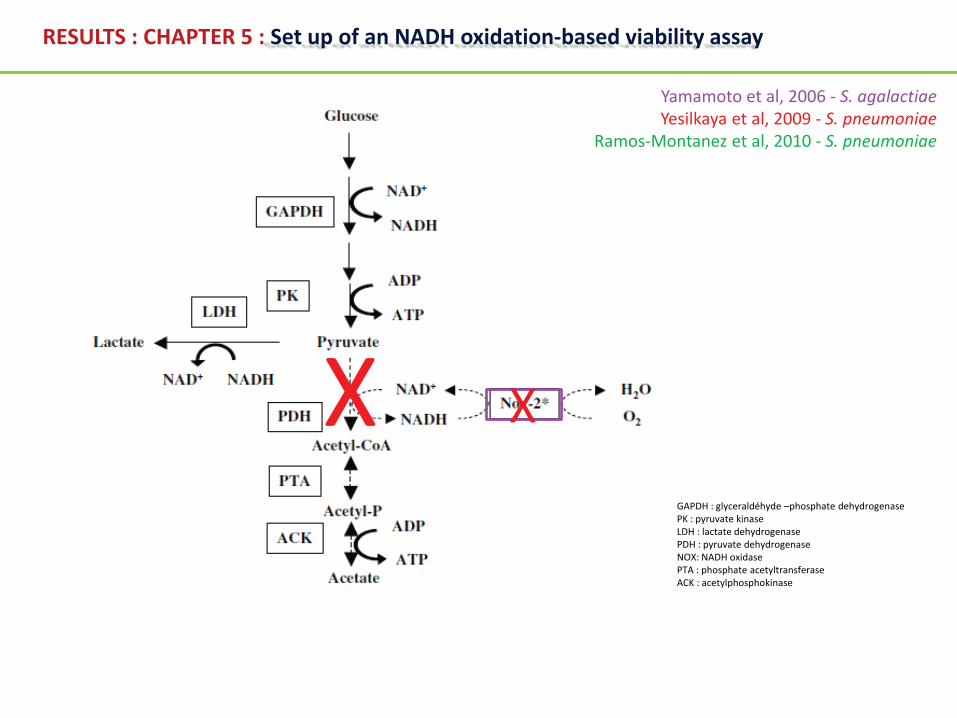
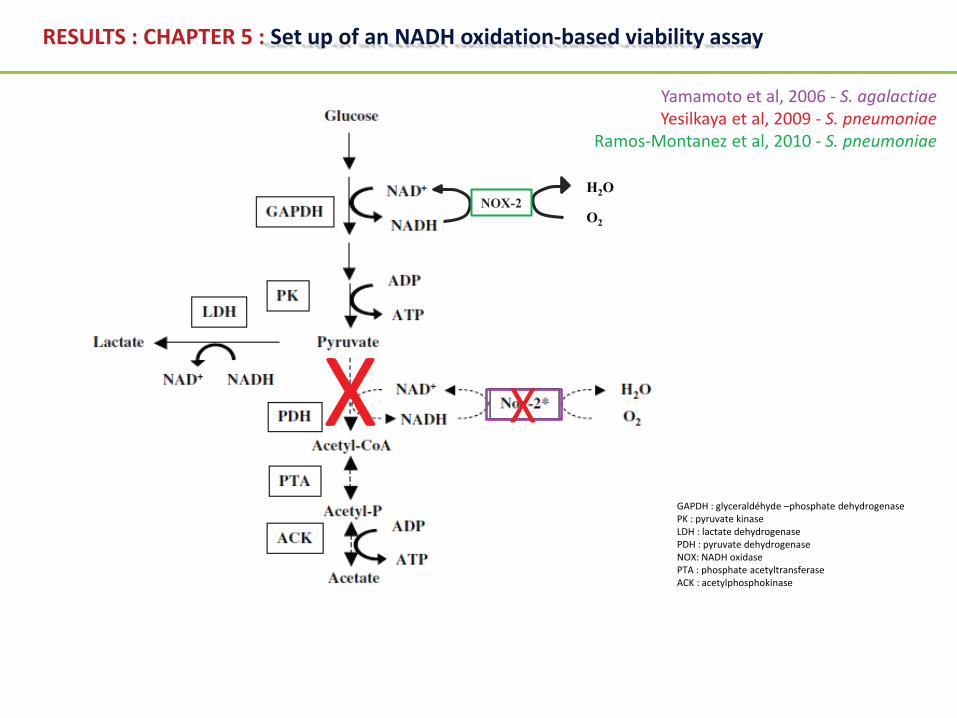
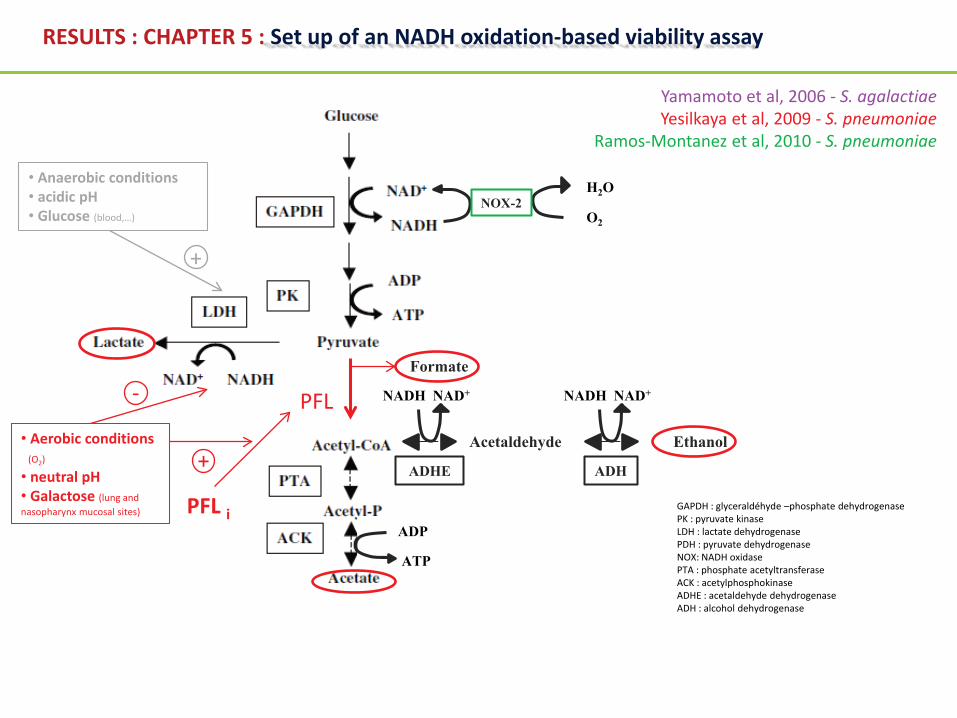
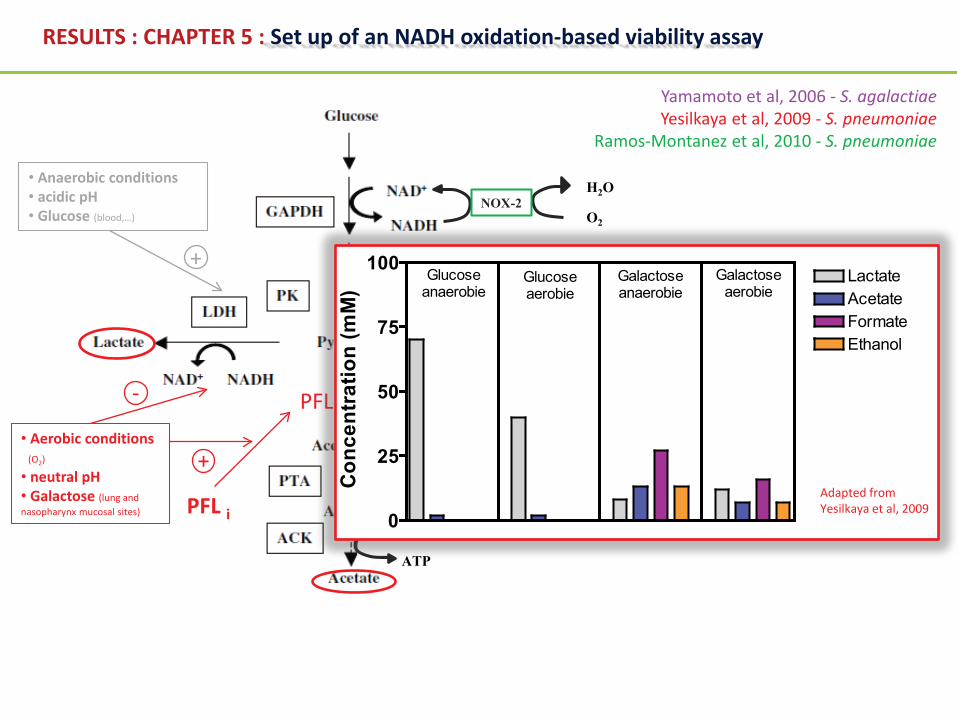
RESULTS : CHAPTER 5 : Set up of an NADH oxidation-based viability assay
A/Schematic representation of thedifferences existing between NADH oxidase(NOX) release in the case of bactericidalversus bacteriostatic antibiotic activities.
B/NADH and NAD+ chemical structures.
C/Schematic representation of NAD+ andNADH UV absorbance spectra with maximalabsorbances values measured at respectively260 and 339nm.
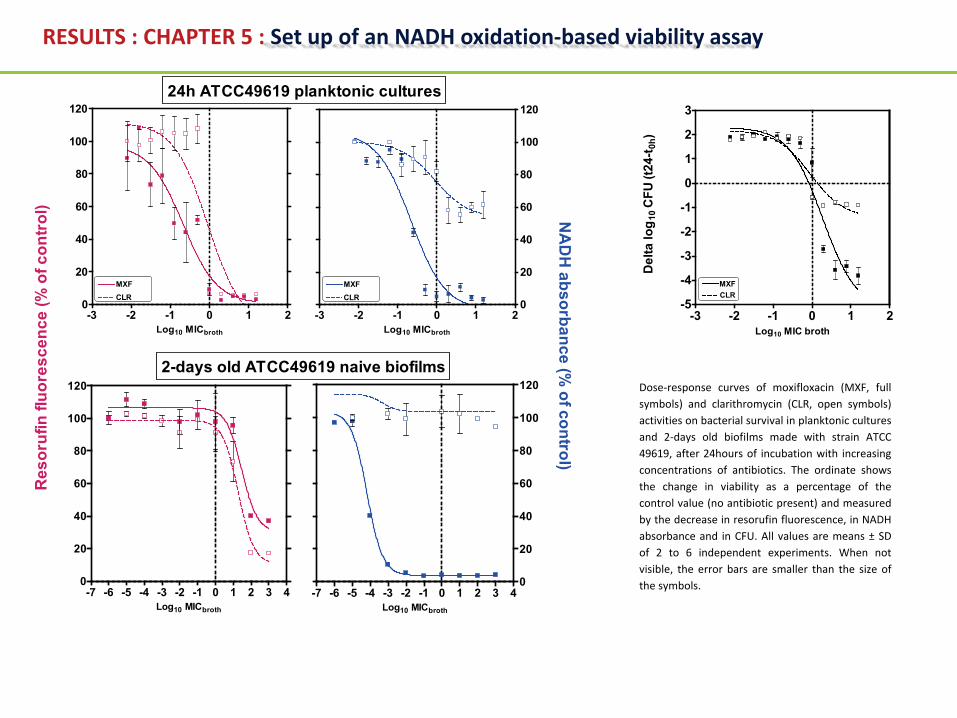
Dose-response curves of moxifloxacin (MXF, fullsymbols) and clarithromycin (CLR, open symbols)activities on bacterial survival in planktonic culturesand 2-days old biofilms made with strain ATCC49619, after 24hours of incubation with increasingconcentrations of antibiotics. The ordinate showsthe change in viability as a percentage of thecontrol value (no antibiotic present) and measuredby the decrease in resorufin fluorescence, in NADHabsorbance and in CFU. All values are means ± SDof 2 to 6 independent experiments. When notvisible, the error bars are smaller than the size ofthe symbols.
RESULTS : CHAPTER 5 : Set up of an NADH oxidation-based viability assay
RESULTS : CHAPTER 5 : Set up of an NADH oxidation-based viability assay
H2O
O2
Yamamoto et al, 2006 - S. agalactiaeYesilkaya et al, 2009 - S. pneumoniae
Ramos-Montanez et al, 2010 - S. pneumoniae
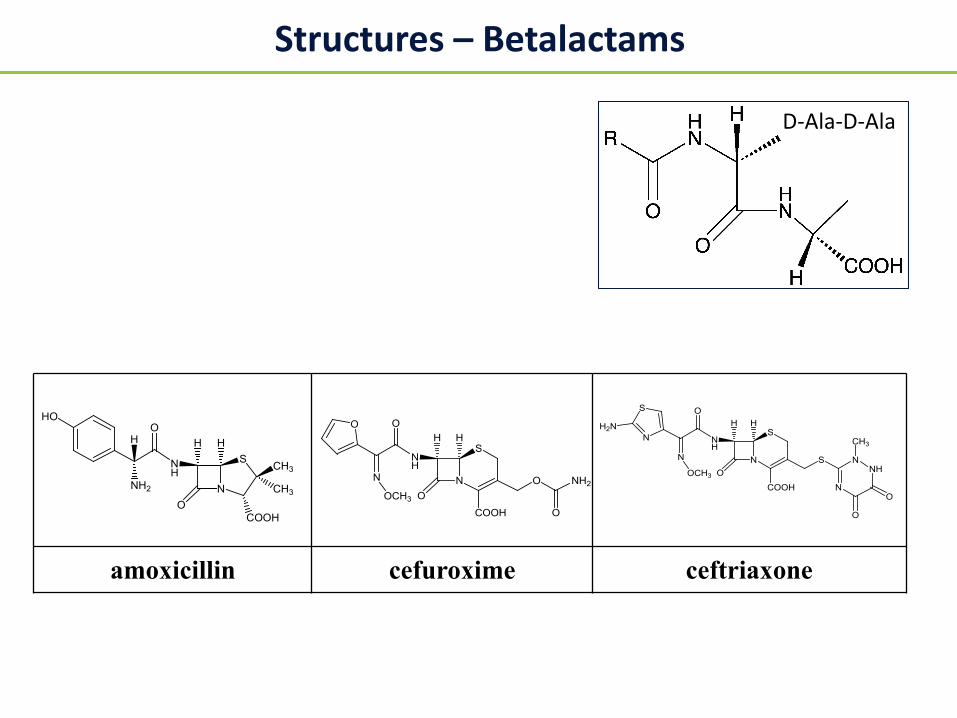
Structures – Betalactams
D-Ala-D-Ala
amoxicillin cefuroxime ceftriaxone
N
SHH
O
NH
O
CH3
CH3
COOH
NH2
HO
H
N
HHO
NH
O
S
COOH
O NH2
O
O
N
OCH3
N
HHO
NH
O
S
COOH
S
N
NHN
O
O
CH3
N
OCH3
S
NH2N
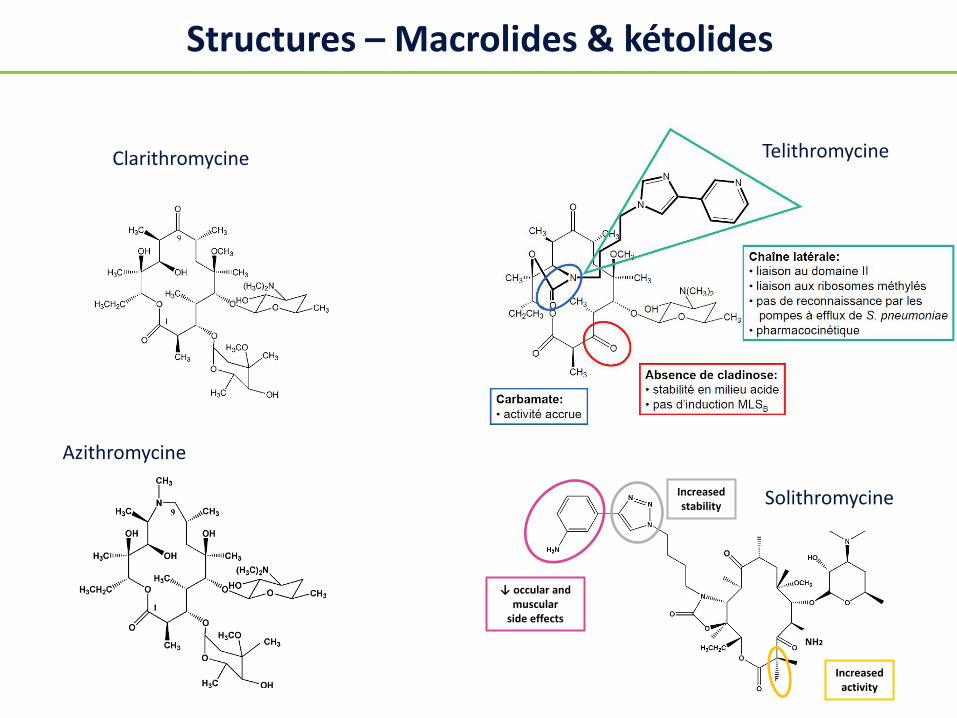
Structures – Macrolides & kétolides
Clarithromycine
Solithromycine
Telithromycine
NH2
↓ occular and muscular
side effects
Increasedactivity
Increasedstability
Azithromycine
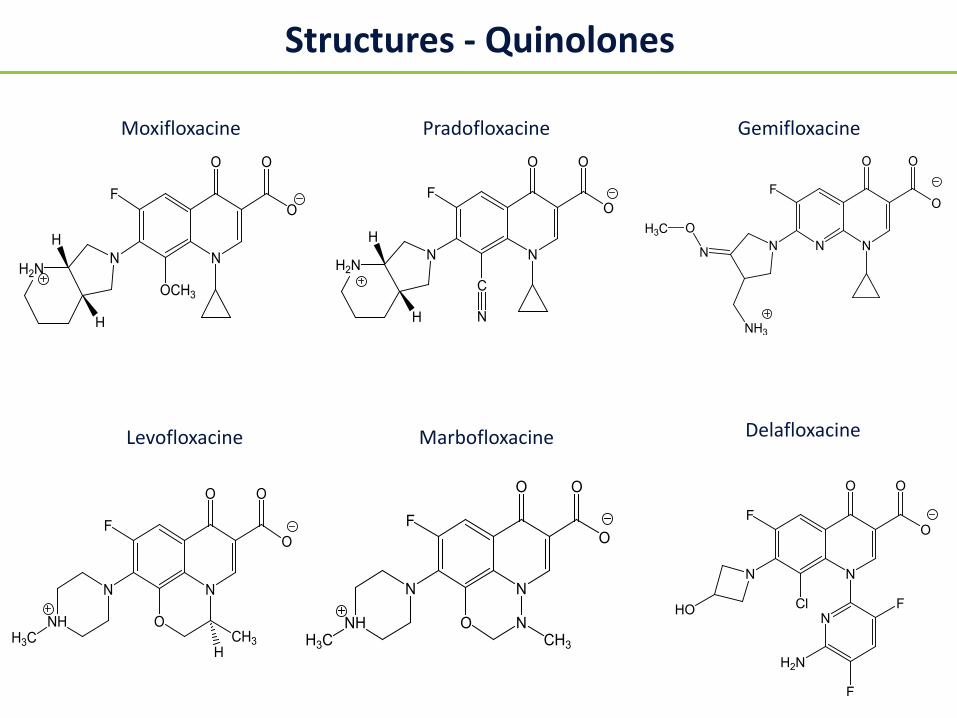
Structures - Quinolones
Moxifloxacine
N
O
O
O
N
F
NHH3C
O
HCH3
Levofloxacine Delafloxacine
N
O
O
O
C
N
NH2N
H
H
F
Pradofloxacine
N N
O
O
O
N
F
N
NH3
OH3C
Gemifloxacine
N
O
O
O
N
F
O NNHH3C CH3
Marbofloxacine
N
O
O
O
NH2N
H
H
OCH3
F
N
O
O
O
N
F
ClHO NF
F
H2N
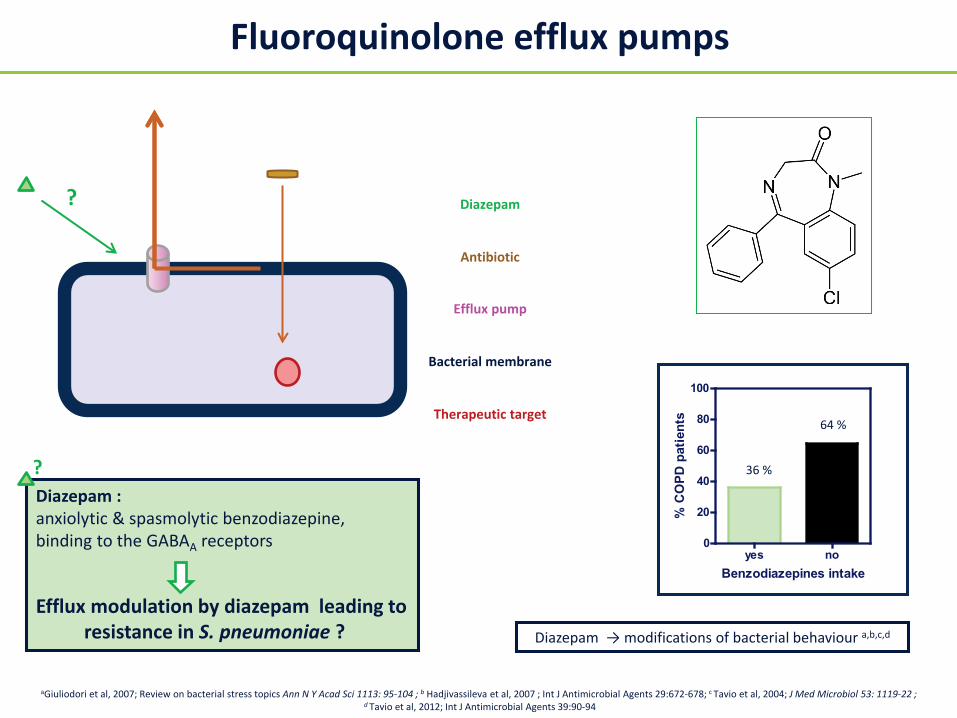
Diazepam : anxiolytic & spasmolytic benzodiazepine, binding to the GABAA receptors
Efflux modulation by diazepam leading toresistance in S. pneumoniae ?
Diazepam
Antibiotic
Efflux pump
Bacterial membrane
Therapeutic target
?
?
yes no0
20
40
60
80
100
Benzodiazepines intake
% C
OPD
pat
ient
s
36 %
64 %
Fluoroquinolone efflux pumps
Diazepam → modifications of bacterial behaviour a,b,c,d
aGiuliodori et al, 2007; Review on bacterial stress topics Ann N Y Acad Sci 1113: 95-104 ; b Hadjivassileva et al, 2007 ; Int J Antimicrobial Agents 29:672-678; c Tavio et al, 2004; J Med Microbiol 53: 1119-22 ;d Tavio et al, 2012; Int J Antimicrobial Agents 39:90-94
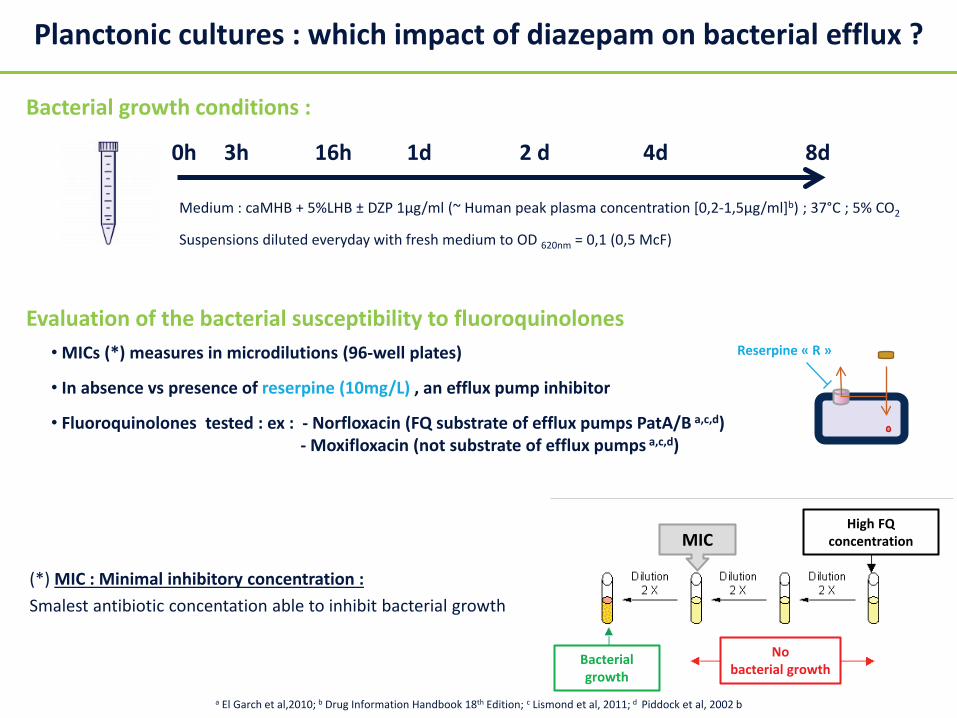
Medium : caMHB + 5%LHB ± DZP 1µg/ml (~ Human peak plasma concentration [0,2-1,5µg/ml]b) ; 37°C ; 5% CO2
Suspensions diluted everyday with fresh medium to OD 620nm = 0,1 (0,5 McF)
0h 3h 16h 1d 2 d 4d 8d
Planctonic cultures : which impact of diazepam on bacterial efflux ?
Evaluation of the bacterial susceptibility to fluoroquinolones• MICs (*) measures in microdilutions (96-well plates)
• In absence vs presence of reserpine (10mg/L) , an efflux pump inhibitor
• Fluoroquinolones tested : ex : - Norfloxacin (FQ substrate of efflux pumps PatA/B a,c,d)- Moxifloxacin (not substrate of efflux pumps a,c,d)
No bacterial growth
MIC
Bacterialgrowth
High FQconcentration
Reserpine « R »
(*) MIC : Minimal inhibitory concentration : Smalest antibiotic concentation able to inhibit bacterial growth
a El Garch et al,2010; b Drug Information Handbook 18th Edition; c Lismond et al, 2011; d Piddock et al, 2002 b
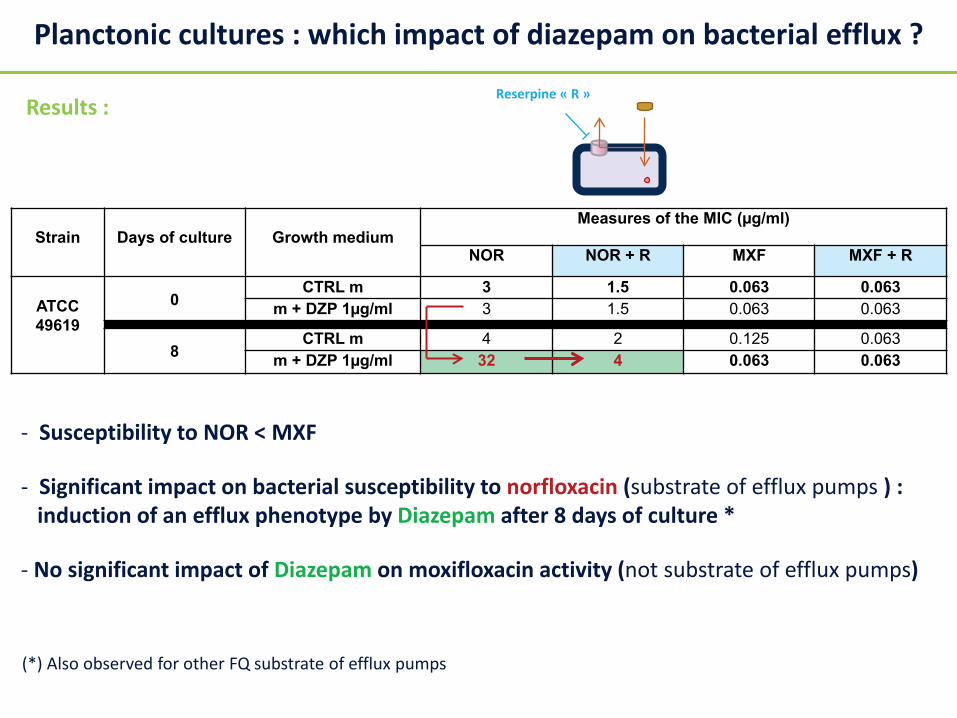
Strain Days of culture Growth mediumMeasures of the MIC (µg/ml)
NOR NOR + R MXF MXF + R
ATCC 49619
0CTRL m 3 1.5 0.063 0.063
m + DZP 1µg/ml 3 1.5 0.063 0.063
8CTRL m 4 2 0.125 0.063
m + DZP 1µg/ml 32 4 0.063 0.063
Results : Reserpine « R »
Planctonic cultures : which impact of diazepam on bacterial efflux ?
- Susceptibility to NOR < MXF
- Significant impact on bacterial susceptibility to norfloxacin (substrate of efflux pumps ) :induction of an efflux phenotype by Diazepam after 8 days of culture *
- No significant impact of Diazepam on moxifloxacin activity (not substrate of efflux pumps)
(*) Also observed for other FQ substrate of efflux pumps
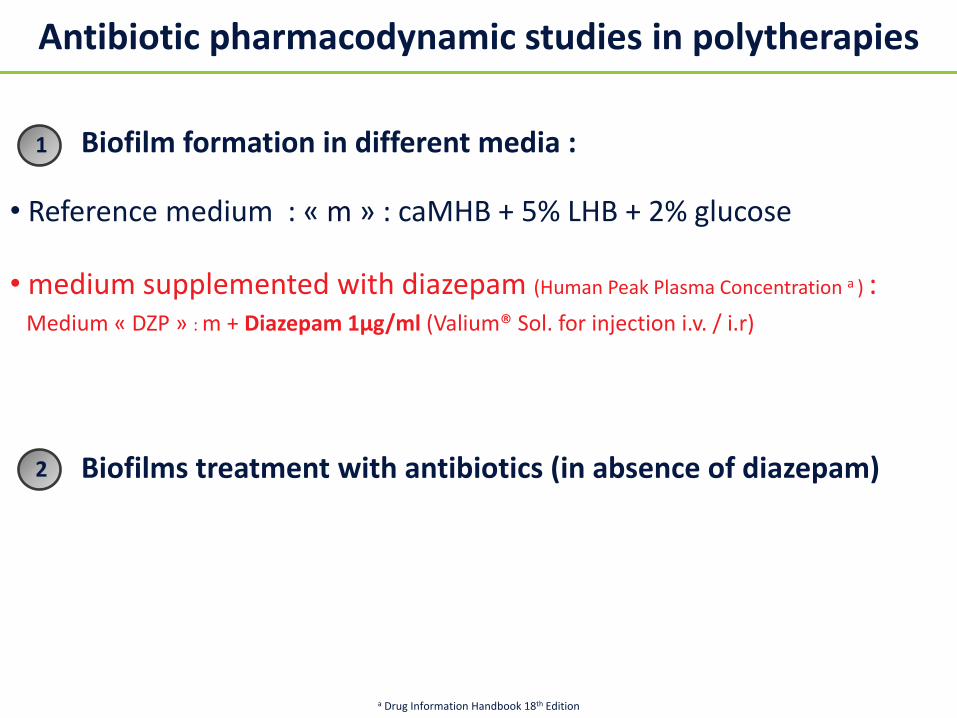
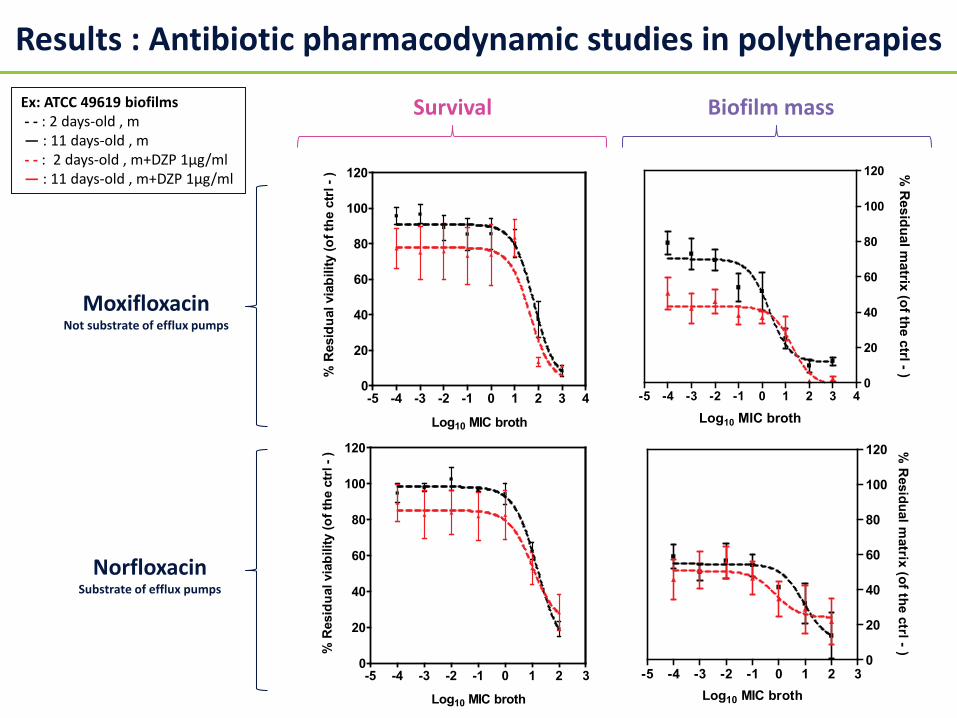
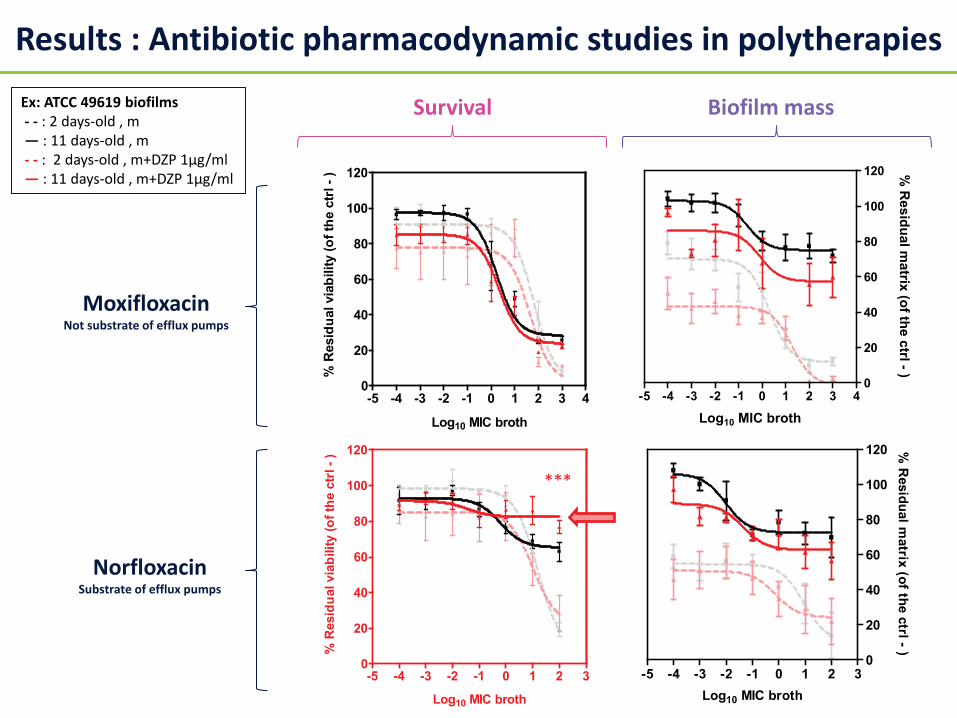
Biofilm formation in different media :
• Reference medium : « m » : caMHB + 5% LHB + 2% glucose
• medium supplemented with diazepam (Human Peak Plasma Concentration a ) :Medium « DZP » : m + Diazepam 1µg/ml (Valium® Sol. for injection i.v. / i.r)
Biofilms treatment with antibiotics (in absence of diazepam)
Antibiotic pharmacodynamic studies in polytherapies
Results : Antibiotic pharmacodynamic studies in polytherapies
***
THESIS RESULTS : CHAPTER 1 : 3-years epidemiological study
0.015
625
0.031
250.0
625
0.125 0.2
5 0.5 1 2 4 8 16 320
10
20
30
40
50no reserpine + reserpine
Minimal inhibitory concentrations (mg/L)
% o
f iso
late
s
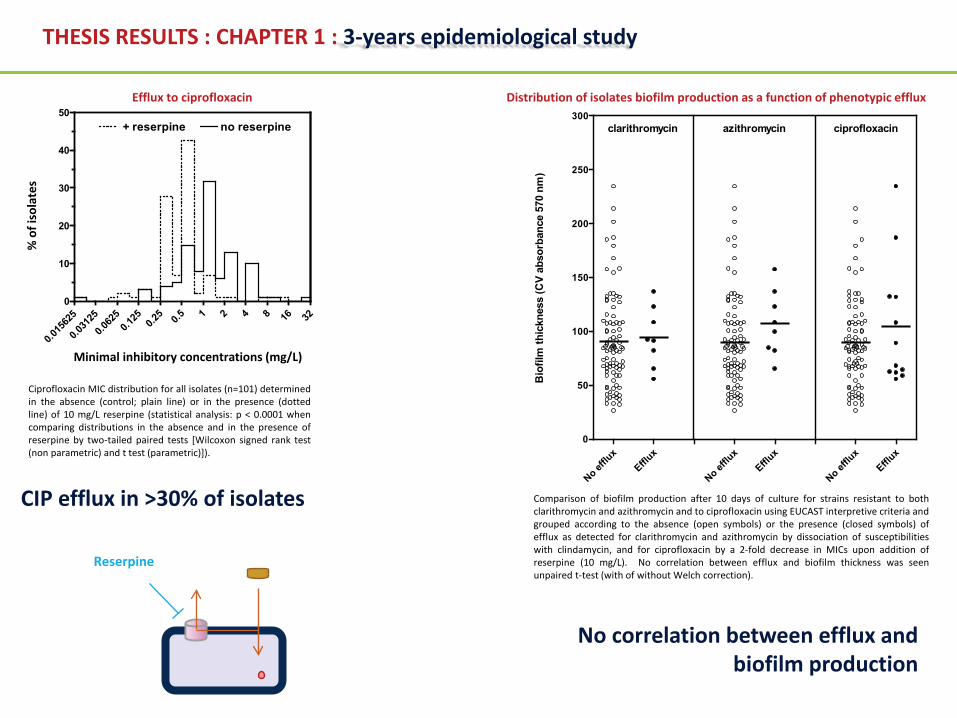
Ciprofloxacin MIC distribution for all isolates (n=101) determinedin the absence (control; plain line) or in the presence (dottedline) of 10 mg/L reserpine (statistical analysis: p < 0.0001 whencomparing distributions in the absence and in the presence ofreserpine by two-tailed paired tests [Wilcoxon signed rank test(non parametric) and t test (parametric)]).
No efflu
xEfflu
x
No efflu
xEfflu
x
No efflu
xEfflu
x0
50
100
150
200
250
300 clarithromycin azithromycin ciprofloxacin
Bio
film
thic
knes
s (C
V ab
sorb
ance
570
nm
)
Comparison of biofilm production after 10 days of culture for strains resistant to bothclarithromycin and azithromycin and to ciprofloxacin using EUCAST interpretive criteria andgrouped according to the absence (open symbols) or the presence (closed symbols) ofefflux as detected for clarithromycin and azithromycin by dissociation of susceptibilitieswith clindamycin, and for ciprofloxacin by a 2-fold decrease in MICs upon addition ofreserpine (10 mg/L). No correlation between efflux and biofilm thickness was seenunpaired t-test (with of without Welch correction).
Distribution of isolates biofilm production as a function of phenotypic effluxEfflux to ciprofloxacin
CIP efflux in >30% of isolates
No correlation between efflux and biofilm production