The copyright on this document is the property of Arcadis Vectra. This document is supplied by Arcadis Vectra on the express terms that it is to be treated as confidential and that it may not be copied, used or disclosed to others
for any purpose except as authorised in writing by Arcadis Vectra.
4.7.2 Stress Calculations 27 4.7.3 Comparison with Allowable Stresses 27
4.8 NCT 8: Free drop on lid (cold) 28 4.8.1 Summary of Pressures and Temperatures 28 4.8.2 Stress Calculation 28 4.8.3 Comparison with Allowable Stresses 28
4.9 NCT 9: Free drop on corner (hot) 29 4.9.1 Summary of Pressures and Temperatures 29 4.9.2 Stress Calculations 29 4.9.3 Comparison with Allowable Stresses 30
4.10 NCT 10: Free drop on corner (cold) 31 4.10.1 Stress Calculations 31 4.10.2 Comparison with Allowable Stresses 31
4.11 NCT 11: Free drop on side (hot) 32 4.11.1 Summary of Pressures and Temperatures 32 4.11.2 Stress Calculations 33 4.11.3 Comparison with Allowable Stresses 33
4.12 NCT 12: Free drop on side (cold) 34 4.12.1 Summary of Pressures and Temperatures 34 4.12.2 Stress Calculations 34 4.12.3 Comparison with Allowable Stresses 34
5.0 Hypothetical Accident Conditions 36
5.1 HAC 1: Free drop on lid (hot) 36 5.1.1 Summary of Pressures and Temperatures 36 5.1.2 Stress Calculations 36 5.1.3 Comparison with Allowable Stresses 36
5.2 HAC 2: Free drop on lid (cold) 37 5.2.1 Summary of Pressures and Temperatures 37 5.2.2 Stress Calculation 37 5.2.3 Comparison with Allowable Stresses 37
5.3 HAC 3: Free drop on top corner (hot) 38 5.3.1 Summary of Pressures and Temperatures 38 5.3.2 Stress Calculations 38 5.3.3 Comparison with Allowable Stresses 38
5.4 HAC 4: Free drop on corner (cold) 39 5.4.1 Stress Calculation 40 5.4.2 Comparison with Allowable Stresses 40
5.5 HAC 5: Free drop on side (hot) 40 5.5.1 Summary of Pressures and Temperatures 40 5.5.2 Stress Calculations 41 5.5.3 Comparison with Allowable Stresses 41
5.6 HAC 6: Free drop on side (cold) 42 5.6.1 Stress Calculation 42 5.6.2 Comparison with Allowable Stresses 42
6.0 Lid Closure Forces 43
7.0 Conclusions 45
8.0 References 46
Stress Analysis of Safkeg HS Containment Vessel
Report No: L20008/1/R1 Revision: 0B
27/09/2012 Page 5 of 95
Appendix A – Mesh Sensitivity Study 89 Appendix B – Bolt Preload Calculation 96
Stress Contain
Report NoRevision: 0
This repsubjecteConditiothe resuHS ove The anavalues NCT9, For all l
Analysis onment Ves
o: L20008/1/R1 0B
port described to loads ons (HAC). ults, and the
erpack was
alyses havein US NRCNCT10, NC
oad cases
of Safkeg Hssel
E
bes the stresdue to Nor This repor
e assessmenot included
e shown thaC RegulatorCT11 and N
assessed, b
HS
Execut
ss analysis rmal Conditirt describesent of the std in this ana
at the stresy Guide 7.6CT12 as we
buckling an
tive Su
of the Safkions of Tran
s the finite etresses agaalysis as tha
sses in the c6 for a numell as HAC3
nd fatigue lo
ummary
keg HS Connsport (NCTelement modainst the alloat was asse
containmenmber of the 3 and HAC5
oads are bel
y
ntainment VT) and Hypodel, the assowable valuessed by tes
nt vessel exload cases
5.
low the acc
2Pa
Vessel whenothetical Acsumptions mues. The Sasting.
xceed the as, specificall
ceptable lim
7/09/2012 age 6 of 95
n ccident made, afkeg
llowable ly cases
its.
Stress Analysis of Safkeg HS Containment Vessel
Report No: L20008/1/R1 Revision: 0B
27/09/2012 Page 7 of 95
1.0 Introduction
This report describes the stress analysis of the Safkeg HS Containment Vessel when subjected to loads due to Normal Conditions of Transport (NCT) and Hypothetical Accident Conditions (HAC). This report describes the finite element model, the assumptions made, the results, and the assessment of the stresses against the allowable values. The Safkeg HS overpack was not included in this analysis as that will be assessed by testing.
Stress Analysis of Safkeg HS Containment Vessel
Report No: L20008/1/R1 Revision: 0B
27/09/2012 Page 8 of 95
2.0 Structural Evaluation
2.1 Description of Finite Element Model
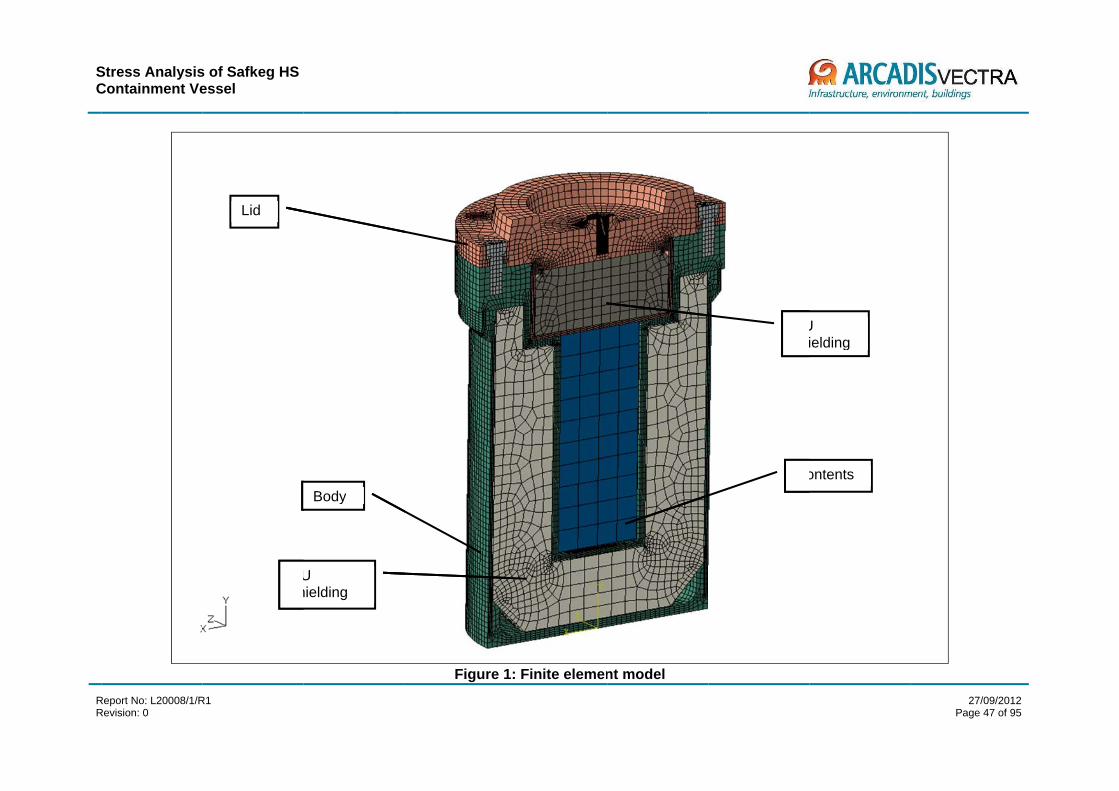
Figure 1 shows the finite element model of the containment vessel (CV). The model was originally generated using drawings provided by Croft [Ref. 1-3] but the model was subsequently modified so that the CV would satisfy the requirements of Regulatory Guide 7.6. A half-symmetry model was used as both the geometry and the load cases were all symmetric about a vertical plane through the centre of the vessel. First-order brick elements were used throughout the model. In thin sections of the vessel, at least 8 elements through the thickness were used to capture the stress distribution. A mesh sensitivity study on a similar vessel shows that this gives a reasonable compromise between accuracy and model size (Appendix A). Sliding contact was defined between all the parts with a friction coefficient of 0.1. The bolts were tied to the CV body along the threaded length but the bolt heads were free to slide. A pre-load of 8.12 kN was applied to the bolts at the start of the analyses prior to any other loads being imposed (the calculation is given in Appendix B). This corresponds to an applied torque of 10 N m as specified on the drawing. Abaqus has a standard method for applying pre-loads to bolts. This is described in section 29.5 “Prescribed Assembly Loads” in the Abaqus Analysis User’s Manual [5]. In this method, the bolts are broken at a section defined by the user. In the first step of the analysis, the bolt is shortened until the pre-load defined by the user is achieved. In subsequent steps, the length of the bolt is fixed so that the load in the bolt can vary. The model shown in Figure 1 was used for all of the non-impact cases. The model was modified for the impact load cases by including the cork impact limiter, as shown in Figure 2. The outer faces of the cork were fully constrained. A body force was applied to the vessel, which was equivalent to the measured deceleration in an impact. This pushed the vessel into the cork. The inclusion of the cork in the model spread the loads on the vessel. The cork modulus is between 28 MPa (-29°C) and 1.63 MPa (100 °C). A similar analysis was previously performed [4] using these properties, but it was found that the elements in the cork part of the model distorted severely causing the analysis to terminate prematurely. Re-analysing the impact with an artificially high modulus for the cork (1 GPa) allowed the analyses to complete successfully while adding some conservatism to the model. This is a conservative approach as using a higher cork modulus will concentrate the loads over a smaller area of the containment vessel compared with using the actual cork modulus. The plane of symmetry of the model was the plane Z=0. The boundary conditions applied to this plane were UZ=0 URX=0 URY=0 Where U is the displacement and UR is a rotation. This is standard FEA practice. As both the geometry and loading was symmetric about the plane Z=0, the use of a half-symmetry model has no effect on the results. Again, this is standard FEA practice. For the non-impact cases (NCT1-6), the CV was fixed at a single point at the centre of the bottom of the flask in the X-direction. The outer edge of the bottom of the flask was fixed in the Y-direction. These boundary conditions were to prevent any rigid body movement but do
Stress Analysis of Safkeg HS Containment Vessel
Report No: L20008/1/R1 Revision: 0B
27/09/2012 Page 9 of 95
not affect the overall behaviour of the model. No stress concentrations were observed at these locations. For impact cases NCT7, NCT8, HAC1 and HAC2 (drop on lid), the X and Y boundary conditions were maintained during the pre-loading steps. During the impact loading step, the Y boundary conditions were removed. Excessive movement in the Y direction and rotation about the Z axis was prevented by contact between the flask and the cork. Rigid body motion of the cork was prevented. For impact cases NCT9, NCT10, HAC3 and HAC4 (drop on side), the X and Y boundary conditions were maintained during the pre-loading steps. During the impact loading step, the X boundary condition was removed. The Y boundary condition was changed so that it just applied to the centre of the bottom of the flask. This prevented rigid body motion in the Y direction but about allowed rotation about the Z axis. Excessive movement in the X direction was prevented by contact between the flask and the cork. Rigid body motion of the cork was prevented. For impact cases NCT11, NCT12, HAC5 and HAC6 (drop on top corner), the X and Y boundary conditions were maintained during the pre-loading steps. During the impact loading step, the X and Y boundary conditions were removed. Excessive movement in the X and Y directions was prevented by contact between the flask and the cork. Rigid body motion of the cork was prevented. All of the analyses were performed as static analyses, i.e. dynamic effects were not included in the impact cases. The commercial finite element code Abaqus/Standard v6.10 [5] was used for the analyses. The models were created using Abaqus/CAE v6.10 [6].
2.2 Design Criteria
2.2.1 Load Combinations
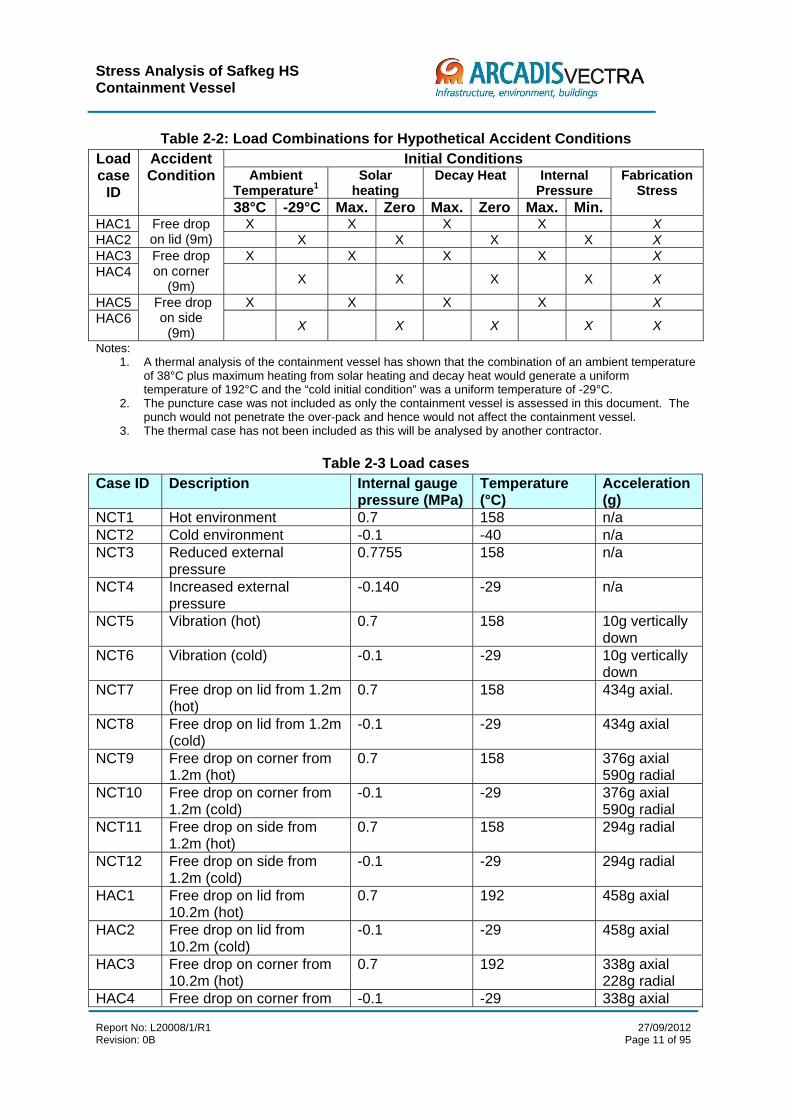
The load combinations used for the structural evaluation of the vessel were developed in accordance with Regulatory Guide 7.8 [8]. The NCT and HAC load combinations are summarized in Table 2-1 and Table 2-2. The left-hand column of these tables gives the load case ID. The hot initial condition has been taken as a uniform temperature of 158°C for NCT cases, and a value of 192°C for HAC cases and the cold initial condition has been taken as a uniform temperature of -29°C. The hot environment load case has been taken as a uniform temperature of 158°C and the cold environment load case has been taken as a uniform temperature of -40°C. In all cases, it was assumed that the fabrication temperature was 21°C. The maximum internal pressure is 8 bar absolute and the minimum pressure is 0 bar absolute. Gauge pressures are applied to the FE model, therefore the maximum pressure applied to the model was 7 bar gauge and the minimum pressure was -1 bar gauge. The vibration load was 10g in a vertical direction.
Stress Analysis of Safkeg HS Containment Vessel
Report No: L20008/1/R1 Revision: 0B
27/09/2012 Page 10 of 95
The three attitudes chosen for the free drop cases were:
1. Drop on lid. 2. Drop on side 3. Centre of gravity over top corner.
It was considered that a drop on to the base of the vessel would do less damage to the containment vessel than the drop on lid case. The same applies to a drop on the bottom corner. A drop on to the top corner may distort the lid and open the seals whereas this would not occur with a drop on the bottom corner. The accelerations values used in the analysis are given in Table 2-3. These values were taken during tests carried out by Croft Associates. In some of the tests, the accelerometers failed, so the accelerations were estimated based on the other results.
Table 2-1: Load Combinations for Normal Conditions of Transport Load Case
ID
Normal or Accident Condition
Initial Conditions Ambient
Temperature1 Solar
heating Decay Heat Internal
Pressure Fabrication
Stress
38°C -29°C Max. Zero Max. Zero Max. Min. NCT1 Hot
environment2
(38°C ambient temperature)
X X X X
NCT2 Cold environment2
(-40°C ambient temperature
X X X X
NCT3 Reduced external
pressure (24.5 kPa)
X X X X X
NCT4 Increased external
pressure (140 kPa)
X X X X X
NCT5 Vibration (10g vertical)
X X X X X NCT6 X X X X X NCT7 Free drop on
lid (1.2m) X X X X X
NCT8 X X X X X NCT9 Free drop on
corner (1.2m) X X X X X
NCT10 X X X X X NCT11 Free drop on
top(1.2m) X X X X X
NCT12 X X X X X Notes:
1. A thermal analysis of the containment vessel has shown that the combination of an ambient temperature of 38°C plus maximum heating from solar heating and decay heat would generate a uniform temperature of 158°C. The “cold ambient temperature” was a uniform temperature of -29°C.
Stress Analysis of Safkeg HS Containment Vessel
Report No: L20008/1/R1 Revision: 0B
27/09/2012 Page 11 of 95
Table 2-2: Load Combinations for Hypothetical Accident Conditions Load case
ID
Accident Condition
Initial Conditions Ambient
Temperature1 Solar
heating Decay Heat Internal
Pressure Fabrication
Stress 38°C -29°C Max. Zero Max. Zero Max. Min.
HAC1 Free drop on lid (9m)
X X X X X HAC2 X X X X X HAC3 Free drop
on corner (9m)
X X X X X HAC4 X X X X X
HAC5 Free drop on side
(9m)
X X X X X HAC6 X X X X X
Notes: 1. A thermal analysis of the containment vessel has shown that the combination of an ambient temperature
of 38°C plus maximum heating from solar heating and decay heat would generate a uniform temperature of 192°C and the “cold initial condition” was a uniform temperature of -29°C.
2. The puncture case was not included as only the containment vessel is assessed in this document. The punch would not penetrate the over-pack and hence would not affect the containment vessel.
3. The thermal case has not been included as this will be analysed by another contractor.
Table 2-3 Load cases Case ID Description Internal gauge
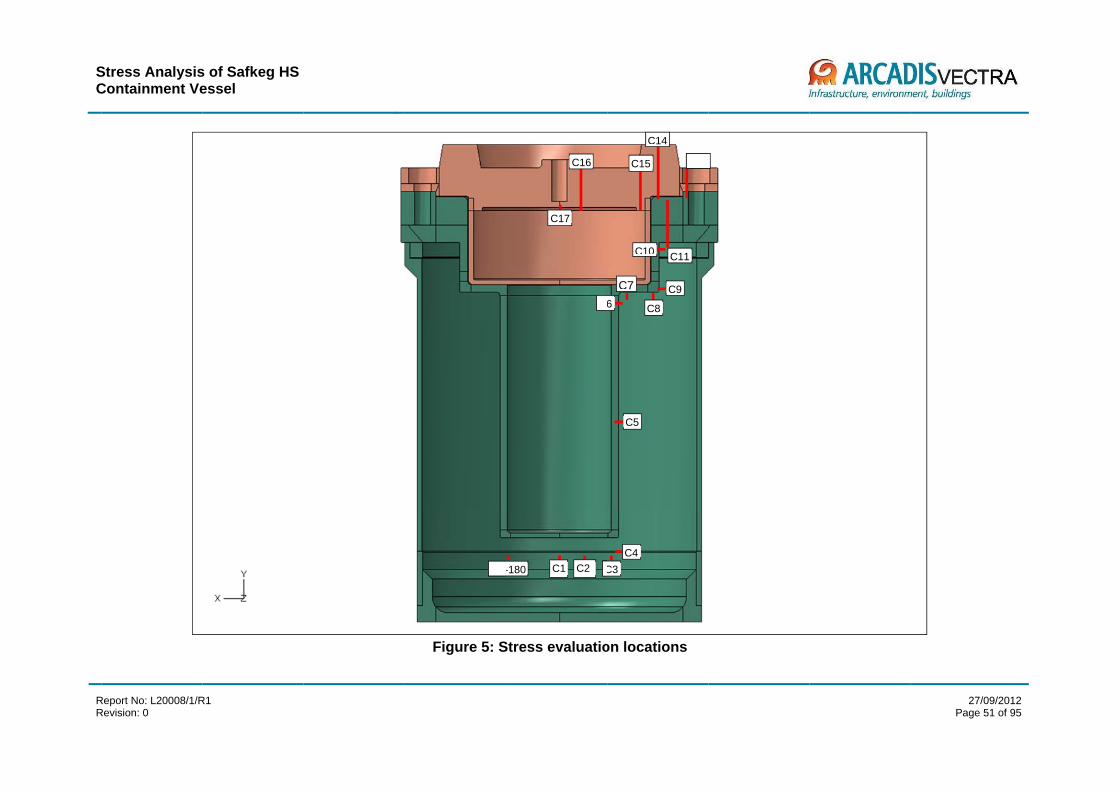
The allowable stresses were taken from Regulatory Guide 7.6 [9]. These are based on the 1977 edition of the ASME Boiler and Pressure Vessel Code. This guide only gives allowable stress values for primary membrane stress, primary membrane plus primary bending stress and primary plus secondary stress for both NCT and HAC loading conditions. The allowable values for bearing stress and for the bolts have been taken from ASME Code Section III Div 3 [10] as these are not given in Reg. Guide 7.6. Guidance for classification of stresses was taken from Table WB-3217-1 in ASME Code Section III Div 3 [10]. Stress in the non-containment parts of the vessel were not evaluated as these are not covered by Regulatory Guide 7.6 [9]. To demonstrate conformance with the allowable stress limits, it was necessary to determine the stress intensities at critical cross-sections of the containment vessel. Since the critical cross-section locations are load-condition dependent, several “stress evaluation sections” were defined to ensure that all critical locations were evaluated for every load condition. These stress evaluation sections are illustrated in Figure 5. For evaluation of conditions producing a stress distribution in the vessel that it not axisymmetric, stress evaluations were performed at multiple circumferential locations. The section stresses at each stress evaluation location were obtained using the Abaqus “stress linearization” post-processing feature [6]. The user selects a section where the stress linearization is required, and selects which stress components are required. Abaqus then prints a report with the membrane, bending and peak stresses for each stress component and stress invariant. Arcadis Vectra used the membrane and bending stresses for the Tresca stress invariant (which is equal to the stress intensity as required by NRC Regulatory Guide 7.6). The peak stress was taken by probing the model directly. These values were then put in a spreadsheet to determine the design margin. Only the smallest design margins are reported. The average bearing stress was calculated by extracting the axial force in the bolts and dividing it by the bearing area of the bolt heads. The average stress in the bolts was calculated by extracting the axial force in the bolts and dividing by the cross-sectional area of the bolts. The average shear stress was calculated by determining the shear force between the bolt head and lid and dividing by the contact area.
Stress Analysis of Safkeg HS Containment Vessel
Report No: L20008/1/R1 Revision: 0B
27/09/2012 Page 13 of 95
Using the critical sections from each load case, minimum design margins are calculated and reported for all bounding load combinations. The design margin (DM) is defined as follows:
1_
_
ValueCalculated
ValueAllowableDM
Therefore a negative design margin indicates that the vessel has failed the assessment.
Table 2-4: Containment System Allowable Design Criteria Stress Type Allowable Stress Limits
NCT HAC Other Than Bolts
Primary Membrane Stress Intensity (Pm)
Sm Lesser of 2.4Sm and 0.7Su
Primary Local Membrane Stress Intensity (PL)
Sm (2) N/A (3)
Primary + Bending Stress Intensity (PL or Pm+Pb)
1.5Sm Lesser of 3.6Sm and Su
Primary + Secondary Stress Intensity (PL or Pm+Q)
3.0Sm N/A
Average Bearing Stress Sy N/A Bolts
Average Shear Stress 0.4Sy Lesser of 0.42Su and 0.6Sy
Average Stress (4) 2Sm Lesser of 3Sm and 0.7Su Maximum Stress (5) 3Sm N/A (6)
Notes: 1. Stress limits applicable for components and systems evaluated using elastic system analysis. 2. ASME B&PV code gives an allowable of 1.5Sm for primary local membrane stress, PL. However, Reg.
Guide 7.6 does not specify an allowable for this stress, so a lower allowable value of Sm has been adopted for this assessment.
3. Evaluation of secondary stress is not required for HAC. 4. The axial stress component averaged across the bolt cross-section and neglecting stress
concentrations. 5. The stress due to internal pressure and gasket seating loads (e.g. bolt torque) shall not exceed one
times Sm. 6. Evaluation of maximum bolt stress not required for HAC.
2.2.3 Buckling
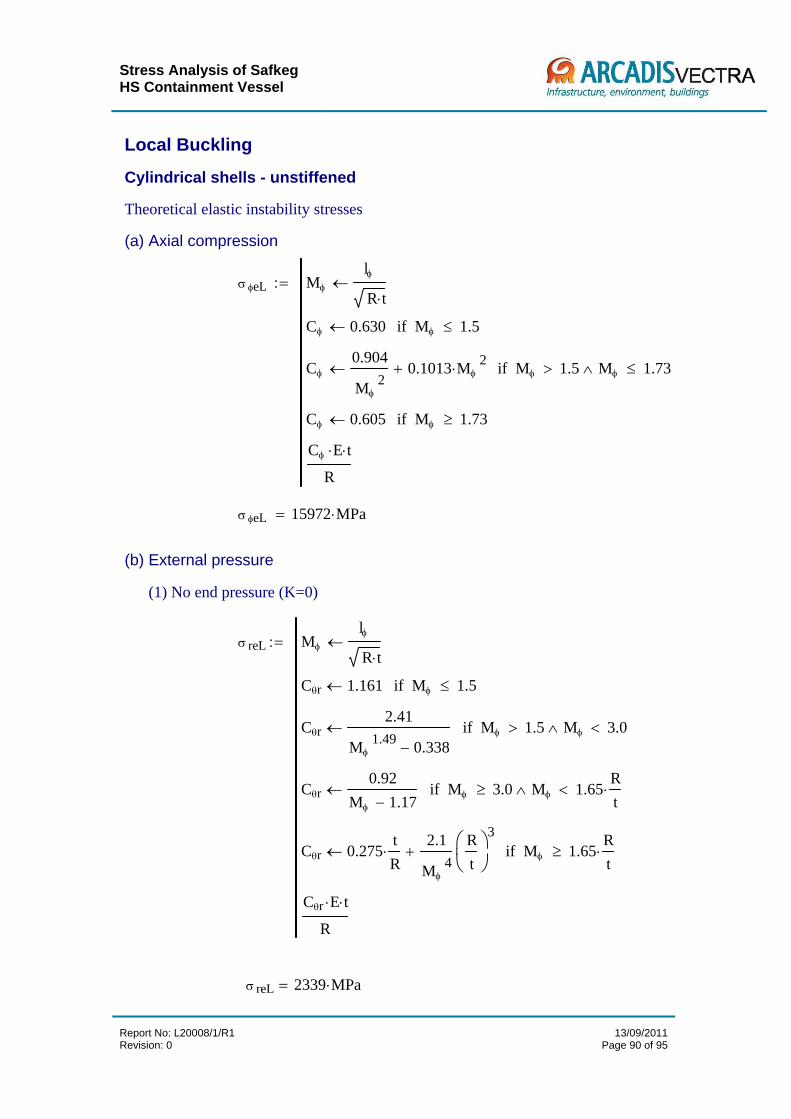
The containment vessel inner shell was evaluated for buckling in accordance with the requirements of ASME Code Case N-284-2 [10]. Capacity reduction factors are calculated in accordance with Section -1511 of ASME Code Case N-284-2 to account for possible reductions in the capacity of the shells due to imperfections and nonlinearity in geometry and boundary conditions. Plasticity reduction factors, which account for nonlinear material properties when the product of the classical buckling stresses and capacity reduction factors exceed the proportional limit, are calculated in accordance with Section -1610 of ASME Code Case N-284-2. The theoretical buckling stresses of the vessel inner shell under uniform stress fields are calculated in accordance with Section -1712.1.1 of ASME Code Case N-284-2. The geometric parameters used in the buckling assessment are given in Table 2-5. The capacity reduction factors, plasticity reduction factors, and theoretical buckling stresses for the vessel inner shell are summarized in Table 2-6.
Stress Analysis of Safkeg HS Containment Vessel
Report No: L20008/1/R1 Revision: 0B
27/09/2012 Page 14 of 95
The allowable elastic and inelastic buckling stresses for NCT and HAC are calculated in accordance with the formulas given in Section -1713.1.1 and Section -1713.2.1 of ASME Code Case N-284-2. The allowable buckling stresses include factors of safety of 2.0 for NCT and 1.34 for HAC in accordance with Section -1400 of ASME Code Case N-284-2. Table 2-7 provides a summary of the vessel inner shell elastic and inelastic buckling stresses for NCT and HAC. Buckling interaction ratios are calculated for the containment vessel inner shell for all NCT and HAC tests that load the shells in compression. The interaction ratios for elastic buckling and inelastic buckling are calculated using the highest values of compressive stress and shear stress from the finite element analysis solutions in accordance with the formulas given in Section -1713.1.1 and Section -1713.2.1 of ASME Code Case N-284-2. An example of the buckling calculation is given in Appendix A. The stresses used in the calculation were taken from point C5, which is mid-way along the length of the inner shell of the containment vessel. Where one of the stress components is tensile in the FE analysis, it should be given a value of 0 MPa in the buckling calculation. However, to avoid divide by zero errors, it was given a very small positive value in the buckling calculation.
Mean radius, R (mm) 35.25 mm Shell thickness, t (mm) 4.7 mm R/t 7.5 Unsupported axial length, l (mm) 152.4 mm Unsupported circumferential length, l (mm) 236.3 mm
Table 2-6: Buckling reduction factors and theoretical buckling stresses Calculation Parameter Hot ambient temp.
The fatigue analysis was carried out in accordance with section C.3 in NRC Reg. Guide 7.6 [9]. The fatigue analysis was performed as follows:
1. The alternating stress, Salt, was calculated as one-half the maximum absolute value of S’12, S’23, S’31 for all possible stress states i and j where 1, 2 and 3 are principal stresses and
State i is after the bolt pre-load has been applied and state j is after all the other loads have been applied. This calculation of Salt is carried out in the post-processor.
2. Salt is multiplied by the ratio of the modulus of elasticity given on the design fatigue curve to the modulus of elasticity used in the analysis to obtain a value of stress to be used with the design fatigue curves.
3. The highest value of Salt determine in step 2 is then compared with the design fatigue curves (Figure I-9.2.2) in Appendix I of ASME B&PV Section III [10].
The number of cycles that the Safkeg HS CV will undergo is approximately 50 cycles/year for 20 years = 1000 cycles. The number of cycles was multiplied by 10 to give 10000 cycles, to give a safety margin.
Stress Analysis of Safkeg HS Containment Vessel
Report No: L20008/1/R1 Revision: 0B
27/09/2012 Page 16 of 95
3.0 Materials
3.1 Material Properties and Specifications
The material specification for each part in the model is given in Table 3-1. The material properties used in the analysis are given in Table 3-2 to 3-4.
Table 3-1: Material specifications Part Material Containment vessel body Type 304L stainless steel Containment vessel lid Type 304L stainless steel Shielding Depleted Uranium Containment vessel bolts SA-320/A320 Grade L43 Bolting Steel Contents of CV 4% Sb Lead
Table 3-2: Mechanical Properties of Type 304L Stainless Steel
Temp (°C)
Design stress intensity Sm (MPa)(2)
Yield strength, Sy (MPa)(3)
Tensile strength, Su (MPa)(4)
Modulus of Elasticity, E (GPa)(5)
Mean. Coef. Of Thermal Expansion, (m/m/°C x 10-6)(6)
Notes: 1. Values for SA-240/A240 product specifications. 2. ASME Code, Section II, Part D [10], Table 2A. 3. ASME Code, Section II, Part D [10], Table Y-1. 4. ASME Code, Section II, Part D [10], Table U. 5. ASME Code, Section II, Part D [10], Table TM-1, Material Group G. 6. ASME Code, Section II, Part D [10], Table TE-1, Group 3, Coefficient B (mean from 70°F) 7. The yield strength and tensile strength were not used in the FE model as a linear-elastic analysis was
performed. These values were used in the stress assessment. 8. A Poisson’s ratio of 0.3 and a density of 8030 kg/m3 were used.
Stress Analysis of Safkeg HS Containment Vessel
Report No: L20008/1/R1 Revision: 0B
27/09/2012 Page 17 of 95
Table 3-3: Mechanical Properties of SA-320/A320 Grade L43 Bolting Steel
Temp (°C)
Design stress intensity Sm (MPa)(1)
Yield strength, Sy (MPa)(2)
Tensile strength, Su (MPa)(3)
Modulus of Elasticity, E (GPa)(4)
Mean. Coef. Of Thermal Expansion, (m/m/°C x 10-6)(5)
Notes: 1. ASME Code, Section II, Part D [10], Table 4. 2. In accordance with ASME Code, Section II, Part D [10], Table 4, General Note (a), the yield strength is
equal to 3 times the allowable stress value, Sm. 3. Minimum tensile strength from ASME Code, Section II, Part D [10], Table 4. 4. ASME Code, Section II, Part D [10], Table TM-1, Material Group G. 5. ASME Code, Section II, Part D [10], Table TE-1, Group 1, Coefficient B (mean from 70°F) 6. Values shown in italics are calculated using linear interpolation or linear extrapolation. 7. The yield strength and tensile strength were not used in the FE model as a linear-elastic analysis was
performed. These values were used in the stress assessment. 8. A Poisson’s ratio of 0.3 and a density of 7860 kg/m3 were used.
Table 3-4: Mechanical Properties of DU Alloy
Temp (°C)
Density (kg/m3)
Modulus of Elasticity, E (GPa)
Poisson’s ratio Mean. Coef. Of Thermal Expansion, (m/m/°C x 10-6)
Notes: 1. Average tension modulus of DU from [11]. 2. Properties from Figure I-2 of [12].
Table 3-5: Mechanical properties of Lead 4% Sb [13]
Density (kg/m3) Modulus of Elasticity (GPa)
Poisson’s ratio Mean. Coef. Of Thermal Expansion, (m/m/°C x 10-6)
11680 16.1 0.44 29
Stress Analysis of Safkeg HS Containment Vessel
Report No: L20008/1/R1 Revision: 0B
27/09/2012 Page 18 of 95
4.0 Normal Conditions of Transport
This section presents the structural evaluation of the package in accordance with Reg. Guides 7.6 and 7.8 [9, 8] when subject to the NCT tests specified in Reg. Guide 7.8. The package is evaluated for each NCT test individually based on the most unfavourable initial conditions.
4.1 NCT 1: Hot Environment
4.1.1 Summary of Pressures and Temperatures
In this case, the package is subject to an ambient temperature of 38°C in still air, with solar heating and with maximum decay heat. A thermal analysis has shown that a bounding condition for the containment vessel was a uniform temperature of 158°C. The internal gauge pressure was 700 kPa.
4.1.2 Stress Calculations
The stresses in the containment vessel were calculated using the finite element model described in section 2.1. Figure 6 shows the deformations in the vessel, scaled a by a factor of 20. Some parts appear to be passing through each other but that is not the case because of the high scale factor. There was no significant distortion of either the body or the lid. Figure 7 shows the stress intensity in the vessel for this case. The highest stresses were around the bolts. All of the stresses were well below the allowable values.
4.1.3 Comparison with Allowable Stresses
The stresses in the containment vessel were evaluated at the locations shown in Figure 5 Stress linearization at these locations was carried out using a post-processing option in Abaqus. The stresses were then compared with the allowable stresses given in Table 2-4. A summary of the evaluation is given in Table 4-1. The containment vessel satisfies the requirements of Reg. Guide 7.6 as all of the design margins were above zero. The stresses in the bolts are summarised in Table 4-2. The bolts satisfy the requirements of Reg. Guide 7.6 as all of the design margins were above zero. The buckling evaluation is summarised in Table 4-3. As all of the stress components were tensile in this case, the design margin is effectively infinite, hence the containment vessel satisfies the requirements of Reg. Guide 7.6 for buckling. The fatigue evaluation is given in Table 4-4. As the value of the maximum alternating stress in the containment vessel was below the fatigue threshold, the design margin is effectively infinite. Hence the containment vessel satisfies the requirements of Reg. Guide 7.6 for fatigue.
Stress Analysis of Safkeg HS Containment Vessel
Report No: L20008/1/R1 Revision: 0B
27/09/2012 Page 19 of 95
Table 4-1: Hot Environment: Containment Vessel Stress Summary Stress type Maximum
1. If the calculated stress from the FEA is tensile then it is assumed to be zero for the buckling calculation. 2. As all the stresses were tensile, the design margin is effectively infinite.
Table 4-4: Hot Environment: Fatigue Evaluation
Maximum alternating stress
(MPa)
Required no. of cycles
Cycles to failure Design margin
44.72 10000 > 1011 n/a(1)
1. As the alternating stress was below the fatigue threshold, the design margin is effectively infinite.
4.2 NCT 2: Cold Environment
4.2.1 Summary of Pressures and Temperatures
In this case, the package is subject to an ambient temperature of -40°C in still air, zero solar heating and with zero decay heat. This case assumed that the external pressure was 100 kPa. The internal pressure was 0 kPa absolute, so the internal gauge pressure applied to the model was -100 kPa.
4.2.2 Stress Calculations
The stresses in the containment vessel were calculated using the finite element model described in section 2.1. Figure 8 shows the deformations in the vessel. There was no significant deformation.
Stress Analysis of Safkeg HS Containment Vessel
Report No: L20008/1/R1 Revision: 0B
27/09/2012 Page 20 of 95
Figure 9 shows the stress intensity in the vessel for this case. The stresses were low for most of the vessel. The highest stresses were under the bolt heads.
4.2.3 Comparison with Allowable Stresses
The stresses in the containment vessel were evaluated at the locations shown in Figure 5. Stress linearization at these locations was carried out using a post-processing option in Abaqus. The stresses were then compared with the allowable stresses given in Table 2-4. A summary of the evaluation is given in Table 4-5. The containment vessel satisfies the requirements of Reg. Guide 7.6 as all of the design margins were above zero. The stresses in the bolts are summarised in Table 4-6. The bolts satisfy the requirements of Reg. Guide 7.6 as all of the design margins were above zero. The buckling evaluation is summarised in Table 4-13. The design margin was above zero hence the containment vessel satisfies the requirements of Reg. Guide 7.6 for buckling. The fatigue evaluation is given in Table 4-14. As the value of the maximum alternating stress in the containment vessel was below the fatigue threshold, the design margin is effectively infinite. Hence the containment vessel satisfies the requirements of Reg. Guide 7.6 for fatigue.
Table 4-5: Cold Environment: Containment Vessel Stress Summary Stress type Maximum
Table 4-8: Cold Environment: Fatigue Evaluation Maximum
alternating stress (MPa)
Required no. of cycles
Cycles to failure Design margin
10.16 10000 > 1011 n/a(1)
1. As the alternating stress was below the fatigue threshold, the design margin is effectively infinite.
4.3 NCT 3: Reduced External Pressure
4.3.1 Summary of Pressures and Temperatures
In this case, the package is subject to an ambient temperature of 38°C in still air, with solar heating and with maximum decay heat. A thermal analysis has shown that a bounding condition for the containment vessel was a uniform temperature of 158°C. This case assumed that the external pressure was reduced to 24.5 kPa. The internal pressure was 800 kPa absolute, so the internal gauge pressure applied to the model was 775.5 kPa.
4.3.2 Stress Calculations
The stresses in the containment vessel were calculated using the finite element model described in section 2.1. The displacements for this case are similar to those for case NCT1. Figure 10 shows the stress intensity in the vessel for this case. The regions of high stress are similar to those for case NCT1. This is because the stresses are dominated by the thermal stresses rather than those due to the pressure.
4.3.3 Comparison with Allowable Stresses
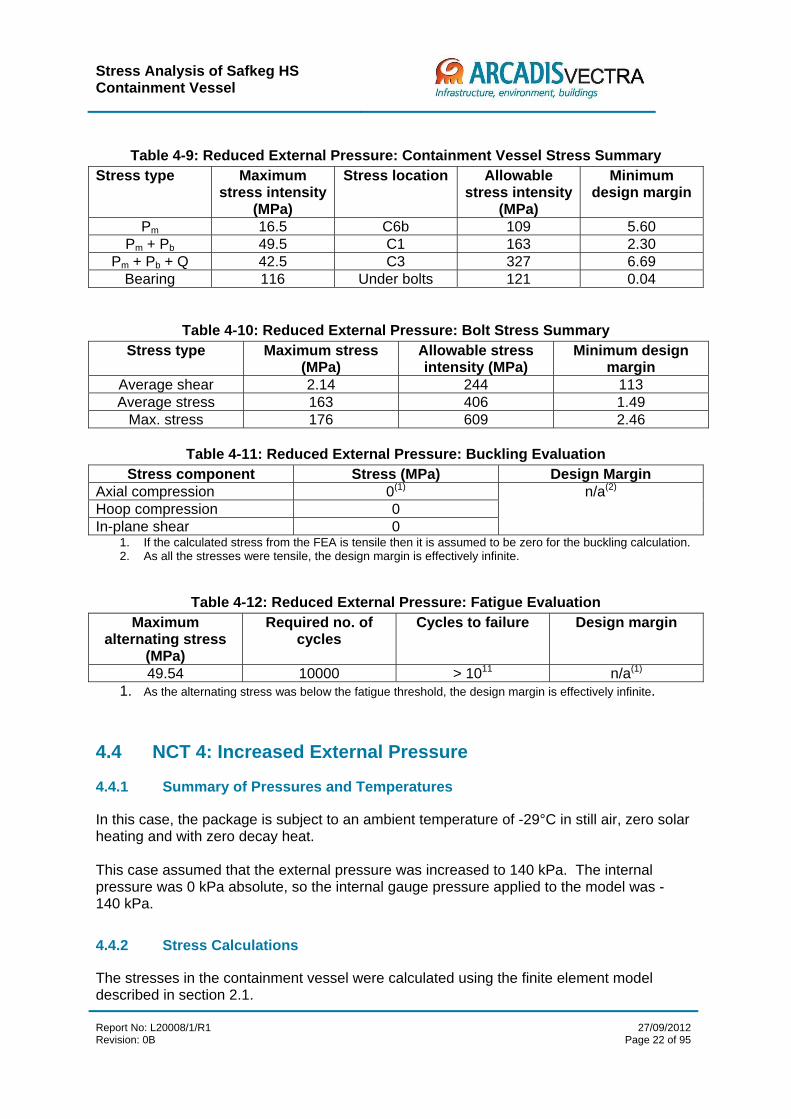
The stresses in the containment vessel were evaluated at the locations shown in Figure 5. Stress linearization at these locations was carried out using a post-processing option in Abaqus. The stresses were then compared with the allowable stresses given in Table 2-4. A summary of the evaluation is given in Table 4-9. The containment vessel satisfies the requirements of Reg. Guide 7.6 as all of the design margins were above zero. The stresses in the bolts are summarised in Table 4-10. The bolts satisfy the requirements of Reg. Guide 7.6 as all of the design margins were above zero. The buckling evaluation is summarised in Table 4-11. As all of the stress components were tensile in this case, the design margin is effectively infinite, hence the containment vessel satisfies the requirements of Reg. Guide 7.6 for buckling. The fatigue evaluation is given in Table 4-12. As the value of the maximum alternating stress in the containment vessel was below the fatigue threshold, the design margin is effectively infinite. Hence the containment vessel satisfies the requirements of Reg. Guide 7.6 for fatigue.
1. If the calculated stress from the FEA is tensile then it is assumed to be zero for the buckling calculation. 2. As all the stresses were tensile, the design margin is effectively infinite.
Table 4-12: Reduced External Pressure: Fatigue Evaluation Maximum
alternating stress (MPa)
Required no. of cycles
Cycles to failure Design margin
49.54 10000 > 1011 n/a(1)
1. As the alternating stress was below the fatigue threshold, the design margin is effectively infinite.
4.4 NCT 4: Increased External Pressure
4.4.1 Summary of Pressures and Temperatures
In this case, the package is subject to an ambient temperature of -29°C in still air, zero solar heating and with zero decay heat. This case assumed that the external pressure was increased to 140 kPa. The internal pressure was 0 kPa absolute, so the internal gauge pressure applied to the model was -140 kPa.
4.4.2 Stress Calculations
The stresses in the containment vessel were calculated using the finite element model described in section 2.1.
Stress Analysis of Safkeg HS Containment Vessel
Report No: L20008/1/R1 Revision: 0B
27/09/2012 Page 23 of 95
The displacements for this case were similar to those for case NCT2. Figure 11 shows the stress intensity in the vessel for this case. The highest stresses were under the bolt heads.
4.4.3 Comparison with Allowable Stresses
The stresses in the containment vessel were evaluated at the locations shown in Figure 5. Stress linearization at these locations was carried out using a post-processing option in Abaqus. The stresses were then compared with the allowable stresses given in Table 2-4. A summary of the evaluation is given in Table 4-13. The containment vessel satisfies the requirements of Reg. Guide 7.6 as all of the design margins were above zero. The stresses in the bolts are summarised in Table 4-14. The bolts satisfy the requirements of Reg. Guide 7.6 as all of the design margins were above zero. The buckling evaluation is summarised in Table 4-15. The design margin was above zero hence the containment vessel satisfies the requirements of Reg. Guide 7.6 for buckling. The fatigue evaluation is given in Table 4-16. As the value of the maximum alternating stress in the containment vessel was below the fatigue threshold, the design margin is effectively infinite. Hence the containment vessel satisfies the requirements of Reg. Guide 7.6 for fatigue.
Table 4-13: Increased External Pressure: Containment Vessel Stress Summary Stress type Maximum
Table 4-16: Increased External Pressure: Fatigue Evaluation Maximum
alternating stress (MPa)
Required no. of cycles
Cycles to failure Design margin
28.4 10000 > 1011 n/a(1)
1. As the alternating stress was below the fatigue threshold, the design margin is effectively infinite.
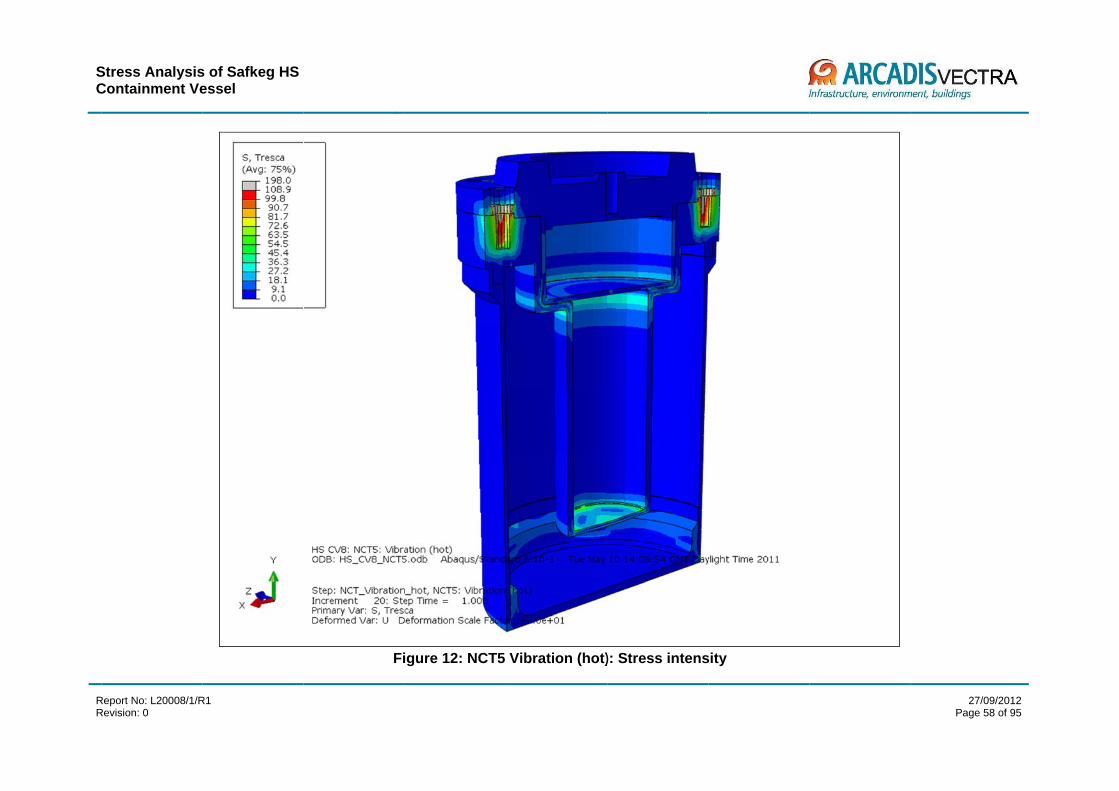
4.5 NCT 5: Vibration (hot)
4.5.1 Summary of Pressures and Temperatures
In this case, the package is subject to an ambient temperature of 38°C in still air, with solar heating and with maximum decay heat. A thermal analysis has shown that a bounding condition for the containment vessel was a uniform temperature of 158°C. This case assumed that the external pressure was 100 kPa. The internal pressure was 800 kPa absolute, so the internal gauge pressure applied to the model was 700 kPa. A body force was applied to the model which was equivalent to a downward vertical acceleration of 10g. This was assumed to be the load due to vibration.
4.5.2 Stress Calculations
The stresses in the containment vessel were calculated using the finite element model described in section 2.1. The displacements for this case were similar to those for case NCT1. Figure 12 shows the stress intensity in the vessel for this case. The regions of high stress are similar to those for case NCT1. This is because the stresses are dominated by the thermal stresses rather than those due to the vibration load.
4.5.3 Comparison with Allowable Stresses
The stresses in the containment vessel were evaluated at the locations shown in Figure 5. Stress linearization at these locations was carried out using a post-processing option in Abaqus. The stresses were then compared with the allowable stresses given in Table 2-4. A summary of the evaluation is given in Table 4-17. The containment vessel satisfies the requirements of Reg. Guide 7.6 as all of the design margins were above zero. The stresses in the bolts are summarised in Table 4-18. The bolts satisfy the requirements of Reg. Guide 7.6 as all of the design margins were above zero. The buckling evaluation is summarised in Table 4-19. As all of the stress components were tensile in this case, the design margin is effectively infinite, hence the containment vessel satisfies the requirements of Reg. Guide 7.6 for buckling.
Stress Analysis of Safkeg HS Containment Vessel
Report No: L20008/1/R1 Revision: 0B
27/09/2012 Page 25 of 95
Table 4-17: Vibration (hot): Containment Vessel Stress Summary Stress type Maximum
1. If the calculated stress from the FEA is tensile then it is assumed to be zero for the buckling calculation. 2. As all the stresses were tensile, the design margin is effectively infinite.
4.6 NCT 6: Vibration (cold)
4.6.1 Summary of Pressures and Temperatures
In this case, the package is subject to an ambient temperature of -29°C in still air, zero solar heating and with zero decay heat. This case assumed that the external pressure was 100 kPa. The internal pressure was 0 kPa absolute, so the internal gauge pressure applied to the model was -100 kPa. A body force was applied to the model which was equivalent to a downward vertical acceleration of 10g. This was assumed to be the load due to vibration.
4.6.2 Stress Calculations
The stresses in the containment vessel were calculated using the finite element model described in section 2.1. The displacements for this case are very similar to those for case NCT2. Figure 13 shows the stress intensity in the vessel for this case. The regions of high stress are similar to those for case NCT2. This is because the stresses are dominated by the thermal stresses rather than those due to the vibration loads.
Stress Analysis of Safkeg HS Containment Vessel
Report No: L20008/1/R1 Revision: 0B
27/09/2012 Page 26 of 95
4.6.3 Comparison with Allowable Stresses
The stresses in the containment vessel were evaluated at the locations shown in Figure 5. Stress linearization at these locations was carried out using a post-processing option in Abaqus. The stresses were then compared with the allowable stresses given in Table 2-4. A summary of the evaluation is given in Table 4-20. The containment vessel satisfies the requirements of Reg. Guide 7.6 as all of the design margins were above zero. The stresses in the bolts are summarised in Table 4-21. The bolts satisfy the requirements of Reg. Guide 7.6 as all of the design margins were above zero. The buckling evaluation is summarised in Table 4-22. The design margin was above zero hence the containment vessel satisfies the requirements of Reg. Guide 7.6 for buckling.
Table 4-20: Vibration (cold): Containment Vessel Stress Summary Stress type Maximum
In this case, the package is subject to an ambient temperature of 38°C in still air, with solar heating and with maximum decay heat. A thermal analysis has shown that a bounding condition for the containment vessel was a uniform temperature of 158°C. This case assumed that the external pressure was 100 kPa. The internal pressure was 800 kPa absolute, so the internal gauge pressure applied to the model was 700 kPa.
Stress Analysis of Safkeg HS Containment Vessel
Report No: L20008/1/R1 Revision: 0B
27/09/2012 Page 27 of 95
A body force was applied to the model which was equivalent to an upward vertical acceleration of 434g. This was the measured load due to an impact on the lid from a height if 1.2 metres. The cork impact limiter was included in this model.
4.7.2 Stress Calculations
Figure 14 the deformations in the vessel, scaled a by a factor of 30. Compared with case NCT1, there was slightly more distortion of the lid. This bowing was caused by the impact of the contents with the bottom of the lid. Figure 15 shows the stress intensity in the vessel for this case. The stress distribution is similar to that for case NCT1, but with some additional stress in the lid and the upper part of the body.
4.7.3 Comparison with Allowable Stresses
The stresses in the containment vessel were evaluated at the locations shown in Figure 5. Stress linearization at these locations was carried out using a post-processing option in Abaqus. The stresses were then compared with the allowable stresses given in Table 2-4. A summary of the evaluation is given in Table 4-23. The containment vessel satisfies the requirements of Reg. Guide 7.6 as all of the design margins were above zero. The stresses in the bolts are summarised in Table 4-24. The bolts satisfy the requirements of Reg. Guide 7.6 as all of the design margins were above zero. The buckling evaluation is summarised in Table 4-25. As all of the stress components were tensile in this case, the design margin is effectively infinite, hence the containment vessel satisfies the requirements of Reg. Guide 7.6 for buckling.
Table 4-23: Drop on lid from 1.2m (hot): Containment Vessel Stress Summary Stress type Maximum
Table 4-24: Drop on lid from 1.2m (hot): Bolt Stress Summary Stress type Maximum stress
(MPa) Allowable stress intensity (MPa)
Minimum design margin
Average shear 14.3 244 16.0 Average stress 153 406 1.65
Max. stress 174 609 2.50
Stress Analysis of Safkeg HS Containment Vessel
Report No: L20008/1/R1 Revision: 0B
27/09/2012 Page 28 of 95
Table 4-25: Drop on lid from 1.2m (hot): Buckling Evaluation Stress component Stress (MPa) Design Margin
Axial compression 0.68 87
Hoop compression -4.51 In-plane shear 0
4.8 NCT 8: Free drop on lid (cold)
4.8.1 Summary of Pressures and Temperatures
In this case, the package is subject to an ambient temperature of -29°C in still air, zero solar heating and with zero decay heat. This case assumed that the external pressure was 100 kPa. The internal pressure was 0 kPa absolute, so the internal gauge pressure applied to the model was -100 kPa. A body force was applied to the model which was equivalent to an upward vertical acceleration of 434g. This was the measured load due to an impact on the lid from a height of 1.2 metres. The cork impact limiter was included in this model.
4.8.2 Stress Calculation
The displacements for this case were similar to those for case NCT7. Figure 16 shows the stress intensity in the vessel for this case. The highest stresses were in the lid.
4.8.3 Comparison with Allowable Stresses
The stresses in the containment vessel were evaluated at the locations shown in Figure 5: Stress evaluation locations. Stress linearization at these locations was carried out using a post-processing option in Abaqus. The stresses were then compared with the allowable stresses given in Table 2-4. A summary of the evaluation is given in Table 4-26. The containment vessel satisfies the requirements of Reg. Guide 7.6 as all of the design margins were above zero. The stresses in the bolts are summarised in Table 4-27. The bolts satisfy the requirements of Reg. Guide 7.6 as all of the design margins were above zero. The buckling evaluation is summarised in Table 4-28. The design margin was above zero hence the containment vessel satisfies the requirements of Reg. Guide 7.6 for buckling.
Stress Analysis of Safkeg HS Containment Vessel
Report No: L20008/1/R1 Revision: 0B
27/09/2012 Page 29 of 95
Table 4-26: Drop on lid from 1.2m (cold): Containment Vessel Stress Summary Stress type Maximum
Table 4-27: Drop on lid from 1.2m (cold): Bolt Stress Summary Stress type Maximum stress
(MPa) Allowable stress intensity (MPa)
Minimum design margin
Average shear 7.39 289 38.1 Average stress 75.0 482 5.43
Max. stress 116 723 5.23
Table 4-28: Drop on lid from 1.2m (cold): Buckling Evaluation Stress component Stress (MPa) Design Margin
Axial compression 3.34 24
Hoop compression 0.68 In-plane shear 0
4.9 NCT 9: Free drop on corner (hot)
4.9.1 Summary of Pressures and Temperatures
In this case, the package is subject to an ambient temperature of 38°C in still air, with solar heating and with maximum decay heat. A thermal analysis has shown that a bounding condition for the containment vessel was at a uniform temperature of 158°C. This case assumed that the external pressure was 100 kPa. The internal pressure was 800 kPa absolute, so the internal gauge pressure applied to the model was 700 kPa. A body force was applied to the model which was equivalent to an acceleration of 376g axially and 590g radially, giving a resultant acceleration of 700g. This was the measured load due to an impact on the top corner from a height of 1.2 metres. The cork impact limiter was included in this model.
4.9.2 Stress Calculations
Figure 17 shows the displacements for this case. The inner part of the body has rotated clockwise slightly. However, it does not come in to contact with the DU shielding. Figure 18 shows the stress intensity in the vessel. The upper limit on the contour plot is the allowable value for the membrane stress, which was exceeded in several locations. The high stresses in the outer part of the body are not of concern as this is not part of the pressure containment boundary and is not assessed against the allowable stresses.
Stress Analysis of Safkeg HS Containment Vessel
Report No: L20008/1/R1 Revision: 0B
27/09/2012 Page 30 of 95
4.9.3 Comparison with Allowable Stresses
The stresses in the containment vessel were evaluated at the locations shown in Figure 5. Stress linearization at these locations was carried out using a post-processing option in Abaqus. The stresses were then compared with the allowable stresses given in Table 2-4. A summary of the evaluation is given in Table 4-29. Locations with a name ending “-180” are on the opposite side of the vessel to those shown in Figure 5, i.e. they are on the side of the vessel closest to the impact with the cork impact limiter. The highlighted values show where the stresses exceeded the allowable stress. The stresses in the bolts are summarised in Table 4-30. The bolts satisfy the requirements of Reg. Guide 7.6 as all of the design margins were above zero. The buckling evaluation is summarised in Table 4-31. The containment vessel satisfies the requirements of Reg. Guide 7.6 for buckling.
Table 4-29: Drop on corner from 1.2m (hot): Containment Vessel Stress Summary Stress type Maximum
Table 4-30: Drop on corner from 1.2m (hot): Bolt Stress Summary Stress type Maximum stress
(MPa) Allowable stress intensity (MPa)
Minimum design margin
Average shear 13.3 244 17.3 Average stress 170 406 1.39
Max. stress 184 609 2.31
Table 4-31: Drop on side from 1.2m (hot): Buckling Evaluation Stress component Stress (MPa) Design Margin
Axial compression 0 2365
Hoop compression 0 In-plane shear 0.74
1. If the calculated stress from the FEA is tensile then it is assumed to be zero for the buckling calculation.
Stress Analysis of Safkeg HS Containment Vessel
Report No: L20008/1/R1 Revision: 0B
27/09/2012 Page 31 of 95
4.10 NCT 10: Free drop on corner (cold)
In this case, the package is subject to an ambient temperature of -29°C in still air, zero solar heating and with zero decay heat. This case assumed that the external pressure was 100 kPa. The internal pressure was 0 kPa absolute, so the internal gauge pressure applied to the model was -100 kPa. A body force was applied to the model which was equivalent to an acceleration of 376g axially and 590g radially, giving a resultant acceleration of 700g. This was assumed to be the load due to an impact on the side from a height of 1.2 metres. The cork impact limiter was included in this model.
4.10.1 Stress Calculations
Figure 19 shows the displacements for this case, magnified by a factor of 5. The inner part of the body and the contents have rotated clockwise slightly. Figure 20 shows the stress intensity for this case. The upper limit on the contour plot is the allowable value for the membrane stress, which was exceeded in several locations.
4.10.2 Comparison with Allowable Stresses
The stresses in the containment vessel were evaluated at the locations shown in Figure 5. Stress linearization at these locations was carried out using a post-processing option in Abaqus. The stresses were then compared with the allowable stresses given in Table 2-4. A summary of the evaluation is given in Table 4-32. Locations with a name ending “-180” are on the opposite side of the vessel to those shown in Figure 5, i.e. they are on the side of the vessel closest to the impact with the cork impact limiter. The highlighted values show where the stresses exceeded the allowable stress. The stresses in the bolts are summarised in Table 4-33. The bolts satisfy the requirements of Reg. Guide 7.6 as all of the design margins were above zero. The buckling evaluation is summarised in Table 4-34. The design margin was above zero hence the containment vessel satisfies the requirements of Reg. Guide 7.6 for buckling.
Stress Analysis of Safkeg HS Containment Vessel
Report No: L20008/1/R1 Revision: 0B
27/09/2012 Page 32 of 95
Table 4-32: Drop on corner 1.2m (cold): Containment Vessel Stress Summary Stress type Maximum
Table 4-33: Drop on corner from 1.2m (cold): Bolt Stress Summary Stress type Maximum stress
(MPa) Allowable stress intensity (MPa)
Minimum design margin
Average shear 11.3 289 24.6 Average stress 135 482 2.56
Max. stress 192 723 2.76
Table 4-34: Drop on side from 1.2m (cold): Buckling Evaluation Stress component Stress (MPa) Design Margin
Axial compression 0 1703
Hoop compression 0 In-plane shear 0.12
4.11 NCT 11: Free drop on side (hot)
4.11.1 Summary of Pressures and Temperatures
In this case, the package is subject to an ambient temperature of 38°C in still air, with solar heating and with maximum decay heat. A thermal analysis has shown that a bounding condition for the containment vessel was at a uniform temperature of 158°C.
Stress Analysis of Safkeg HS Containment Vessel
Report No: L20008/1/R1 Revision: 0B
27/09/2012 Page 33 of 95
This case assumed that the external pressure was 100 kPa. The internal pressure was 800 kPa absolute, so the internal gauge pressure applied to the model was 700 kPa. A body force was applied to the model which was equivalent to an acceleration of 294g. This was the measured load due to an impact on the side from a height of 1.2 metres. The cork impact limiter was included in this model.
4.11.2 Stress Calculations
Figure 21 shows the stress intensity for this case. The upper limit on the contour plot is the allowable value for the membrane stress, which was exceeded in several locations. The high stresses on the outer part of the body are not of any concern as they do not form part of the containment boundary. The inner part of the body rotates clockwise causing high stresses at the top of this part.
4.11.3 Comparison with Allowable Stresses
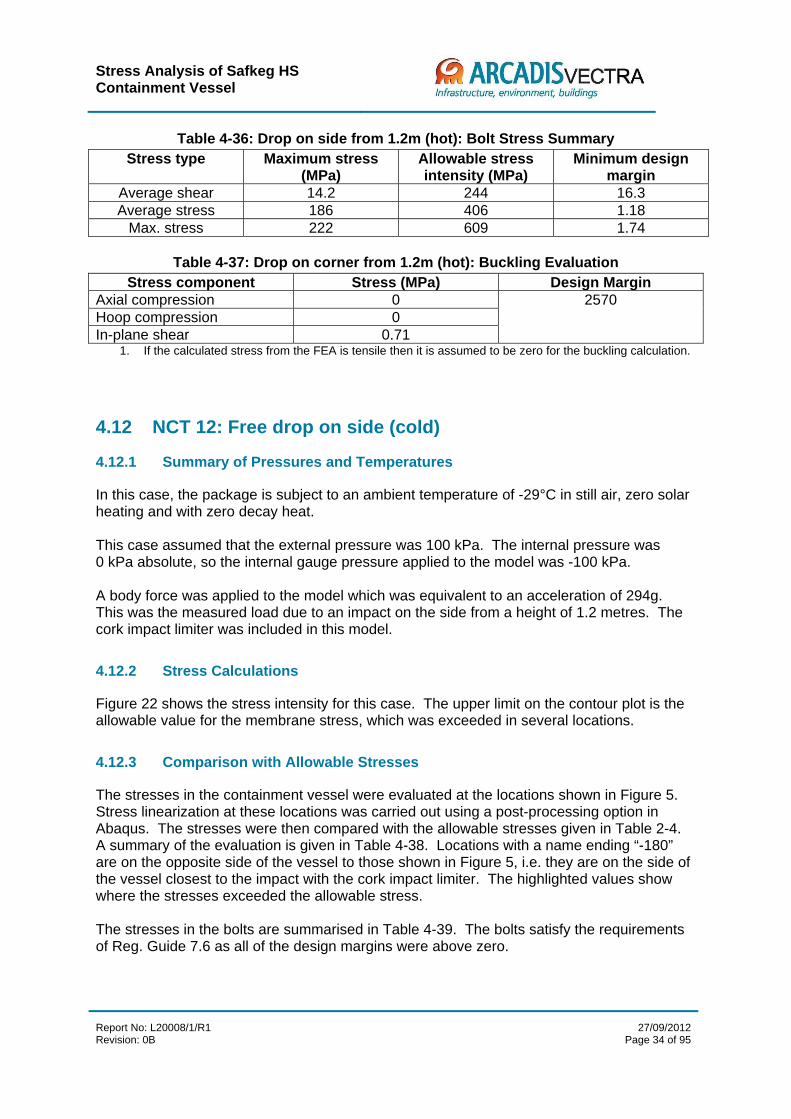
The stresses in the containment vessel were evaluated at the locations shown in Figure 5. Stress linearization at these locations was carried out using a post-processing option in Abaqus. The stresses were then compared with the allowable stresses given in Table 2-4. A summary of the evaluation is given in Table 4-35. Locations with a name ending “-180” are on the opposite side of the vessel to those shown in Figure 5, i.e. they are on the side of the vessel closest to the impact with the cork impact limiter. The highlighted values show where the stresses exceeded the allowable stress. The stresses in the bolts are summarised in Table 4-36. The bolts satisfy the requirements of Reg. Guide 7.6 as all of the design margins were above zero. The buckling evaluation is summarised in Table 4-37. The containment vessel satisfies the requirements of Reg. Guide 7.6 for buckling.
Table 4-35: Drop on side from 1.2m (hot): Containment Vessel Stress Summary Stress type Maximum
Table 4-36: Drop on side from 1.2m (hot): Bolt Stress Summary Stress type Maximum stress
(MPa) Allowable stress intensity (MPa)
Minimum design margin
Average shear 14.2 244 16.3 Average stress 186 406 1.18
Max. stress 222 609 1.74
Table 4-37: Drop on corner from 1.2m (hot): Buckling Evaluation Stress component Stress (MPa) Design Margin
Axial compression 0 2570
Hoop compression 0 In-plane shear 0.71
1. If the calculated stress from the FEA is tensile then it is assumed to be zero for the buckling calculation.
4.12 NCT 12: Free drop on side (cold)
4.12.1 Summary of Pressures and Temperatures
In this case, the package is subject to an ambient temperature of -29°C in still air, zero solar heating and with zero decay heat. This case assumed that the external pressure was 100 kPa. The internal pressure was 0 kPa absolute, so the internal gauge pressure applied to the model was -100 kPa. A body force was applied to the model which was equivalent to an acceleration of 294g. This was the measured load due to an impact on the side from a height of 1.2 metres. The cork impact limiter was included in this model.
4.12.2 Stress Calculations
Figure 22 shows the stress intensity for this case. The upper limit on the contour plot is the allowable value for the membrane stress, which was exceeded in several locations.
4.12.3 Comparison with Allowable Stresses
The stresses in the containment vessel were evaluated at the locations shown in Figure 5. Stress linearization at these locations was carried out using a post-processing option in Abaqus. The stresses were then compared with the allowable stresses given in Table 2-4. A summary of the evaluation is given in Table 4-38. Locations with a name ending “-180” are on the opposite side of the vessel to those shown in Figure 5, i.e. they are on the side of the vessel closest to the impact with the cork impact limiter. The highlighted values show where the stresses exceeded the allowable stress. The stresses in the bolts are summarised in Table 4-39. The bolts satisfy the requirements of Reg. Guide 7.6 as all of the design margins were above zero.
Stress Analysis of Safkeg HS Containment Vessel
Report No: L20008/1/R1 Revision: 0B
27/09/2012 Page 35 of 95
Table 4-38: Drop on side 1.2m (cold): Containment Vessel Stress Summary Stress type Maximum
Table 4-39: Drop on side from 1.2m (cold): Bolt Stress Summary Stress type Maximum stress
(MPa) Allowable stress intensity (MPa)
Minimum design margin
Average shear 14.1 289 19.4 Average stress 150 482 2.22
Max. stress 203 723 2.51
Table 4-40: Drop on corner from 1.2m (hot): Buckling Evaluation Stress component Stress (MPa) Design Margin
Axial compression 0 7153
Hoop compression 0 In-plane shear 0.61
1. If the calculated stress from the FEA is tensile then it is assumed to be zero for the buckling calculation.
Stress Analysis of Safkeg HS Containment Vessel
Report No: L20008/1/R1 Revision: 0B
27/09/2012 Page 36 of 95
5.0 Hypothetical Accident Conditions
This section presents the structural evaluation of the package in accordance with Reg. Guides 7.6 and 7.8 [9, 8] when subject to the HAC tests specified in Reg. Guide 7.8. The package is evaluated for each HAC test individually based on the most unfavourable initial conditions.
5.1 HAC 1: Free drop on lid (hot)
5.1.1 Summary of Pressures and Temperatures
In this case, the package is subject to an ambient temperature of 38°C in still air, with solar heating and with maximum decay heat. A thermal analysis has shown that a bounding condition for the containment vessel was at a uniform temperature of 192°C. This case assumed that the external pressure was 100 kPa. The internal pressure was 800 kPa absolute, so the internal gauge pressure applied to the model was 700 kPa. A body force was applied to the model which was equivalent to an upward vertical acceleration of 458g. This was the measured load due to an impact on the lid from a height of 10.2 metres. The cork impact limiter was included in this model.
5.1.2 Stress Calculations
Figure 23 shows the stress intensity in the vessel for this case. The upper limit on the contour plot is the allowable value for the membrane stress
5.1.3 Comparison with Allowable Stresses
The stresses in the containment vessel were evaluated at the locations shown in Figure 5. Stress linearization at these locations was carried out using a post-processing option in Abaqus. The stresses were then compared with the allowable stresses given in Table 2-4. A summary of the evaluation is given in Table 5-1. The containment vessel satisfies the requirements of Reg. Guide 7.6 as all of the design margins were above zero. The stresses in the bolts are summarised in Table 5-2. The bolts satisfy the requirements of Reg. Guide 7.6 as all of the design margins were above zero. The buckling evaluation is summarised in Table 5-3. The containment vessel satisfies the requirements of Reg. Guide 7.6 for buckling.
Table 5-1: Drop on lid from 9m (hot): Containment Vessel Stress Summary Stress type Maximum
stress intensity (MPa)
Stress location Allowable stress intensity
(MPa)
Minimum design margin
Pm 26.1 C10 245 9.03 Pm + Pb 60.6 C10 367 5.47
Stress Analysis of Safkeg HS Containment Vessel
Report No: L20008/1/R1 Revision: 0B
27/09/2012 Page 37 of 95
Table 5-2: Drop on lid from 9m (hot): Bolt Stress Summary
Stress type Maximum stress (MPa)
Allowable stress intensity (MPa)
Minimum design margin
Average shear 15.9 361 21.7 Average stress 173 602 2.48
Table 5-3: Drop on lid from 9m (hot): Buckling Evaluation
1. If the calculated stress from the FEA is tensile then it is assumed to be zero for the buckling calculation.
5.2 HAC 2: Free drop on lid (cold)
5.2.1 Summary of Pressures and Temperatures
In this case, the package is subject to an ambient temperature of -29°C in still air, zero solar heating and with zero decay heat. This case assumed that the external pressure was 100 kPa. The internal pressure was 0 kPa absolute, so the internal gauge pressure applied to the model was -100 kPa. A body force was applied to the model which was equivalent to an upward vertical acceleration of 458g. This was the measured load due to an impact on the lid from a height of 10.2 metres. The cork impact limiter was included in this model.
5.2.2 Stress Calculation
Figure 24 shows the stress intensity for this case.
5.2.3 Comparison with Allowable Stresses
The stresses in the containment vessel were evaluated at the locations shown in Figure 5. Stress linearization at these locations was carried out using a post-processing option in Abaqus. The stresses were then compared with the allowable stresses given in Table 2-4. A summary of the evaluation is given in Table 5-4. The containment vessel satisfies the requirements of Reg. Guide 7.6 as all of the design margins were above zero. The stresses in the bolts are summarised in Table 5-5. The bolts satisfy the requirements of Reg. Guide 7.6 as all of the design margins were above zero. The buckling evaluation is summarised in Table 5-6. The containment vessel satisfies the requirements of Reg. Guide 7.6 for buckling.
Stress Analysis of Safkeg HS Containment Vessel
Report No: L20008/1/R1 Revision: 0B
27/09/2012 Page 38 of 95
Table 5-4: Drop on lid from 9m (cold): Containment Vessel Stress Summary Stress type Maximum
stress intensity (MPa)
Stress location Allowable stress intensity
(MPa)
Minimum design margin
Pm 25.5 C10 331 9.82 Pm + Pb 53.3 C11 497 6.76
Table 5-5: Drop on lid from 9m (cold): Bolt Stress Summary Stress type Maximum stress
(MPa) Allowable stress intensity (MPa)
Minimum design margin
Average shear 7.32 361 48.3 Average stress 74.3 602 7.10
Table 5-6: Drop on lid from 9m (cold): Buckling Evaluation
In this case, the package is subject to an ambient temperature of 38°C in still air, with solar heating and with maximum decay heat. A thermal analysis has shown that a bounding condition for the containment vessel was at a uniform temperature of 192°C. This case assumed that the external pressure was 100 kPa. The internal pressure was 800 kPa absolute, so the internal gauge pressure applied to the model was 700 kPa. A body force was applied to the model which was equivalent to an acceleration of 338g axially and 228g radially, which gives a resultant acceleration of 408g. This was the measured load due to an impact on the top corner from a height of 10.2 metres. The cork impact limiter was included in this model.
5.3.2 Stress Calculations
Figure 25 shows the stresses for this case. The stress distribution is similar to that for case NCT9, but with a greater magnitude.
5.3.3 Comparison with Allowable Stresses
The stresses in the containment vessel were evaluated at the locations shown in Figure 5. Stress linearization at these locations was carried out using a post-processing option in Abaqus. The stresses were then compared with the allowable stresses given in Table 2-4.
Stress Analysis of Safkeg HS Containment Vessel
Report No: L20008/1/R1 Revision: 0B
27/09/2012 Page 39 of 95
A summary of the evaluation is given in Table 5-7. Locations with a name ending “-180” are on the opposite side of the vessel to those shown in Figure 5, i.e. they are on the side of the vessel closest to the impact with the cork impact limiter. The highlighted values show where the stresses exceeded the allowable stress. The stresses in the bolts are summarised in Table 5-8. The bolts satisfy the requirements of Reg. Guide 7.6 as all of the design margins were above zero. The buckling evaluation is summarised in Table 5-9. The containment vessel satisfies the requirements of Reg. Guide 7.6 for buckling.
Table 5-7: Drop on top corner from 9m (hot): Containment Vessel Stress Summary Stress type Maximum
1. If the calculated stress from the FEA is tensile then it is assumed to be zero for the buckling calculation.
5.4 HAC 4: Free drop on corner (cold)
In this case, the package is subject to an ambient temperature of -29°C in still air, zero solar heating and with zero decay heat. This case assumed that the external pressure was 100 kPa. The internal pressure was 0 kPa absolute, so the internal gauge pressure applied to the model was -100 kPa. A body force was applied to the model which was equivalent to an acceleration of 338g axially and 228g radially, which gives a resultant acceleration of 408g. This was the measured load due to an impact on the top corner from a height of 10.2 metres. The cork impact limiter was included in this model.
Stress Analysis of Safkeg HS Containment Vessel
Report No: L20008/1/R1 Revision: 0B
27/09/2012 Page 40 of 95
5.4.1 Stress Calculation
Figure 26 shows the stress intensity for this case.
5.4.2 Comparison with Allowable Stresses
The stresses in the containment vessel were evaluated at the locations shown in Figure 5. Stress linearization at these locations was carried out using a post-processing option in Abaqus. The stresses were then compared with the allowable stresses given in Table 2-4. A summary of the evaluation is given in Table 5-10. Locations with a name ending “-180” are on the opposite side of the vessel to those shown in Figure 5, i.e. they are on the side of the vessel closest to the impact with the cork impact limiter. The containment vessel satisfies the requirements of Reg. Guide 7.6 as all of the design margins were above zero. The stresses in the bolts are summarised in Table 5-11. The bolts satisfy the requirements of Reg. Guide 7.6 as all of the design margins were above zero. The buckling evaluation is summarised in Table 5-12. The containment vessel satisfies the requirements of Reg. Guide 7.6 for buckling. Table 5-10: Drop on top corner from 9m (cold): Containment Vessel Stress Summary
Stress type Maximum stress intensity
(MPa)
Stress location Allowable stress intensity
(MPa)
Minimum design margin
Pm 174 C6b-180 276 0.59 Pm + Pb 376 C6b 414 0.10
Table 5-11: Drop on top corner from 9m (cold): Bolt Stress Summary Stress type Maximum stress
(MPa) Allowable stress intensity (MPa)
Minimum design margin
Average shear 7.38 361 47.9 Average stress 83.9 602 6.18
Table 5-12: Drop on top corner from 9m (cold): Buckling Evaluation
1. If the calculated stress from the FEA is tensile then it is assumed to be zero for the buckling calculation.
5.5 HAC 5: Free drop on side (hot)
5.5.1 Summary of Pressures and Temperatures
In this case, the package is subject to an ambient temperature of 38°C in still air, with solar heating and with maximum decay heat. A thermal analysis has shown that a bounding condition for the containment vessel was at a uniform temperature of 192°C.
Stress Analysis of Safkeg HS Containment Vessel
Report No: L20008/1/R1 Revision: 0B
27/09/2012 Page 41 of 95
This case assumed that the external pressure was 100 kPa. The internal pressure was 800 kPa absolute, so the internal gauge pressure applied to the model was 700 kPa. A body force was applied to the model which was equivalent to an acceleration of 458g. This was the measured load due to an impact on the side from a height of 10.2 metres. The cork impact limiter was included in this model.
5.5.2 Stress Calculations
Figure 27 shows the stresses for this case.
5.5.3 Comparison with Allowable Stresses
The stresses in the containment vessel were evaluated at the locations shown in Figure 5. Stress linearization at these locations was carried out using a post-processing option in Abaqus. The stresses were then compared with the allowable stresses given in Table 2-4. A summary of the evaluation is given in Table 5-13. Locations with a name ending “-180” are on the opposite side of the vessel to those shown in Figure 5, i.e. they are on the side of the vessel closest to the impact with the cork impact limiter. The highlighted values show where the stresses exceeded the allowable stress. The stresses in the bolts are summarised in Table 5-14. The bolts satisfy the requirements of Reg. Guide 7.6 as all of the design margins were above zero. The buckling evaluation is summarised in Table 5-15. The containment vessel satisfies the requirements of Reg. Guide 7.6 for buckling.
Table 5-13: Drop on side from 9m (hot): Containment Vessel Stress Summary Stress type Maximum
stress intensity (MPa)
Stress location Allowable stress intensity
(MPa)
Minimum design margin
Pm 256 C4-180 245 0.02 Pm + Pb 457 C6b 367 -0.14
Table 5-14: Drop on side from 9m (hot): Bolt Stress Summary Stress type Maximum stress
(MPa) Allowable stress intensity (MPa)
Minimum design margin
Average shear 20.8 361 16.3 Average stress 236 602 1.55
Stress Analysis of Safkeg HS Containment Vessel
Report No: L20008/1/R1 Revision: 0B
27/09/2012 Page 42 of 95
Table 5-15: Drop on side from 9m (hot): Buckling Evaluation Stress component Stress (MPa) Design Margin
Axial compression 0 (1) 5131
Hoop compression 0 In-plane shear 0.75
1. If the calculated stress from the FEA is tensile then it is assumed to be zero for the buckling calculation.
5.6 HAC 6: Free drop on side (cold)
In this case, the package is subject to an ambient temperature of -29°C in still air, zero solar heating and with zero decay heat. This case assumed that the external pressure was 100 kPa. The internal pressure was 0 kPa absolute, so the internal gauge pressure applied to the model was -100 kPa. A body force was applied to the model which was equivalent to an acceleration of 458g. This was the measured load due to an impact on the side from a height of 10.2 metres. The cork impact limiter was included in this model.
5.6.1 Stress Calculation
Figure 28 shows the stress intensity for this case.
5.6.2 Comparison with Allowable Stresses
The stresses in the containment vessel were evaluated at the locations shown in Figure 5. Stress linearization at these locations was carried out using a post-processing option in Abaqus. The stresses were then compared with the allowable stresses given in Table 2-4. A summary of the evaluation is given in Table 5-16. Locations with a name ending “-180” are on the opposite side of the vessel to those shown in Figure 6, i.e. they are on the side of the vessel closest to the impact with the cork impact limiter. The containment vessel satisfies the requirements of Reg. Guide 7.6 as all of the design margins were above zero. The stresses in the bolts are summarised in Table 5-17. The bolts satisfy the requirements of Reg. Guide 7.6 as all of the design margins were above zero. The buckling evaluation is summarised in Table 5-18. The containment vessel satisfies the requirements of Reg. Guide 7.6 for buckling.
Table 5-16: Drop on side from 9m (cold): Containment Vessel Stress Summary Stress type Maximum
stress intensity (MPa)
Stress location Allowable stress intensity
(MPa)
Minimum design margin
Pm 189 C6b-180 276 0.46 Pm + Pb 394 C6b 414 0.05
Stress Analysis of Safkeg HS Containment Vessel
Report No: L20008/1/R1 Revision: 0B
27/09/2012 Page 43 of 95
Table 5-17: Drop on side from 9m (cold): Bolt Stress Summary Stress type Maximum stress
(MPa) Allowable stress intensity (MPa)
Minimum design margin
Average shear 21.5 361 15.8 Average stress 216 602 1.79
Table 5-18: Drop on side from 9m (cold): Buckling Evaluation
1. If the calculated stress from the FEA is tensile then it is assumed to be zero for the buckling calculation.
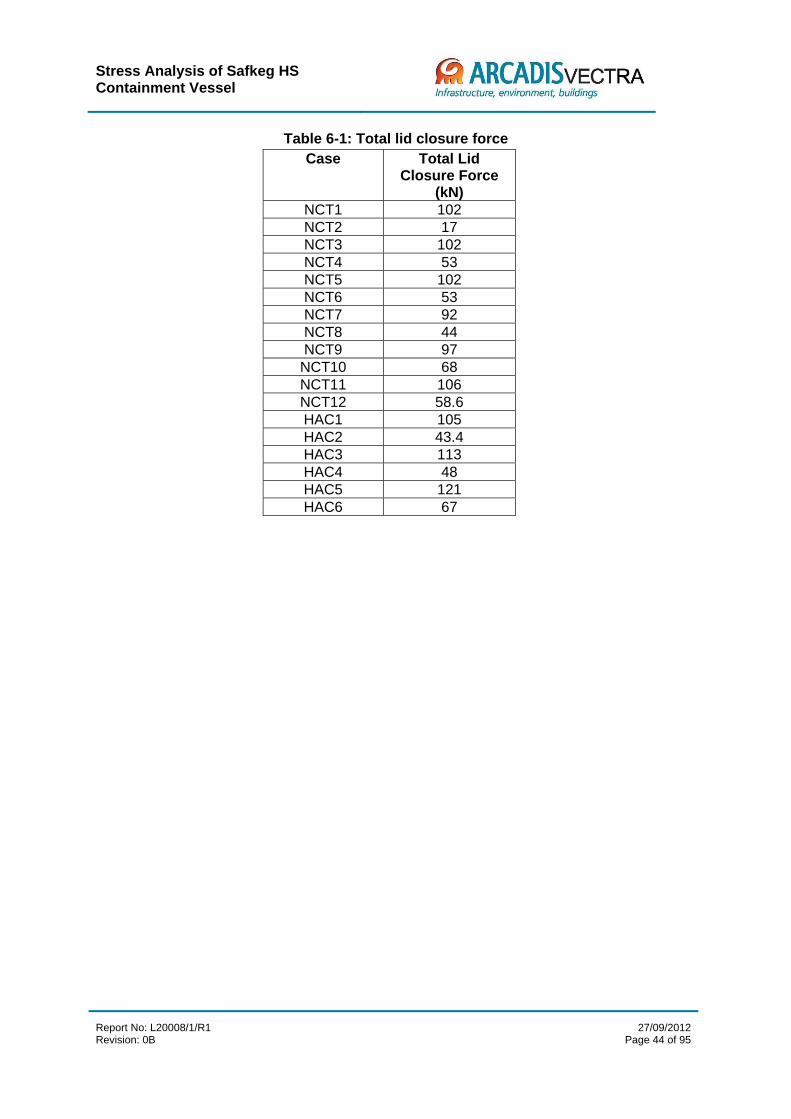
6.0 Lid Closure Forces
The force required to maintain compression of the O-rings is 9906 N (source: Croft). The total lid closure force (total axial force on all of the bolts) at the end of each analysis is given in Table 6-1. Therefore there is sufficient force in all cases to maintain compression in the O-rings and maintain the containment boundary. The friction coefficient on the bolts can vary by ±20% from value given in the calculation in Appendix B. This gives lower and upper bound values for the bolt tension of 6.99 kN and 9.68 kN respectively. In NUREG/CR-6007, the mean value of K for bolts lubricated with moly grease is 0.137. This gives a bolt tension of 7.30 kN. Using the upper and lower bound values of K (0.16 and 0.10), gives bolt tensions of 6.25 kN and 10.0 kN. These values are similar to those calculated using the method in Appendix D. The lower bound value of 6.25 kN is 23% less than the value used in the analysis. If all the forces reported in 2-7 were reduced by 23%, there would still be sufficient force to maintain O-ring compression.
The Safkeg HS containment vessel has been evaluated using finite element analysis for 12 Normal Conditions of Transport and 6 Hypothetical Accident Conditions. Assessments of the stresses were made against Regulatory Guide 7.6. The analyses have shown that the stresses in the containment vessel exceed the allowable values in US NRC Regulatory Guide 7.6 for a number of the load cases, specifically cases NCT9, NCT10, NCT11 and NCT12 as well as HAC3 and HAC5. For all load cases assessed, buckling and fatigue loads are below the acceptable limits.
7. “Methods for Impact Analysis of Shipping Containers”, NUREG/CR-3966, U.S. Nuclear Regulatory Commission, November 1987.
8. “Regulatory Guide 7.8, Load Combinations for the Structural Analysis of Shipping Casks for Radioactive Material”, Revision 1, U.S. Nuclear Regulatory Commission, March 1989.
9. “Regulatory Guide 7.6, Design Criteria for the Structural Analysis of Shipping Casks for Radioactive Material”, Revision 1, U.S. Nuclear Regulatory Commission, March 1978.
10. “American Society of Mechanical Engineers (ASME) Boiler and Pressure Vessel Code”, 2007.
11. Penton Publications, Materials Engineering Materials Selector 1990, December 1989.
12. Weakly, EA, Fuels Engineering Technical Handbook, UNI-M-61, April 1979.
Figurre 14: NCT7 Droop on lid (hot): Displacementss (x30)
27/09/201Page 60 of 9
12 95
SC
RR
Stress AnalysisContainment Ve
Report No: L20008/1/RRevision: 0
s of Safkeg HS essel
R1
Figgure 15: NCT7 DDrop on lid (hott): Stress intensity
27/09/201Page 61 of 9
12 95
SC
RR
Stress AnalysisContainment Ve
Report No: L20008/1/RRevision: 0
s of Safkeg HS essel
R1
Figure 16: NCT8 DDrop on lid (coldd): Stress intennsity
27/09/201Page 62 of 9
12 95
SC
RR
Stress AnalysisContainment Ve
Report No: L20008/1/RRevision: 0
s of Safkeg HS essel
R1
Figure 177: NCT9 Drop oon top corner (hhot): Displacemments (x2)
27/09/201Page 63 of 9
12 95
SC
RR
Stress AnalysisContainment Ve
Report No: L20008/1/RRevision: 0
s of Safkeg HS essel
R1
Figure 18: NCT9 Dropp on top corner (hot): Stress inntensity
27/09/201Page 64 of 9
12 95
SC
RR
Stress AnalysisContainment Ve
Report No: L20008/1/RRevision: 0
s of Safkeg HS essel
R1
Figure 19: NCT10 Drop oon top corner (ccold): Displacements (x5)
27/09/201Page 65 of 9
12 95
SC
RR
Stress AnalysisContainment Ve
Report No: L20008/1/RRevision: 0
s of Safkeg HS essel
R1
Figure 220: NCT10 Dropp on top cornerr (cold): Stress intensity
27/09/201Page 66 of 9
12 95
SC
RR
Stress AnalysisContainment Ve
Report No: L20008/1/RRevision: 0
s of Safkeg HS essel
R1
Figuure 21: NCT11 DDrop on side (hot): Stress inteensity
27/09/201Page 67 of 9
12 95
SC
RR
Stress AnalysisContainment Ve
Report No: L20008/1/RRevision: 0
s of Safkeg HS essel
R1
Figurre 22: NCT12 DDrop on side (coold): Stress inteensity
27/09/201Page 68 of 9
12 95
SC
RR
Stress AnalysisContainment Ve
Report No: L20008/1/RRevision: 0
s of Safkeg HS essel
R1
Figgure 23: HAC1 DDrop on lid (hot): Stress intensity
27/09/201Page 69 of 9
12 95
SC
RR
Stress AnalysisContainment Ve
Report No: L20008/1/RRevision: 0
s of Safkeg HS essel
R1
Figuure 24: HAC2 DDrop on lid (cold): Stress intennsity
27/09/201Page 70 of 9
12 95
SC
RR
Stress AnalysisContainment Ve
Report No: L20008/1/RRevision: 0
s of Safkeg HS essel
R1
Figure 25: HAC3 Dropp on top cornerr (hot): Stress inntensity
27/09/201Page 71 of 9
12 95
SC
RR
Stress AnalysisContainment Ve
Report No: L20008/1/RRevision: 0
s of Safkeg HS essel
R1
Figure 226: HAC4 Drop on top corner (cold): Stress iintensity
27/09/201Page 72 of 9
12 95
SC
RR
Stress AnalysisContainment Ve
Report No: L20008/1/RRevision: 0
s of Safkeg HS essel
R1
Figuure 27: HAC5 DDrop on side (hoot): Stress intennsity
27/09/201Page 73 of 9
12 95
SC
RR
Stress AnalysisContainment Ve
Report No: L20008/1/RRevision: 0
s of Safkeg HS essel
R1
Figuure 28: HAC6 Drrop on side (coold): Stress inteensity
27/09/201Page 74 of 9
12 95
Stress Analysis of Safkeg HS Containment Vessel
Report No: L20008/1/R1 Revision: 0
27/09/2012 Page 75 of 95
Stress AnSafkeg HSVessel
Report No: L20Revision: 0
nalysis of S Containm
0008/1/R1
ment
Mesh Appe
Sensi
endix itivity
A Analy
2Pag
ysis
27/09/2012 ge 76 of 95
Stress Analysis of Safkeg HS Containment Vessel
Report No: L20008/1/R1 Revision: 0
13/09/2011 Page 77 of 95
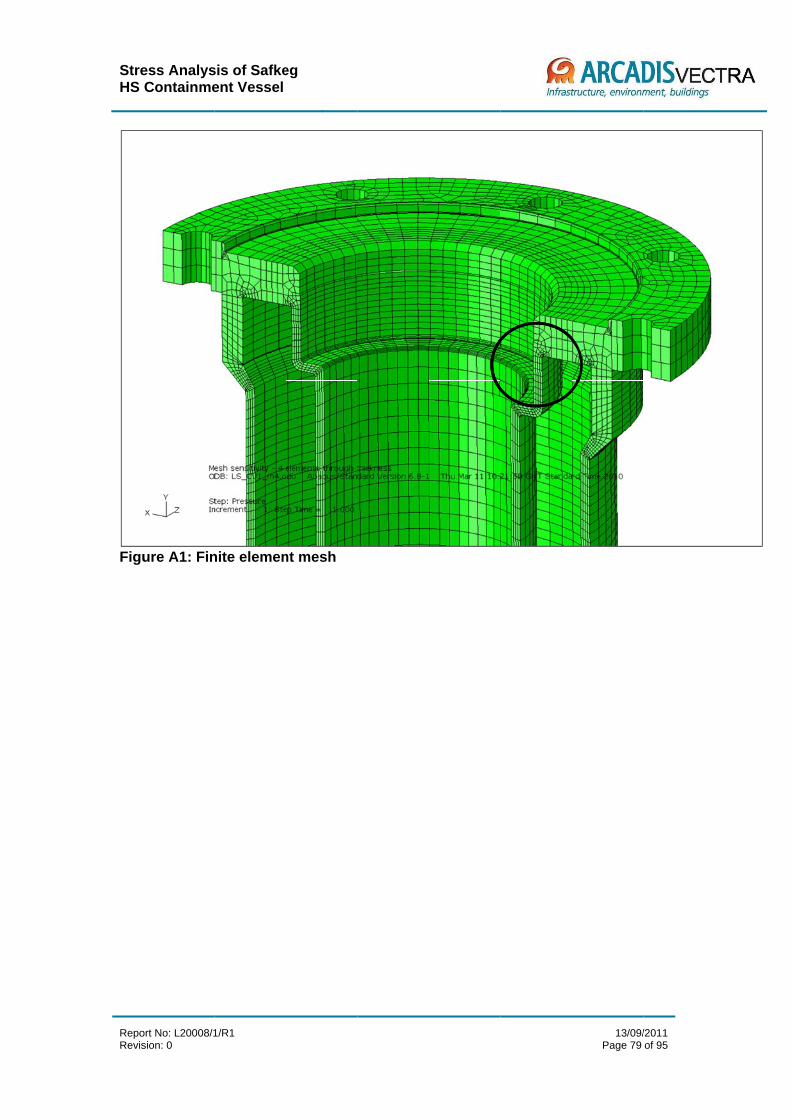
A-1 Introduction A mesh sensitivity study has been carried out on a containment vessel similar, but not identical to the Safkeg HS containment vessel. The region circled in Figure A1, at the join between the body and the top flange, was the part of the model where the mesh was refined. The number of elements through the thickness of the body was increased from 4, as used in the original study, to 6, 8, 10, 12, 14 and 16. In all cases, the number of elements along the length of this section was adjusted so that the aspect ratio of the elements (length of one side of an element to the other side of the element) was maintained. All of these cases used first-order elements, as used in the original study. Two additional cases used second-order elements. Both of these cases used 16 elements through the wall thickness, but one used 4 elements around the fillet radius, as used in all the other cases, and one used 8 elements around the radius. The results using second order elements are considered to be closest to the actual stresses, however for reasons of computation power and model size, it is not always possible to use these elements because the contact algorithms, which were required in the main study, are not efficient with second order elements, hence the need, as in this case, for the use of fewer, single-order elements.
A-2 Results Figure A2 shows the stress profile, from the inside to the outside, at the junction between the body and top flange for all the cases. The stress shown is Tresca, which is the same as the stress intensity as required by NRC Regulatory Guide 7.6. The model with 4 elements through the thickness produces a profile which, whilst a fair representation of the actual stress profile, does under predict the peak stresses; however, the results are sufficient to give a good approximation to the deformations of the container. The accuracy of prediction of the peak stresses improves with a greater number of elements through the thickness, as might be expected. As stated above, the results using second order elements should give an accurate profile. The case with 8 elements around the radius had a slightly smaller peak stress and the case with 4 elements around the radius. For the assessment of the containment vessel, membrane, bending and peak stresses were calculated and compared with allowable values. The membrane, bending and peak stresses for this study are given in Table A1 and figures C3-C5. The variation in membrane stress was only 6%, the variation in bending stress was 14% and the variation in peak stress was 92%. If we take the final case, second order elements and mesh refinement around the radius, as being closest to the correct answer, the difference between this and the first case with 8 elements (as used in the main study of the Safkeg HS) was -3%, 2% and 31% for the membrane, bending and peak stress respectively. For the HAC cases, the peak stress is not assessed. For the NCT cases, the peak stress result is more important as it affects the fatigue life. The influence of peak stress vs profile is not straightforward, due to the restraining influence of the lower stressed material within the bulk of the section.
Stress Analysis of Safkeg HS Containment Vessel
Report No: L20008/1/R1 Revision: 0
13/09/2011 Page 78 of 95
Table A1: Stress linearization
Mesh
Membrane stress (MPa)
Bending stress (MPa)
Peak stress (MPa)
4 elements 7.4 16.5 17.0 6 elements 7.3 17.0 19.0 8 elements 7.3 17.9 22.0 10 elements 7.3 17.9 23.0 12 elements 7.3 18.1 23.8 14 elements 7.4 18.6 25.5 16 elements 7.5 18.8 27.4 16 elements, 2nd order 7.1 18.4 32.7 16 elements, 2nd order, 8 elements around radius 7.1 18.3 31.7
A-3 Conclusions
1. The mesh used in the original study was adequate for the HAC cases as it produced reasonable estimates of the membrane and bending stresses.
2. The mesh used in the original study was less able to accurately capture peak stresses. A very refined mesh, using second-order elements is required to accurately capture the peak stresses at some locations. However, for reasons of model size and computational capacity, it is not generally practical to use this level of refinement in the main study.
StreHS
RepoRevis
Figu
ess AnalysContainme
ort No: L20008/1sion: 0
ure A1: Fin
sis of Safkeent Vessel
1/R1
nite elemen
eg
nt mesh
13/09/Page 79
/2011 of 95
StreHS
RepoRevis
Figu
ess AnalysContainme
ort No: L20008/1sion: 0
ure A2: Str
sis of Safkeent Vessel
1/R1
ress profile
eg
e through wwall
13/09/Page 80
/2011 of 95
Stress Analysis of Safkeg HS Containment Vessel
Report No: L20008/1/R1 Revision: 0
13/09/2011 Page 81 of 95
Figure A3: Membrane stress
Figure A4: Bending stress
Mesh sensitivity - membrane stress
0
1
2
3
4
5
6
7
8
4 elements 6 elements 8 elements 10 elements 12 elements 14 elements 16 elements 16 elements,2nd order
16 elements,2nd order, 8
elements aroundradius
Mesh
Mem
bra
ne
stre
ss (
MP
a)
Mesh sensitiviy - bending stress
0
2
4
6
8
10
12
14
16
18
20
4 elements 6 elements 8 elements 10 elements 12 elements 14 elements 16 elements 16 elements,2nd order
16 elements,2nd order, 8
elementsaround radius
Mesh
Ben
din
g s
tres
s (M
Pa)
Stress Analysis of Safkeg HS Containment Vessel
Report No: L20008/1/R1 Revision: 0
13/09/2011 Page 82 of 95
Figure A5: Outside peak stress
Mesh sensitivity - peak stress
0
5
10
15
20
25
30
35
4 elements 6 elements 8 elements 10 elements 12 elements 14 elements 16 elements 16 elements,2nd order
Stress Analysis of Safkeg HS Containment VesselL20008/1Buckling calculation for case NCT2NCT2-C1A
Calc by GD Jones Date 07/08/11
Checked by Date
Introduction This calculation evaulates the buckling resistance of a cylindrical shell using the procedures givenASME Boiler and Pressurve Vessel Code 2007: Code Case N-284-2
Material Properties
Assessment temperature T 40 °C
Young's modulus E 198 GPa
Yield stress σy 172 MPa
Geomerty
Shell mean radius R 35.25 mm
Shell thickness t 4.7 mm
Distance between lines of support in meridional direction
lϕ 152.4 mm
Cross-sectional area of meridional stiffeners
Aϕ 0 m2
lθ 2 π RDistance between lines of support in circumferentialdirection
Cross-section area of circumferential stiffeners
Aθ 0 m2
StreHS
RepoRevis
ess AnalysContainme
ort No: L20008/1sion: 0
sis of Safkeent Vessel
1/R1
eg
13/09/Page 88
/2011 of 95
Stress Analysis of Safkeg HS Containment Vessel
Report No: L20008/1/R1 Revision: 0
13/09/2011 Page 89 of 95
Capacity Reduction FactorsCylindrical shell
(a) Axial compression
L ftR
t
M
l
R t
L 00.207 ft 600if
a1 1.52 0.473 logR
t
a2300 y
E0.033
L 0min a1 a2
ft 600if
L 10.627 M 0.5if
L 10.837 0.14 M M 1.5 M 1.73if
L 1
0.826
M0.6
M 1.73 M 10if
L 10.207 M 10if
max L return
L 0.2
(b) Hoop compression
L 0.8
(c) Shear
L ftR
t
L 0.8 ft 250if
.L 1.323 0.218 log ft otherwise
Lreturn
L 0.8
Stress Analysis of Safkeg HS Containment Vessel
Report No: L20008/1/R1 Revision: 0
13/09/2011 Page 90 of 95
Local Buckling
Cylindrical shells - unstiffened
Theoretical elastic instability stresses
(a) Axial compression
eL M
l
R t
C 0.630 M 1.5if
C0.904
M2
0.1013 M2 M 1.5 M 1.73if
C 0.605 M 1.73if
C E t
R
eL 15972 MPa
(b) External pressure
(1) No end pressure (K=0)
reL M
l
R t
Cr 1.161 M 1.5if
Cr2.41
M1.49
0.338 M 1.5 M 3.0if
Cr0.92
M 1.17 M 3.0 M 1.65
R
tif
Cr 0.275t
R
2.1
M4
R
t
3
M 1.65R
tif
Cr E t
R
reL 2339 MPa
Stress Analysis of Safkeg HS Containment Vessel
Report No: L20008/1/R1 Revision: 0
13/09/2011 Page 91 of 95
(2) End pressure included (K=0.5)
heL M
l
R t
Cr 0.988 M 1.5if
Cr1.08
M1.07
0.45 M 1.5 M 3.5if
Cr0.92
M 0.636 M 3.5 M 1.65
R
tif
Cr 0.275t
R
2.1
M4
R
t
3
M 1.65R
tif
Cr E t
R
heL 2225 MPa
(c) Shear
eL M
l
R t
C 2.227 M 1.5if
C4.82
M2
1 0.0239 M3 0.5
M 1.5 M 26if
C0.746
M
M 26 8.69R
tif
C 0.253t
R
0.5
M 8.69R
tif
C E t
R
eL 5866 MPa
Stress Analysis of Safkeg HS Containment Vessel
Report No: L20008/1/R1 Revision: 0
13/09/2011 Page 92 of 95
Plasticity Reduction Factors
(a) Axial compression
L eL
y
1.0 0.55if
0.45
0.18
0.55 1.6if
1.31
1 1.15 1.6 6.25if
1
6.25if
0.0
(b) Hoop compression
eL max reL heL
L eL
y
1.0 0.67if
2.53
1 2.29 0.67 4.2if
1
4.2if
0.1
(c) Shear
L eL
y
1.0 0.48if
0.43
0.48 1.7if
0.6
1.7if
0.0
Stress Analysis of Safkeg HS Containment Vessel
Report No: L20008/1/R1 Revision: 0
13/09/2011 Page 93 of 95
Allowable stresses
Elastic Buckling
Axial compression alone xaL eL
FS xa 1818 MPa
Hydrostatic external pressure haL heL
FS ha 890 MPa
Radial external pressure raL reL
FS ra 936 MPa
In-plane shear alone aL eL
FS a 2346 MPa
Inelastic Buckling
Axial compression alone xc xa xc 86.0 MPa
Radial external pressure rc ra rc 86.0 MPa
In-plane shear alone c a c 51.6 MPa
Stress Analysis of Safkeg HS Containment Vessel
Report No: L20008/1/R1 Revision: 0
13/09/2011 Page 94 of 95
Assessment
Elastic buckling of cylindrical shell
design_margine K
t
t
DM ha
1 haif
DM
ra 2 ra
ha1
1
1 otherwise
DMreturn
0 K 0.5if
DM
0.5 hat
t
1 0.5 hat
tif
DM
0.5 hat
t
xa 0.5 hat
t
2
1
1 otherwise
DMreturn
0 K 0.5if
DM
xa
a
2
1
1
DMreturn
0if
DM
ra
a
2
1
1
DMreturn
0if
Ks 1
ra
2
DM ha
1 haif
DM
Ks ra 2 Ks ra
Ks ha1
1
1 otherwise
DMreturn
K 0.5if
DM
0.5 Ks hat
t
1 0.5 Ks hat
tif
DM
0.5 Ks hat
t
Ks xa 0.5 Ks hat
t
2
1
1 otherwise
DMreturn
K 0.5if
design_margine 1307.74
Stress Analysis of Safkeg HS Containment Vessel
Report No: L20008/1/R1 Revision: 0
13/09/2011 Page 95 of 95
Inelastic buckling of cylindrical shell
design_marginc
DM1 xc
1
DM2 rc
1
DM min DM1 DM2( )
DMreturn
0if
DM1
xc
c
2
1
1
DM2
rc
c
2
1
1
DM min DM1 DM2( )
DMreturn
otherwise
design_marginc 125.47
Conclusion
Take the minimum of elastic and inelastic design margins