22
•

Loughborough UniversityInstitutional Repository
Stress managementstandards: a warningindicator for employee
health
This item was submitted to Loughborough University's Institutional Repositoryby the/an author.
Citation: KAZI, A. and HASLAM, C.O., 2013. Stress management standards:a warning indicator for employee health. Occupational Medicine, 63 (5), pp.335-340
Additional Information:
• This is a pre-copyedited, author-produced PDF of an article accepted forpublication in Occupational Medicine following peer review. The versionof record is available online at: http://dx.doi.org/10.1093/occmed/kqt052
Metadata Record: https://dspace.lboro.ac.uk/2134/19390
Version: Accepted for publication
Publisher: c© Oxford University Press
Rights: This work is made available according to the conditions of the Cre-ative Commons Attribution-NonCommercial-NoDerivatives 4.0 International(CC BY-NC-ND 4.0) licence. Full details of this licence are available at:https://creativecommons.org/licenses/by-nc-nd/4.0/
Please cite the published version.

1
Stress Management Standards: a warning indicator for employee health and attitudes
Mr Aadil Kazi, MSc, and Professor Cheryl Haslam PhD
Work and Health Research Centre, School of Sport, Exercise and Health Sciences,
Loughborough University, Leicestershire, LE11 3TU, UK
Correspondence to: Aadil Kazi
Work and Health Research Centre, School of Sport, Exercise and Health Sciences,
Loughborough University, Leicestershire, LE11 3TU, UK
Tel: +44 (0) 1509 228484; e-mail: [email protected]

2
Acknowledgements
The authors are grateful to Neil Budworth, Louise Boston and Deborah McGrath who
provided the support and resources to conduct this research. We would also like to thank all
of the employees in the organisation who contributed so generously to this study.

3
Stress Management Standards: a warning indicator for employee health and attitudes
ABSTRACT
Background: Psychological stress is a major cause of lost working days in the UK. The
Health and Safety Executive have developed Management Standards (MS) to help
organisations to assess work-related stress.
Aims: The aim of this study was to investigate the relationships between the MS Indicator
Tool and employee health, job attitudes, work performance and environmental outcomes.
Methods: The first phase involved a survey employing the MS Indicator Tool, GHQ-12, job
attitudes, work performance and environmental measures. Three hundred and four call
centre employees from a large utility company responded. The second phase comprised six
focus groups to investigate what employees believed contributed to their perceived stress.
Results: Significant negative correlations were found between GHQ-12 and two MS
dimensions; demands (Rho = -0.211, p = 0.000) and relationships (Rho = -0.134, p = 0.02).
Other dimensions showed no significant relationship with GHQ-12. Higher levels of stress
were associated with reduced job performance, job motivation and increased intention to quit
but low stress levels were associated with reduced job satisfaction. Lack of management
support, recognition and development opportunities were identified as sources of stress.
Conclusion: The findings support the utility of the MS as a measure of employee attitudes
and performance.
Abstract word count: 200
Key words: Stress, management standards, occupational health, risk assessment

4
Key Points
• The results demonstrated that the Management Standards Indicator Tool dimensions of
job demands and work relationships were significantly related to the General Health
Questionnaire 12-item version.
• Employers may also be able to use the Management Standards as an indicator of
employee attitudes (satisfaction, intention to quit, motivation and performance).
• Implementing supervisor support roles in contact-centres may improve employee
assistance and provide recognition and promotion opportunities that could reduce staff
turnover.

5
INTRODUCTION
A review of the health of Britain’s working population reported that 175 million days were lost
to illness in 2006 (1). Stress is now the most common reason for sickness absence, with the
average length of stress related sick-leave being 22.6 days (2). In 2004, the UK Health and
Safety Executive (HSE) launched the Management Standards (MS) which offers a step-by-
step approach to the assessment and management of the causes of work-related stress (3).
The MS define the characteristics and culture of an organisation where work-related stress is
being managed effectively and provide a benchmark by which an organisation can measure
their performance. The MS have developed from in-depth research and include seven work
areas which cover the primary sources of stressors at work: Demands, Control, Manager’s
support, Peer support, Relationships, Role and Change (3–5).
A Management Standards (MS) Indicator Tool, a 35-item self-report questionnaire
instrument has been developed to identify potential risk ‘hot spots’ within the seven key work
areas. Whilst the MS Indicator Tool was originally tested as a multidimensional measure of
work-related stress (4), research has found it to be a robust instrument that could be used to
calculate an overall uni-dimensional work-related stress score (6). The tool was designed
and validated as an organisational level risk assessment. However, it seems organisations
can tailor the approach to suit company processes. For example, the tool can be applied to
individual risk assessments, return to work interviews, or included in employee opinion
surveys.
Research has shown the long-term effects of psychological stress can result in negative
psychological, behavioural and physical health effects (7). For that reason, as a reliable
stress risk assessment, it would seem appropriate to assume that the MS Indicator Tool
results should correlate with existing measures of employee health outcomes, job attitudes
and work performance. The present study explored the relationships between the MS
Indicator Tool and other measures of employee health, job attitudes, work performance and
6
the physical environment. The research also employed a qualitative phase to gain further
information on the causes of work-related stress and possible interventions.
METHODS
The research was conducted in a UK customer service contact-centre of a large energy
supplier. Phase 1 of the study involved an employee survey and Phase 2 comprised a
series of focus groups to explore employee perceptions of the sources of work-related
stress. Recruitment of participants for phase 1 was completed over 2 weeks where the
researcher was given permission to attend and present in team meetings. During each
meeting, the research was explained and each employee was administered a paper copy of
the questionnaire. Employees were asked to return completed questionnaires to the
researcher onsite. At the end of the questionnaire, participants were invited to contact the
researcher (by email or at the end of the session) if they were interested in taking part in
phase 2 of the research. All focus groups were conducted on-site, during work time and
took approximately 60 minutes. The research received approval from Loughborough
University ethics committee.
Phase 1 - Questionnaire
The HSE’s Management Standards Indicator Tool, a 35-item self-report screening
questionnaire was used to assess the current organisational climate. The work areas and
number of questions include job demands (n=8), control (n=6), manager support (n=5), peer
support (n=4), relationships (n=4), role (n=5) and change (n=3). The questions asked
respondents to rate themselves on a 5-point Likert scale.
Self-reported psychological health outcomes were measured using the General Health
Questionnaire 12 (GHQ-12) (8), which assesses psychological well-being. The GHQ asks
respondents to report how they felt recently on a range of variables using a 4-point Likert
scale. Job attitudes were measured using scales that asked respondents to rate themselves
7
on a 7-point Likert scale. Job motivation was scored using a 6-item measure that assessed
the degree to which a person wants to work well in their job (9). Job satisfaction and
intention to quit were each assessed using a 3-item measure from the Michigan
Organizational Assessment Questionnaire (10).
Environmental stressors were measured using an 11-item survey that assessed physical job
characteristics by asking participants to rate environmental stressors on a 3-point Likert
scale. Eight questions were extracted from the USDAW Stress Questionnaire and 3 site-
specific questions were added by the researcher after investigating the workspace (11).
Job performance data was collected using a question from the WHO’s Health and Work
Performance Questionnaire (HPQ) (12). Participants were asked to rate their overall job
performance in the past four weeks using a 10-point Likert scale. Demographic data, job
title, tenure and job type were also assessed.
Phase 2 – Focus Groups
The research team developed a set of questions (n=22) for the focus groups that were
designed to evaluate the current processes within the business. Data was recorded and
transcribed with participants’ consent. The transcriptions were analysed by the sorting of
material into emergent themes (13). The six topics and number of questions comprised: job
roles, responsibilities and demands (n=2); skills needed and the training received (n=3);
management communication, support and abilities (n=5); monitoring and feedback (n=2);
recognition and scope for responsibilities/promotion (n=3); organisational policies and
support available to help deal with stress (n=7).
RESULTS
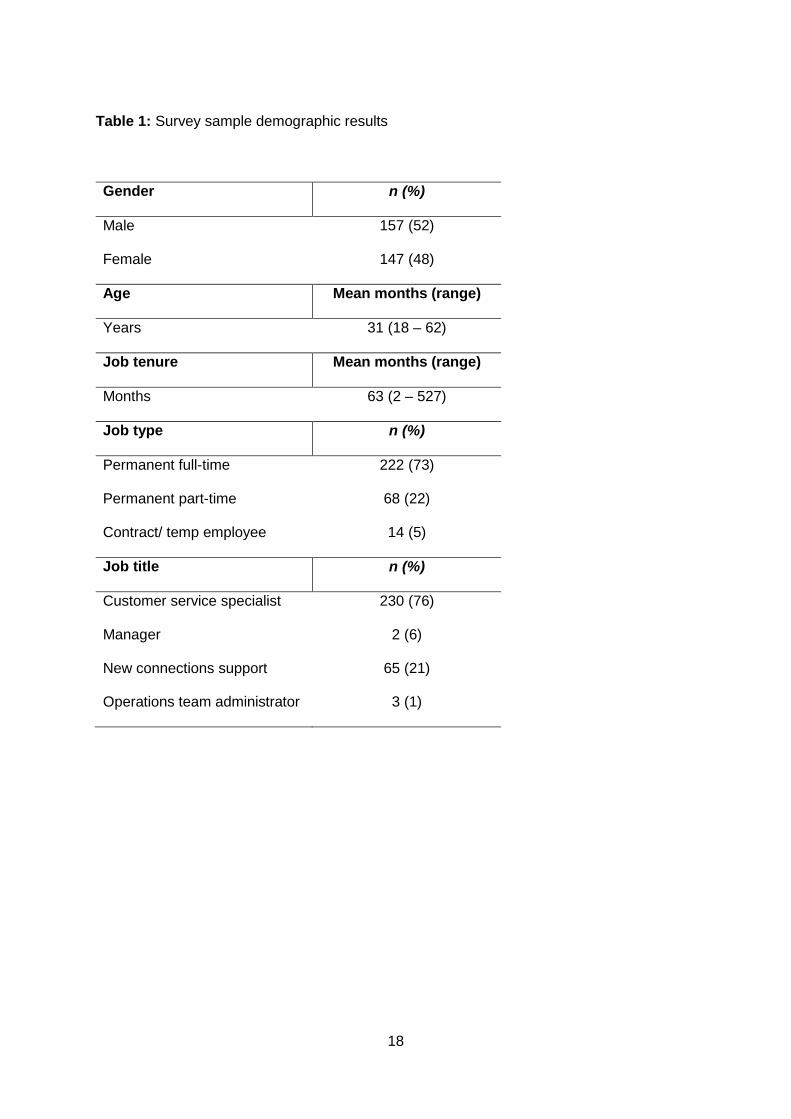
Table 1 summarises the demographic characteristics of the 304 survey participants.
(Table 1)
8
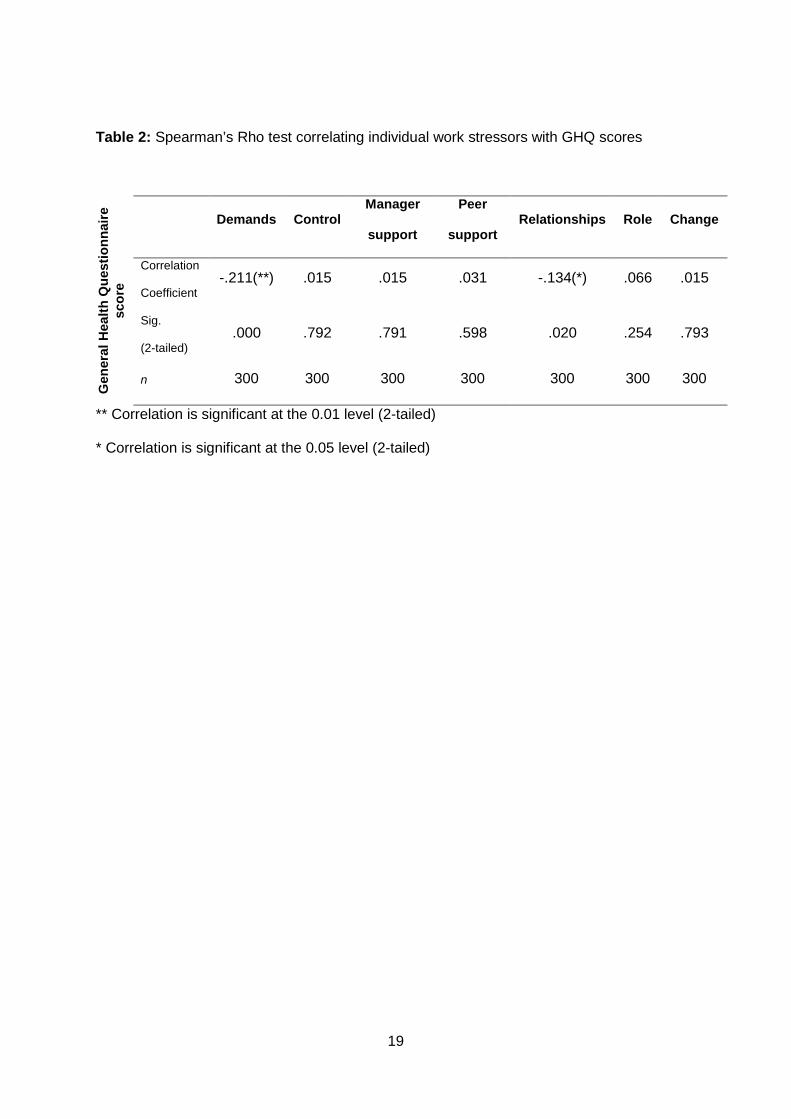
To assess the relationship between the MS and the GHQ-12, a Spearman’s Rho
correlational analysis was performed on the individual ranked scores for each work stressor
(Table 2). Results found scores on work demands and relationship to be significantly
negatively correlated with GHQ-12 outcomes. The Spearman’s Rho analysis results for the
other 5 areas of the MS found no significant correlation with the GHQ-12.
(Table 2)
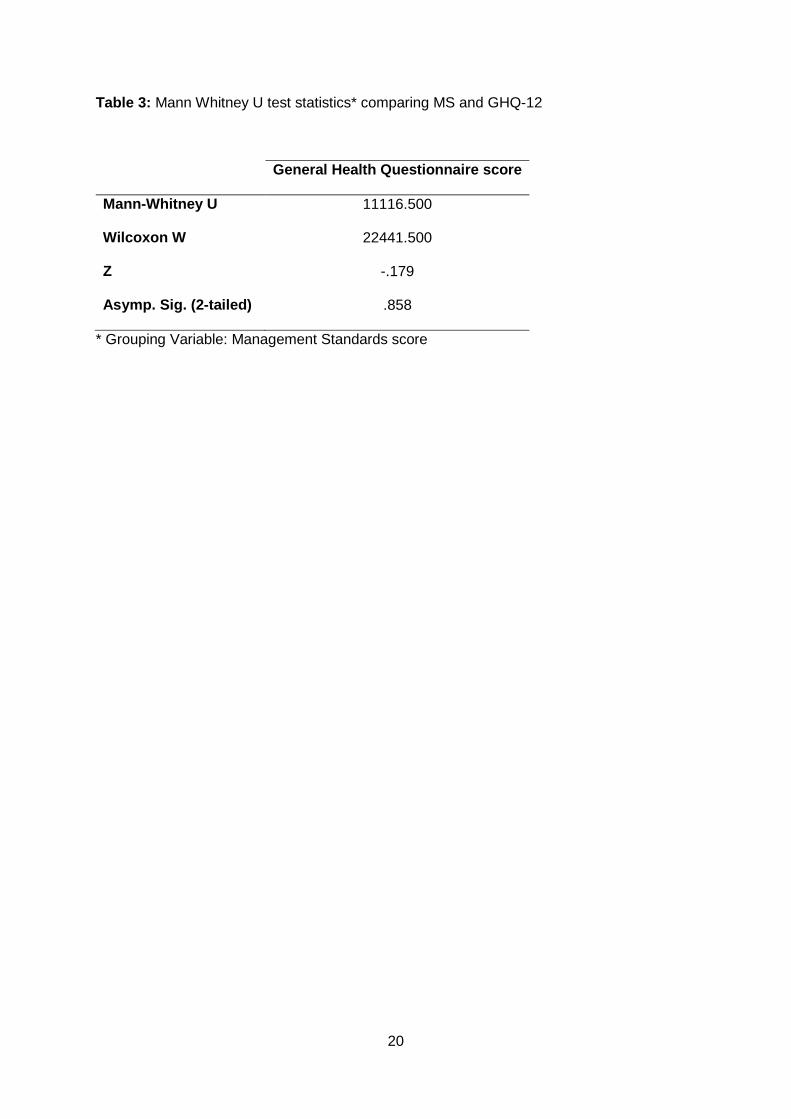
To investigate the relationship between the MS and GHQ-12 further, the MS results were
dichotomised into values for low stress levels and high stress levels. Table 3 shows the
result from a Wilcoxon Mann-Whitney U non-parametric test which shows no significant
relationship between overall MS and GHQ-12 scores.
(Table 3)
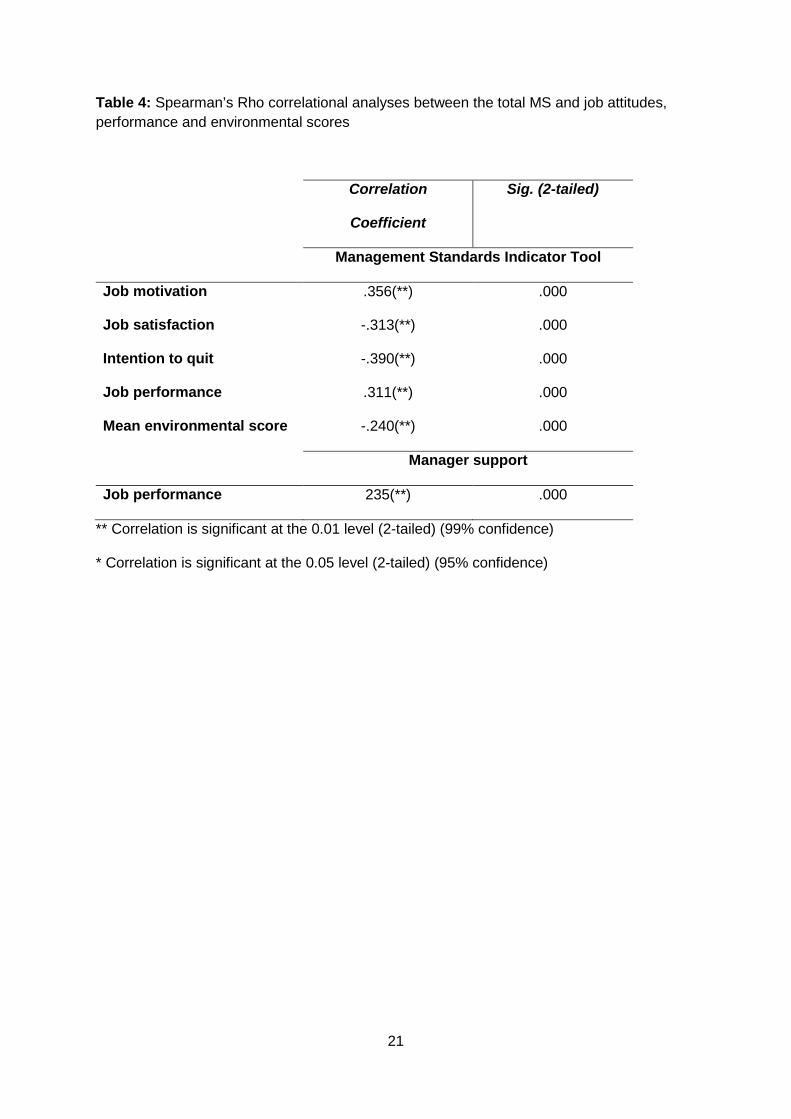
The relationship between the MS and job attitude scales were assessed using Spearman’s
Rho correlational analyses (Table 4). A significant positive correlation was identified
between the MS and job motivation. Moreover, a significant negative correlation was found
between the MS and intention to quit. However, a significant negative correlation was also
found between the MS and job satisfaction.
(Table 4)
Table 4 also shows Spearman’s Rho correlational analyses between job performance scores
and the MS. A significant positive correlation was found between the MS score and
employee job performance. When investigating this further, the work area of manager
support was found to be the factor that was significantly positively correlated with job
performance. The 3 most problematic environmental issues were computers/automated
9
systems breaking down, dirty or badly maintained areas of work and overcrowding/seating
arrangements. A single mean environmental score was calculated combining all 3 variables
so that they could be ranked and compared against the MS scores. The Bonferroni
Correction was applied to ensure the overall familywise significance criterion of 5% was
adjusted for. The individual significance criterion was adjusted to p<0.016. There was a
significant negative correlation between the MS and the combined environmental stressors.
Six focus group discussions were conducted to supplement the quantitative findings.
Employees that were in the same work-team were grouped together and focus group
participants were randomly selected from each team so that a representative sample of the
call centre was selected (n = 43). Five of the focus groups consisted of 4 male and 3 female
participants and 1 group consisted of 5 female and 3 male participants. The employees
were aged between 20 – 55 years.
Participants generally reported training to be of little value and as such identified this as their
first source of stress because they were not equipped with the correct skills to do the job.
Employees reported learning on the job as being most effective because their roles required
more practical training (e.g. how to action a bill) than background information (e.g. how
energy is delivered to the customer):
We did not really get hands on training … by being on the phones by myself I
would learn more. I personally feel that the training aspect of it was to give you
an insight into the work, which would have been fine if the system was set up so
that there was a lot of support (Female, 54).
One skill that employees reported as being vital, yet something the organisation did not train
them in was time management:
10
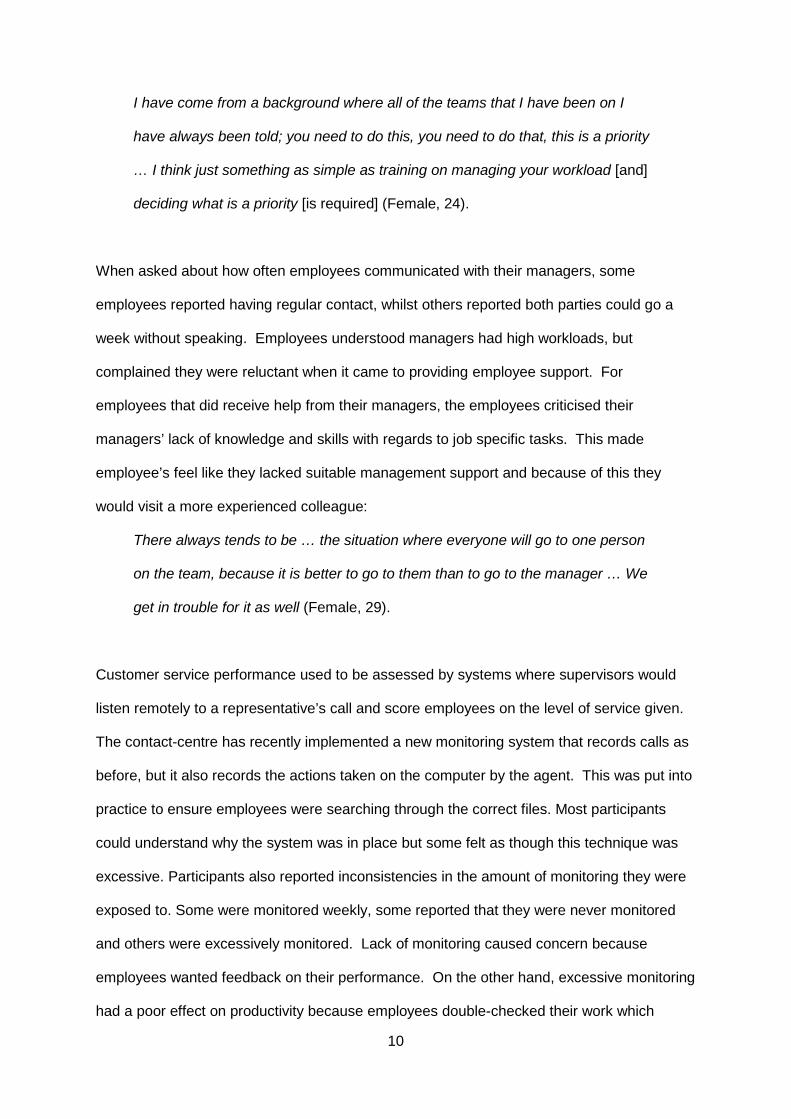
I have come from a background where all of the teams that I have been on I
have always been told; you need to do this, you need to do that, this is a priority
… I think just something as simple as training on managing your workload [and]
deciding what is a priority [is required] (Female, 24).
When asked about how often employees communicated with their managers, some
employees reported having regular contact, whilst others reported both parties could go a
week without speaking. Employees understood managers had high workloads, but
complained they were reluctant when it came to providing employee support. For
employees that did receive help from their managers, the employees criticised their
managers’ lack of knowledge and skills with regards to job specific tasks. This made
employee’s feel like they lacked suitable management support and because of this they
would visit a more experienced colleague:
There always tends to be … the situation where everyone will go to one person
on the team, because it is better to go to them than to go to the manager … We
get in trouble for it as well (Female, 29).
Customer service performance used to be assessed by systems where supervisors would
listen remotely to a representative’s call and score employees on the level of service given.
The contact-centre has recently implemented a new monitoring system that records calls as
before, but it also records the actions taken on the computer by the agent. This was put into
practice to ensure employees were searching through the correct files. Most participants
could understand why the system was in place but some felt as though this technique was
excessive. Participants also reported inconsistencies in the amount of monitoring they were
exposed to. Some were monitored weekly, some reported that they were never monitored
and others were excessively monitored. Lack of monitoring caused concern because
employees wanted feedback on their performance. On the other hand, excessive monitoring
had a poor effect on productivity because employees double-checked their work which

11
meant tasks took longer to complete. Management feedback was reported as
unconstructive which was attributed to lack of training and understanding of employee roles:
I had one call; customer is struggling to pay her bills. So I asked her to set up a
weekly payment arrangement. She was really happy about that … and then my
manager who had been listening to the call [which prompted to sell a product]
questioned why I did not promote it? I did not think the customer would be able
to afford it. [He said]…’you're making presumptions … you have to plant that
idea in their head’ (Female, 29).
Participants reported lack of recognition for effort or productivity and this was a great source
of dissatisfaction. Some employees stated they just do the minimum not to get dismissed:
You have got people who come into this job just to do this job and go away and
not really put anything into it, but for me … to get paid the same salary as them
when they are not really performing at the same level that I am … gives me no
motivation to really work hard (Male, 39).
There has been a recent emphasis on sales and employees reported they did receive some
recognition for this. However, lack of acknowledgment for the tasks they do on a day-to-day
basis (customer service) is a key factor that influences their job satisfaction and motivation:
If we get a sale … we will take a print and put it in a bucket, so our manager
sees us put it in a bucket and says well done [but] whether you make a million
customers happy in a month, they do not care about that (Female, 33).
There were many employees who stated they wanted to take on more responsibility at work
but had problems because of the shortage of development opportunities available on site.

12
Even if a position became available, employees did not have the relevant skills for a
successful application due to the lack of responsibilities given to them:
I recently went for a manager position and when I got my feedback, there was so
much stuff that you needed that I did not have … but you think, well, what
opportunities are there for me to get that experience? (Female, 29).
Participants were asked what the organisation could do to help reduce stress and they
suggested having experienced supervisors in the contact-centre that might assist and advise
employees with any customer related queries they had:
[We need] floor walkers who have information and no commitment to any
workload. You can shout over to him and say, x, y, z, help me out and he can sit
with you … just to have someone that you could go to see to get some
assistance (Male, 39).
DISCUSSION
Results show that only certain dimensions of the MS Indicator Tool are related to the GHQ-
12. Job demands were found to be a predictor of well-being which is in line with previous
research (14). Furthermore, improved work relationships correlated to lower GHQ-12 scores
supporting the suggestion that contact-centre employees get most pleasure from their social
network (15). This suggests that employee’s health outcomes improve if the stress
experienced from work demands and work relationships reduce.
The results suggest that organisations can use the MS to indicate employee job satisfaction,
job motivation, job performance and intention to quit. Employees who reported low stress
scores using the MS Indicator Tool had higher levels of job motivation and their intentions to
13
quit the job reduced. One unanticipated relationship was that lower levels of stress related
to lower levels of job satisfaction. This conflicts with research showing that a high level of
stress causes low job satisfaction (16). Perhaps employees may need some pressure to
think of their work as being significant and meaningful to the business (17). Employees
reported significantly improved job performance when manager support was high. Factors
such as job control, support and demands have generally been found as essential predictors
of well-being at work (14,18,19). This suggests employees need responsibilities and
pressure to make their work meaningful, but also that they need management support. This
was reiterated in the qualitative findings as employees reported lack of support from
managers as a major source of stress.
Survey results showed that the main external nuisances were computers breaking down,
dirty work areas and overcrowding. Previous research suggests small risks such as these
are harmful if employees are exposed to these stressors cumulatively (20). Support for this
was found, as employees who had regular problems with computer systems, dirty desks and
hot-desking (particularly not being able to find a desk) reported increased stress levels.
In agreement with previous research, this study highlighted monitoring as being beneficial to
both the employees and organisation so that a high quality of customer service is delivered
(21). However, excessive monitoring hampered employee performance because the extra
pressure made them double-check their work. Lack of appropriate management support
and development opportunities created a low morale which can have a negative effect on
employee commitment (22). Implementing supervisor support roles in contact-centres could
enrich the level of support employees receive and improve training, commitment, motivation,
satisfaction and job performance.
Psychometric assessments have found the MS can be used as a one-dimensional score of
stress only when second-order confirmatory factor analyses were performed and not as a
14
single-factor structure (6). We agree with this assessment as the seven work areas
measure individual features of work-related stress and one cannot expect to measure overall
stress if all the questions are simply added together. Therefore, the MS Indicator Tool
should be used as intended when initially tested; as a multidimensional measure of stress
(4). Single scores would be more manageable at organisational level, but they would have
little meaning. By keeping these distinct areas separate, organisations can distinguish the
contributors to employee stress and therefore interventions can be better targeted.
Strengths, limitations and future directions
Several limitations must be considered when evaluating the findings of this study. Firstly,
this research was a self-report study, the focus group participants were self-selecting and it
is reasonable to assume those who applied to take part could be employees who
experienced more stress at work. Secondly, participants were employees of the customer
service field in the energy industry and the findings may not be generalised widely. Future
research will need to explore other occupational groups (private and public sector) to gain a
clearer picture of the impact of the MS. Thirdly, this study did not include focus groups with
managers, which would have offered greater insight of how the contact-centre operates.
Future research may wish to assess line manager knowledge of the MS and how managers
think the principles of the MS can be applied within their organisation.
Conclusion
This research provides some insight into how the MS Indicator Tool relates to other
measures of health and job attitudes. The findings suggest that organisations can use the
MS tool to assess job attitudes and performance but, only the dimensions of demands and
relationships were related to GHQ in this study. The MS tool was designed and validated as
an organisational level risk assessment tool, however, organisations have already adapted it
for use in other ways, such as individual risk assessments, return to work interviews and
employee opinion survey. While this study offers further data on the validity of the MS, more

15
research is needed to evaluate how generalisable the MS Indicator Tool is when
organisations employ it in these varied methods.

16
References
1. Black C. Working for a healthier tomorrow. London: TSO, 2008.
2. Health and Safety Executive. Self-reported work-related illness and workplace injuries in 2008 / 09 : Results from the Labour Force Survey. London: National Statistics, 2010.
3. Health and Safety Executive. Managing the causes of work-related stress. London: TSO, 2007.
4. Cousins R, MacKay C, Clarke S, Kelly C, Kelly P, McCaig R. “Management Standards” work-related stress in the UK: practical development. Work Stress. 2004;18:113–36.
5. MacKay C, Cousins R, Kelly P, Lee S, McCaig R. “Management Standards” and work-related stress in the UK: policy background and science. Work Stress. 2004;18:91–112.
6. Edwards JA, Webster S, Van Laar D, Easton S. Psychometric analysis of the UK Health and Safety Executive’s Management Standards work-related stress Indicator Tool. Work Stress. 2008;22:96–107.
7. Wilkins K, Beaudet M. Work stress and health. Health Rep. 1998;10:47–62.
8. Goldberg D, Williams P. A user’s guide to the General Health Questionnaire. Windsor, UK: NFER-Nelson, 1988.
9. Warr T, Cook P, Wall K. Scales for the measurement of some work attitudes and aspects of psychological well-being. J Occup Organ Psych. 1979;52:129–48.
10. Cammann C, Fichman M, Jenkins D, Klesh J. The Michigan Organizational Assessment Questionnaire. University of Michigan: Unpublished manuscript, 1979.
11. USDAW. Stress questionnaire [Internet]. Manchester; 2006 [cited Mar 7 2008]. Available from: http://www.usdaw.org.uk/getactive/resource_library/files/RLFStressQuest/StressQuest.pdf
12. Kessler RC, Barber C, Beck A, Berglund P, Cleary PD, McKenas D, et al. The World Health Organization Health and Work Performance Questionnaire (HPQ). J Occup Environ Med. 2003;45:156–74.
13. Knodel J. Successful focus groups: advancing the state of the art. In: Morgan D, ed. The Design and Analysis of Focus Group Studies in Social Science Research. London: Sage, 1993; 35–50.
14. Karasek R, Theorell T. Healthy work: stress, productivity, and the reconstruction of working life. New York: Basic Books, 1990; 31–82.
15. Frenkel SJ, Tam M, Shire K. Beyond bureaucracy ? Work organization in call centres. Int J Hum Resour Man. 1998;9:37–41.
17
16. Ramirez AJ, Graham J, Richards MA, Gregory W, Cull A. Mental health of hospital consultants: the effects of stress and satisfaction at work. Lancet. 1996;347:724–8.
17. Siegall M, Gardner S. Contextual factors of psychological empowerment. Pers Rev. 2000;29:703–22.
18. Karasek R. Job Demands, Job Decision Latitude, and Mental Strain: Implications for Job Redesign. Admin Sci Quart. 1979;24:285-308.
19. Spector P. Interactive effects of perceived control and job stressors on affective reactions and health outcomes for clerical workers. Work Stress. 1987;1:155–62.
20. Wellens BT, Smith AP. Combined workplace stressors and their relationship with mood, physiology, and performance. Work Stress. 2006;20:245–58.
21. Holdsworth L, Cartwright S. Empowerment, stress and satisfaction: an exploratory study of a call centre. Leadership & Organization Development Journal. 2003;24:131–40.
22. Malhotra N, Budhwar P, Prowse P. Linking rewards to commitment: an empirical investigation of four UK call centres. Int J of Hum Resour Man. 2007;18:2095–128.
18
Table 1: Survey sample demographic results
Gender n (%)
Male 157 (52)
Female 147 (48)
Age Mean months (range)
Years 31 (18 – 62)
Job tenure Mean months (range)
Months 63 (2 – 527)
Job type n (%)
Permanent full-time 222 (73)
Permanent part-time 68 (22)
Contract/ temp employee 14 (5)
Job title n (%)
Customer service specialist 230 (76)
Manager 2 (6)
New connections support 65 (21)
Operations team administrator 3 (1)
19
Table 2: Spearman’s Rho test correlating individual work stressors with GHQ scores
Gen
eral
Hea
lth Q
uest
ionn
aire
sc
ore
Demands Control
Manager
support
Peer
support Relationships Role Change
Correlation
Coefficient -.211(**) .015 .015 .031 -.134(*) .066 .015
Sig.
(2-tailed) .000 .792 .791 .598 .020 .254 .793
n 300 300 300 300 300 300 300
** Correlation is significant at the 0.01 level (2-tailed)
* Correlation is significant at the 0.05 level (2-tailed)
20
Table 3: Mann Whitney U test statistics* comparing MS and GHQ-12
General Health Questionnaire score
Mann-Whitney U 11116.500
Wilcoxon W 22441.500
Z -.179
Asymp. Sig. (2-tailed) .858
* Grouping Variable: Management Standards score
21
Table 4: Spearman’s Rho correlational analyses between the total MS and job attitudes, performance and environmental scores
Correlation
Coefficient
Sig. (2-tailed)
Management Standards Indicator Tool
Job motivation .356(**) .000
Job satisfaction -.313(**) .000
Intention to quit -.390(**) .000
Job performance .311(**) .000
Mean environmental score -.240(**) .000
Manager support
Job performance 235(**) .000
** Correlation is significant at the 0.01 level (2-tailed) (99% confidence)
* Correlation is significant at the 0.05 level (2-tailed) (95% confidence)


