746 IEEE TRANSACTIONS ON FUZZY SYSTEMS, VOL. 20, NO. 4, AUGUST 2012
Stress Monitoring Based on Stochastic FuzzyAnalysis of Heartbeat Intervals
Mohit Kumar, Sebastian Neubert, Sabine Behrendt, Annika Rieger, Matthias Weippert, Norbert Stoll,Kerstin Thurow, and Regina Stoll
Abstract—Quantifying stress levels of an individual based ona mathematical analysis of real-time physiological data measure-ments is challenging. This study suggests a stochastic fuzzy analysismethod to evaluate the short time series of R–R intervals (time in-tervals between consecutive heart beats) for a quantification of thestress level. The 5-min-long series of R–R intervals recorded un-der a given stress level are modeled by a stochastic fuzzy system.The stochastic model of heartbeat intervals is individual specificand corresponds to a particular stress level. Once the differentheartbeat interval models are available for an individual, an anal-ysis of the given R–R interval series generated under an unknownstress level is performed by a stochastic interpolation of the models.The stress estimation method has been implemented in a mobiletelemedical application employing an e-health system for an effi-cient and cost-effective monitoring of patients while at home or atwork. The experiments involve 50 individuals whose stress scoreswere assessed at different times of the day. The subjective ratingscores showed a high correlation with the values predicted by theproposed analysis method.
Index Terms—E-health, fuzzy modeling, hearbeat intervals,stress, variational Bayes.
I. INTRODUCTION
S TRESS can have serious health consequences. Thus, thereis a need for a real-time personal stress monitoring over
extended periods to detect health risks. The identification ofphysiological markers of stress is a widely studied subject instress-related research. A number of physiological measures in-cluding electrodermal activity, electrocardiogram, electromyo-gram, respiration, blood volume pulse, pupil diameter, and skintemperature [1]–[5] have been suggested in the literature forstress detection. The common approach to physiological sensor-based stress monitoring is to extract the features of the physio-
Manuscript received March 8, 2011; revised August 6, 2011; acceptedNovember 29, 2011. Date of publication January 10, 2012; date of currentversion August 1, 2012. This work was supported by Ministry of Economy,Work, and Tourism in Mecklenburg-Vorpommern, Germany.
M. Kumar is with the Center for Life Science Automation, D-18119 Rostock,Germany (e-mail: [email protected]).
N. Stoll and K. Thurow are with the Institute of Automation, College ofComputer Science and Electrical Engineering, University of Rostock, D-18119Rostock, Germany (e-mail: [email protected]; [email protected]).
Color versions of one or more of the figures in this paper are available onlineat http://ieeexplore.ieee.org.
Digital Object Identifier 10.1109/TFUZZ.2012.2183602
logical signals followed by the application of pattern recognitionand machine-learning algorithms to identify the relationshipsbetween stress and physiological data. The physiological sen-sors, however, must be least cumbersome to avoid any of theirinfluences on the user activities or state. As heartbeat intervalsare relatively simple and unobtrusive to measure, an interest inthe methods of analysis of heartbeat intervals for stress predic-tion arises. Furthermore, the availability of mobile sensors andincreased use of mobile phones promote the development ofstress telemonitoring system.
The analysis of the fluctuations in heartbeat intervals, whichis commonly referred to as heart rate variability (HRV) analysis,is a frequently studied physiological rhythm. Some of the HRVanalysis methods include statistical measures analysis [6], spec-tral analysis [7]–[9], nonlinear dynamics [10], and point-processmodeling [11], [12]. The analysis of HRV in frequency domainprovides an information about cardiovascular control [7], [13].The literature frequently reports [14]–[18] that the effects ofstress on HRV are an increase in low frequency power (LF,0.04–0.15 Hz), a decrease in high frequency power (HF, 0.15–0.5 Hz), and/or an increase in LF/HF ratio. Much has beenstudied about HRV analysis and its potential as a measure ofstress, but a practical problem, which has so far not well beenaddressed in the literature, can be formally stated as follows.
Problem 1: How can a given 5-min-long series of heartbeatintervals be evaluated for estimating the stress of an individualon a numerical scale from 0 to 100. The analysis method isexpected to meet the following requirements.
1) The analysis method should be capable of handling the un-certainties in modeling the complex relationships betweenobserved heart rate signal and respective stress level.
2) The analysis method should be robust against artifacts,noise, and missing physiological data.
3) The analysis method should, from computational consid-erations, be suitable for a real-time operation in the stresstelemonitoring system.
Problem 1 falls more in mathematical domain than themedicine. Our research group has been working on problem 1,and previous research results have been published in [19]and [20]. The approach in [19] and [20] is classical in thesense that, first, the features of heart rate signal were ex-tracted in time-frequency domain using continuous wavelettransform, and then, fuzzy techniques were used to render ro-bustness in stress modeling against uncertainties due to indi-vidual variations. Although [19] and [20] extended the state ofthe art by providing theoretical contributions to stress mod-eling, telemedical applications are limited due to computa-
KUMAR et al.: STRESS MONITORING BASED ON STOCHASTIC FUZZY ANALYSIS OF HEARTBEAT INTERVALS 747
tional complexities and lack of an online individual adaptationmechanism. To avoid these limitations, a novel physiologicalsignal analysis method was suggested in [21] that offers thefollowing advantages.
1) The physiological state of an individual is predicted asa part of the signal features extraction procedure, thusavoiding the need of modeling the complex and uncer-tain relationships between signal features and the patient’sstates.
2) The method achieves a high diagnostic efficiency as aresult of mathematically formulating the problem in asensible way using recently developed stochastic fuzzymodeling methods [22].
This study considers the stochastic fuzzy modeling-based ap-proach in [21] to solve problem 1. An active area of fuzzyresearch is the development of algorithms meant for an au-tomatic data-driven construction of fuzzy models that approxi-mate the complex relationships between the variables [23]–[28].The stochastic fuzzy systems have been introduced to integraterandomness and fuzziness for the approximation of stochasticprocesses [29]. This study uses a mixed stochastic/deterministicfuzzy model in [22] for modeling the 5-min-long series of heart-beat intervals i.e., R–R intervals. The stochastic model of heart-beat intervals is individual specific and corresponds to a particu-lar stress level. Once the different heartbeat intervals models areavailable for an individual, an analysis of the given R–R intervalseries generated under an unknown stress level is performed asfollows.
1) The given R–R interval series is assumed to be generatedby a stochastic mixture of a finite number of stress levelspecific models such that each model tries to fit a part ofthe series.
2) The parameters of the stochastic mixture are inferred un-der Bayesian framework. The probability that the givenR–R interval data belong to a particular stress level spe-cific model can be calculated. The stress levels speci-fied to different models are weighted by the respectiveprobabilities to provide an estimate of the unknown stresslevel.
While most of the reported research works on stress detectionclassify patient’s state into discrete states, we estimate the stresslevel as a continuous variable. Although, in [30], a Bayesianmethod is presented to estimate stress as a continuous variable,facial, behavioral, and performance data were also used in ad-dition to physiological data in order to estimate the stress level.Our method, however, requires only heartbeat intervals and is,thus, well suited for telemedical applications.
To our best knowledge, this is the first study to quantify stressbased on the evaluation of short time series of heartbeat intervals.The contribution of this paper is to introduce a real-time suitablestress quantification method based on the evaluation of 5-min-long recording of R–R data. The major challenges of real-timestress monitoring include the following:
1) complex and uncertain relationships between stress leveland heart beat intervals;
2) sensitivity of standard heartbeat intervals analysis meth-ods towards artifacts and missing data;
3) a difference in the physiological behavior of individuals.
Our approach addresses these issues to suggest a reliablestress monitoring method. The proposed method was validatedby demonstrating a high correlation between predicted stresslevel and subjecting rating score of stress provided by 50 sub-jects during their 24-h monitoring. Our experimental studiesshowed that the proposed heartbeat intervals analysis methodachieved a correlation of R = 0.8198 between the estimatedstress values and the subjective ratings. On the other hand, thestandard spectral analysis method resulted in no correlationsbetween the calculated spectral features and subjective ratings,indicating that the commonly used spectral analysis method wasnot suitable for stress monitoring applications. The stress pre-diction method has been implemented on an e-health systemcalled the eHealth-MV system developed jointly with an indus-try partner (Infokom GmbH, Germany). The eHealth-MV sys-tem provides mobile telemedical applications related to stressand fitness monitoring.
II. METHODS
A. eHealth-MV System
The aim of eHealth-MV system is to provide a preventivemedicine-oriented individual diagnostic system for 24-h mon-itoring of relatively healthy subjects. A system for the mobilereal-time acquisition of physiological as well as subjective data(e.g., questionnaires) was developed [31]. The data acquisitionsystem is based on a mobile phone and a sensor electronicmodule with a special chest belt for acquiring several physio-logical parameters and their online transmission to the mobilephone via Bluetooth. The mobile handheld is equipped witha big touch-screen display allowing the input of several dia-log data by the subject. The mobile handheld acts as a controland communication unit allowing the data synchronization anda continuous data transfer to a communication server by theintegrated mobile radio standards. The communication serverstores the data in a process database. The primary data that arestored in the database are evaluated by a fuzzy-based algorithmto estimate stress quantitatively on a scale from 0 to 100. Aprocess information management system provides the time syn-chronized estimation of the stress. The stress assessment resultsare transferred through HTTP protocols to a scalable and securetelematics platform. The telematics platform ensures a securedata communication involving encryption, data storage, and avisualization of the results on a web-based portal. The telem-atics platform is conceived as client–server architecture, wherethe clients communicate with the server modules using standard(SOCKET/HTTP) protocols.
B. Mixed Stochastic/Deterministic Fuzzy Filter [22]
A Takagi–Sugeno (T–S) fuzzy filter, as explained inAppendix A, can be mathematically represented as
yf = GT (x, θ)α, cθ ≥ h. (1)
The filter, as seen from (1), is characterized by two types ofparameters: antecedents θ and consequents α. Expression (1)shows that the output of the fuzzy filter is linear in conse-quents (i.e., in the elements of vector α), while it is nonlinear in
748 IEEE TRANSACTIONS ON FUZZY SYSTEMS, VOL. 20, NO. 4, AUGUST 2012
antecedents (i.e., in the elements of vector θ). We study a typeof filter with 1) the nonlinear parameters θ being considered asdeterministic and 2) the linear parameters α being consideredas random variables.
C. Fuzzy-Filtering-based Heartbeat Interval Model [21]
Given a short time recording of R–R intervals {RRj}j=1,2,···(where j is the time index), consider a structure m (i.e., mem-bership type, number of membership functions, and rules) of aT–S filter of type (1) such that
RRj = GT ([RRj−n · · ·RRj−1 ]T , θ)α + nj
where nj is the additive Gaussian uncertainty with mean 0 anda variance of 1/φ. Here, θ is deterministic, while α and φ arerandom with the following priors:
p(α|m0 ,Λ0) = N(α|m0 , (Λ0)−1)
p(φ|a0 , b0) = Ga(φ|a0 , b0)
where Ga(φ|a0 , b0) is the Gamma distribution that is defined as
Ga(φ|a0 , b0)=1
Γ(b0)φb0 −1
ab00
e−φ
a 0 , for φ > 0 and a0 , b0 > 0.
We choose n = 2 and define two triangular membership func-tions on each of two inputs. As explained in Appendix A, thedefining points of membership functions are represented by avector θ. To define the membership functions, we set θ as
θ = (t01 , t11 , t
02 , t
12), where
t01 = t02 = minj
{RRj}, t11 = t12 = maxj
{RRj}.
The details of constructing triangular membership functionsfrom θ have been provided in Appendix A.
A variational Bayesian algorithm to infer the varia-tional distributions, i.e., q∗(α) = N(α|m, (Λ)−1) and q∗(φ) =Ga(φ|a, b), was proposed in [22]. Algorithm 2 in Appendix Bapplies the method in [22] to infer the parameters of heartbeatinterval model.
To illustrate the stochastic fuzzy modeling of heartbeat inter-vals, Fig. 1 plots an R–R interval series and its approximationE(RRj |RRj−2 , RRj−1) given by
Fig. 1 also plots q∗(φ) which is the probability density of inversevariance of the modeling uncertainty nj .
D. Development of Finite Number of Stochastic FuzzyModels Characterizing the Different PhysiologicalStates of an Individual
Given short time recording of R–R intervals {RRj}j=0,1,...
of a subject, Algorithm 2 in Appendix B can be used to inferthe parameters of the heartbeat interval model that correspondsto the physiological state of the subject during the period ofR–R data measurements. The time length of R–R interval seriesshould be such that the physiological state of the subject to becharacterized by the model does not vary during the measure-ment period of R–R intervals.
Fig. 1. Stochastic fuzzy modeling of heartbeat intervals.
For an individual at a physiological state s characterizing thestress level quantification equal to strs , let (θs,Λs ,ms, as, bs)denote the model parameters returned by Algorithm 2. If thereare S numbers of physiological states, then S different heart-beat interval models {(θs,Λs ,ms, as , bs)}S
s=1 , correspondingto stress levels {strs}S
s=1 , respectively, can be inferred.
E. Stochastic Fuzzy Analysis of Heartbeat Intervals for StressLevel Estimation
Our concern is to evaluate any finite R–R interval series gener-ated under an unknown physiological state based on the stochas-tic interpolation of available heartbeat interval models of thesubject. The given R–R interval series {RRj}N +2
j=1 is assumedto be generated by a stochastic mixture of S fuzzy models (withtheir parameters as {(θs,Λs ,ms, as , bs)}S
s=1 and correspondingstress levels as {strs}S
s=1) such that an individual fuzzy modeltries to model a part of the series. Let {si}N
i=1 denote N differ-ent discrete random variables such that the value of si (wheresi = 1, 2, . . . , S) represents the chosen heartbeat interval modelfor modeling the ith pair of data
([RRi RRi+1]T , RRi+2
). That
is, ∀i = 1, . . . , N
If si = 1, then RRi+2 = GT ([RRi RRi+1]T , θ1)α1 + ni
p(ni) ∼ N(0, (φ1)−1)
...
If si = S, then RRi+2 = GT ([RRi RRi+1]T , θS )αS + ni
p(ni) ∼ N(0, (φS )−1)
These stochastic rules can be interpreted as
If si = 1, then stress associated with the ith data pair([RRi RRi+1]T , RRi+2
)is equal to str1
...
KUMAR et al.: STRESS MONITORING BASED ON STOCHASTIC FUZZY ANALYSIS OF HEARTBEAT INTERVALS 749
If si = S, then stress associated with ith data pair([RRi RRi+1]T , RRi+2
)is equal to strS .
Let π = [π1 · · ·πS ]T ∈ RS , with 0 ≤ πsi≤ 1 and
∑Ssi =1
πsi= 1 be a vector of mixing proportions (i.e., the propor-
tions by which individual heartbeat interval models’ outputsare mixed to match the observed output values) such that thediscrete distribution of si is given as
p(si = 1|π) = π1 , . . . , p(si = S|π) = πS .
Now, the probability of RRi+2 is given as
p(RRi+2 |π, {G([RRi RRi+1]T , θs)}Ss=1 , {αs}S
s=1 , {φs}Ss=1)
=S∑
s=1
p(si = s|π)p(RRi+2 |si = s,G
([RRi RRi+1]T , θs
)
αs, φs) .
Introduce the notations
Y =
⎡
⎢⎢⎢⎢⎣
RR3
RR4...
RRN +2
⎤
⎥⎥⎥⎥⎦
, B(θs) =
⎡
⎢⎢⎢⎢⎣
GT ([RR1 RR2 ]T , θs)
GT ([RR2 RR3 ]T , θs)...
GT ([RRN RRN +1]T , θs)
⎤
⎥⎥⎥⎥⎦
.
The probability of data set Y is given as
P (Y |π, {B(θs)}Ss=1 , {αs}S
s=1 , {φs}Ss=1)
=N∏
i=1
p(RRi+2 |π, {G([RRi RRi+1]T , θs)}S
s=1
{αs}Ss=1 , {φs}S
s=1)
=N∏
i=1
S∑
s=1
p(si =s|π)p(RRi+2 |si =s,G([RRi RRi+1]T , θs)
αs, φs) .
Following distributions are chosen for the parameters priors:
p(αs |ms0 ,Λ
s0) = N(αs |ms
0 , (Λs0)
−1)
p(φs |as0 , b
s0) = Ga(φs |as
0 , bs0)
p(π|c0d0) = Dir(π|c0d0), where d0 =[
1S· · · 1
S
]T
∈ RS
where Ga(φs |as0 , b
s0) and Dir(π|c0d0) are Gamma and
Dirichlet distributions, respectively, which are defined asfollows:
Ga(φs |as0 , b
s0) =
1Γ(bs
0)(φs)bs
0 −1
(as0)bs
0e− φ s
a s0
for φs > 0 and as0 , b
s0 > 0.
Dir(π|c0d0) =Γ(c0)
(Γ( c0S ))S
πc 0S −1
1 · · ·πc 0S −1
S
where π1 , . . . , πS ≥ 0,∑S
j=1 πj = 1, and c0 > 0. We want toinfer the approximate posterior distributions {q(si = s)}N
i=1 un-der Bayesian framework to estimate the average stress level
associated with given series {RRj}N +2j=1 . The stress associated
with ith data pair([RRi RRi+1]T , RRi+2
)can be estimated as
stressi = q(si = 1)str1 + · · · + q(si = S)strS .
The average stress associated with {RRj}N +2j=1 , i.e., N data pairs
can be estimated as
stress =1N
N∑
i=1
[q(si = 1)str1 + · · · + q(si = S)strS
]. (2)
The stress level given by (2) is a stochastic interpolation of S dif-ferent heartbeat interval models and requires the calculation ofvariational distributions of the stochastic mixture of S differentfuzzy models. This problem of fuzzy models mixture inferencewas solved under variational Bayes framework in [21] and isrepeated in Appendix C for the sake of completion. Algorithm1, shown at the top of the next page, is suggested as a stress es-timation algorithm based on the solution provided in AppendixC.
F. Adaptation of Physiological State Models of an Individual
During the continuous monitoring of the patient, the patientmay be requested to provide a subjecting rating score of stress.If the difference between predicted stress level and subjectiverating is higher than a tolerance limit, the relevant physiologicalstate model can be adapted with the use of available information.If {RRj}N +2
j=1 are the measured data during the time periodcorresponding to a stress score equal to score, then a possibleadaptation mechanism could be as follows:
The experiments perform a 24-h monitoring of 50 subjectsin e-health setting. As stated earlier, the developed e-healthsystem permits the acquisition of not only physiological databut also the subjective data using the mobile handheld wherethe software version of modified NASA Task Load Index [32]was implemented. The subjects were asked at different timesof the day during monitoring to input at the mobile handheldthe subjective rating score of stress felt by them during last5 min. The subjects were required to provide a rating on thescale from 0 to 100 for each of the six components of stress(mental demands, physical demands, temporal demands, ownperformance, effort, and frustration). The overall stress scorebased on the average of ratings on six subscales is of interest forprediction.
750 IEEE TRANSACTIONS ON FUZZY SYSTEMS, VOL. 20, NO. 4, AUGUST 2012
A. Spectral Analysis
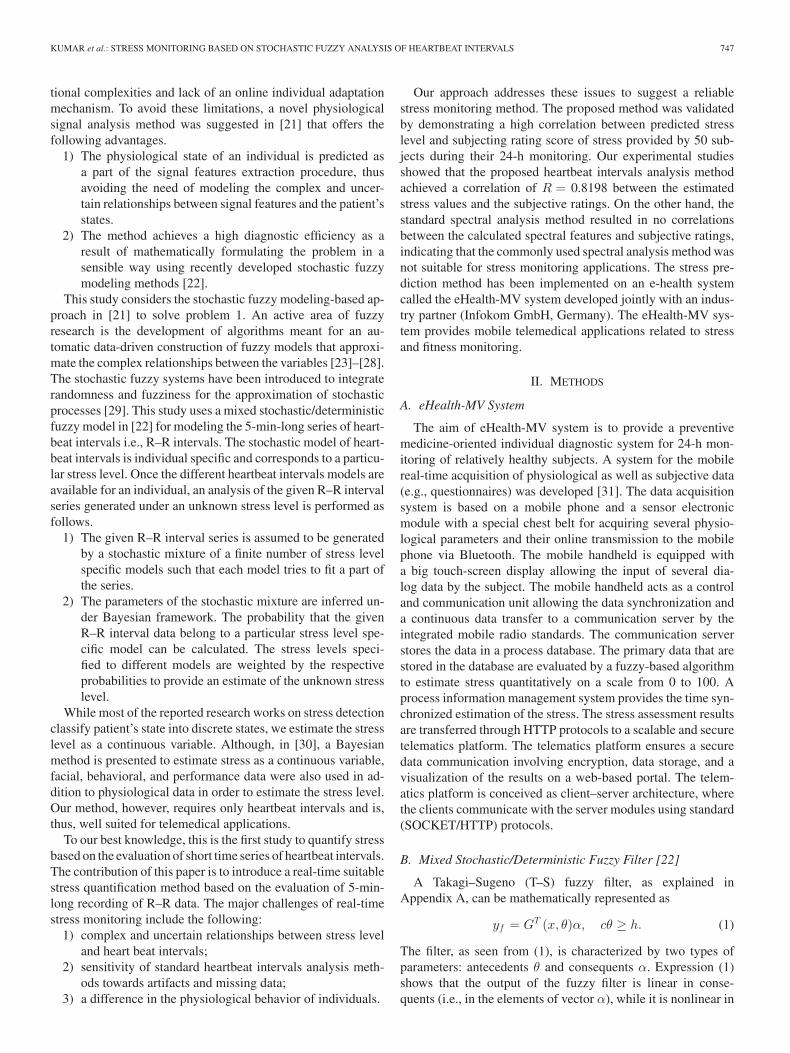
The spectral analysis methods estimate the power spectraldensity (i.e., distribution of power as a function of frequency)to extract the features of heartbeat intervals and can be used todetect stress [33]. The 5-min-long interbeat intervals segmentswere analyzed by using fast Fourier transform. The series ofinterbeat intervals was preprocessed with an impulse rejectionfilter for artifacts removal [34]. The series was resampled at arate of 4 Hz by using a cubic spline interpolation. The resampledsignal was detrended [35] to remove the slow nonstationarytrends from the signal. The spectrum of heartbeat intervals istypically divided into three frequency bands: very low frequencyVLF (0.01–0.04 Hz), low frequency LF (0.04–0.15 Hz), andhigh frequency HF (0.15–0.5 Hz). The power components inVLF, LF, and HF frequency bands are the standard measuresof variability in heartbeat intervals [6]. The LF is affected byboth the sympathetic and parasympathetic activities, while the
HF is found to be dominated by the parasympathetic activity[36]. The VLF is related to factors like temperature, hormones,etc. [37]. The ratio of the LF to HF power is associated withthe sympatho-vagal balance [37]. Fig. 2 shows the scatter plotsbetween the spectral features (VLF, LF, HF, and LF/HF) ofheartbeat intervals and subjective rating scores of stress. Thepoor correlations between features and stress level indicate theuncertainties in the individual behavior under different stressconditions. This limits the application of commonly studiedspectral features in predicting the stress level of a subject from5-min-long heartbeat interval series.
B. Stochastic Fuzzy Analysis
The aim is to predict the overall stress score based on the anal-ysis of heartbeat intervals. The proposed stress estimation Al-gorithm 1 requires the development of S different heartbeat in-terval models and knowledge about corresponding stress scores
KUMAR et al.: STRESS MONITORING BASED ON STOCHASTIC FUZZY ANALYSIS OF HEARTBEAT INTERVALS 751
Fig. 2. Scatter plots between the spectral features of heartbeat intervals and subjective rating scores of stress. (a) VLF. (b) LF. (c) HF. (d) LF/HF.
{strs}Ss=1 . The stress under an unknown physiological state is,
then, estimated based on the stochastic interpolation of avail-able S different heartbeat interval models. Therefore, the stressmonitoring module implemented in e-health system must waittill the availability of S number of stress scores for a subject.Algorithm 2 was used to develop the heartbeat interval model(θs,Λs ,ms, as, bs) corresponding to the stress score strs . Al-gorithm 2 was configured as follows.
1) The prior m0 was equal to the zero vector, and Λ0 wasequal to the unity matrix.
2) The parameters a0 = 106 , b0 = 10−6 (i.e., relatively non-informative priors for the uncertainty) were chosen.
3) The algorithm was started with a|0 = a0 , b|0 = b0 .The stress estimation Algorithm 1 can be started with
q∗(si = s)|0 =1S
ms |0 = ms0 , Λs |0 = Λs
0 , bs |0 = bs0 +
∑Ni=1 q∗(si = s)|0
2
1as |0
=1as
0+
12[(Y s
q |0 −Bq |0 (θs)ms |0)T (Y s
q |0 −Bq |0 (θs)ms |0)
+ Tr((Λs |0)−1(Bq |0 (θ
s))T Bq |0 (θs)
)]
c|0 = c0 + N, ds |0 =1
c0 + N
(c0
S+
N∑
i=1
q∗(si = s)|0
)
.
Regarding the choice of S (i.e., number of physiological statemodels), it must be chosen sufficiently higher to cover at leastthe extreme physiological states of the patient. It was observedin our studies that S = 9 was sufficient to achieve a good cor-relation between the predicted stress level (calculated by inter-polating the heartbeat interval data to the nine different models)and the subjective rating score of stress.
Algorithm 1 was run to analyze 5-min-long data segmentsfor the 24-h stress monitoring of 50 subjects. As explained inSection II-F, the subjective rating stress scores were used foran adaptation of the physiological state models. The heartbeatinterval data segments, as expected, were contaminated with
752 IEEE TRANSACTIONS ON FUZZY SYSTEMS, VOL. 20, NO. 4, AUGUST 2012
Fig. 3. Prediction performance of the method. (a) Plot between predicted and subjective rating score of stress. (b) Histogram of prediction errors.
Fig. 4. Estimation performance of the method. (a) Plot between estimated and subjective rating score of stress. (b) Histogram of estimation errors.
occasional artifacts. The artifacts can be relatively easily han-dled in the proposed analysis method. The method analyze thedata segment {RRj}j=1,2,... by 1) calculating the probabilitythat the ith pair of data
([RRi RRi+1]T , RRi+2
)have been
generated by sth physiological model and 2) averaging theprobability over i (i.e., over all data pairs of the segment tobe analyzed).
Now, if any of (RRi,RRi+1 , RRi+2) is found to be an ar-tifact, the data pair
([RRi RRi+1]T , RRi+2
)can be excluded
from the analysis. The exclusion of a few data pairs should nothave a large effect on the calculation of average probability. Thisis how a robustness of the analysis method toward artifacts isachieved. In our experiments, the method in [34] was used todetect artifacts.
The stress estimation method is validated with the followinganalysis.
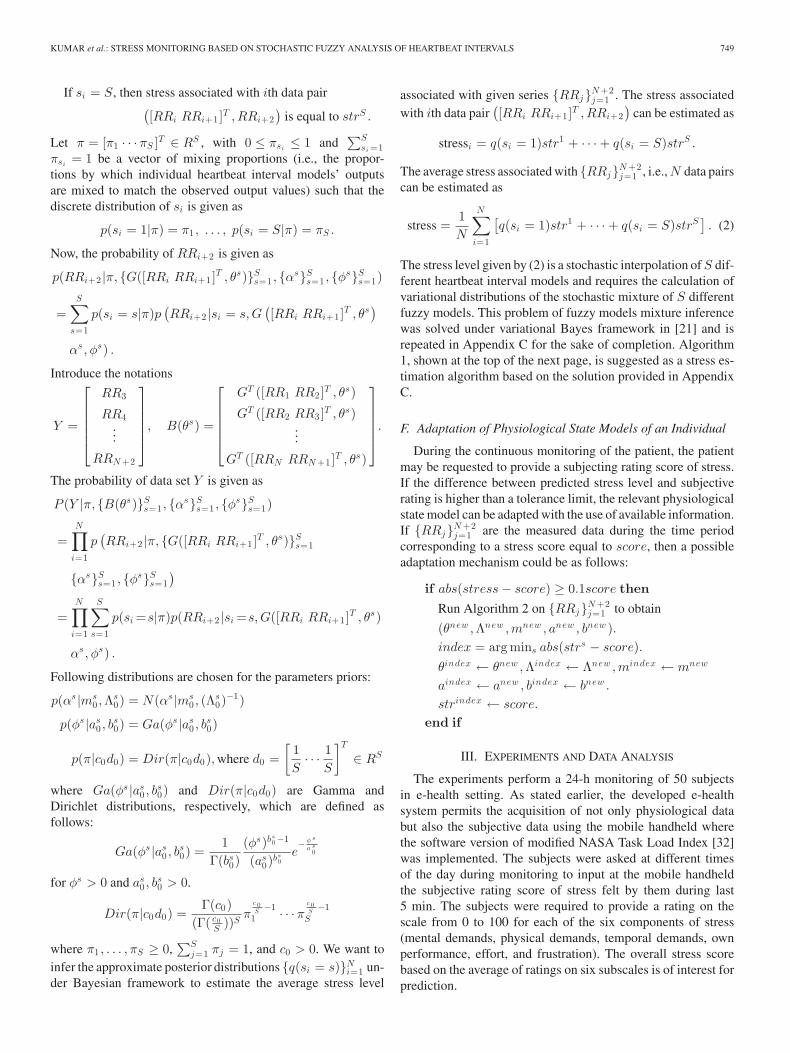
1) It is shown that the predicted stress level (i.e., estimatedstress level before the adaptation of physiological models)is positively correlated with the subjective rating score of
stress during the 24-h monitoring. The difference betweenthe two was referred to as prediction error.
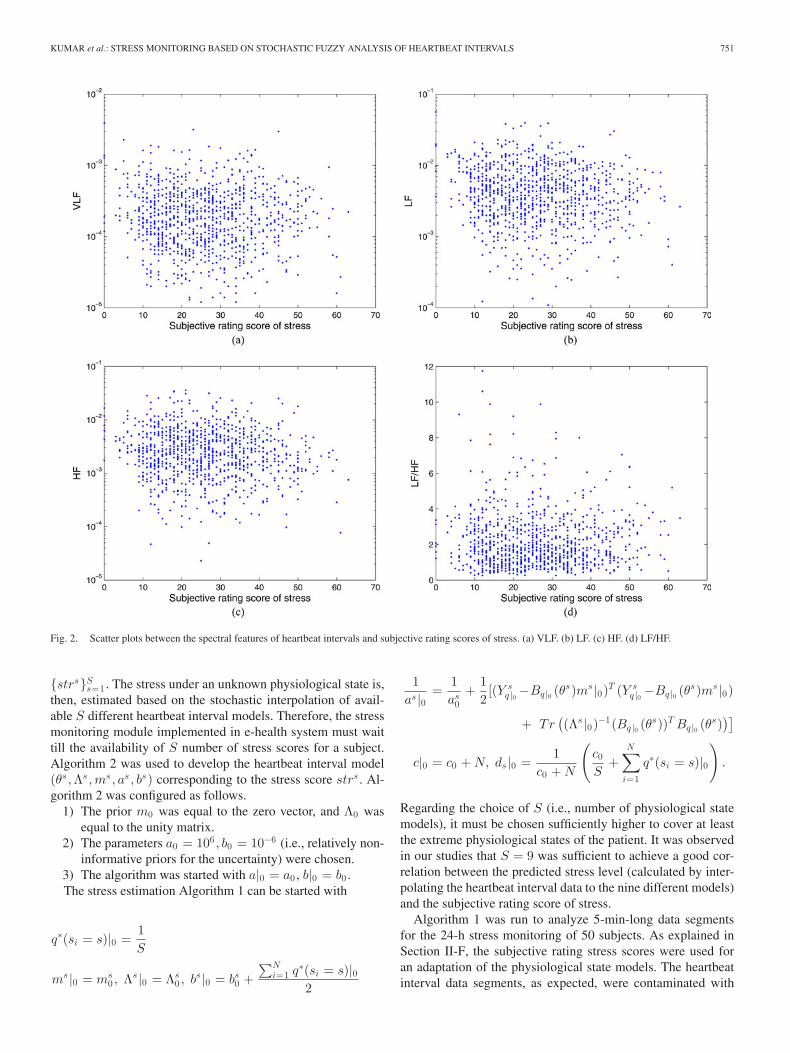
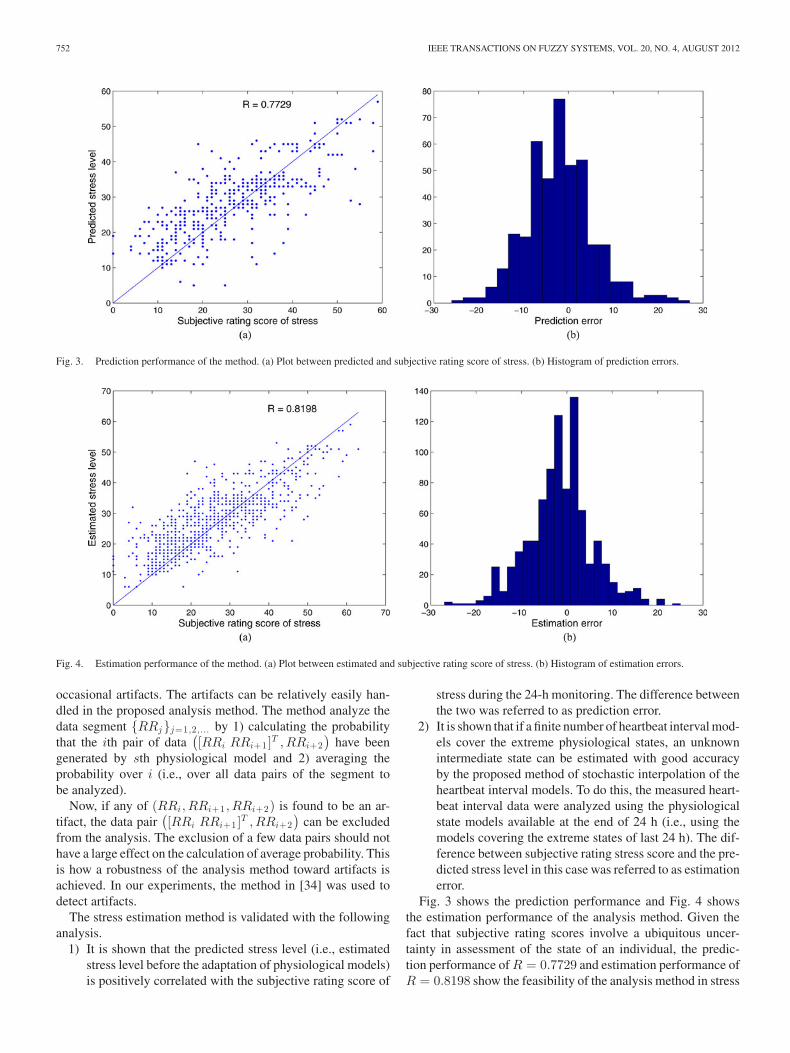
2) It is shown that if a finite number of heartbeat interval mod-els cover the extreme physiological states, an unknownintermediate state can be estimated with good accuracyby the proposed method of stochastic interpolation of theheartbeat interval models. To do this, the measured heart-beat interval data were analyzed using the physiologicalstate models available at the end of 24 h (i.e., using themodels covering the extreme states of last 24 h). The dif-ference between subjective rating stress score and the pre-dicted stress level in this case was referred to as estimationerror.
Fig. 3 shows the prediction performance and Fig. 4 showsthe estimation performance of the analysis method. Given thefact that subjective rating scores involve a ubiquitous uncer-tainty in assessment of the state of an individual, the predic-tion performance of R = 0.7729 and estimation performance ofR = 0.8198 show the feasibility of the analysis method in stress
KUMAR et al.: STRESS MONITORING BASED ON STOCHASTIC FUZZY ANALYSIS OF HEARTBEAT INTERVALS 753
Fig. 5. Subject 1: Time plots of predicted stress values and subjective ratingscores of stress.
Fig. 6. Subject 2: Time plots of predicted stress values and subjective ratingscores of stress.
monitoring applications. The comparison between the scatterplots in Fig. 4 and Fig. 2 clearly indicates that the commonlystudied spectral analysis method was not suitable for stress mon-itoring applications, and thus, this study made a sense. Figs. 5and 6 show the two case studies of the time plots of predictedstress values and subjective rating scores of stress during 24-hmonitoring.
IV. CONCLUSION
There is a need to look beyond the classical methods of iden-tifying the relationships between physiological signal featuresand stress through neural/fuzzy models. This study has extendedthe state of the art by suggesting a stress estimation algorithmbased on the evaluation of short time series of heartbeat intervalsfor mobile telemedical applications. The relationships betweenphysiological states and the observed heartbeat interval data areuncertain and, thus, are challenging to model. The stochasticfuzzy analysis of physiological signals seems to be a usefulmodeling tool in the presence of uncertainties. Furthermore,the method offers individual specific modeling, an adaptationmechanism, and is suitable for real-time operations.
As during stress the balance between the sympathetic andparasympathetic activities of the autonomic nervous systemwill be altered, the future research work is concerned with thefollowing:
How can the stochastic fuzzy analysis of heartbeat intervals providea theoretical framework for autonomic nervous system assessmentby identifying the sympathetic and parasympathetic activities?
The stochastic fuzzy-analysis-based approach is general toevaluate any biomedical signal (e.g., EMG, EEG, etc.) for func-tional state assessment.
APPENDIX A
TAKAGI–SUGENO FUZZY FILTER
Consider a T–S fuzzy model (Fs : X → Y ) that maps n-dimensional real input space (X = X1 × X2 × · · · × Xn ) to1-D real line. A rule of the model is represented as
If x1 is A1 and · · · and xn is An then
yf = s0 + s1x1 + · · · + snxn .
Here (x1 , . . . , xn ) are the model input variables, yf is the filteredoutput variable, (A1 , . . . , An ) are the linguistic terms which arerepresented by fuzzy sets, and (s0 , s1 , . . . , sn ) are real scalars.Given a universe of discourse Xj , a fuzzy subset Aj of Xj ischaracterized by a mapping:
μAj: Xj → [0, 1]
where for xj ∈ Xj , μAj(xj ) can be interpreted as the degree
or grade to which xj belongs to Aj . This mapping is calledas membership function of the fuzzy set. Let us define, forjth input, Pj nonempty fuzzy subsets of Xj (represented byA1j , A2j , . . . , APj j ). Let the ith rule of the rule-base is repre-sented as
Ri : If x1 is Ai1 and · · · and xn is Ain then
yf = si0 + si1x1 + · · · + sinxn
where Ai1 ∈ {A11 , . . . , AP1 1}, Ai2 ∈ {A12 , . . . , AP2 2}, and soon. Now, the different choices of Ai1 , Ai2 , . . . , Ain leads to theK =
∏nj=1 Pj number of fuzzy rules. For a given input vector
x = [x1 · · ·xn ]T ∈ Rn , the degree of fulfillment of the ith rule,by modeling the logic operator “and” using product, is given by
gi(x) =n∏
j=1
μAi j(xj ).
The output of the fuzzy model to input vector x is computedby taking the weighted average of the output provided by eachrule:
yf =∑K
i=1(si0 + si1x1 + · · · + sinxn )gi(x)∑K
i=1 gi(x)
=
∑Ki=1(si0 + si1x1 + · · · + sinxn )
∏nj=1 μAi j
(xj )∑K
i=1∏n
j=1 μAi j(xj )
. (3)
Let us define a real vector θ such that the membership functionsof any type (e.g., trapezoidal, triangular, etc.) can be constructedfrom the elements of vector θ. To illustrate the construction ofmembership functions based on vector θ, consider the followingexample.
754 IEEE TRANSACTIONS ON FUZZY SYSTEMS, VOL. 20, NO. 4, AUGUST 2012
Triangular membership functions: Let
θ = (t01 , t11 , . . . , t
P1 −21 , tP1 −1
1 , . . . , t0n , t1n , . . . , tPn −2n , tPn −1
n )
such that for ith input, t0i < t1i < · · · < tPi −2i < tPi −1
i holds forall i = 1, . . . , n. Now, Pi triangular membership functions forith input (μA 1 i
, μA 2 i, . . . , μAP i i
) can be defined as
μA 1 i(xi, θ) = max
(0,min
(1,
t1i − xi
t1i − t0i
))
μAj i(xi, θ) = max
(
0,min
(xi − tj−2
i
tj−1i − tj−2
i
,tji − xi
tji − tj−1i
))
j = 2, . . . , Pi − 1
μAP i i(xi, θ) = max
(
0,min
(xi − tPi −2
i
tPi −1i − tPi −2
i
, 1
))
.
For any choice of membership functions (which can be con-structed from a vector θ), (3) can be rewritten as function of θ:
yf =K∑
i=1
(si0 + si1x1 + · · · + sinxn )Gi(x, θ)
Gi(x, θ) =
∏nj=1 μAi j
(xj , θ)∑K
i=1∏n
j=1 μAi j(xj , θ)
.
Let us introduce the following notation:
α =
⎡
⎢⎢⎢⎢⎢⎢⎢⎢⎢⎢⎢⎢⎢⎢⎣
s10s11
...s1n
...sK 0sK 1
...sK n
⎤
⎥⎥⎥⎥⎥⎥⎥⎥⎥⎥⎥⎥⎥⎥⎦
∈ RK (n+1)
G(x, θ) =
⎡
⎢⎢⎢⎢⎢⎢⎣
G1(x, θ)
xG1(x, θ)...
GK (x, θ)
xGK (x, θ)
⎤
⎥⎥⎥⎥⎥⎥⎦
∈ RK (n+1) .
Now, we have
yf = GT (x, θ)α.
In this expression, θ is not allowed to be any arbitrary vector,since the elements of θ must ∀i = 1, . . . , n ensure
ai ≤ t0i < t1i < · · · < tPi −2i < tPi −1
i ≤ bi, where xi ∈ [ai, bi ].
These inequalities and any other membership-function-relatedconstraints (designed for incorporating a priori knowledge) canbe written in the form of a matrix inequality cθ ≥ h. Hence, aT–S-type fuzzy filter can be represented as
yf = GT (x, θ)α, cθ ≥ h.
APPENDIX B
ALGORITHM FOR STOCHASTIC FUZZY MODELING OF
HEARTBEAT INTERVALS
APPENDIX C
VARIATIONAL BAYES INFERENCE OF A FINITE MIXTURE OF
The lower bound is defined as a functional of the variationalposterior distributions as follows:
F(q(π), q(α), q(φ), {q(si)}Ni=1 , {B(θs)}S
s=1 , c0 ,m0 ,Λ0 , a0 , b0)
=∫
dπq(π) logp(π|c0d0)
q(π)+
∫dαq(α) log
p(α|m0 ,Λ0)q(α)
+∫
dφq(φ) logp(φ|a0 , b0)
q(φ)
+N∑
i=1
[S∑
s=1
q(si = s)∫
dπq(π) logp(si = s|π)q(si = s)
+S∑
s=1
q(si = s)∫
dαdφq(α)q(φ) log{
p(RRi+2 |si = s,G([RRi RRi+1]T , θs), αs , φs
)}]
.
756 IEEE TRANSACTIONS ON FUZZY SYSTEMS, VOL. 20, NO. 4, AUGUST 2012
Since
log p(RRi+2 |si = s,G([RRi RRi+1]T , θs), αs , φs
)
= − 12
log(2pi) +12
log(φs)
− φs
2|RRi+2 − GT ([RRi RRi+1]T , θs)αs |2
therefore
F(q(π), q(α), q(φ), {q(si)}Ni=1 , {B(θs)}S
s=1 , c0 ,m0 ,Λ0 , a0 , b0)
=∫
dπq(π) logp(π|c0d0)
q(π)+
∫dαq(α) log
p(α|m0 ,Λ0)q(α)
+∫
dφq(φ) logp(φ|a0 , b0)
q(φ)− N
2log(2pi)
+N∑
i=1
{S∑
s=1
q(si = s)∫
dπq(π) logp(si = s|π)q(si = s)
+12
S∑
s=1
q(si = s)∫
dφsq(φs) log(φs)
− 12
S∑
s=1
q(si = s)∫
dαsdφsq(αs)q(φs)φs
|RRi+2 − GT ([RRi RRi+1]T , θs)αs |2}
.
The variational distributions are obtained by maximizing Fw.r.t. each distribution. That is, the optimal expressions for vari-ational distributions are obtained by setting the derivative of Fw.r.t. distribution functions equal to zero.
758 IEEE TRANSACTIONS ON FUZZY SYSTEMS, VOL. 20, NO. 4, AUGUST 2012
E. Summary of the Parameters Updating Rules
The rules for updating the parameters of the distributions aresummarized as follows:
Λs = Λs0 + asbs(Bq (θs))T Bq (θs)
ms = [Λs ]−1 [Λs
0ms0 + asbs(Bq (θs))T Y s
q
]
q∗(si = s) =1Z eΨ(cds) − Ψ(c) +
12
[Ψ(bs) + log(as)]
− asbs
2ri(ms,Λs , θs)
bs = bs0 +
∑Ni=1 q∗(si = s)
21as
=1as
0+
12
[(Y s
q − Bq (θs)ms)T (Y sq − Bq (θs)ms)
+Tr((Λs)−1(Bq (θs))T Bq (θs)
)]
c = c0 + N
ds =1
c0 + N
(c0
S+
N∑
i=1
q∗(si = s)
)
.
Here, in the expressions for Λs and ms , the term∫
dφsq(φs)φs
has been substituted as asbs .
REFERENCES
[1] C. Setz, B. Arnrich, J. Schumm, R. L. Marca, G. Troster, and U. Ehlert,“Descriminating stress from cognitive load using a wearable EDA device,”IEEE Trans. Inf. Technol. Biomed., vol. 14, no. 2, pp. 410–417, Mar. 2010.
[2] J. A. Healey and R. W. Picard, “Detecting stress during real-world drivingtasks using physiological sensors,” IEEE Trans. Intell. Transp. Syst.,vol. 6, no. 2, pp. 156–166, Jun. 2005.
[3] J. Zhai and A. Barreto, “Stress detection in computer users based on digitalsignal processing of nonlinvasive physiological variables,” in Proc. 28thIEEE EMBS Annu. Int. Conf., New York, Aug. 2006, pp. 1355–1358.
[4] M.-H. Lee, G. Yang, H.-K. Lee, and S. Bang, “Development stress mon-itoring system based on personal digital assistant,” in Proc. 26th IEEEEMBS Annu. Int. Conf., San Francisco, CA, Sep. 2004, pp. 2364–2367.
[5] C. D. Katsis, G. Ganiatsas, and D. I. Fotiadis, “An integrated telemedicineplatform for the assessment of affective physiological states,” Diagnost.Pathol., vol. 1, pp. 1–16, Aug. 2006.
[6] Task Force of the European Society of Cardiology and the North AmericanSociety of Pacing and Electrophysiology, “Heart rate variability. Standardsof measurement, physiological interpretation, and clinical use,” Eur. HeartJ., vol. 17, pp. 354–381, 1996.
[7] S. Akselrod, D. Gordon, F. A. Ubel, D. C. Shannon, A. C. Barger, andR. J. Cohen, “Power spectrum analysis of heart rate fluctuation: A quan-titative probe of beat to beat cardiovascular control,” Science, vol. 213,pp. 220–222, 1981.
[8] N. Montano, A. Porta, C. Cogliati, G. Costantino, E. Tobaldini,K. R. Casali, and F. Iellamo, “Heart rate variability explored in the fre-quency domain: A tool to investigate the link between heart and behavior,”Neurosci. Biobehav. Rev., vol. 33, no. 2, pp. 71–80, 2009.
[9] N. Y. Belova, S. V. Mihaylov, and B. G. Piryova, “Wavelet transform: Abetter approach for the evaluation of instantaneous changes in heart ratevariability,” Autonom. Neurosci.: Basic Clin., vol. 131, no. 1, pp. 107–122, 2007.
[10] A. Voss, S. Schulz, R. Schroeder, M. Baumert, and P. Caminal, “Methodsderived from nonlinear dynamics for analysing heart rate variability,”Philosoph. Trans. R. Soc. A: Math., Phys. Eng. Sci., vol. 367, no. 1887,pp. 277–296, 2009.
[11] R. Barbieri, E. C. Matten, A. A. Alabi, and E. N. Brown, “A point-processmodel of human heartbeat intrervals: New definitions of heart rate and
[12] R. Barbieri and E. N. Brown, “Analysis of heartbeat dynamics by pointprocess adaptive filtering,” IEEE Trans. Biomed. Eng., vol. 53, no. 1,pp. 4–12, Jan. 2006.
[13] B. M. Sayers, “Analysis of heart rate variability,” Ergonom., vol. 16,no. 1, pp. 17–32, 1973.
[14] J. W. Hughes and C. M. Stoney, “Depressed mood is related to high-frequency heart rate variability during stressors,” Psychosomat. Med.,vol. 62, pp. 796–803, 2000.
[15] J. P. Delaney and D. A. Brodie, “Effects of short-term psychological stresson the time and frequency domains of heart-rate variability,” Percept.Motor Skills, vol. 91, pp. 515–524, 2000.
[16] D. Lucini, G. Norbiato, M. Clerici, and M. Pagani, “Hemodynamic andautonomic adjustments to real life stress conditions in humans,” Hyper-tension, vol. 39, pp. 184–188, 2002.
[17] L.-Y. Lin, C.-C. Wu, Y.-B. Liu, Y.-L. Ho, C.-S. Liau, and Y.-T. Lee, “De-rangement of heart rate variability during a catastrophic earthquake: Apossible mechanism for increased heart attacks,” J. Pac. Clin. Electro-physiol., vol. 24, no. 11, pp. 1596–1601, 2001.
[18] R. K. Dishman, Y. Nakamura, M. E. Garcia, R. W. Thompson, A. L. Dunn,and S. N. Blair, “Heart rate variability, trait anxiety, and perceived stressamong physically fit men and women,” Int. J. Psychophysiol., vol. 37,pp. 121–133, 2000.
[19] M. Kumar, M. Weippert, R. Vilbrandt, S. Kreuzfeld, and R. Stoll, “Fuzzyevaluation of heart rate signals for mental stress assessment,” IEEE Trans.Fuzzy Syst., vol. 15, no. 5, pp. 791–808, Oct. 2007.
[20] M. Kumar, D. Arndt, S. Kreuzfeld, K. Thurow, N. Stoll, and R. Stoll,“Fuzzy techniques for subjective workload score modelling under uncer-tainties,” IEEE Trans. Syst., Man, Cybern. B: Cybern., vol. 38, no. 6,pp. 1449–1464, Dec. 2008.
[21] M. Kumar, M. Weippert, N. Stoll, and R. Stoll, “A mixture of fuzzyfilters applied to the analysis of heartbeat intervals,” Fuzzy Optim. Decis.Making, vol. 9, no. 4, pp. 383–412, 2010.
[22] M. Kumar, N. Stoll, and R. Stoll, “Variational Bayes for a mixed stochas-tic/deterministic fuzzy filter,” IEEE Trans. Fuzzy Syst., vol. 18, no. 4,pp. 787–801, Aug. 2010.
[23] R. Alcala, M. J. Gacto, and F. Herrera, “A fast and scalable multiobjectivegenetic fuzzy system for linguistic fuzzy modeling in high-dimensionalregression problems,” IEEE Trans. Fuzzy Syst., vol. 19, no. 4, pp. 666–681, Aug. 2011.
[24] A. Lemos, W. Caminhas, and F. Gomide, “Multivariable Gaussian evolv-ing fuzzy modeling system,” IEEE Trans. Fuzzy Syst., vol. 19, no. 1,pp. 91–104, Feb. 2011.
[25] Z. Deng, K.-S. Choi, F.-L. Chung, and S. Wang, “Scalable TSK fuzzymodeling for very large datasets using minimal-enclosing-ball approx-imation,” IEEE Trans. Fuzzy Syst., vol. 19, no. 2, pp. 210–226, Apr.2011.
[26] M. H. Mashinchi, M. A. Orgun, M. Mashinchi, and W. Pedrycz, “A tabu-harmony search-based approach to fuzzy linear regression,” IEEE Trans.Fuzzy Syst., vol. 19, no. 3, pp. 432–448, Jun. 2011.
[27] C.-F. Juang, C.-M. Hsiao, and C.-H. Hsu, “Hierarchical cluster-basedmultispecies particle-swarm optimization for fuzzy-system optimization,”IEEE Trans. Fuzzy Syst., vol. 18, no. 1, pp. 14–26, Feb. 2010.
[28] C.-F. Juang, R.-B. Huang, and W.-Y. Cheng, “An interval type-2 fuzzy-neural network with support-vector regression for noisy regression prob-lems,” IEEE Trans. Fuzzy Syst., vol. 18, no. 4, pp. 686–699, Aug. 2010.
[29] P. Liu and H. Li, “Approximation of stochastic processes by T-S fuzzysystems,” Fuzzy Sets Syst., vol. 155, no. 2, pp. 215–235, 2005.
[30] W. Liao, W. Zhang, Z. Zhu, and Q. Ji, “A real-time human stress moni-toring system using dynamic Bayesian network,” in Proc. IEEE Comput.Soc. Conf. Comput. Vis. Pattern Recognit., Washington, DC, Jun. 2005,p. 70.
[31] S. Neubert, D. Arndt, K. Thurow, and R. Stoll, “Mobile real-time dataacquisition system for application in preventive medicine,” Telemed.e-Health, vol. 16, no. 4, pp. 504–509, 2009.
[32] S. G. Hart and L. E. Staveland, “Development of NASA-TLX (TaskLoad Index): Results of empirical and theoretical research,” in HumanMental Workload, P. A. Hancock and N. Meshkati, Eds. Amsterdam,The Netherlands: North-Holland, 1988.
[33] P. Rani, J. Sims, R. Brackin, and N. Sarkar, “Online stress detectionusing psychophysiological signal for implicit human-robot cooperation,”Robotica, vol. 20, no. 6, pp. 673–686, 2002.
[34] J. McNames, T. Thong, and M. Aboy, “Impulse rejection filter for artifactremoval in spectral analysis of biomedical signals,” in Proc. 26th Annu.
KUMAR et al.: STRESS MONITORING BASED ON STOCHASTIC FUZZY ANALYSIS OF HEARTBEAT INTERVALS 759
Int. Conf. IEEE Eng. Med. Biol. Soc., San Francisco, CA, Sep. 2004,pp. 145–148.
[35] M. P. Tarvainen, P. O. Ranta-Aho, and P. A. Karjalainen, “An advanced de-trending method with application to HRV analysis,” IEEE Trans. Biomed.Eng., vol. 49, no. 2, pp. 172–175, Feb. 2002.
[36] C. Yang and T. Kuo, “Assessment of cardiac sympathetic regulation byrespiratory-related arterial pressure variability in the rat,” J. Physiol.,vol. 515, pp. 887–896, 1999.
[37] A. M. Bianchi, L. T. Mainardi, C. Merloni, S. Chierchia, and S. Cerutti,“Continuous monitoring of the sympatho-vagal balance through spectralanalysis,” IEEE Eng. Med. Biol. Mag., vol. 16, no. 5, pp. 64–73, Sep./Oct.1997.
Mohit Kumar received the B.Tech. degree in electri-cal engineering from the National Institute of Tech-nology, Hamirpur, India, in 1999, the M.Tech. degreein control engineering from the Indian Institute ofTechnology, Delhi, India, in 2001, the Ph.D. degree(summa cum laude) in electrical engineering from theUniversity of Rostock, Rostock, Germany, in 2004,and the degree of “Dr.-Ing. habil.” with a venia leg-endi for automation engineering from the Universityof Rostock in 2009.
He was a Research Scientist with the Institute ofOccupational and Social Medicine, University of Rostock, from 2001 to 2004.He is currently the Head of the research group “Life Science Automation—Technologies” with the Center for Life Science Automation. He took an ini-tiative in intelligent fuzzy computing to build a mathematical bridge betweenartificial intelligence and real-world applications. His research interests includemodeling of the complex and uncertain processes with applications to life sci-ence.
Sebastian Neubert received the Diploma and Ph.D.degrees in electrical engineering from the Universityof Rostock, Rostock, Germany, in 2006 and 2011,respectively.
Since 2007, he has been a Research Scientist withthe Institute of Preventive Medicine, University ofRostock. His research interests include real-time mo-bile measurements of physiological parameters.
Sabine Behrendt received the Diploma degreein mathematics from Greifswald University, Greif-swald, Germany, in 2008.
Since 2008, she has been a Research Scientistwith the Institute of Preventive Medicine, Universityof Rostock, Rostock, Germany. Her research interestsinclude process information management systems.
Annika Rieger studied sports science with the Uni-versity of Rostock, Rostock, Germany, from 2003 to2008.
Since 2009, she has been a Research Scientistwith the Institute of Preventive Medicine, Univer-sity of Rostock. Her research interests include work-load/stress investigations.
Matthias Weippert received the First State Exam-ination for lectureship in biology and physical ed-ucation from the University of Rostock, Rostock,Germany, in 2003, where he received the Ph.D. de-gree in medicine in 2009.
He was a Research Scientist with the Instituteof Occupational and Social Medicine, University ofRostock, from 2004 to 2005, where he has been withthe Institute of Preventive Medicine since 2006. Hisresearch interests include performance diagnosticsand stress–strain reactions in occupational and sports
medicine.
Norbert Stoll received the Diploma (Dip.-Ing.) de-gree in automation engineering and the Ph.D. de-gree in measurement technology from the Universityof Rostock, Rostock, Germany, in 1979 and 1985,respectively.
He was the Head of the Section Analytical Chem-istry with the Academy of Sciences of GDR, Cen-tral Institute for Organic Chemistry, until 1991. From1992 to 1994, he was the Associate Director of theInstitute of Organic Catalysis, Rostock. Since 1994,he has been a Professor of measurement technology
with the Engineering Faculty, University of Rostock, where he was the Directorof the Institution of Automation from 1994 to 2000. Since 2003, he has alsobeen the Vice President of the Center for Life Science Automation, Rostock.His research interests include medical process measurement, lab automation,and smart systems and devices.
Kerstin Thurow studied chemistry with the Univer-sity of Rostock, Rostock, Germany, and received theGraduate degree. Afterward, she received the Ph.D.degree from the Ludwigs-Maximilians-University,Munich, Germany (under the guidance of Prof.Lorenz), working on metal–organic sulphur com-pounds. In 1999, she received the Habilitation degreefrom the Department of Electrical Engineering, Uni-versity of Rostock.
She became a Faculty Member with the venilegendi for “Measurement and Control.” In October
1999, she became Germany’s Youngest University Professor and obtained theWorldwide Unique Professorship for “Laboratory Automation.” In December2004, she was appointed novel professorship for “Life Science Automation”;this chair is connected with the Center for Life Science Automation (CELISCA)Management Directorate, Rostock. She is currently the Managing Director ofthe Institute of Automation, University of Rostock. She is also the Managing Di-rector for the CELISCA and the President of the Institute for Measurement andSensorsystems. As a Founding Member and President of the Rostock-Raleighe.V.—a Sister City Association—she is striving for cultural, sportive, and scien-tific and economical relations to one of the most important Life Science Regionsin the United States.
Dr. Thurow received the highly renowned Joachim-Jungius-Award of Sci-ence in 2004, in addition to many awards, such as for the foundation of a start-upcompany Amplius—Screening Technologies & Analytical Measurement.
Regina Stoll received the Dip.-Med. degree inmedicine, the Dr.med. degree in occupationalmedicine, and the Dr.med.habil. degree in occupa-tional and sports medicine from the University ofRostock, Rostock, Germany, in 1980, 1984, and 2002,respectively.
She is currently the Head of the Institute of Pre-ventive Medicine, University of Rostock. She is aFaculty Member with the Medicine Faculty and Fac-ulty Associate with the College of Computer Scienceand Electrical Engineering, University of Rostock.
She also holds the Adjunct Faculty Member position with the Department ofIndustrial Engineering, North Carolina State University, Raleigh. Her researchinterests include occupational physiology, preventive medicine, and cardiopul-monary diagnostics.