+ All Categories
Home > Documents > Stress testing the banking system: A case study

Stress testing the banking system: A case study

Date post: 18-Dec-2021
Category:
Upload: others
View: 1 times
Download: 0 times
Share this document with a friend
17
1 Stress testing the banking system: A case study This case study covers the topic of system-wide stress testing of banking systems. The purpose of this case study is to provide policy analysts and policymakers with an introduction to issues, techniques, and challenges related to financial sector analysis. Given the vastness of this topic, the case study focuses on only the basics of financial sector analysis. The case study assumes that course participants are making an assessment of macrofinancial linkages and financial stability. This case study provides participants with “hands-on” experience with several analytical approaches and tools associated with elements of macro stress testing.
Transcript

1

Stress testing the banking system: A case study

This case study covers the topic of system-wide stress testing of banking systems. The

purpose of this case study is to provide policy analysts and policymakers with an introduction

to issues, techniques, and challenges related to financial sector analysis. Given the vastness of

this topic, the case study focuses on only the basics of financial sector analysis. The case

study assumes that course participants are making an assessment of macrofinancial linkages

and financial stability. This case study provides participants with “hands-on” experience with

several analytical approaches and tools associated with elements of macro stress testing.

2

I. Macroeconomic and Financial Sector Developments

Part I provides information for making initial assessments of a country’s macroeconomy and

its financial system. The objectives of this section are to:

Identify possible macroeconomic and/or financial market “trigger events”,

Construct a short-term, macroeconomic scenario that is likely to develop in response to

the trigger events,

Assess the stage of development of the financial system, and

Discuss potential risks that may arise in financial sector as a result of the macro scenario.

A. Overview of the economy

The real sector

Following a recession in 2006, real GDP growth averaged 4.6 percent over the 2007-2012

period. GDP growth is projected at 4.6 and 4.7 percent for 2013 and 2014, respectively. GDP

growth has been driven by accelerating growth in private consumption and investment in

recent years and has been accompanied by rapid expansions in domestic credit and imports.

Domestic demand growth is seen to moderate in coming years, though remaining high as a

share of GDP. With strong demand for imports, an underperforming export sector, and higher

international energy prices, the current account deficit remains quite large – at around 8

percent of GDP.

Figure 1: GDP growth, 2005-2013 (in percentage points)

Headline inflation has been contained to 2-4 percent by a combination of a broadly stable

exchange rate and limited pass-through of rising international energy prices. Meanwhile, the

-2

-1

0

1

2

3

4

5

6

2005 2006 2007 2008 2009 2010 2011 2012 2013

3

unemployment rate remains high – at around 12 percent. The unemployment has fallen

somewhat in recent years, reflecting both an increase in employment growth but also a

worrisome drop in labour market participation, most likely the result of persistently-high

unemployment and the generous structure of welfare benefits.

Although there have been some improvements in the business environment, several

impediments remain that significantly constrain economic growth:

There are high, numerous, and non-transparent local fees for businesses,

Property-related legal uncertainties are high, specifically land ownership issues and

enforcement of property rights,

Some observers also see complex local government regulations as conducive to

corruption, and

Bankruptcy and contract enforcement procedures remain very slow.

Fiscal policy

The fiscal deficit has been substantially reduced, from 6.1 percent of GDP in 2009 to 2.8

percent in 2012. This reduction was largely due to continued pension reform, wage

moderation, and investment cuts. In addition, a large state-owned enterprise scaled back its

quasi-fiscal activity. The authorities’ target for the 2007 fiscal deficit is 2.8 percent of GDP,

but spending pressures are likely to continue with an upcoming election cycle.

The state’s presence in many areas of economic activity remains significant. Analysts are

strongly calling for further fiscal consolidation and reducing the size of government, which

would have a number of mutually reinforcing benefits to the economy:

Boosting economic efficiency by shifting activity to the private sector,

Reducing the large current deficit and ensuring that public and external debt are on a

sustainable path,

In light of a fixed exchange rate and limited monetary policy, enhancing the flexibility of

fiscal policy to address possible economic shocks, and

Reducing the probability that continent liabilities associated with quasi-fiscal activities

will be realised.

Monetary policy and the financial sector

4

The country has maintained a tightly managed floating exchange rate. However, limited

exchange rate volatility created complacency regarding exchange rate risk, leading to very

large, unhedged borrowings in foreign currency.

Figure 2: Lending and deposit rates, 2005-2013 (in percentage points)

Lending and deposit rates have also remained subdued in recent years. Bank restructuring and

privatization have strengthened the financial sector, resulting in strong credit expansion and

credit market growth. These developments – in conjunction with a stable exchange rate and

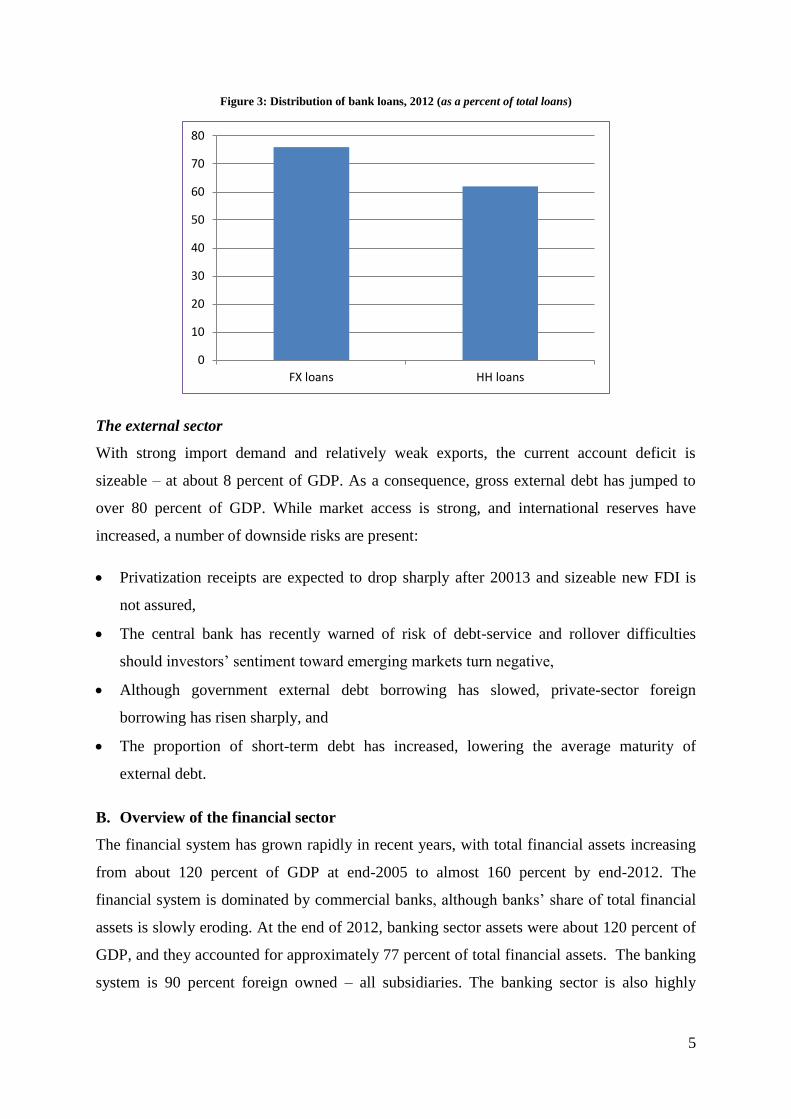
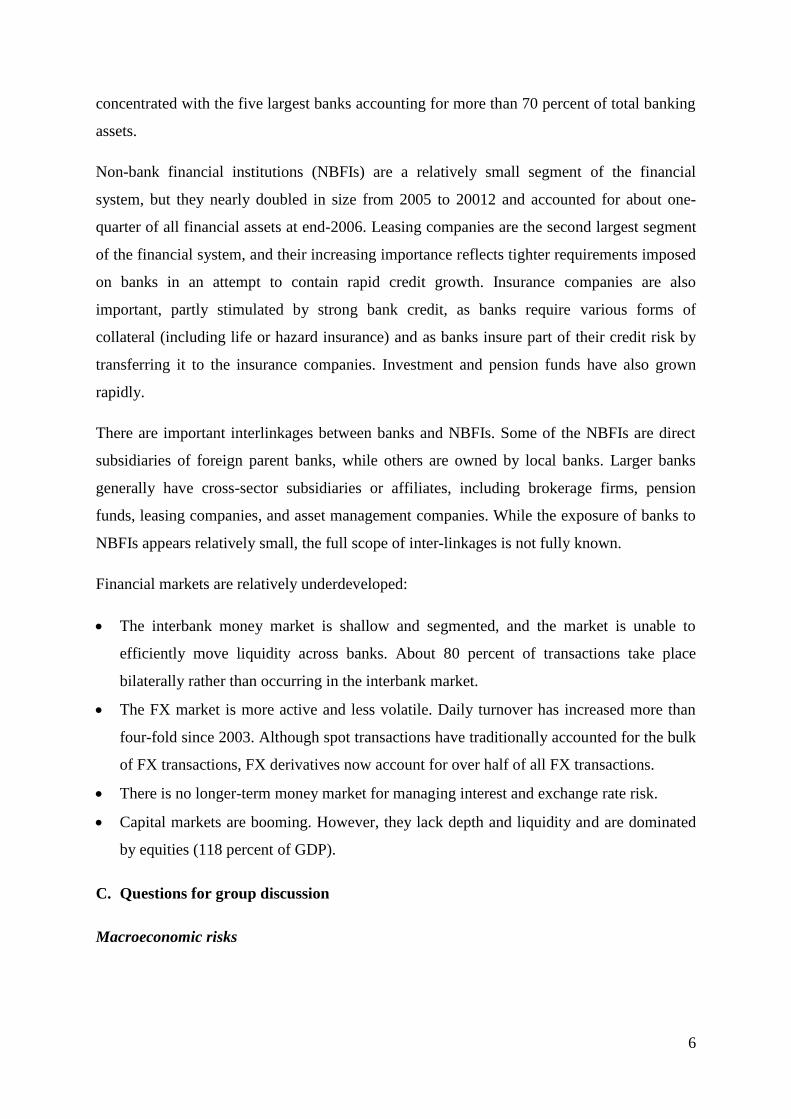
relatively low and stable borrowing rates – also raise some concerns: Nearly 70 percent of

banks loans are linked or indexed to foreign currencies, and more than 80 percent of loans

have variable rates. The share of all bank loans to households increased significantly from 33

percent in 2003 to 55 percent in recent months. Mortgage loans now comprise about 40

percent of household borrowing, and the share of lending to low and middle-income

households is growing.

0

2

4

6

8

10

12

14

16

18

2005 2006 2007 2008 2009 2010 2011 2012 2013

5

Figure 3: Distribution of bank loans, 2012 (as a percent of total loans)

The external sector

With strong import demand and relatively weak exports, the current account deficit is

sizeable – at about 8 percent of GDP. As a consequence, gross external debt has jumped to

over 80 percent of GDP. While market access is strong, and international reserves have

increased, a number of downside risks are present:

Privatization receipts are expected to drop sharply after 20013 and sizeable new FDI is

not assured,

The central bank has recently warned of risk of debt-service and rollover difficulties

should investors’ sentiment toward emerging markets turn negative,

Although government external debt borrowing has slowed, private-sector foreign

borrowing has risen sharply, and

The proportion of short-term debt has increased, lowering the average maturity of

external debt.

B. Overview of the financial sector

The financial system has grown rapidly in recent years, with total financial assets increasing

from about 120 percent of GDP at end-2005 to almost 160 percent by end-2012. The

financial system is dominated by commercial banks, although banks’ share of total financial

assets is slowly eroding. At the end of 2012, banking sector assets were about 120 percent of

GDP, and they accounted for approximately 77 percent of total financial assets. The banking

system is 90 percent foreign owned – all subsidiaries. The banking sector is also highly

0

10

20

30

40

50

60

70

80

FX loans HH loans

6

concentrated with the five largest banks accounting for more than 70 percent of total banking

assets.

Non-bank financial institutions (NBFIs) are a relatively small segment of the financial

system, but they nearly doubled in size from 2005 to 20012 and accounted for about one-

quarter of all financial assets at end-2006. Leasing companies are the second largest segment

of the financial system, and their increasing importance reflects tighter requirements imposed

on banks in an attempt to contain rapid credit growth. Insurance companies are also

important, partly stimulated by strong bank credit, as banks require various forms of

collateral (including life or hazard insurance) and as banks insure part of their credit risk by

transferring it to the insurance companies. Investment and pension funds have also grown

rapidly.

There are important interlinkages between banks and NBFIs. Some of the NBFIs are direct

subsidiaries of foreign parent banks, while others are owned by local banks. Larger banks

generally have cross-sector subsidiaries or affiliates, including brokerage firms, pension

funds, leasing companies, and asset management companies. While the exposure of banks to

NBFIs appears relatively small, the full scope of inter-linkages is not fully known.

Financial markets are relatively underdeveloped:

The interbank money market is shallow and segmented, and the market is unable to

efficiently move liquidity across banks. About 80 percent of transactions take place

bilaterally rather than occurring in the interbank market.

The FX market is more active and less volatile. Daily turnover has increased more than

four-fold since 2003. Although spot transactions have traditionally accounted for the bulk

of FX transactions, FX derivatives now account for over half of all FX transactions.

There is no longer-term money market for managing interest and exchange rate risk.

Capital markets are booming. However, they lack depth and liquidity and are dominated

by equities (118 percent of GDP).

C. Questions for group discussion

Macroeconomic risks

7

1. Discuss recent economic developments in the case study country. What concerns do you

have? Based on your concerns, construct an “exceptional but plausible” scenario that

could test the vibrancy of the financial system.

2. How does this scenario translate into changes in the following types of financial risk:

Interest rate risk,

Exchange rate risk,

Liquidity risk,

Credit risk, and

Solvency risk?

3. Assuming that you had detailed data on balance sheets of households, firms, the

government, and banks, what types of mismatches would you focus your attention on?

4. Are you more concerned about direct or indirect risks for the financial system?

Financial market structure

1. How important are banks in this economy? How important are foreign-owned banks

relative to domestically-owned banks? How is this information useful for assessing the

importance of macroeconomic risks to the financial system?

2. In your view, how important are the interlinkages between banks and non-bank FIs?

8

II. Evaluating financial stability

The main objectives of this section are to:

Become familiar with how sectoral balance sheets are constructed and their potential

limitations for analysis of direct and indirect risks within various sectors,

Understand how to identify balance sheet mismatches and how these imbalances may also

imply risks for other sectors of an economy,

Identify possible risks and vulnerabilities that are associated with balance sheet

mismatches in particular sectors of the economy,

Identify other sectors of the economy that may be indirectly exposed to these mismatches

because of intersectoral linkages,

Discuss strategies for further analysis of macro and financial stability and how the

stability of the real and financial sectors are inter-related.

Become familiar with the purpose and drawbacks of financial soundness indictors (FSIs),

Understand the mechanics of conducting a stress test of the financial sector, including the

assumptions and simplifications necessary to make a stress test feasible, and

Conduct a reasonable stress test of banks, based on the result of analysis in Parts I and II

of the case study.

A. The balance sheet approach

The balance sheet approach (BSA) views the economy as a stylized system of balance sheets

with a balance sheet for each the economy’s main sectors – government, financial,

nonfinancial, and external. The BSA differs from the more traditional approach that looks at

economic and financial flows – aggregate demand and supply, the fiscal balance, the current

account balance, and capital flows. Instead, the BSA examines stocks, primarily the assets

and liabilities of various sectors at a certain point in time. The two approaches are

complementary, of course, since stocks are merely an accumulation of past flows. However,

focusing only on flow variables ignores the various risks and vulnerabilities that can be

associated with stocks.

Balance sheet data were collected for 2005 and 2012. The data are broken down by maturity

(short- and long-term) and by currency (domestic and foreign). The data are available in a

separate Excel spreadsheet called Balance Sheet Data.

B. Indicators of financial sector soundness

9

Table provides a number of FSIs for assessing the health of the country’s households,

corporations and banks.

Table 1: Selected FSIs for case study country

2009 2010 2011 2012

CORE SET

Commercial Banks

Regulatory capital to total risk-weighted assets 17.4 16.5 16.0 15.2

Regulatory tier one capital to total risk-weighted assets 15.2 14.1 13.7 13.5

NPLs net of loan loss provisions to capital 19.6 22.6 19.0 16.7

NPLs to total gross loans 10.2 8.9 7.5 6.2

Sectoral distribution of loans to total loans

Non-financial corporations 45.0 41.0 39.5 38.5

Households 44.5 47.8 49.5 49.7

Other sectors 10.5 11.2 10.6 11.7

Return on assets 1.6 1.6 1.7 1.6

Return on capital 13.7 14.1 16.1 15.1

Net interest income to gross income 56.3 58.9 56.6 57.9

Non-interest expenses to gross income 72.9 72.7 68.0 66.7

Liquid assets to total assets 17.6 18.7 16.1 11.5

Liquid assets to short-term liabilities 57.8 66.8 62.0 42.1

Net open position in foreign exchange to capital n.a. 24.7 18.2 7.4

ENCOURAGED SET

Commercial banks

Capital to assets 9.5 8.9 8.6 9.0

Large exposures to capital 151.3 128.4 161.4 122.6

Geographical distribution of loans to total loans

Residents 99.5 99.6 99.8 99.7

Non-residents 0.5 0.4 0.2 0.3

Gross asset position in derivatives to capital n.a. n.a. 0.8 0.6

Gross liability position in derivatives to capital n.a. n.a. 1.2 1.0

Non-interest income to total income 43.7 41.1 43.4 42.1

Personnel expenses to non-interest expenses 33.9 32.5 32.7 34.1

Spread between domestic lending and deposit rates 11.0 10.1 9.9 9.5

Spread between foreign exchange lending and deposit rates 5.5 5.0 4.2 3.8

Non-interbank loans to non-interbank deposits 80.9 87.0 92.2 10.1

Foreign currency-denominated loans to total loans 75.8 70.9 76.7 78.5

Foreign currency-denominated liabilities to total liabilities 76.0 76.1 78.1 78.8

Net open position in equities to capital n.a. n.a. 0.3 0.2

Non-financial corporations

Total debt to equity 44.5 40.9 45.9 49.3

Return on equity (corporates) 3.6 1.8 2.7 4.4

Net foreign exchange exposure to equity 8.0 10.0 10.9 12.4

Households

10

2009 2010 2011 2012

Household debt to GDP 24.7 28.9 31.8 35.5

Household debt service and principal payments to income 4.6 6.1 6.0 6.1

Real estate markets

Residential real estate prices (annual percentage increase) 9.2 0.9 15.9 6.4

Residential real estate loans to total loans 13.0 15.0 16.8 17.9

OTHER INDICATORS

Loan-loss provisions to NPLs 68.0 60.6 62.3 60.0

Change in credit to GDP ratio 13.5 8.3 6.9 11.3

Net interest income to average total assets 3.3 3.4 3.0 2.9

Non-interest expenses to average total assets 4.2 4.1 3.6 3.3

Loans to assets 53.0 53.9 54.7 58.5

Liquid assets to total deposits 24.6 26.6 23.8 17.4

Net claims on government to total assets 16.8 13.6 9.9 11.6

Foreign currency deposits to total deposits 74.4 73.1 74.2 73.1

C. A framework for stress testing banks

This section describes the framework used in this case study to conduct stress tests of banks

in the case study. This framework is implemented in a separate Excel spreadsheet called Bank

Stress Tester 1.0.

The framework employs a top-down approach to stress testing. Balance sheet and income

statement data are provided for the 10 largest banks, which account for more than 90 percent

of total banking assets. The case study focuses on credit risk. Once participants enter a set of

macro shocks, these shocks are translated automatically into changes to bank balance sheets.

Changes in interest rates and exchange rates have a direct effect on banks’ balance sheets,

and the sign and size of these changes depend on the characteristics of banks’ portfolios. In

addition, changes in interest rates, exchange rates, GDP growth, and the unemployment rate

have indirect effects on bank balance sheets as a result of a change in credit quality (e.g., a

change in loan loss reserves).

Finally, the results of the stress test are summarized with graphs that: (i) compare the post

shock capital adequacy ratios (CAR) of various categories of banks with their CARs under

the baseline (pre-shock) scenario; (ii) present the amount of capital (as a percent of GDP) that

will be necessary to recapitalize banks; and (iii) assess the systemic importance of the test by

illustrating the concentration of “bad assets” in the banking system, by bank category.

D. Mapping macro shocks into changes in credit quality

11

This section of the study describes a simple “back of the envelope” approach to calculating

changes to bank capital as a result of changes in the macroeconomy.

Direct interest rate risk

Calculating the direct effects of an interest rate shock on the balance sheet and income

statements of banks is a very complicated procedure that requires detailed knowledge of

every asset and liability of the bank.

First, it is assumed that there are no capital losses associated with assets and liabilities that

are subject to repricing within a year. In other words, these short-term assets and liabilities

are immediately rolled over at the new market interest rate. In this case, the net change to net

interest income (and to capital) in response to a change in the short-term interest rate is:

ΔNII = GAPs * ΔRs

where NII is net interest income, GAPs is net assets subject to repricing within a year, and Rs

is the short-term interest rate (expressed in basis points).

Second, it is assumed that the average duration for assets and liabilities subject to repricing

after one year is five (5) years. It is also assumed that there is no short-term change to income

for these longer-term assets and liabilities. Therefore the capital losses associated with a

change in the long-term interest rate is:

ΔC = -DUR * GAPL *ΔR L

where C is equity capital, DUR is the average duration of net long-term assets and liabilities

(assumed to be five), GAPL is net assets subject to repricing after more than one year, and RL

is the long-term interest rate (expressed in basis points).

Direct foreign exchange rate risk

Let F denote the net open position in foreign exchange and C the amount of regulatory

capital, both denominated in local currency units. Let e denote the exchange rate expressed in

terms of foreign currency per unit of domestic currency. A change in the exchange rate

(positive changes correspond to appreciations) leads to a proportional decrease in the

domestic currency value of the net open position:

ΔF / F = - Δe / e

12

If we assume that a decline in the net open position translates directly into a decline in capital

(due to a change in profits) and that risk-weighted assets are not affected by the exchange rate

change, then the change in capital is simply:

ΔC = -F Δe / e

Credit risk

The case study focuses on four indirect sources of changes in credit quality as a result of

changes in macro variables – real GDP growth (%Δy), the unemployment rate (UR), the

long-term interest rate (RL), and the growth rate of the exchange rate (%Δe).

One way to model credit risk is to simply regress an aggregate bank balance sheet ratio –

usually NPL-to-total loans or LLR-to-total loans – on a set of macro variables. Since both of

these ratios is confined to a range of (0, 1), a linear regression with the ratio the dependent

variable would result in non-normal errors. Instead, using a logit transformation of the ratio:

logit (x) = x / (100 - x)

results in a dependent variable that can be used in linear regressions.

IMF (2007b) reports such regressions for modelling loan loss reserves in a number of

countries in Eastern and Central Europe. The regressions have the following logit

specification:

logit(LLR/TL) it = α 0 + ρ logit(LLR/TL) it-1 + α 1 % Δy it + α 2 UR it + α 3 R it + α 4 % Δe it +

ηit

where LLR is loan-loss reserves, TL is total loans, and ηit is a white-noise error.

To calculate the effects of a change in one of the right-hand side variables – call it z – on loan

loss reserves, take a derivative of the above equation with respect to z:

ΔLLR = TL * α z / (1- ρ) * ( ̅ ̅

) * Δz

where ̅ is the average LLR/TL ratio in the data sample (equal to seven(7)).

Several specifications of the regression were estimated, and a summary of the specific

coefficients are shown in the table below:

13

Table 2: Estimates of coefficients

Variable Coefficient

Loan-loss reserves/loans t-1 0.706**

(24.24)

Real GDP growth t-1 -0.0334**

(-2.986)

Unemployment rate t 0.0173**

(3.655)

Exchange rate change t -0.34500

(-1.432)

Long-run interest rate t 0.0109*

(2.416)

R-squared

z-statistics in parentheses

**p<0.01, *p<0.05, +p<0.1

0.688

Note that some of the coefficients are insignificant, and others have the “wrong” sign. This

could be the result of several factors. First, this set of countries have had very little volatility

in interest rates, exchange rates, and unemployment rates in recent years, making it difficult

to capture the relationship between loan loss reserves and the macro environment. In

addition, banks and bank supervisors in different countries may have different responses to

changes in the macro environment, while the panel regression is explicitly assuming that their

responses are relatively the same.

E. Questions for group discussion

The following questions are based on the data in the Excel spreadsheet called Balance

Sheet Data.

1. Which sectors are borrowing abroad? Are there any sectors that have positive net claims

on non-residents? Do you have any concerns about these overall developments in the

external sector? Based on your concerns, what sectors would you investigate next and

what would you be looking for?

14

2. The “Non-Residents” worksheet also provides some information about the maturity and

the currency structure of the external position. What can you conclude about the average

maturity structure of external debt? Is there any useful information regarding the currency

structure in the table?

3. The worksheet titled “General Government” provides data on net financial claims of the

government on other economic sectors. What do these data tell you about the public

sector? What key concerns do you have at this point in your analysis?

4. Using the worksheet “Private Sector”, answer the same questions as in Question 3.

5. The worksheet titled “Financial Sector” provides data on net financial claims of the

financial sector.

Banks have significantly higher claims on the central bank and the general

government. What could account for this?

On the other hand, banks have net liabilities to the private sector? What does this

imply about the relative composition of bank liabilities and assets?

What observations can you make about banks’ obligations to non-residents?

6. What do the following aspects of the financial sector tell you about possible risks and

vulnerabilities:

Long-term versus short-term claims?

Foreign-currency versus domestic-currency claims?

Long-term versus short-term domestic-currency claims?

7. What concerns do you have about the financial sector at this point in your analysis?

8. Your next task will be to design a stress test of the banks. Using the information you

gained so far, what will be your focus in terms of areas of risks and vulnerabilities in the

financial sector, and what will be a reasonable set of trigger events (macro shocks) to

assess the importance of these vulnerabilities?

Financial soundness indicators

1. Review the set of FSIs for banks. Qualitatively, what do the various indicators tell you

about risks in the banking system? Based on these FSIs, do you see any vulnerabilities to

the various types of risks?

2. What drawbacks do these indicators have for assessing future financial soundness?

3. Review the FSIs for the private sector. Are there any indicators that raise “red flags” as

possible areas of vulnerability? Do they suggest any threats to the banking system?

15

Stress test exercise

1. The Excel workbook Bank Stress Tester 1.0 contains all information necessary to carry

out various stress tests, and it is organized as follows:

“A. Data”: Contains balance sheet and income statement data for the 10 largest banks,

as well as a number of financial soundness indicators. Data is provided for individual

banks and for subtotals based on bank size

“B. Assumptions”: Assumptions for the stress test are entered in the sheet.

“C. GDP Shock”, “D. UR Shock”, “E. IR Shock”, and “F. ER Shock”: These

worksheets calculate the direct and indirect effects of various shocks based on the

structure of the banking system and shows the effects of individual shocks on bank

capital and CARs (details of the calculations are presented in section F.)

“G. Scenario”: Summarises the aggregate results of the full scenario.

2. Examine the sheets associated with calculating the effects of the various macro shocks.

What assumptions are being used? What simplifications are being made to make the

calculations? Are they reasonable? What type of information would you need to improve

the accuracy of the calculations?

3. Familiarize yourself with the “G. Scenario” worksheet. Note how the effects of the

shocks are being aggregated. Why might this approach underestimate the aggregate

effects of all shocks?

4. Once you are comfortable with the stress test framework, enter the changes in the macro

variables for your stress test scenario derived in Parts I and II of the case study. (Make

sure you keep a clean copy of the stress testing worksheet as your proceed!)

5. What are the effects of individual shocks on bank capital, risk-weighted assets, and

CARs? How many banks fall below the minimum CAR as a result of the shocks? Are

these banks small, medium, or large banks? Do these results seem reasonable? Why or

why not?

6. What are the aggregate effects of the stress test scenario on bank capital, risk-weighted

assets, and CARs? Do these results seem reasonable? Why or why not? How would you

assess the overall impact of your scenario? Are you concerned about the stability of the

banking system? If so, where is the focus of your concern?

16

III. REFERENCES

Allen, Mark, Christoph Rosenberg, Christian Keller, Brad Setser, and Nouriel Roubini, 2002,

“A Balance Sheet Approach to Financial Crisis,” IMF Working Paper #210, Washington:

International Monetary Fund.

Bernanke, Ben, and Mark Gertler, 1989, “Agency Costs, Net Worth, and Business Cycle

Fluctuations,” American Economic Review, Volume 79, pgs 14-31.

Cihak, Martin, 2007, “Introduction to Applied Stress Testing,” IMF Working Paper #59,

Washington: International Monetary Fund.

Cihak, Martin, and Klaus Schaeck, 2007, “How Well Do Aggregate Bank Ratios Identify

Banking Problems?” IMF Working Paper #275, Washington: International Monetary Fund.

Fisher, Irving, 1933, “The Debt-Deflation Theory of Great Depressions,” Econometrica,

Volume 1 (October), pgs. 337-57.

International Monetary Fund, 2003, “Financial Sector Soundness Indicators—Background

Paper,” Washington: International Monetary Fund.

International Monetary Fund, 2007a, “Croatia: Staff Report for the 2006 Article IV

Consultation,” Country Report #81, Washington: International Monetary Fund.

International Monetary Fund, 2007b, “Croatia: Selected Issues Papers for the 2006 Article IV

Consultation,” Country Report #82, Washington: International Monetary Fund.

International Monetary Fund, 2008, “Croatia: Financial System Stability Assessment—

Update,” Country Report #160, Washington: International Monetary Fund.

Jones, Matthew T., Paul Hilbers, and Graham Slack, 2004, “Stress Testing Financial

Systems: What to Do When the Governor Calls,” IMF Working Paper #127, Washington:

International Monetary Fund.

Kiyotak, Nobuhiro, and John Moore, 1997, “Credit Cycles,” Journal of Political Economy,

Volume 105 (April), pgs. 211-48.

Krugman, Paul, 1999, “Balance Sheet Effects, the Transfer Problem, and Financial Crises,”

International Finance and Financial Crises: Essays in Honor of Rober P. Flood, Jr. (edited

by Peter Isard, Assaf Razin, and Andrew Rose), Kluwer Academic Publishers, Boston.

17

Levine, Ross, 2004, “Finance and Growth: Theory and Evidence,” [Unpublished working

paper]. 43

Lipschitz, Leslie, 2007, “Wising up about Finance,” Finance and Development, Volume 44,

Number 1 (March), Washington.

Mathisen, Johan, and Anthony Pellechio, 2006, “Using the Balance Sheet Approach in

Surveillance: Framework, Data Sources, and Data Availability,” IMF Working Paper #100,

Washington: International Monetary Fund.

Rosenberg, Christoph, Ioannis Halikias, Brett House, Christian Keller, Jens Nystedt,

Alexander Pitt, and Brad Setser, 2005, “Debt-Related Vulnerabilities and Financial Crises:

An Application of the Balance Sheet Approach to Emerging Market Countries,” IMF

Occasional Paper #240, Washington: International Monetary Fund.

The World Bank and the International Monetary Fund, 2005, Financial Sector Assessment: A

Handbook, Washington: International Monetary Fund.


Recommended