DOI 10.1140/epje/i2006-10077-1 Eur. Phys. J. E (2006) T HE EUROPEAN P HYSICAL JOURNAL E Stress transmission in wet granular materials V. Richefeu a , F. Radja¨ ı, and M.S. El Youssoufi LMGC, UMR CNRS 5508, Cc. 048, Universit´ e Montpellier 2, Place Eug` ene Bataillon, 34095 Montpellier Cedex 5, France Received 29 September 2006 and Received in final form 1 December 2006 Published online: 13 February 2007 – c EDP Sciences / Societ`a Italiana di Fisica / Springer-Verlag 2007 Abstract. We analyze stress transmission in wet granular media in the pendular state by means of three- dimensional molecular-dynamics simulations. We show that the tensile action of capillary bonds induces a self-stressed particle network organized in two percolating “phases” of positive and negative particle pres- sures. Various statistical descriptors of the microstructure and bond force network are used to characterize this partition. Two basic properties emerge: 1) the highest particle pressure is located in the bulk of each phase; 2) the lowest pressure level occurs at the interface between the two phases, involving also the largest connectivity of the particles via tensile and compressive bonds. When a confining pressure is applied, the number of tensile bonds falls off and the negative phase breaks into aggregates and isolated sites. PACS. 45.70.-n Granular systems – 83.80.Fg Granular solids 1 Introduction The particle scale origins of the strength and flow prop- erties of dry granular materials has been a subject of in- tensive research since several decades. It is now generally admitted that the scale-up of particle interactions to the macroscopic scale is more subtle than initially expected because of mediation by a disordered microstructure with a rich statistical behavior [1,2]. Considerable work has thus been devoted to characterize the microstructure and its manifestations in the form of highly inhomogeneous distributions of interparticle forces and fluctuating parti- cle velocities [3–13]. The bimodal character of the force network [14], exponential probability functions of strong forces (force chains) [15, 16, 8, 17], and clustering of dissipa- tive contacts are recent examples of this non-trivial phe- nomenology [18]. Insightful analogies have also emerged with other fields such as jamming transition in colloidal matter [19–22], slow relaxation in glassy materials [23], and fluid turbulence [12]. Most of our present knowledge on the subject excludes, however, cohesive bonding between particles. Although one expects strong similarities due to the common granu- lar microstructure, the presence of cohesion brings about new mechanisms that tend to transform the nature of the problem. At the macroscopic scale, the shear strength needs to be described in terms of the Coulomb cohesion in addition to the internal angle friction [24]. On the other hand, the interplay between cohesive bonds, friction and rotation frustration of the particles leads to novel features such as particle aggregation that control static and dy- a e-mail: [email protected]namic properties of the material [25,26]. A well-known example is the wet sand where small amounts of water affect significantly the bulk behavior [27–29]. The phe- nomena arising from cohesion are of particular interest to the processing (compaction, granulation, ...) of fine pow- ders [30,31]. It seems thus that a systematic investigation of the microstructure in cohesive granular media should open new scopes for modeling granular materials. In this paper, we analyze the force network in wet granular assemblies of spherical particles. We are inter- ested in a basic question: how do cohesive grains keep together to form a self-sustained structure in the absence of confinement (no container and no confining stresses)? The packing can reach an equilibrium state as a result of attraction forces and elastic repulsion between particles without or with self-stressed structures. While the parti- cles are balanced in both cases, the attraction force at each contact is exactly balanced by an elastic repulsion force in the first case. In contrast, in the second case all contacts are not in their equilibrium state due to steric hinderance between particles. Hence, a network of tensile and com- pressive forces is formed inside the packing. These self- equilibrated forces can be induced through various loading histories such as consolidation [32,33] or differential par- ticle swelling [34]. In wet granular media in the pendular state, the self-stresses appear naturally due to the tensile action of capillary bonds bridging the gaps between neigh- boring particles within a debonding distance. We focus in this paper on the structure of these self-stresses induced by capillary bonds. We use the 3D molecular-dynamics method in which capillary attraction between spherical particles is imple- mented as a force law expressing the capillary force as
Transcript
DOI 10.1140/epje/i2006-10077-1
Eur. Phys. J. E (2006) THE EUROPEANPHYSICAL JOURNAL E
Stress transmission in wet granular materials
V. Richefeua, F. Radjaı, and M.S. El Youssoufi
LMGC, UMR CNRS 5508, Cc. 048, Universite Montpellier 2, Place Eugene Bataillon, 34095 Montpellier Cedex 5, France
Abstract. We analyze stress transmission in wet granular media in the pendular state by means of three-dimensional molecular-dynamics simulations. We show that the tensile action of capillary bonds induces aself-stressed particle network organized in two percolating “phases” of positive and negative particle pres-sures. Various statistical descriptors of the microstructure and bond force network are used to characterizethis partition. Two basic properties emerge: 1) the highest particle pressure is located in the bulk of eachphase; 2) the lowest pressure level occurs at the interface between the two phases, involving also the largestconnectivity of the particles via tensile and compressive bonds. When a confining pressure is applied, thenumber of tensile bonds falls off and the negative phase breaks into aggregates and isolated sites.
PACS. 45.70.-n Granular systems – 83.80.Fg Granular solids
1 Introduction
The particle scale origins of the strength and flow prop-erties of dry granular materials has been a subject of in-tensive research since several decades. It is now generallyadmitted that the scale-up of particle interactions to themacroscopic scale is more subtle than initially expectedbecause of mediation by a disordered microstructure witha rich statistical behavior [1,2]. Considerable work hasthus been devoted to characterize the microstructure andits manifestations in the form of highly inhomogeneousdistributions of interparticle forces and fluctuating parti-cle velocities [3–13]. The bimodal character of the forcenetwork [14], exponential probability functions of strongforces (force chains) [15,16,8,17], and clustering of dissipa-tive contacts are recent examples of this non-trivial phe-nomenology [18]. Insightful analogies have also emergedwith other fields such as jamming transition in colloidalmatter [19–22], slow relaxation in glassy materials [23],and fluid turbulence [12].
Most of our present knowledge on the subject excludes,however, cohesive bonding between particles. Althoughone expects strong similarities due to the common granu-lar microstructure, the presence of cohesion brings aboutnew mechanisms that tend to transform the nature ofthe problem. At the macroscopic scale, the shear strengthneeds to be described in terms of the Coulomb cohesion inaddition to the internal angle friction [24]. On the otherhand, the interplay between cohesive bonds, friction androtation frustration of the particles leads to novel featuressuch as particle aggregation that control static and dy-
namic properties of the material [25,26]. A well-knownexample is the wet sand where small amounts of wateraffect significantly the bulk behavior [27–29]. The phe-nomena arising from cohesion are of particular interest tothe processing (compaction, granulation, . . .) of fine pow-ders [30,31]. It seems thus that a systematic investigationof the microstructure in cohesive granular media shouldopen new scopes for modeling granular materials.
In this paper, we analyze the force network in wetgranular assemblies of spherical particles. We are inter-ested in a basic question: how do cohesive grains keeptogether to form a self-sustained structure in the absenceof confinement (no container and no confining stresses)?The packing can reach an equilibrium state as a result ofattraction forces and elastic repulsion between particleswithout or with self-stressed structures. While the parti-cles are balanced in both cases, the attraction force at eachcontact is exactly balanced by an elastic repulsion force inthe first case. In contrast, in the second case all contactsare not in their equilibrium state due to steric hinderancebetween particles. Hence, a network of tensile and com-pressive forces is formed inside the packing. These self-equilibrated forces can be induced through various loadinghistories such as consolidation [32,33] or differential par-ticle swelling [34]. In wet granular media in the pendularstate, the self-stresses appear naturally due to the tensileaction of capillary bonds bridging the gaps between neigh-boring particles within a debonding distance. We focus inthis paper on the structure of these self-stresses inducedby capillary bonds.
We use the 3D molecular-dynamics method in whichcapillary attraction between spherical particles is imple-mented as a force law expressing the capillary force as
2 The European Physical Journal E
a function of the distance, water volume, and particlediameters. The total water volume is distributed homo-geneously between particles. The packing is analyzed atequilibrium under zero confining pressure. The main goalof our analysis is to characterize the organization of parti-cle pressures which take positive or negative values accord-ing to their positions in the network of self-equilibratedbond forces. We will see that this organization involves agenuine partition of the particles in two phases of negativeand positive pressures. In the following, we first describethe simulation method and our model of capillary cohe-sion. In Sections 3 and 4, we study in detail the probabil-ity density functions of the forces and the connectivity ofparticles via tensile and compressive bonds. Then, in Sec-tions 5 and 6 we introduce particle stresses and we analyzetheir distribution and correlation with the connectivity ofthe particles. Section 7 is devoted to the influence of ex-ternal pressure. We conclude with a discussion about themain findings of this work.
2 Numerical method
We used the molecular-dynamics (MD) method with a ve-locity Verlet integration scheme [35,36]. The force laws in-volve normal repulsion, capillary cohesion, Coulomb fric-tion, and normal damping. The normal force has threedifferent sources,
fn = fen + fd
n + fcn. (1)
The first term is the repulsive contact force dependinglinearly on the normal distance δn between the particles(Fig. 1(a)):
fen =
{−knδn, for δn < 0,
0, for δn ≥ 0,(2)
where kn is the normal stiffness. The second term repre-sents a viscous damping force depending on the normalvelocity δn:
fdn =
{2αn
√mkn δn, for δn < 0,
0, for δn ≥ 0,(3)
where m = mimj/(mi + mj) is the reduced mass of theparticles i and j, αn is a damping rate varying in the range[0, 1[ and that accounts for the rate of normal dissipationor the restitution coefficient between particles [37].
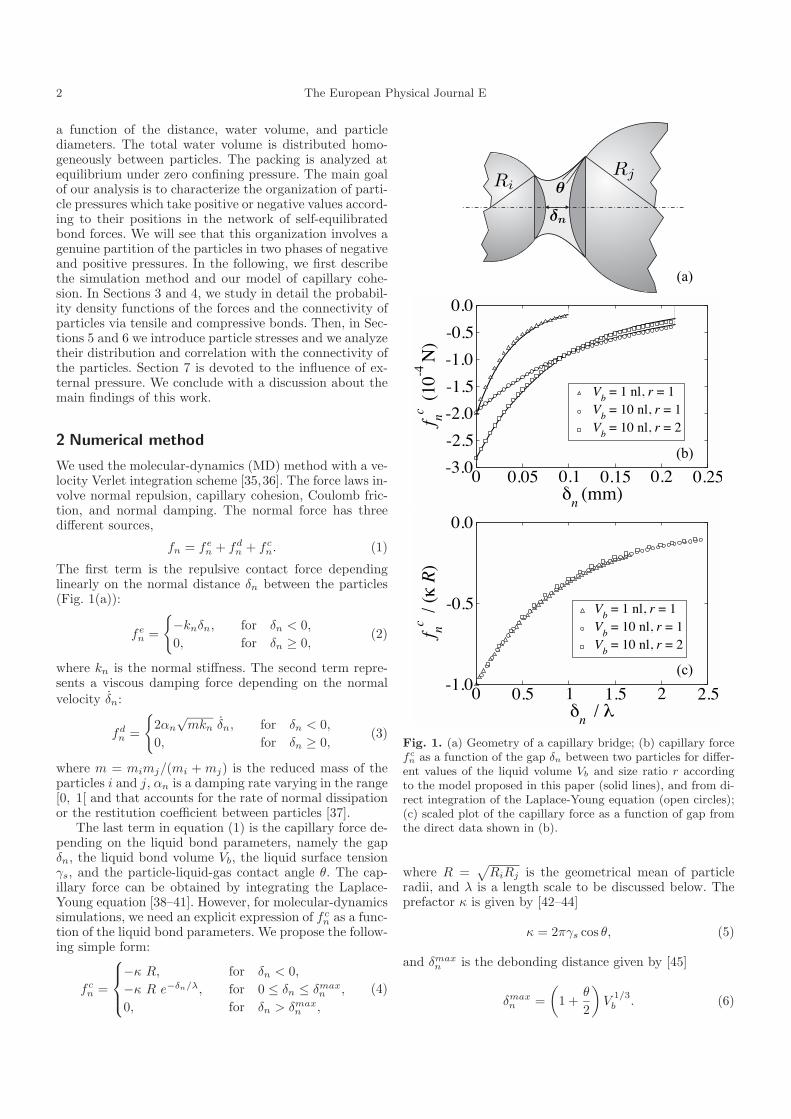
The last term in equation (1) is the capillary force de-pending on the liquid bond parameters, namely the gapδn, the liquid bond volume Vb, the liquid surface tensionγs, and the particle-liquid-gas contact angle θ. The cap-illary force can be obtained by integrating the Laplace-Young equation [38–41]. However, for molecular-dynamicssimulations, we need an explicit expression of fc
n as a func-tion of the liquid bond parameters. We propose the follow-ing simple form:
fcn =
⎧⎪⎨⎪⎩−κ R, for δn < 0,
−κ R e−δn/λ, for 0 ≤ δn ≤ δmaxn ,
0, for δn > δmaxn ,
(4)
δn
θRi
Rj
0 0.05 0.1 0.15 0.2 0.25
n (mm)
-3.0
-2.5
-2.0
-1.5
-1.0
-0.5
0.0
f nc (
10-4
N)
Vb = 1 nl, r = 1
Vb = 10 nl, r = 1
Vb = 10 nl, r = 2
(a)
0 0.5 1 1.5 2 2.5
n /
-1.0
-0.5
0.0
f nc /
(R
)
Vb = 1 nl, r = 1
Vb = 10 nl, r = 1
Vb = 10 nl, r = 2
(b)
(c)
Fig. 1. (a) Geometry of a capillary bridge; (b) capillary forcefc
n as a function of the gap δn between two particles for differ-ent values of the liquid volume Vb and size ratio r accordingto the model proposed in this paper (solid lines), and from di-rect integration of the Laplace-Young equation (open circles);(c) scaled plot of the capillary force as a function of gap fromthe direct data shown in (b).
where R =√
RiRj is the geometrical mean of particleradii, and λ is a length scale to be discussed below. Theprefactor κ is given by [42–44]
κ = 2πγs cos θ, (5)
and δmaxn is the debonding distance given by [45]
δmaxn =
(1 +
θ
2
)V
1/3b . (6)
V. Richefeu et al.: Stress transmission in wet granular materials 3
The capillary bridge is stable as long as δn < δmaxn . In the
simulations, the bridge is removed as soon as the debond-ing distance is reached, and the liquid is redistributedamong the contacts belonging to the same particle in pro-portion to grain sizes [29]. At contact (δn = 0), κR corre-sponds to the largest attraction force between two parti-cles. In the simulations presented in this paper, we assumethat particles are perfectly wettable, i.e. θ = 0. This is agood approximation for water and glass beads.
The length λ governs the exponential falloff of thecapillary force in equation (4). It should depend on theliquid volume Vb, a mean radius R′, and the ratio r =max{Ri/Rj ;Rj/Ri}. A reasonable choice is
λ = c h(r)(
Vb
R′
)1/2
, (7)
where c is a constant prefactor, h is a function depend-ing on the ratio r, and R′ is the harmonic mean (R′ =2RiRj/(Ri + Rj)). When introduced in equations (7)and (4), this form yields a nice fit for the capillary force ob-tained from direct integration of the Laplace-Young equa-tion by simply setting h(r) = r−1/2 and c � 0.9. Fig-ure 1(b) shows the plots of equation (4) for different val-ues of the liquid volume Vb and size ratio r together withthe corresponding data from direct integration. The fit isexcellent for δn = 0 (at contact) and for small gaps.
Figure 1(c) shows the same plots of the direct data asin Figure 1(b) but in dimensionless units where the forcesare normalized by κR and the lengths by λ. We see thatthe data collapse indeed on the same plot, indicating againthat the force κR and the expression of λ in equation (7)characterize correctly the behavior of the capillary bridgefor θ = 0. From the same data, we also checked that thegeometric mean R =
√RiRj introduced in equation (4)
provides a better fit than the harmonic mean 2RiRj/(Ri+Rj) proposed by Derjaguin for polydisperse particles inthe limit of small gaps [46].
For the friction force ft, we used a viscous-regularizedCoulomb law [37,47,48]
ft = −min{
γt||δt||, μ(fn − fcn)
} δt
||δt||, (8)
where γt is a tangential viscosity parameter, μ is the co-efficient of friction, and δt is the sliding velocity. In relax-ation to equilibrium, δt declines but never vanishes dueto residual kinetic energy. The equilibrium state is prac-tically reached as soon as we have γt||δt|| < μ(fn − fc
n)at all contacts. This means that the friction force is insidethe Coulomb cone everywhere in the system.
The simulations were performed with a packing com-posed of N = 8000 spheres with diameters d = 1, 1.5, and2mm, in equal numbers. The system was subjected to anisotropic pressure pm via six rigid walls and no gravity inorder to obtain a state as homogeneous as possible. Forthe same reason, the friction with the walls was set to zeroalthough wall effects cannot be fully removed. The param-eters used in the simulations are displayed in Table 1. The
Table 1. Parameters used in the simulations.
Parameter Symbol Value UnitNormal stiffness kn 1000 N/mDamping rate αn 0.8 –Tangential viscosity γt 1 Ns/mCapillary force prefactor κ 0.4 N/mGravimetric water content 0.007 –Liquid density 1000 kg · m−3
Particle density 2700 kg · m−3
Friction coefficient μ 0.4 –Time step 10−6 s
-1 0 1 2fn / f
0
10-4
10-3
10-2
10-1
100
pdf
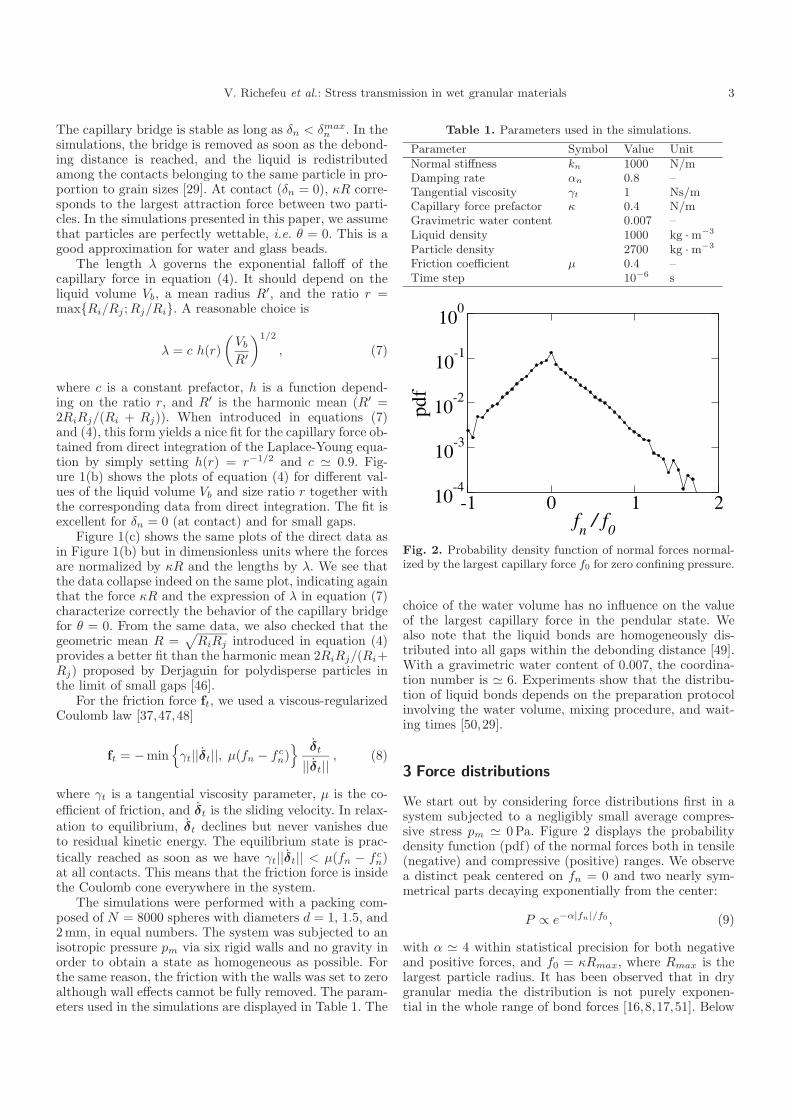
Fig. 2. Probability density function of normal forces normal-ized by the largest capillary force f0 for zero confining pressure.
choice of the water volume has no influence on the valueof the largest capillary force in the pendular state. Wealso note that the liquid bonds are homogeneously dis-tributed into all gaps within the debonding distance [49].With a gravimetric water content of 0.007, the coordina-tion number is � 6. Experiments show that the distribu-tion of liquid bonds depends on the preparation protocolinvolving the water volume, mixing procedure, and wait-ing times [50,29].
3 Force distributions
We start out by considering force distributions first in asystem subjected to a negligibly small average compres-sive stress pm � 0Pa. Figure 2 displays the probabilitydensity function (pdf) of the normal forces both in tensile(negative) and compressive (positive) ranges. We observea distinct peak centered on fn = 0 and two nearly sym-metrical parts decaying exponentially from the center:
P ∝ e−α|fn|/f0 , (9)
with α � 4 within statistical precision for both negativeand positive forces, and f0 = κRmax, where Rmax is thelargest particle radius. It has been observed that in drygranular media the distribution is not purely exponen-tial in the whole range of bond forces [16,8,17,51]. Below
4 The European Physical Journal E
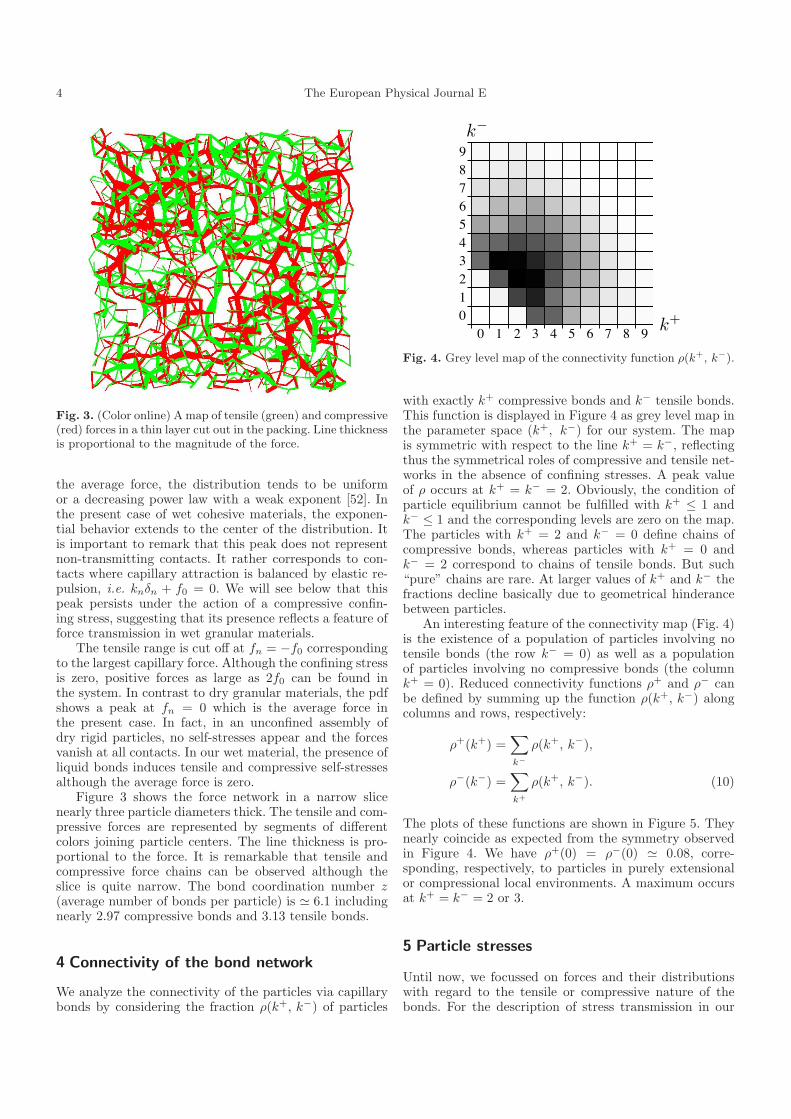
Fig. 3. (Color online) A map of tensile (green) and compressive(red) forces in a thin layer cut out in the packing. Line thicknessis proportional to the magnitude of the force.
the average force, the distribution tends to be uniformor a decreasing power law with a weak exponent [52]. Inthe present case of wet cohesive materials, the exponen-tial behavior extends to the center of the distribution. Itis important to remark that this peak does not representnon-transmitting contacts. It rather corresponds to con-tacts where capillary attraction is balanced by elastic re-pulsion, i.e. knδn + f0 = 0. We will see below that thispeak persists under the action of a compressive confin-ing stress, suggesting that its presence reflects a feature offorce transmission in wet granular materials.
The tensile range is cut off at fn = −f0 correspondingto the largest capillary force. Although the confining stressis zero, positive forces as large as 2f0 can be found inthe system. In contrast to dry granular materials, the pdfshows a peak at fn = 0 which is the average force inthe present case. In fact, in an unconfined assembly ofdry rigid particles, no self-stresses appear and the forcesvanish at all contacts. In our wet material, the presence ofliquid bonds induces tensile and compressive self-stressesalthough the average force is zero.
Figure 3 shows the force network in a narrow slicenearly three particle diameters thick. The tensile and com-pressive forces are represented by segments of differentcolors joining particle centers. The line thickness is pro-portional to the force. It is remarkable that tensile andcompressive force chains can be observed although theslice is quite narrow. The bond coordination number z(average number of bonds per particle) is � 6.1 includingnearly 2.97 compressive bonds and 3.13 tensile bonds.
4 Connectivity of the bond network
We analyze the connectivity of the particles via capillarybonds by considering the fraction ρ(k+, k−) of particles
0 1 2 3 4 5 6 7 8 90123456789
k+
k−
Fig. 4. Grey level map of the connectivity function ρ(k+, k−).
with exactly k+ compressive bonds and k− tensile bonds.This function is displayed in Figure 4 as grey level map inthe parameter space (k+, k−) for our system. The mapis symmetric with respect to the line k+ = k−, reflectingthus the symmetrical roles of compressive and tensile net-works in the absence of confining stresses. A peak valueof ρ occurs at k+ = k− = 2. Obviously, the condition ofparticle equilibrium cannot be fulfilled with k+ ≤ 1 andk− ≤ 1 and the corresponding levels are zero on the map.The particles with k+ = 2 and k− = 0 define chains ofcompressive bonds, whereas particles with k+ = 0 andk− = 2 correspond to chains of tensile bonds. But such“pure” chains are rare. At larger values of k+ and k− thefractions decline basically due to geometrical hinderancebetween particles.
An interesting feature of the connectivity map (Fig. 4)is the existence of a population of particles involving notensile bonds (the row k− = 0) as well as a populationof particles involving no compressive bonds (the columnk+ = 0). Reduced connectivity functions ρ+ and ρ− canbe defined by summing up the function ρ(k+, k−) alongcolumns and rows, respectively:
ρ+(k+) =∑k−
ρ(k+, k−),
ρ−(k−) =∑k+
ρ(k+, k−). (10)
The plots of these functions are shown in Figure 5. Theynearly coincide as expected from the symmetry observedin Figure 4. We have ρ+(0) = ρ−(0) � 0.08, corre-sponding, respectively, to particles in purely extensionalor compressional local environments. A maximum occursat k+ = k− = 2 or 3.
5 Particle stresses
Until now, we focussed on forces and their distributionswith regard to the tensile or compressive nature of thebonds. For the description of stress transmission in our
V. Richefeu et al.: Stress transmission in wet granular materials 5
0 1 2 3 4 5 6 7 8 9 10k
+, k
−0
0.1
0.2
0.3
ρ+(k
+),
ρ−(k− )
Compressive bondsTensile bonds
Fig. 5. Reduced connectivity functions at zero confining pres-sure for tensile and compressive bonds.
system we need, however, to characterize the inhomo-geneities at the scale of particles representing the smallestentities for which the equations of motion are resolvedin MD simulations. At this scale, a Cauchy stress in thesense of continuous media cannot be defined. But, it canbe shown that the so-called internal moment tensor Mhas the same properties as the Cauchy stress tensor σ,and its definition extends mathematically to discrete me-dia at all scales down to the particle scale [53,54]. For aparticle i subjected to forces f ij from its contact neighborsj at the contact points rij , the internal moment tensor M i
is given by [53]
M i =∑j �=i
f ij ⊗ rij , (11)
where ⊗ designs a tensorial product. The internal momenttensor is additive and independent of the origin of thecoordinate frame. For a collection of particles in a controlvolume V , the total internal moment M is simply the sumof the particle moments:
M =∑i∈V
M i . (12)
This tensor has the dimension of a moment and it be-comes homogeneous to a stress when divided by the con-trol volume:
σ =1V
∑i∈V
M i . (13)
At large scales (containing a sufficiently large number ofparticles), the volume is well defined and the stress tensoris equivalent to the internal moment tensor divided bythis volume. However, at the particle scale, while M i isdefined in a unique way, the choice of the volume V is amatter of convenience. It is reasonable to take into accountthe free volume Vi of each particle i, as the sum of thevolume of the particle and part of the surrounding porespace. On average, we have Vi = (1/6)πd3
i /ν, where di isthe particle diameter and ν denotes the packing fraction.
-3 -2 -1 0 1 2 3p / p
0
10-4
10-3
10-2
10-1
100
pdf
Fig. 6. Probability density function of particle pressures nor-malized by reference pressure p0 (see text) in the unconfinedpacking.
With this choice, the particle stress tensor σi takes thefollowing form:
σi = 6ν
πd3i
∑j �=i
f ij ⊗ rij . (14)
Remark that when summing this form over many particlesin a control volume as in equation (13), each contact ij en-ters the summation two times, belonging once to particle iand once to particle j. Since f ij = −f ji, the contributionof the contact ij to stress is f ij ⊗ (rij − rji), a writingthat involves the center-to-center vector instead of posi-tion vectors of the contact points if the origin of coordi-nates for each particle is chosen coincident with the centerof the particle. However, we consider here only the par-ticle stress, and at this scale, according to equation (14),only the position vectors of contact points are involved.
Here, we explore the particle pressures (average par-ticle stresses) pi = (1/3) tr σi. Each particle can take onpositive or negative pressures according to the nature ofthe forces exerted by contact neighbors. The pdf of parti-cle pressures is displayed in Figure 6. The pressures havebeen normalized by a reference pressure p0 = f0/〈d〉2.The distribution is symmetric around and peaked on zeropressure, and each part is well fit by an exponential form.Obviously, the exponential shape of particle pressure dis-tributions reflects statistically that of bond forces. In drygranular media, since the normal forces are all of the samesign (compressive) and particle pressure results from thesummation of individual bond forces on a particle, theprobability is expected to vanish as the pressure goes tozero. In contrast, Figure 6 shows that the exponentialshape of particle pressure distribution extends to the cen-ter of the pdf. This can be related to the fact that all nor-mal forces are not of the same sign. On the other hand,the zero pressure corresponds to a state where a particleis balanced under the combined action of tensile and com-pressive forces. Since such particle states are not marginalhere, they might reflect a particular organization of thestresses in the wet packing (see below).
6 The European Physical Journal E
-------
--------
++-------
+++
-----
+++++--
++++++
++++++
+++++
++++
+
0 1 2 3 4 5 6 7 8 90123456789
k+
k−
Fig. 7. (Color online) The map of partial pressures p(k+, k−).
6 Partition of particle pressures
An interesting observation about the connectivity map(Fig. 4) was the presence of particles with only tensileor only compressive bonds. In terms of particle pressures,these populations carry negative or positive pressures, re-spectively. However, this information is not rich enoughas it does not specify the pressure levels in these popula-tions. The question is how the particle pressure is locallycorrelated with the particle connectivity. For particle i,the connectivity is specified by the number k+
i of com-pressive bonds and the number k−
i of tensile bonds. Letus now consider the set S(k+, k−) of particles i such thatk+
i = k+ and k−i = k−. The partial pressure carried by
this set is the sum of particle pressures in this set dividedby the total number of particles:
p(k+, k−) =1N
∑i∈S(k+, k−)
pi . (15)
This is obviously an additive quantity so that the averagestress pm =
∑(k+, k−) p(k+, k−). The function p(k+, k−)
provides detailed information about the way particle pres-sures are distributed with respect to the bond network. Inother words, this function describes the relationship be-tween the pressure sustained by a particle and its firstneighbors with which it is bonded.
Figure 7 shows the map of partial pressures p(k+, k−)in the parameter space (k+, k−). Interestingly, we observea bipolar structure of partial pressures which is antisym-metric with respect to the line k+ = k− within statis-tical precision. The pressures are positive in the rangek+ > k− and negative in the range k+ < k−. Hence,the line k+ = k− defines the transition zone betweenthe two parts with p(k+, k− = k+) � 0. This line cor-responds to the largest population of particles accordingto the connectivity map (Fig. 4). The pressure extremaare located at (k+ = 4, k− = 0) for positive pressures andat (k+ = 0, k− = 4) for negative pressures.
The bipolar structure of the pressure map suggeststhat the particles of positive and negative pressures define
Fig. 8. A representation of the packing with particles of neg-ative (white) and positive (dark) pressures.
two separate phases throughout the system. In this pic-ture, the population of particles along the line k+ = k−corresponds to the particles at the interface between thetwo phases. This interpretation is backed by Figure 8 dis-playing the packing where the two phases are representedin dark and white. The particles of either positive or neg-ative pressure percolate throughout the system. The twophases are intimately intermingled with a large interfacebetween them. The particles at the interface belong to theline k+ = k− corresponding to a fraction 0.125 of parti-cles. The morphology of the two phases is approximatelyfilamentary with variable thickness.
The correlation between the bond connectivity andparticle pressures can alternatively be determined by con-sidering the average numbers of tensile and compressivebonds per particle, denoted z− and z+, as a function of theparticle pressure p. In order to evaluate these functions,we consider the set S(p) of particles i with a pressure pi
in the range [p, p + Δp], where Δp is the pressure incre-ment. The partial coordination numbers z− and z+ aredefined by
z+(p) =1
N(p)
∑i∈S(p)
k+i ,
z−(p) =1
N(p)
∑i∈S(p)
k−i ,
(16)
where N(p) is the number of particles in the set. Thesefunctions are plotted in Figure 9 in the case pm = 0. Theplot of z−(p) is an approximate mirror image of z+(p) withrespect to p = 0. Three zones can be discerned. For p <−p0, we have z− � 5 and z+ � 0.5. This zone representsmainly the particles belonging to the bulk of the negativephase. For p > p0, we have z− � 0.5 and z+ � 4. The par-ticles in this zone belong to the bulk of the positive phase.In the range −p0 < p < p0, z+ increases and z− declines.The intersection occurs at p = 0 where z− = z+ � 3. This
V. Richefeu et al.: Stress transmission in wet granular materials 7
-3 -2 -1 0 1 2 3p / p
0
0
1
2
3
4
5
6
7
coor
dina
tion
num
bers
z+
z_
z
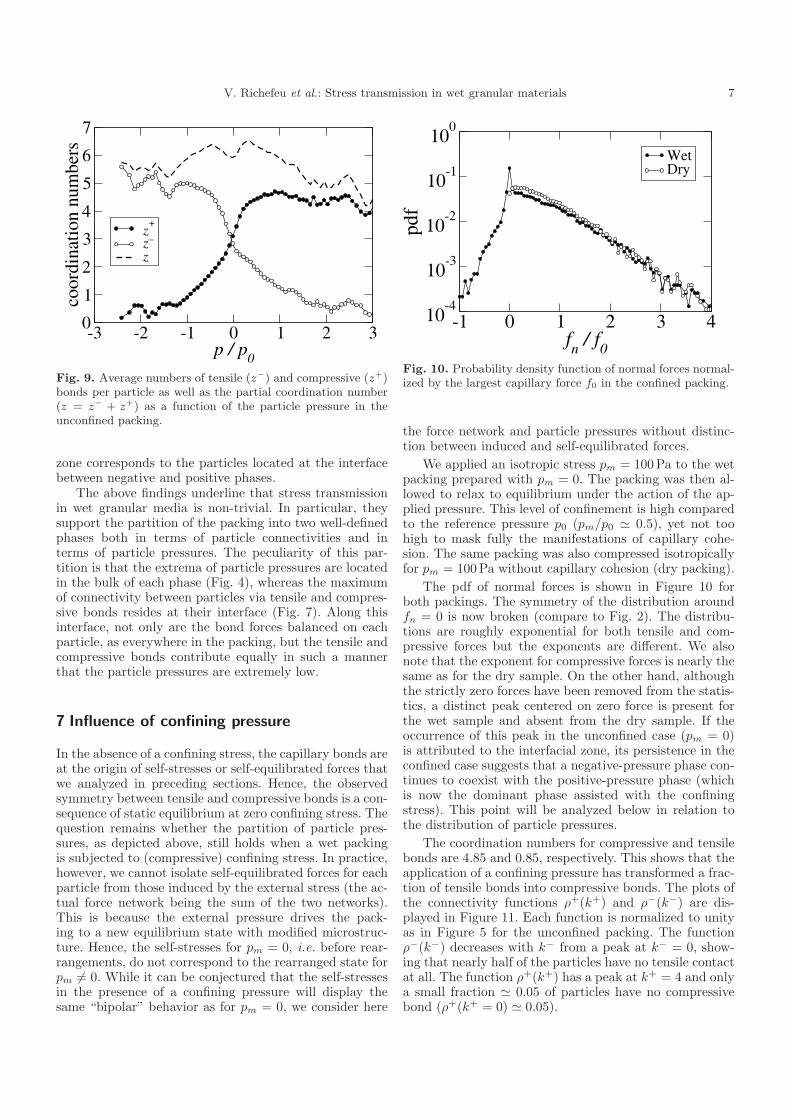
Fig. 9. Average numbers of tensile (z−) and compressive (z+)bonds per particle as well as the partial coordination number(z = z− + z+) as a function of the particle pressure in theunconfined packing.
zone corresponds to the particles located at the interfacebetween negative and positive phases.
The above findings underline that stress transmissionin wet granular media is non-trivial. In particular, theysupport the partition of the packing into two well-definedphases both in terms of particle connectivities and interms of particle pressures. The peculiarity of this par-tition is that the extrema of particle pressures are locatedin the bulk of each phase (Fig. 4), whereas the maximumof connectivity between particles via tensile and compres-sive bonds resides at their interface (Fig. 7). Along thisinterface, not only are the bond forces balanced on eachparticle, as everywhere in the packing, but the tensile andcompressive bonds contribute equally in such a mannerthat the particle pressures are extremely low.
7 Influence of confining pressure
In the absence of a confining stress, the capillary bonds areat the origin of self-stresses or self-equilibrated forces thatwe analyzed in preceding sections. Hence, the observedsymmetry between tensile and compressive bonds is a con-sequence of static equilibrium at zero confining stress. Thequestion remains whether the partition of particle pres-sures, as depicted above, still holds when a wet packingis subjected to (compressive) confining stress. In practice,however, we cannot isolate self-equilibrated forces for eachparticle from those induced by the external stress (the ac-tual force network being the sum of the two networks).This is because the external pressure drives the pack-ing to a new equilibrium state with modified microstruc-ture. Hence, the self-stresses for pm = 0, i.e. before rear-rangements, do not correspond to the rearranged state forpm = 0. While it can be conjectured that the self-stressesin the presence of a confining pressure will display thesame “bipolar” behavior as for pm = 0, we consider here
-1 0 1 2 3 4fn / f
0
10-4
10-3
10-2
10-1
100
pdf
WetDry
Fig. 10. Probability density function of normal forces normal-ized by the largest capillary force f0 in the confined packing.
the force network and particle pressures without distinc-tion between induced and self-equilibrated forces.
We applied an isotropic stress pm = 100Pa to the wetpacking prepared with pm = 0. The packing was then al-lowed to relax to equilibrium under the action of the ap-plied pressure. This level of confinement is high comparedto the reference pressure p0 (pm/p0 � 0.5), yet not toohigh to mask fully the manifestations of capillary cohe-sion. The same packing was also compressed isotropicallyfor pm = 100Pa without capillary cohesion (dry packing).
The pdf of normal forces is shown in Figure 10 forboth packings. The symmetry of the distribution aroundfn = 0 is now broken (compare to Fig. 2). The distribu-tions are roughly exponential for both tensile and com-pressive forces but the exponents are different. We alsonote that the exponent for compressive forces is nearly thesame as for the dry sample. On the other hand, althoughthe strictly zero forces have been removed from the statis-tics, a distinct peak centered on zero force is present forthe wet sample and absent from the dry sample. If theoccurrence of this peak in the unconfined case (pm = 0)is attributed to the interfacial zone, its persistence in theconfined case suggests that a negative-pressure phase con-tinues to coexist with the positive-pressure phase (whichis now the dominant phase assisted with the confiningstress). This point will be analyzed below in relation tothe distribution of particle pressures.
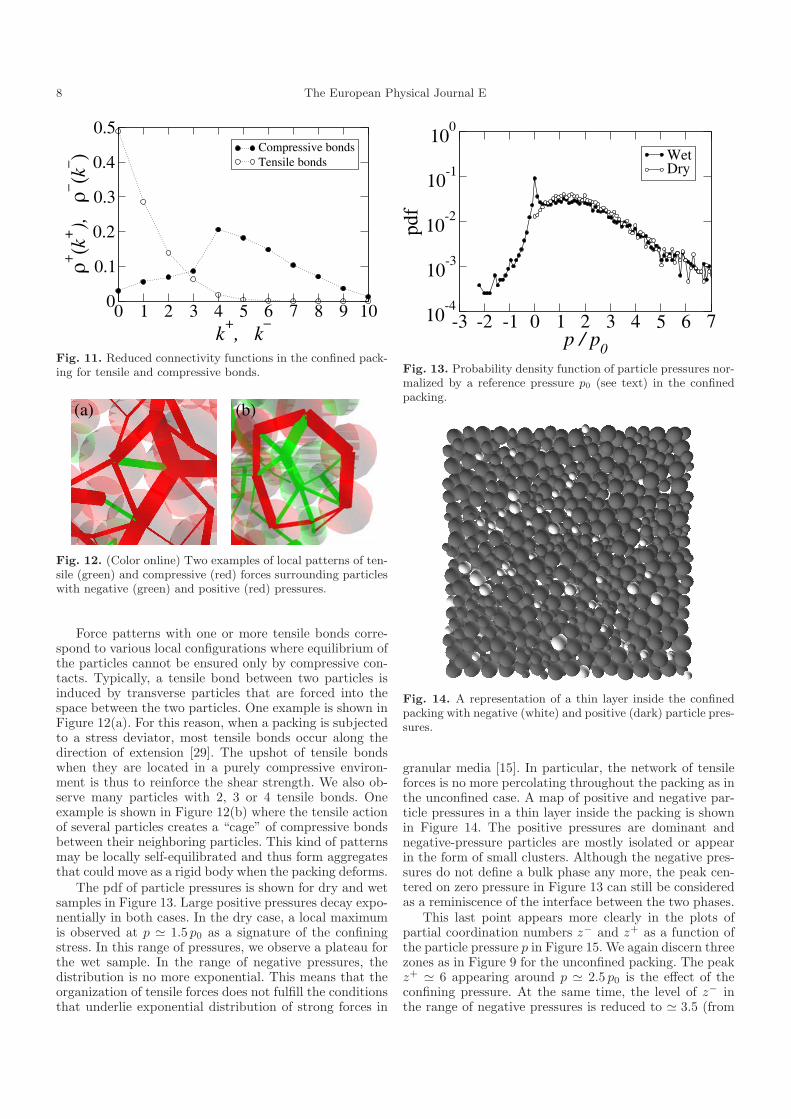
The coordination numbers for compressive and tensilebonds are 4.85 and 0.85, respectively. This shows that theapplication of a confining pressure has transformed a frac-tion of tensile bonds into compressive bonds. The plots ofthe connectivity functions ρ+(k+) and ρ−(k−) are dis-played in Figure 11. Each function is normalized to unityas in Figure 5 for the unconfined packing. The functionρ−(k−) decreases with k− from a peak at k− = 0, show-ing that nearly half of the particles have no tensile contactat all. The function ρ+(k+) has a peak at k+ = 4 and onlya small fraction � 0.05 of particles have no compressivebond (ρ+(k+ = 0) � 0.05).
8 The European Physical Journal E
0 1 2 3 4 5 6 7 8 9 10k
+, k
−0
0.1
0.2
0.3
0.4
0.5
ρ+(k
+),
ρ−(k− )
Compressive bondsTensile bonds
Fig. 11. Reduced connectivity functions in the confined pack-ing for tensile and compressive bonds.
(a) (b)
Fig. 12. (Color online) Two examples of local patterns of ten-sile (green) and compressive (red) forces surrounding particleswith negative (green) and positive (red) pressures.
Force patterns with one or more tensile bonds corre-spond to various local configurations where equilibrium ofthe particles cannot be ensured only by compressive con-tacts. Typically, a tensile bond between two particles isinduced by transverse particles that are forced into thespace between the two particles. One example is shown inFigure 12(a). For this reason, when a packing is subjectedto a stress deviator, most tensile bonds occur along thedirection of extension [29]. The upshot of tensile bondswhen they are located in a purely compressive environ-ment is thus to reinforce the shear strength. We also ob-serve many particles with 2, 3 or 4 tensile bonds. Oneexample is shown in Figure 12(b) where the tensile actionof several particles creates a “cage” of compressive bondsbetween their neighboring particles. This kind of patternsmay be locally self-equilibrated and thus form aggregatesthat could move as a rigid body when the packing deforms.
The pdf of particle pressures is shown for dry and wetsamples in Figure 13. Large positive pressures decay expo-nentially in both cases. In the dry case, a local maximumis observed at p � 1.5 p0 as a signature of the confiningstress. In this range of pressures, we observe a plateau forthe wet sample. In the range of negative pressures, thedistribution is no more exponential. This means that theorganization of tensile forces does not fulfill the conditionsthat underlie exponential distribution of strong forces in
-3 -2 -1 0 1 2 3 4 5 6 7p / p
0
10-4
10-3
10-2
10-1
100
pdf
WetDry
Fig. 13. Probability density function of particle pressures nor-malized by a reference pressure p0 (see text) in the confinedpacking.
Fig. 14. A representation of a thin layer inside the confinedpacking with negative (white) and positive (dark) particle pres-sures.
granular media [15]. In particular, the network of tensileforces is no more percolating throughout the packing as inthe unconfined case. A map of positive and negative par-ticle pressures in a thin layer inside the packing is shownin Figure 14. The positive pressures are dominant andnegative-pressure particles are mostly isolated or appearin the form of small clusters. Although the negative pres-sures do not define a bulk phase any more, the peak cen-tered on zero pressure in Figure 13 can still be consideredas a reminiscence of the interface between the two phases.
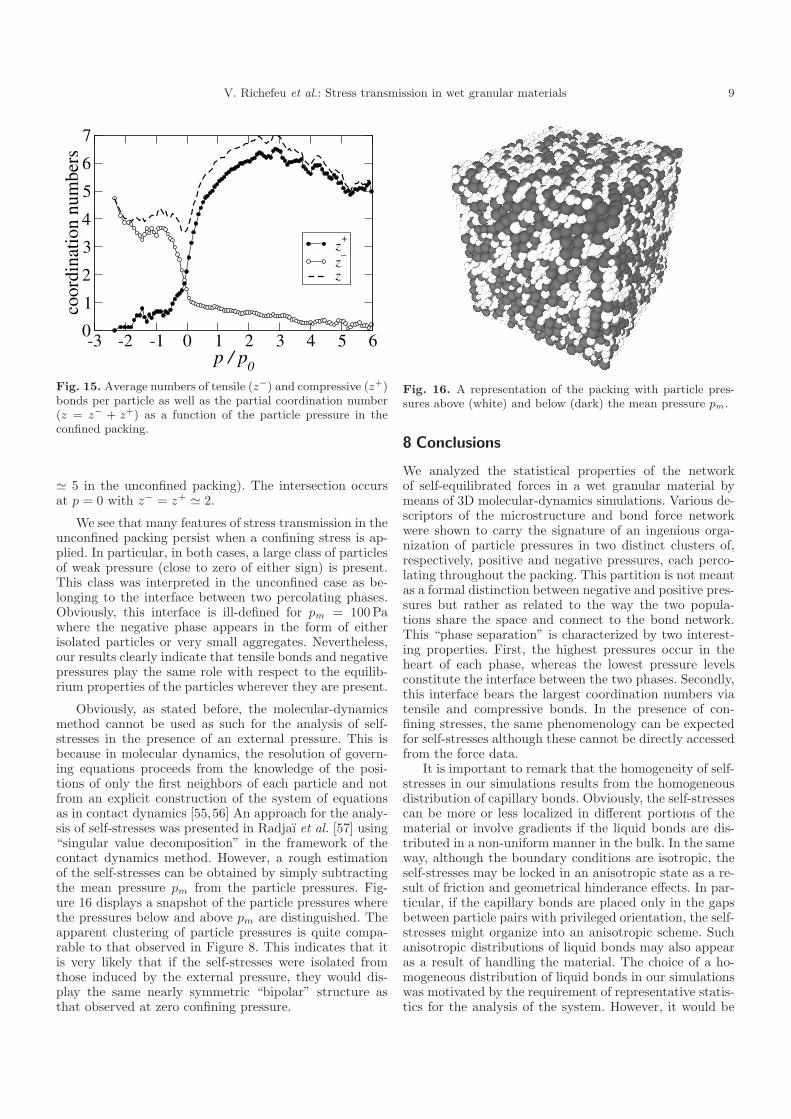
This last point appears more clearly in the plots ofpartial coordination numbers z− and z+ as a function ofthe particle pressure p in Figure 15. We again discern threezones as in Figure 9 for the unconfined packing. The peakz+ � 6 appearing around p � 2.5 p0 is the effect of theconfining pressure. At the same time, the level of z− inthe range of negative pressures is reduced to � 3.5 (from
V. Richefeu et al.: Stress transmission in wet granular materials 9
-3 -2 -1 0 1 2 3 4 5 6p / p
0
0
1
2
3
4
5
6
7
coor
dina
tion
num
bers
z+
z−
z
Fig. 15. Average numbers of tensile (z−) and compressive (z+)bonds per particle as well as the partial coordination number(z = z− + z+) as a function of the particle pressure in theconfined packing.
� 5 in the unconfined packing). The intersection occursat p = 0 with z− = z+ � 2.
We see that many features of stress transmission in theunconfined packing persist when a confining stress is ap-plied. In particular, in both cases, a large class of particlesof weak pressure (close to zero of either sign) is present.This class was interpreted in the unconfined case as be-longing to the interface between two percolating phases.Obviously, this interface is ill-defined for pm = 100Pawhere the negative phase appears in the form of eitherisolated particles or very small aggregates. Nevertheless,our results clearly indicate that tensile bonds and negativepressures play the same role with respect to the equilib-rium properties of the particles wherever they are present.
Obviously, as stated before, the molecular-dynamicsmethod cannot be used as such for the analysis of self-stresses in the presence of an external pressure. This isbecause in molecular dynamics, the resolution of govern-ing equations proceeds from the knowledge of the posi-tions of only the first neighbors of each particle and notfrom an explicit construction of the system of equationsas in contact dynamics [55,56] An approach for the analy-sis of self-stresses was presented in Radjaı et al. [57] using“singular value decomposition” in the framework of thecontact dynamics method. However, a rough estimationof the self-stresses can be obtained by simply subtractingthe mean pressure pm from the particle pressures. Fig-ure 16 displays a snapshot of the particle pressures wherethe pressures below and above pm are distinguished. Theapparent clustering of particle pressures is quite compa-rable to that observed in Figure 8. This indicates that itis very likely that if the self-stresses were isolated fromthose induced by the external pressure, they would dis-play the same nearly symmetric “bipolar” structure asthat observed at zero confining pressure.
Fig. 16. A representation of the packing with particle pres-sures above (white) and below (dark) the mean pressure pm.
8 Conclusions
We analyzed the statistical properties of the networkof self-equilibrated forces in a wet granular material bymeans of 3D molecular-dynamics simulations. Various de-scriptors of the microstructure and bond force networkwere shown to carry the signature of an ingenious orga-nization of particle pressures in two distinct clusters of,respectively, positive and negative pressures, each perco-lating throughout the packing. This partition is not meantas a formal distinction between negative and positive pres-sures but rather as related to the way the two popula-tions share the space and connect to the bond network.This “phase separation” is characterized by two interest-ing properties. First, the highest pressures occur in theheart of each phase, whereas the lowest pressure levelsconstitute the interface between the two phases. Secondly,this interface bears the largest coordination numbers viatensile and compressive bonds. In the presence of con-fining stresses, the same phenomenology can be expectedfor self-stresses although these cannot be directly accessedfrom the force data.
It is important to remark that the homogeneity of self-stresses in our simulations results from the homogeneousdistribution of capillary bonds. Obviously, the self-stressescan be more or less localized in different portions of thematerial or involve gradients if the liquid bonds are dis-tributed in a non-uniform manner in the bulk. In the sameway, although the boundary conditions are isotropic, theself-stresses may be locked in an anisotropic state as a re-sult of friction and geometrical hinderance effects. In par-ticular, if the capillary bonds are placed only in the gapsbetween particle pairs with privileged orientation, the self-stresses might organize into an anisotropic scheme. Suchanisotropic distributions of liquid bonds may also appearas a result of handling the material. The choice of a ho-mogeneous distribution of liquid bonds in our simulationswas motivated by the requirement of representative statis-tics for the analysis of the system. However, it would be
10 The European Physical Journal E
interesting to study the influence of the liquid distributionon the patterns of self-stresses.
The partition of self-stresses implies that the overallequilibrium of the packing is ensured by mesoscopic struc-tures involving length scales larger than the particle size.These length scales are likely to control the size of aggre-gates during flow or other packing properties of cohesivegranular materials. On the other hand, the effect of self-stresses on the tensile strength or Coulomb cohesion ofwet granular materials is of interest to wet processing ofgrains in chemical engineering and merits to be studiedalong these lines. In the same way, the influence of solidfraction is an important aspect with evident applicationto compaction and consolidation of cohesive packs.
This work was accomplished within the “granular solids”group of the LMGC. We thank F. Soulie for his help withthe validation of the capillary law used in our simulations.The data were treated by means of the 3D software mgpost
(www.lmgc.univ-montp2.fr/∼richefeu).
References
1. H.J. Herrmann, J.-P. Hovi, S. Luding, Physics of DryGranular Media - NATO ASI Series E 350 (Kluwer Aca-demic Publishers, Dordrecht, 1998).
2. S. Roux, F. Radjaı, in Mechanics for a New Millennium,edited by H. Aref, J.W. Philips (Kluwer Academic Pub-lishers, The Netherlands, 2001) p. 181.
3. M. Oda, Soils Found. 12, 17 (1972).4. J. Christoffersen, M.M. Mehrabadi, S. Nemat-Nasser, J.
slow, in Granular Materials: Fundamental and Applica-tions, edited by S.J. Antony, W. Hoyle, Y. Ding (RoyalSociety of Chemistry, Cambridge, 2004) p. 296.
31. A. Castellanos, Adv. Phys. 54, 263 (2005).32. I. Preechawuttipong, PhD Thesis, Universite Montpellier
2, 2002.33. F. Radjaı, I. Preechawuttipong, R. Peyroux, in Continuous
and Discontinuous Modelling of Cohesive-Frictional Mate-rials, edited by P.A. Vermeer, S. Diebels, W. Ehlers, H.J.Hermann, S. Luding, E. Ramm (Springer, Berlin, 2001)p. 149.
34. M.S. El Youssoufi, J.-Y. Delenne, F. Radjai, Phys. Rev. E71, 051307 (2005).
(Oxford University Press, Oxford, 1987).37. J. Schafer, S. Dippel, D.E. Wolf, J. Phys. I 6, 5 (1996).38. M.A. Erle, D.C. Dyson, N.R. Morrow, AIChE J. 17, 115
(1971).39. G. Lian, C. Thornton, M.J. Adams, J. Colloid Interface
Sci. 161, 138 (1993).40. T. Mikami, H. Kamiya, M. Horio, Chem. Eng. Sci. 53,
1927 (1998).41. F. Soulie, F. Cherblanc, M.S. El Youssoufi, C. Saix, Int. J.
Numer. Anal. Methods Geomech. 30, 213 (2006).42. C. Willett, M. Adans, S. Johnson, J. Seville, Langmuir 16,
9396 (2000).43. L. Bocquet, E. Clarlaix, F. Restagno, C. R. Phys. 3, 207
(2002).44. S. Herminghaus, Adv. Phys. 54, 221 (2005).45. G. Lian, C. Thornton, M.J. Adams, Chem. Eng. Sci. 53,