1 Strictly embargoed until 07.00: 9 December 2015 Focusrite Plc (“Focusrite” or “the Group”) Results for the year ended 31 August 2015 Focusrite Plc (AIM: TUNE) the global music and audio products company supplying hardware and software products used by professional and amateur musicians, today announces its results for the year ended 31 August 2015. Financial Highlights • Group revenue up by 17.2% to £48.0 million (FY14: £41.0 million) • Adjusted EBITDA 1 up by 13.1% to £9.3 million (FY14: £8.2 million) • Operating profit up by 10.7% to £6.3 million (FY14: £5.7 million) • Basic earnings per share up by 1.6% to 10.4p (FY14: 10.3p) • Adjusted diluted earnings 2 per share up by 4.3% to 10.5p (FY14: 10.1p) • Net cash up by 62.3% to £6.2 million (FY14: £3.8 million) • Maiden final dividend of 1.2p recommended, making 1.8p for the year Operational Highlights • Successful first year of trading since IPO and admission to AIM in December 2014 • Revenue growth across both operating brands Focusrite and Novation and in all major territories o USA growing by 29.3%, Europe, Middle East and Africa by 9.4% and Rest of World by 14.5% • 19 new products o Entry into lucrative higher price range segments with Clarett Thunderbolt and Launchpad Pro o Entry into new Live and Broadcast market segment with RedNet audio • Downloads of Novation’s Launchpad App for Apple’s iOS platform grew by 87%; and revenue grew by 185% • Rated, for the fourth consecutive year, as one of the ‘100 Best Small Companies to Work For’ by The Sunday Times Philip Dudderidge, Executive Chairman of Focusrite Plc, commented: “This is the first set of annual results since Focusrite Plc floated and I am pleased that we have performed well, meeting market expectations with record revenues and profits for the year. We issued 19 new products this year and we will continue to invest in our research and development programme to develop future generations of products.” Commenting on current trading and outlook, Dave Froker, CEO said: “Products launched at the end of the financial year have been well received by the market, with excellent reviews across the industry. Revenue in the first quarter of the current year was ahead of that for FY15, itself a record quarter, in spite of slower than expected initial sales of new products. Pleasingly, existing products continue to perform as expected.” He added: “Notwithstanding the weaker Euro, our continued significant investment in R&D and an exciting new launch schedule for the current year give us confidence that FY16 will be a further year of revenue growth.” 1 Comprising of earnings adjusted for interest, taxation, depreciation, amortisation and non-underlying items. 2 Adjusted for non-underlying items.
Transcript
1
Strictly embargoed until 07.00: 9 December 2015
Focusrite Plc (“Focusrite” or “the Group”)
Results for the year ended 31 August 2015
Focusrite Plc (AIM: TUNE) the global music and audio products company supplying hardware and software products used by professional and amateur musicians, today announces its results for the year ended 31 August 2015. Financial Highlights
• Group revenue up by 17.2% to £48.0 million (FY14: £41.0 million)
• Adjusted EBITDA1 up by 13.1% to £9.3 million (FY14: £8.2 million)
• Operating profit up by 10.7% to £6.3 million (FY14: £5.7 million)
• Basic earnings per share up by 1.6% to 10.4p (FY14: 10.3p)
• Adjusted diluted earnings2 per share up by 4.3% to 10.5p (FY14: 10.1p)
• Net cash up by 62.3% to £6.2 million (FY14: £3.8 million)
• Maiden final dividend of 1.2p recommended, making 1.8p for the year
Operational Highlights
• Successful first year of trading since IPO and admission to AIM in December 2014
• Revenue growth across both operating brands Focusrite and Novation and in all major territories
o USA growing by 29.3%, Europe, Middle East and Africa by 9.4% and Rest of World by 14.5%
• 19 new products
o Entry into lucrative higher price range segments with Clarett Thunderbolt and Launchpad Pro
o Entry into new Live and Broadcast market segment with RedNet audio
• Downloads of Novation’s Launchpad App for Apple’s iOS platform grew by 87%; and revenue grew
by 185%
• Rated, for the fourth consecutive year, as one of the ‘100 Best Small Companies to Work For’ by The
Sunday Times
Philip Dudderidge, Executive Chairman of Focusrite Plc, commented: “This is the first set of annual results since Focusrite Plc floated and I am pleased that we have performed well, meeting market expectations with record revenues and profits for the year. We issued 19 new products this year and we will continue to invest in our research and development programme to develop future generations of products.” Commenting on current trading and outlook, Dave Froker, CEO said: “Products launched at the end of the financial year have been well received by the market, with excellent reviews across the industry. Revenue in the first quarter of the current year was ahead of that for FY15, itself a record quarter, in spite of slower than expected initial sales of new products. Pleasingly, existing products continue to perform as expected.”
He added: “Notwithstanding the weaker Euro, our continued significant investment in R&D and an exciting new launch schedule for the current year give us confidence that FY16 will be a further year of revenue growth.”
1 Comprising of earnings adjusted for interest, taxation, depreciation, amortisation and non-underlying items. 2 Adjusted for non-underlying items.
2
Availability of Annual Report and Notice of AGM The Annual Report and Accounts for the financial year ended 31 August 2015 and notice of the Annual General Meeting ("AGM") of Focusrite will be posted to shareholders on 16 December 2015 and will be available on Focusrite’s website at www.focusriteplc.com. Dividend timetable
The final dividend is subject to shareholder approval, which is being sought at Focusrite's Annual General
Meeting to be held on 29 January 2016.
If approved, the final dividend in respect of the year ended 31 August 2015 will be paid on 3 February 2016 to shareholders on the register as at 18 December 2015. The timetable for the final dividend is as follows: 17 December 2015 Ex-dividend Date 18 December 2015 Record Date 29 January 2016 AGM to approve the recommended final dividend 3 February 2016 Dividend payment date
Enquiries:
Focusrite Plc: Dave Froker (CEO) +44 1494 836301 Jeremy Wilson (CFO) +44 1494 836301 Panmure Gordon Freddy Crossley/Nicola Marrin +44 20 7886 2968 Tom Salvesen +44 20 7886 2904 Belvedere Communications John West +44 20 3567 0510 Kim Van Beeck +44 20 3567 0510
Notes to Editors Focusrite is a global music and audio products group supplying hardware and software products used by professional and amateur musicians, which enables the high quality production of music. The Group has two established and rapidly growing brands: Focusrite and Novation. The Focusrite brand makes audio interface and other products for audio recording musicians. The Novation brand allows its customers to make electronic music using synthesisers and computer-enabled technology. The Group has a global customer base with a distribution network covering approximately 160 territories.
Focusrite is headquartered in High Wycombe, United Kingdom with a marketing subsidiary in Los Angeles, United
States and has around 160 employees.
3
Chairman’s Statement I would like to express my appreciation to the shareholders that participated in the flotation of Focusrite Plc on AIM in December 2014 and welcome new shareholders that have acquired shares in Focusrite subsequently. This is the first set of annual results since Focusrite Plc floated and I am pleased that we have performed well, meeting market expectations with record revenues and profit for the year. We issued 19 new products this year and will continue to invest in our research and development programme to develop future generations of product. Our Group offers its products under two brands; Focusrite, which is the global leader in Audio Interfaces for recording with computers (the modern paradigm), and Novation, a brand acquired 11 years ago that specialises in synthesisers, keyboards and grid controllers for the Electronic Music market. Both brands have a strong reputation for innovation, quality of build and performance, resulting in ever greater levels of customer satisfaction and resultant growth. As a 26-year-old business we have a depth of management experience that belies the fact that the average age of our workforce is around 30. We employ new graduates in music technology and audio engineering in the business every year. Most employees are musicians as well as development engineers, sales, support and marketing staff (even Dave Froker, the CEO, is an accomplished rock guitarist!). This means that we have a strong empathy with the aspirations of our customers and indeed all our musician employees use our products in their personal creative endeavours. In turn we are proud that our employees have voted Focusrite as one of the ‘100 Best Small Companies to Work For’ (Sunday Times), for the past four years. The Group was fortunate to go into the recession following the 2008 financial crisis with no debt and we have built the Group to five times the 2009 revenue since then. Despite having invested heavily in product development and marketing to build the business aggressively to meet the ever expanding demand, we remain debt free and highly cash generative. As a result the Directors have recommended a final dividend of 1.2 pence per share, making a total of 1.8 pence per share for the year. The final dividend is subject to shareholder approval, which is being sought at Focusrite’s Annual General Meeting to be held in January 2016. Our largest market by revenue is the United States, where our brands are well represented in all the leading resellers of music equipment, notably Guitar Center – a chain of 280 stores – and Sweetwater Sound, a unique, proactive and online business that sells nationally from a single location in Indiana, as well as Amazon and many independent retailers. This strong brand representation in our product categories is reflected in the UK, Europe and almost everywhere people are recording and performing music. There has never been a better time to be in the musical instrument and music recording market and we are making the best of the opportunity, taking a leading role in the changes that are sweeping our marketplace. Finally, a big thank you to all the employees in the business for their teamwork and commitment to our collective goals and to our distribution and retail partners for their continued support. Philip Dudderidge Executive Chairman
4
Strategic Report
CEO Review
Overview
We intend to continue innovating, which has been the engine of our growth, and we are continuing to disrupt
traditional methods of music making. This is liberating musicians with transparent technology that allows them
to stay in the flow of creating, producing, recording and distributing their music. And we intend to continue
extending the boundaries of our market with steps into adjacent segments.
Innovating for growth
On the strength of our 19 new product launches, revenue continued its pattern of annual growth, rising to £48.0
million (2014: £41.0 million) representing a rise of 17.2% (2014: 13.5%). All business segments grew, including
Focusrite products rising by 16.3% from £26.8 million to £31.2 million, and Novation products rising by 22.7%
from £11.5 million to £14.2 million.
In addition, revenue increased in all regions: USA grew by 29.3%, Europe, Middle East and Africa (‘EMEA’) by
9.4% and Rest of World by 14.5%. We grew Adjusted EBITDA by 13.1%, with Adjusted EBITDA representing
19.4% of revenue. The growth was relatively consistent across our two brands. Two key new products, the
Focusrite Clarett range of audio interfaces and Novation’s Launchpad Pro, arrived near the end of the financial
year which, along with upcoming new product launches in the new financial year, should provide a good basis
for future growth.
The market Globally the overall music gear market is growing, with macroeconomic forces affecting regions differently. The
USA, not surprisingly with its relatively healthy economy, is in better shape than the Eurozone and Latin America.
Asia continues to grow faster than the rest of the world even with China’s slowdown, although that is currently
a small part of our business.
Driving disruption
More important to our business is the changing nature of music making, production and distribution. Focusrite
is well-placed to take advantage of the shift to electronic dance music (‘EDM’), mobile ways of making and
recording music, and the use of Spotify and YouTube as media for awareness and delivering music to fans. As a
measure of both the changing use of musical instruments and the reliance on mobile platforms, downloads of
Novation’s Launchpad App for Apple’s iOS platform grew by 87% and the revenue derived from that app, albeit
still a relatively small percentage of overall revenue, grew by 185%.
Making it easy
Musicians today face an unending stream of hurdles while creating, producing and performing music. Our drive
to make music easy to make – at all levels of expertise – is paying off: the percentage of new owners of our
products calling for help from Tech Support continues to decline to 3.5% from 6.5% last year. Critical praise from
the press and end-users tells us our focus is paying off.
Expanding into new segments The launch of the Clarett Thunderbolt line of interfaces takes Focusrite into a new, lucrative segment of the
market, where products sell for between $500 and $1,500. Initial reviews by users and press experts suggest
we’ll do well with Clarett. Focusrite, with its lower-priced Scarlett range of interfaces, already claims the number
one worldwide position under $500.
Launchpad Pro thrusts Novation into a new, higher price segment of grid controllers for the widely used software
Ableton Live. Our entry into interfaces for the nascent iOS recording market, the iTrack line, is exploring new
markets as musicians are just starting to experiment with mobile recording platforms.
5
Finally, our introduction of RedNet audio networking products is causing excitement in the demanding ‘the-
show-must-go-on’ Live and Broadcast segments. We intend to expand further by continuing to explore new
market segments, both through acquisition and home-grown investment.
Managing margins
As explained more fully in the Financial Review, gross margin remained similar to the prior year. Our Euro
exchange rate hedging kept our performance insulated from the volatility experienced during the year. As ever
we kept a close control on product manufacturing costs, which have defied Chinese inflation trends. Operating
costs continue to be managed carefully.
A great place to work With our rapid growth we face the enviable but difficult task of hiring the talented people we need to work with us. We place great emphasis on our recruiting, interviewing and hiring decision-making skills. Each employee has a bespoke training programme to raise their skills and further their careers. Our strategy is clear to employees and their goals and objectives are tied to the Company’s overall goals. We are delighted that for the fourth year in a row Focusrite was named one of Britain’s 100 Best Small Companies to Work For. At the same time our continued focus on cost control and efficiency meant our revenue per employee increased. We grew headcount costs by 7.1%, less than revenue and profit growth. We thrive on hard work, fun and results. Executing operationally In the spring we relaunched the Novation brand, which followed a careful analysis of the brand’s strategy, heritage, values and an understanding of customer perception. We also reorganised our R&D department to make it more focused, fleeter of foot, and metric-driven, while we launched 19 new products. Finally we have worked closely with our channel partners and upgraded where necessary. Current trading and outlook Products launched at the end of the financial year have been well received by the market, with excellent reviews across the industry. Revenue in the first quarter of the current year was ahead of that for FY15, itself a record quarter, in spite of slower than expected initial sales of new products. Pleasingly, existing products continue to perform as expected.
Notwithstanding the weaker Euro, our continued significant investment in R&D and an exciting new launch schedule for the current year give us confidence that FY16 will be a further year of revenue growth. Dave Froker Chief Executive Officer
6
Financial Review
Overview
The Group had a positive year in which revenue increased by 17.2% to £48.0 million (2014: £41.0 million), gross
margin was consistent at 38.8% and adjusted earnings before interest, tax, depreciation and amortisation
(‘Adjusted EBITDA’) was £9.3 million (2014: £8.2 million), up 13.1%. The balance of cash and cash equivalents at
31 August 2015 was £6.2 million, up from £3.8 million at 31 August 2014.
Income statement
2015 2015 2015 2014 2014 2014
£m £m £m £m £m £m
Reported Non-
underlying Adjusted Reported Non-
underlying Adjusted
Revenue 48.0 0.0 48.0 41.0 0.0 41.0
Cost of sales -29.4 0.0 -29.4 -25.1 0.0 -25.1
Gross profit 18.6 0.0 18.6 15.9 0.0 15.9 Administrative expenses and other gains -12.3 -0.7 -11.6 -10.2 -0.7 -9.5
Operating profit 6.3 -0.7 7.0 5.7 -0.7 6.4
Net finance income 0.2 0.0 0.2 0.1 0.0 0.1
Profit before tax 6.5 -0.7 7.2 5.8 -0.7 6.5
Income tax expense -1.0 0.0 -1.0 -0.8 0.0 -0.8
Profit for the period 5.5 -0.7 6.2 5.0 -0.7 5.7
Income statement Revenue
Revenue continued its pattern of annual growth, rising to £48.0 million (2014: £41.0 million) representing a rise
of 17.2% (2014: 13.5%). All business segments grew, including Focusrite products rising by 16.3% from £26.8
million to £31.2 million, and Novation products rising by 22.7% from £11.5 million to £14.2 million.
In addition, revenue increased in all regions: USA grew by 29.3%, EMEA by 9.4% and Rest of World by 14.5%.
Gross profit
Gross profit comprises the revenue earned from the sale of stock, less the cost of sales of those products
including the material cost, freight, storage, royalties and revenue based sales commissions. Gross profit
increased to £18.6 million (2014: £15.9 million). Gross margin was consistent with the prior year at 38.8%. At
constant exchange rates, the gross margin was 40.1%.
Administrative and other expenses
Administrative and other expenses comprise uncapitalised research and development costs, engineering and
operations costs, sales and marketing costs, administrative expenses and depreciation and amortisation. Overall,
the administrative expenses were £12.3 million.
Within administrative expenses, there are some increased costs associated with the Group now being a quoted
company. These totalled £0.5 million. Excluding these, the rise in ongoing administrative costs was 12.7%, less
than the increase in the revenue.
7
In addition, the administrative expenses include one-off costs of £0.7 million (2014: £0.7 million) associated with
the Initial Public Offering.
Adjusting for these one-off costs, the Adjusted EBITDA increased by 13.1% from £8.2 million to £9.3 million.
2015 2015 2015 2014 2014 2014
£m £m £m £m £m £m
Reported Non-
underlying Adjusted Reported Non-
underlying Adjusted
Operating profit 6.3 -0.7 7.0 5.7 -0.7 6.4
Less Profit on disposal of property, plant and equipment 0.0 0.0 0.0 -0.1 0.0 -0.1
During the period, there have been significant movements in both the US Dollar and the Euro.
Exchange rates FY15 FY14 Average US $:£ 1.56 1.65 €:£ 1.35 1.21 Year end US $:£ 1.54 1.68
€:£ 1.37 1.26
US Dollar
The US Dollar has strengthened against Sterling to an average rate of $1.56 (2014: $1.65). The Group purchases
stock from several suppliers in China and pays for that stock in US Dollars. The vast majority of that cash outflow
is matched by the cash inflow from the US Dollar denominated revenue in the US, Canada, South America and
Asia Pacific. This means that a strengthening of the US Dollar leads to an increase in revenue but has little effect
on gross profit.
Euro
During the period, the Euro weakened against Sterling to an average rate of €1.35 (2014: €1.21). Around 27%
of the Group’s revenue is generated in European countries. There are few costs denominated in Euros. This
means that a weakening in the Euro leads to a decrease in revenue and a consequential decrease in gross profit.
Hedging
To compensate for these movements, the Group has a policy of entering into forward exchange contracts
ensuring that the major portion of cash flow movements are hedged for the forthcoming financial year.
In the financial year ended 31 August 2015, the contracts have protected against some of the downside pressure
caused by the weakening of the Euro. During the period, the gains realised on the exchange rate hedging totalled
£0.8 million and are included within revenue. In addition, under IFRS, the Group is required to fair value the
8
committed future hedge contracts and so, at the period end, an asset of £0.2 million is included on the balance
sheet (31 August 2014: an asset of £0.1 million). The change in fair value of these contracts is included within
financial income and finance costs in the Income Statement.
At constant exchange rates, the revenue growth would have been 14.9% compared with the reported growth
rate of 17.2%. Conversely, at constant exchange rates, the gross margin would have been 40.1% compared with
the reported gross margin of 38.8% (2014, 38.8%).
For the year from September 2015 to August 2016, the total value of Euro hedge contracts is for €15.6 million,
comprising €14.4 million to be converted to pounds Sterling at an average protected rate of €1.39:£1.00 and
€1.2 million to be converted to US Dollars at an average protected rate of $1.22:€1.00. These forward contracts
improve certainty and protect against further currency weakening although they do reflect the weaker Euro from
last year’s hedged rate of €1.27.
Corporation tax
The majority of the profit made by the Group is taxed in UK. The Group benefits from tax allowances (R&D tax
credits) on the significant research and development costs explained above, thereby reducing the effective tax
rate. In contrast, IPO costs are, typically, not allowable for corporation tax. The total tax charge is calculated as
£1.0 million (2014: £0.8 million) representing 15.8% of profit before tax, up from 13.1% in the prior year. Note
that, excluding the IPO costs, the effective tax rate is 14.2%.
Earnings per share
Earnings per share FY15 FY14 Growth p p % Basic 10.4 10.3 1.6% Diluted 9.3 8.8 5.6% Adjusted basic 11.8 11.7 0.4%
Adjusted diluted 10.5 10.1 4.3%
The adjusted basic and diluted earnings per share figures exclude the impact of the non-underlying costs in each financial year. One factor influencing the EPS growth was the issue of shares prior to the IPO. Were it not for these pre IPO share issues, the adjusted diluted EPS would have increased by 6.9%.
9
Balance sheet
2015 2014
£m £m
Non-current assets 5.2 4.0
Current assets
Stock 8.6 6.6
Trade and other receivables 7.8 6.4
Other current assets 0.2 0.1
Cash 6.2 3.8
Current liabilities -8.8 -7.1
Non-current liabilities -0.7 -0.6
Net assets 18.5 13.2
Non-current assets
The major non-current assets are capitalised development costs, shown within other intangible assets, and
tooling, shown within property, plant and equipment.
The total value of development costs capitalised during the year was £2.7 million, up from £1.9 million in the
prior year. The increased capitalisation was a function of bringing 19 products to market compared with eight
in the prior year. These costs are amortised over their useful life which we have deemed to be three years.
Within property, plant and equipment, the total additions during the year were £0.8 million (2014: £0.8 million)
of which £0.4 million was tooling for new products.
Working capital
Working capital comprises inventories plus trade and other receivables, less trade and other payables. Overall,
working capital was 16.6% of revenue as at 31 August 2015 compared with 15.3% in the prior year. Generally,
receivables and payables increase largely in line with revenue. The main reason for the higher working capital
was increased inventories due to new product lines.
Inventories
Inventories increased to £8.6 million, up from £6.6 million at 31 August 2014. When compared to the annual
cost of sales, this represents a stock turn of 3.4 times compared with 3.8 times in the prior year. The stock has
been increased partly to support the additional revenue and partly because 14 out of the 19 products were
introduced in the second half of the year and the Group invested in stock to support the anticipated demand of
new products.
Trade and other receivables
Trade and other receivables were £7.8 million, up from £6.4 million at 31 August 2014. The primary increase
was as a result of increased revenue and the trade receivables represented 49 days of sales, compared with 53
days last year.
Trade and other payables
Trade and other payables totalled £8.4 million, up from £6.7 million at 31 August 2014. The major element is
outstanding invoices for the purchase of stock. This increased as a result of the greater purchases of stock close
to the end of the financial year. At the year end, the credit period taken for trade purchases averaged 66 days
(31 August 2014: 59 days), helped by one significant supplier changing their accepted terms from 45 days to 60
days.
10
Cash The year-end cash balance was £6.2 million, up from £3.8 million at 31 August 2014. The Group does not have
any borrowings.
However, on 3 December 2015, after the end of the reported period, the Group completed the arrangement of
a committed five-year £10 million revolving credit facility (‘RCF’) with HSBC.
This provides the Group with additional financial resources to take advantage of growth opportunities as well as
further strengthening the balance sheet.
Cash flow
Free cash flow (being net cash from operating activities, less net cash used in investing activities) was £2.7 million
(2014: £6.2 million). Particular areas of focus during the year have been an increased spend on research and
development costs associated with developing new products and shepherding the production process to ensure
that good quality new products are sold to dealers at the planned time. The total of these costs was £3.4 million
(2014: £2.5 million). This represents an increase of 37.1% which resulted in 19 new products being introduced
in the year, up from eight products in the prior year. The lifespan of new products is normally at least three
years so the benefit is expected to accrue over several years. The total capitalised during the year was £2.7
million (2014: £1.9 million).
2015 2014
£m £m
Free cash flow 2.7 6.2
Add Exceptional cash out flows 1.2 0.2
Less Repayment of related party loan 0.0 -1.1
Underlying free cash flow 3.9 5.3
The exceptional cash flows comprised mainly the cost of the IPO and the repayment, in the year ended 31 August
2014, of a loan made to a related party during 2012. Adjusting for these, the free cash flow was £3.9 million and
represented 8.0% of revenue and 62% of profit after tax adjusted for exceptional items (2014, £5.3 million,
representing 13.1% of revenue and 93% of profit after tax adjusted for exceptional items). The main difference
was that in 2014, there was a reduction of working capital whereas in 2015 there was an increase in working
capital as described previously.
Dividend
During the year, the Company paid an interim dividend in respect of the year ended 31 August 2015 of 0.6p per
share, amounting to £0.3 million. In addition, following the year end, on 9 December 2015, the Directors
proposed a final dividend of 1.2 pence per share, making a total of 1.8 pence per share for the year.
The dividend is subject to shareholder approval, which is being sought at Focusrite’s Annual General Meeting to
be held on 29 January 2016.
The Group intends to adopt a sustainable and progressive dividend policy, subject to ensuring that the business
retains sufficient cash to invest adequately in research and development to develop the products which will drive
future growth.
11
Summary
In summary, the Group has had a strong year: revenue has grown by 17.2%, Adjusted EBITDA has increased from
£8.2 million to £9.3 million and cash generation has been good despite the greater investment in new stock. As
a result, the cash balance has increased from £3.8 million to £6.2 million and the Directors believe that this,
combined with the new RCF, arranged since the year end, adds further robustness to the Group’s balance sheet
and will help the Group to execute its strategy.
Jeremy Wilson
Chief Financial Officer
12
Principal Risks and Uncertainties
Risk factors
The risks have not changed significantly from the IPO, however, as this is the first annual results announcement
and there is not a prior annual report to refer to, they have been disclosed here as well as the annual report.
In common with all businesses, the Group faces risks, the effective management of which is necessary to enable
it to achieve its strategic objectives and secure the business for the long term and is critical to the effective
running of the business. Risk management is considered as part of the Group’s decision-making processes.
Risk area Description Mitigation
Economic environment
The Group operates in the global economy and ultimately within a retail environment to consumer end-user musicians and such operations are influenced by global and national economic factors.
The Group sells products in around 160 territories worldwide via two distinct product categories and so aims to avoid being unduly reliant on any single product or territory.
Technological changes, product innovation and competition
The market for the Group’s products is characterised by continued evolution in technology, evolving industry standards, changes in customer needs and frequent new competitive product introductions. If the Group is unable to anticipate or respond to these challenges, or fails to develop and introduce successful products on a timely basis, it could have an adverse impact on the Group’s business and prospects.
The Group invests significantly in its research and development and operates a rigorous, disciplined product introduction process to ensure that as far as possible the fast -changing needs of its target markets are met. In addition, the Board aims to operate an efficient, low-cost business.
Dependence on a small number of suppliers
The Group is dependent on a small number of suppliers, in particular its largest supplier, which supplies Focusrite interfaces. Failure or material delay by its suppliers to perform or failure by the Group to renew such arrangements could have a material adverse effect on the Group’s business, operating results and financial position.
The Group diversifies its risk by using four major Chinese manufacturers for the production of its products. Relationships are long lasting and strong. Typically, members of the Operations department within Focusrite meet each supplier every quarter to review performance and costs.
Key resellers and
distributors In certain countries, the Group operates via a single distributor or has large individual reseller customers. In certain cases, a failure of or breakdown in the relationship with a key reseller could significantly and adversely affect the Group's business.
In cases where there is a large distributor in a significant market (e.g. the USA), the Group also maintains contact with the major retailers. In addition, the Group carefully monitors customer credit limits and has credit insurance which typically covers 90% of the customer debts outstanding at any point in time.
Development of the channels to market
Significant change in the methods by which end- users wish to buy Focusrite products could significantly affect the Group’s business.
In each market, the Group or its distributors sell to both ‘bricks and mortar’ and eCommerce retailers so that the Group can satisfy customer demand via both methods.
13
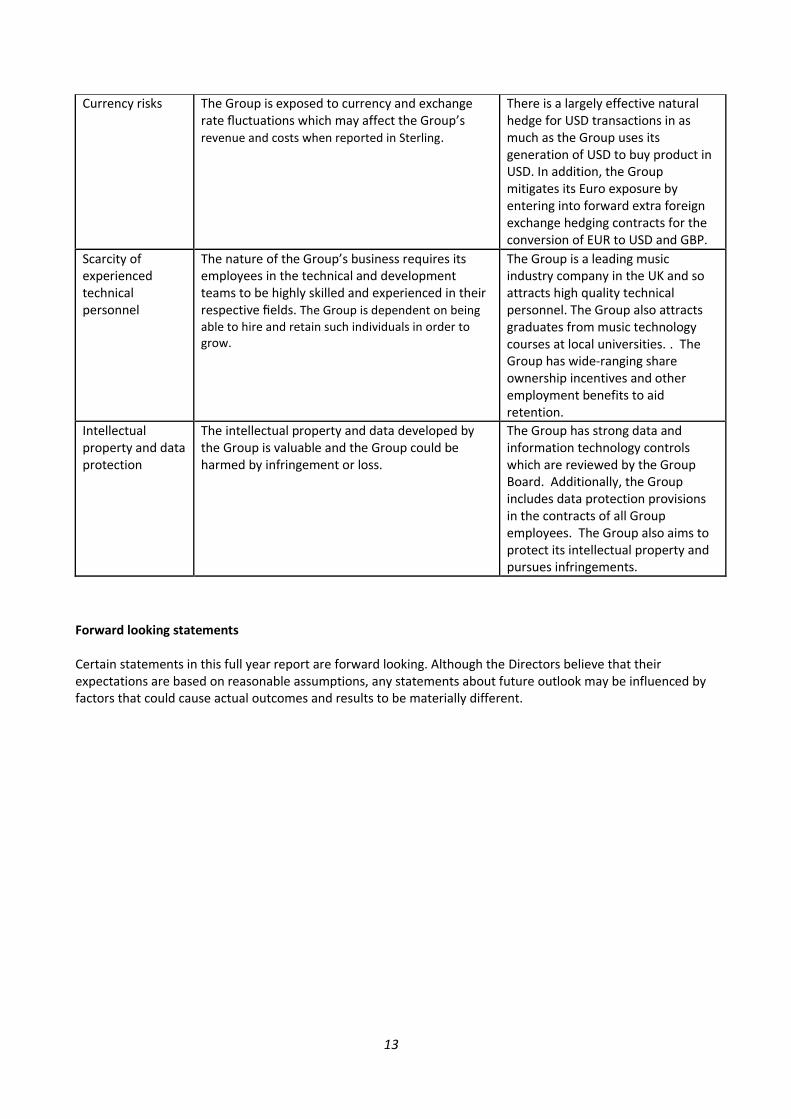
Currency risks The Group is exposed to currency and exchange rate fluctuations which may affect the Group’s revenue and costs when reported in Sterling.
There is a largely effective natural hedge for USD transactions in as much as the Group uses its generation of USD to buy product in USD. In addition, the Group mitigates its Euro exposure by entering into forward extra foreign exchange hedging contracts for the conversion of EUR to USD and GBP.
Scarcity of experienced technical personnel
The nature of the Group’s business requires its employees in the technical and development teams to be highly skilled and experienced in their respective fields. The Group is dependent on being
able to hire and retain such individuals in order to grow.
The Group is a leading music industry company in the UK and so attracts high quality technical personnel. The Group also attracts graduates from music technology courses at local universities. . The Group has wide-ranging share ownership incentives and other employment benefits to aid retention.
Intellectual property and data protection
The intellectual property and data developed by the Group is valuable and the Group could be harmed by infringement or loss.
The Group has strong data and information technology controls which are reviewed by the Group Board. Additionally, the Group includes data protection provisions in the contracts of all Group employees. The Group also aims to protect its intellectual property and pursues infringements.
Forward looking statements Certain statements in this full year report are forward looking. Although the Directors believe that their expectations are based on reasonable assumptions, any statements about future outlook may be influenced by factors that could cause actual outcomes and results to be materially different.
14
Consolidated income statement
For the year ended 31 August 2015
2015 2014
Note £'000 £'000
Revenue 48,029 40,965
Cost of sales (29,381) (25,068)
Gross profit 18,648 15,897
Other gains and losses - 15
Administrative expenses (12,328) (10,202)
Adjusted EBITDA (non GAAP measure) 9,302 8,228
Depreciation and amortisation (2,278) (1,796)
Non-underlying items (704) (722)
Operating profit 6,320 5,710
Finance income 164 186
Finance costs - (86)
Profit before tax 6,484 5,810
Income tax expense 5 (1,022) (763)
Profit for the period from continuing operations 5,462 5,047
Earnings per share
From continuing operations
Basic (pence per share) 7 10.4 10.3
Diluted (pence per share) 7 9.3 8.8
Consolidated statement of comprehensive income
For the year ended 31 August 2015
2015 2014 £'000 £'000
Profit for the period 5,462 5,047
Exchange differences on translation of foreign operations - -
Total comprehensive income for the period 5,462 5,047
Profit attributable to:
Equity holders of the Company 5,462 5,047
5,462 5,047
15
Consolidated statement of financial position
As at 31 August 2015
2015 2014
Note £'000 £'000
Assets
Non-current assets
Goodwill 419 419
Other intangible assets 3,522 2,616
Property, plant and equipment 1,323 939
Deferred tax asset - 34
Total non-current assets 5,264 4,008
Current assets
Inventories 8,633 6,596
Trade and other receivables 7,737 6,367
Other investments including derivatives 223 118
Cash and cash equivalents 8 6,173 3,803
Total current assets 22,766 16,884
Total assets 28,030 20,892
Equity and liabilities
Capital and reserves
Share capital 58 52
Merger reserve 14,595 -
Merger difference reserve (13,147) 1,448
Translation reserve (6) (6)
Treasury share reserve (6) -
Retained earnings 16,984 11,714
Equity attributable to owners of the Company 18,478 13,208
Total equity 18,478 13,208
Current liabilities
Trade and other payables 8,406 6,688
Current tax liabilities 403 432
Total current liabilities 8,809 7,120
Non-current liabilities
Deferred tax 743 564
Total liabilities 9,552 7,684
Total equity and liabilities 28,030 20,892
16
Consolidated statement of changes in equity
for the year ended 31 August 2015
Share capital
Merger reserve
Merger difference
reserve Translation
reserve
Treasury share
reserve3
Share based
payment reserve
Retained earnings Total
£'000 £’000 £’000 £'000 £'000 £'000 £'000 £'000
Balance at 1 September 2013 49
-
1,218 (6) - 128
10,771
12,160
Profit for the period -
-
- - - -
5,047
5,047 Total comprehensive income for the period -
-
- - - -
5,047
5,047
Transactions with owners of the Company:
Issue of ordinary shares 3 - 230 - - - - 233
Share-based payments - - - - - 12 - 12
Dividends - - - - - - (4,244) (4,244)
Balance at 31 August 2014 52
-
1,448 (6) - 140
11,574
13,208
Profit for the period -
-
- - - -
5,462
5,462 Total comprehensive income for the period -
-
- - - -
5,462
5,462
Transactions with owners of the Company:
Issue of ordinary shares 6 - - - - - - 6 Ordinary shares issued to the EBT -
3 The reserve for the Company’s treasury shares comprises the cost of the Company’s shares held by the Group. At 31 August 2015, the Employee Benefit Trust held 5,676,000 of the Company’s shares (2014: nil)
17
Consolidated cash flow statement
for the year ended 31 August 2015
2015 2014
Note £'000 £'000
Net cash from operating activities 8 6,243 8,804
Investing activities
Purchases of property, plant and equipment (782) (783)
Investment in intangible assets (2,778) (1,887)
Proceeds from disposal of non-current assets 1 100
Net cash from/(used in) investing activities (3,559) (2,570)
Financing activities
Issue of equity shares - 233
Equity dividends paid 6 (314) (4,244)
Net cash (used in) financing activities (314) (4,011)
Net increase/(decrease) in cash and cash equivalents 2,370 2,223
Cash and cash equivalents at beginning of year 3,803 1,580
Cash and cash equivalents at end of year 6,173 3,803
18
Notes to the Group financial statements
Basis of preparation
These condensed preliminary financial statements of the Company and its subsidiaries ("the Group") for the year
ended 31 August 2015 have been prepared using accounting policies consistent with International Financial
Reporting Standards (IFRSs).
The information contained within this announcement has been extracted from the audited financial statements
which have been prepared in accordance with IFRS as adopted by the European Union ('adopted IFRS'), and with
those parts of the Companies Act 2006 applicable to companies reporting under adopted IFRS. They have been
prepared using the historical cost convention except where the measurement of balances at fair value is
required.
The Directors believe that the Group is well placed to manage its business risks successfully despite the current
uncertainties within the global economy. The Group has considerable financial resources, ongoing revenue
streams and a broad spread of customers. As a consequence of these factors and having reviewed the forecasts
for the coming year, the Directors have a reasonable expectation that the Group has adequate resources to
continue in operational existence for the foreseeable future. Thus, they continue to adopt the going concern
basis of accounting in preparing these financial statements.
Availability of audited accounts:
Copies of the 31 August 2015 audited accounts will be will be available on 10 December on the Company’s website (www.focusriteplc.com/investors) for the purposes of AIM rule 26 and will be posted to shareholders in due course.
1 Revenue
An analysis of the Group’s revenue is as follows:
Year ended 31 August
2015 2014
£'000 £'000
Continuing operations
USA 18,498 14,307 Europe, Middle East and Africa 21,460 19,612
Rest of World 8,071 7,046
Consolidated revenue 48,029 40,965
19
2 Business Segments
Information reported to the Group’s Chief Executive (who has been determined to be the Group’s Chief Operating Decision Maker) for the purposes of resource allocation and assessment of segment performance is focused on the main product groups which Focusrite sells. The Group’s reportable segments under IFRS 8 are therefore as follows:
Focusrite Sales of Focusrite branded products
Novation Sales of Novation branded products
Distribution Distribution of third party brands including KRK speakers, Ableton, Stanton, Cerwin Vega and Cakewalk
Segment revenues and results
The following is an analysis of the Group’s revenue and results by reportable segment:
Year ended 31 August
2015 2014
£'000 £'000
Revenue from external customers
Focusrite 31,187 26,820
Novation 14,169 11,544
Distribution 2,673 2,601
Total 48,029 40,965
Segment profit Focusrite 14,221 12,814
Novation 6,842 6,270
Distribution 846 918
21,909 20,002
Central distribution costs and administrative expenses (14,885) (13,570)
Adjusted operating profit before non-underlying items 7,024 6,432
Non-underlying items (704) (722)
Operating profit 6,320 5,710
Finance income 164 186
Finance costs - (86)
Profit before tax 6,484 5,810
Tax (1,022) (763)
Profit after tax 5,462 5,047
The accounting policies of the reportable segments are the same as the Group’s accounting policies. Segment profit represents the profit earned by each segment without allocation of the share of central administration costs including Directors’ salaries, investment revenue and finance costs, and income tax expense. This is the measure reported to the Group’s Chief Executive for the purpose of resource allocation and assessment of segment performance.
Central administration costs comprise principally the employment related costs and other overheads incurred by Focusrite and its US subsidiary, net of inter-Company commission income. Also included within central administration costs is the charge relating to the share option scheme of £122,000 for the year ended 31 August 2015 (2014: £12,000).
20
Segment net assets and other segment information
Management does not make use of segmental data relating to net assets and other balance sheet information
for the purposes of monitoring segment performance and allocating resources between segments. Accordingly,
other than the analysis of the Group’s non-current assets by geographical location shown below, this information
is not available for disclosure in the consolidated financial information.
The Group’s non-current assets, analysed by geographical location were as follows:
2015 2014
£'000 £'000
Non-current assets
USA 29 14
Europe, Middle East and Africa 4,683 3,714
Rest of World 552 280
Total non-current assets 5,264 4,008
Information about major customers
Included in revenues shown for 2015 is £18.5 million (2014 £14.3 million) attributed to the Group’s largest
customer, American Music & Sound. Amounts owed at end of year is £2.7 million (2014 £3.2 million)
3 Profit for the year
Profit for the year has been arrived at after charging (crediting):
Continuing operations
Year ended 31 August
2015 2014
Note £’000 £’000
Net foreign exchange (gains)/losses 8 (53) 86
Research and development costs 743 620
IPO related costs 4 704 552
Depreciation and impairment of property, plant and equipment 374 423
Profit on disposal of property, plant and equipment (1) (100)
Amortisation of intangibles 1,902 1,461
Operating lease rental expense 156 130
Cost of inventories recognised as an expense 25,606 20,681
Staff costs 6,059 5,656
Impairment loss recognised on trade receivables 12 41
Change in fair value of financial instruments (105) (127)
Share-based payments charge to profit and loss 122 12
4 Non-underlying items
In December 2014, the Group floated on the London Stock Exchange AIM market. Non-recurring IPO related
costs totalled £704,000, which were charged to the income statement (31 August 2014: £552,000). In addition,
in 2014 the Group made a non-recurring pension contribution of £170,000 to the Chairman.
21
5 Tax
Year ended 31 August
2015 2014 £'000 £'000
Corporation tax charges:
Overprovision in prior year (69) -
Current year 878 627
809 627
Deferred taxation
Current year 213 136
1,022 763
Corporation tax is calculated at 20.58% (2014: 22.17%) of the estimated taxable profit for the year. Taxation for the US subsidiary is calculated at the rates prevailing in the respective jurisdiction. The tax charge for each year can be reconciled to the profit per the income statement as follows:
Year ended 31 August
2015 2014
£'000 £'000
Current taxation
Profit before tax on continuing operations 6,484 5,810
Tax at the UK corporation tax rate of 20.58% (2014: 22.17%) 1,334 1,288
Effects of:
Expenses that are not deductible in determining taxable profit 564 128
R&D tax credit (816) (633)
Overseas tax 36 22
Prior period adjustment (69) -
Other reconciling items - 1
Effect of change in standard rate of corporation tax (27) (43)
Current tax charge for period 1,022 763
6 Dividends
The following equity dividends have been declared and paid.
Year ended 31 August
2015 2014
£'000 £'000
0.6p per qualifying ordinary share (2014: equivalent to 8.1p per qualifying ordinary share) 314 4,244
314 4,244
During the year, the Company paid an interim dividend in respect of the year ended 31 August 2015 of 0.6pence per share, amounting to £314,394. On 9 December 2015, the Directors recommended a final dividend of 1.2 pence per share, making a total of 1.8 pence per share for the year.
22
7 Earnings per share
Reported earnings per share
The calculation of the basic and diluted earnings per share is based on the following data:
Year ended 31 August Earnings 2015 2014
£'000 £'000
Earnings for the purposes of basic and diluted earnings per share being net profit for the period 5,462 5,047
Year ended 31 August
2015 2014
Number Number
'000 '000
Number of shares
Weighted average number of ordinary shares for the purposes of basic earnings per share calculation 52,399 49,208
Effect of dilutive potential ordinary shares 6,416 8,143
Weighted average number of ordinary shares for the purposes of diluted earnings per share calculation
58,815 57,351
Earnings per share Pence Pence
Basic earnings per share 10.4 10.3
Diluted earnings per share 9.3 8.8
At 31 August 2015, the total number of ordinary shares issued and fully paid was 58,075,000. This included
5,676,000 shares held by the Employee Benefit Trust to satisfy options vesting in future years. The operation of
this Employee Benefit Trust is funded by the Group so the EBT is required to be consolidated, with the result
that the weighted average number of ordinary shares for the purpose of the basic earnings per share calculation
is the net of the total number of shares in issue (58,075,000) less the number of shares held by the Employee
Benefit Trust (5,676,000). It should be noted that the only right relinquished by the Trustees of the Employee
Benefit Trust is the right to receive dividends. In all other respects, the shares held by the Employee Benefit Trust
have full voting rights.
The effect of dilutive potential ordinary share issues is calculated in accordance with IAS 33 and arises from the employee share options currently outstanding, adjusted by the profit element as a proportion of the average share price during the period. Diluted EPS in 2014 has not been restated for any subsequent changes in assumptions made in calculating the effect of dilutive potential ordinary share issues such as average share price.
23
Adjusted earnings per share
Year ended 31 August
Earnings 2015 2014
£'000 £'000
Profit for the financial period 5,462 5,047
Non-underlying items 704 722
Total underlying profit for adjusted earnings per share calculation 6,166 5,769
Year ended 31 August
2015 2014
Number Number
'000 '000
Number of shares
Weighted average number of ordinary shares for the purposes of basic earnings per share calculation 52,399 49,208
Effect of dilutive potential ordinary shares 6,416 8,143
Weighted average number of ordinary shares for the purposes of diluted earnings per share calculation
58,815 57,351
Earnings per share Pence Pence
Adjusted basic earnings per share 11.8 11.7
Adjusted diluted earnings per share 10.5 10.1
8 Notes to the cash flow statement
2015 2014
Note £'000 £'000
Profit for the financial year 5,462 5,047
Adjustments for:
Income tax expense 5 1,022 763
Net interest (164) (100)
(Profit) on disposal of property, plant and equipment (1) (100)
Amortisation of intangibles 1,902 1,461
Depreciation of property, plant and equipment 368 423
Share-based payments charge 122 12
Operating cash flows before movements in working capital 8,711 7,506
(Increase)/decrease in trade and other receivables (1,370) 1,378
(Increase)/decrease in inventories (2,037) 307
Increase in trade and other payables 1,718 466
Operating cash flows before interest and tax paid 7,022 9,657
Net interest received 6 59
Income taxes paid (838) (826)
Cash generated by operations 6,190 8,890
24
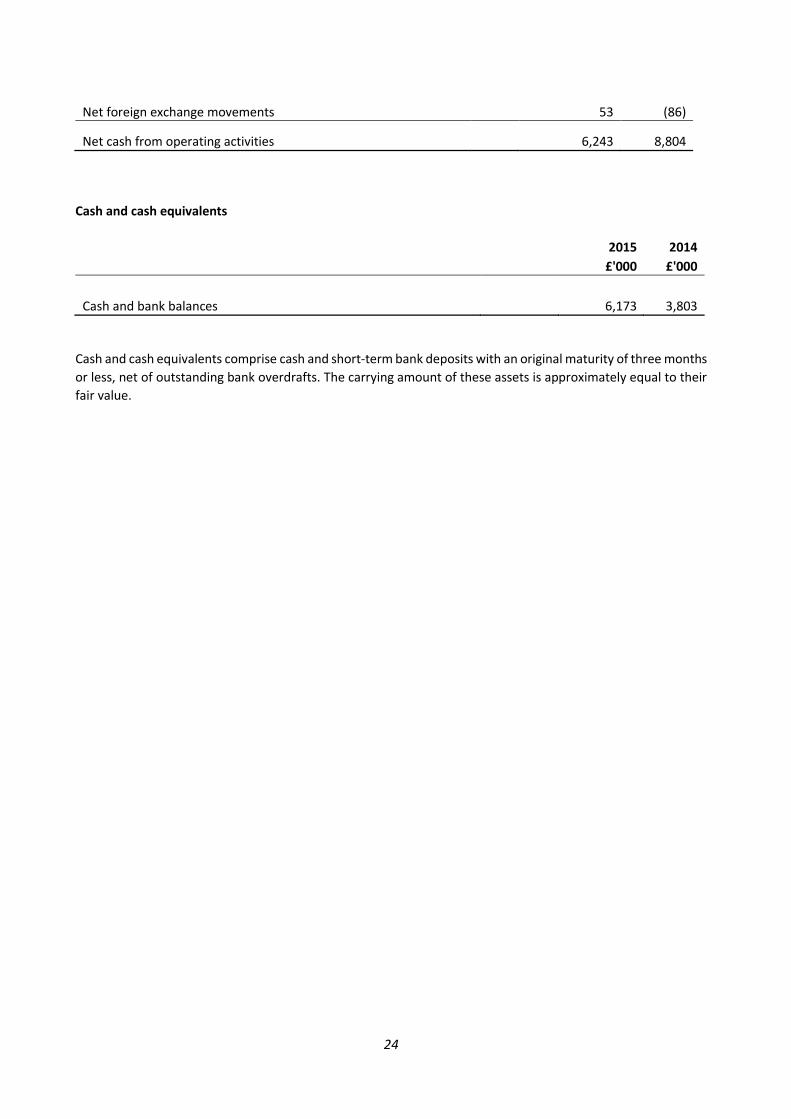
Net foreign exchange movements 53 (86)
Net cash from operating activities 6,243 8,804
Cash and cash equivalents
2015 2014
£'000 £'000
Cash and bank balances 6,173 3,803
Cash and cash equivalents comprise cash and short-term bank deposits with an original maturity of three months
or less, net of outstanding bank overdrafts. The carrying amount of these assets is approximately equal to their