72
Strive, lead, excel To Make a Difference Report of the Auditor-General Volume 1 - Analysis of Treasurer’s Annual Financial Report 2009-10

Phone (03) 6226 0100Fax (03) 6226 0199email [email protected] www.audit.tas.gov.au
Address Level 4, Executive Building, 15 Murray Street, HobartPostal Address GPO Box 851, Hobart 7001Office Hours 9am to 5pm Monday to Friday
Strive, lead, excel To Make a Difference
Report of the Auditor-General
Volume 1 - Analysis of Treasurer’s Annual Financial Report 2009-10
Report of the Auditor-General Volum
e 1 - Analysis of Treasurer’s Annual Financial Report 2009-10

AUDIT MANDATE AND STANDARDS APPLIED
MANDATE
Section 17(1) of the Audit Act 2008 states that “… An accountable authority other than the Auditor-General, as soon as possible and within 45 days after the end of each financial year, is to prepare and forward to the Auditor-General a copy of the financial statements for that financial year which are complete in all material respects. …”
Under the provisions of section 18, the Auditor-General:
“...(1) is to audit the financial statements and any other information submitted by a State entity or an audited subsidiary of a State entity under section 17(1).”
Under the provisions of section 19, the Auditor-General:
“...(1) is to prepare and sign an opinion on an audit carried out under section 18(1) in accordance with requirements determined by the Australian Auditing and Assurance Standards.
(2) is to provide the opinion prepared and signed under subsection (1), and any formal communication of audit findings that is required to be prepared in accordance with the Australian Auditing and Assurance Standards, to the State entity’s appropriate Minister and provide a copy to the relevant accountable
authority.”
STANDARDS APPLIED
Section 31 specifies that:
“… The Auditor-General is to perform the audits required by this or any other Act in such a manner as the Auditor-General thinks fit having regard to –
(a) the character and effectiveness of the internal control and internal audit of the relevant State entity or audited subsidiary of a State entity; and
(b) the Australian Auditing and Assurance Standards. …”
The auditing standards referred to are Australian Auditing Standards as issued by the Australian Auditing and Assurance Standards Board.
ThE RoLE of ThE AUDIToR-GENERAL
The roles and responsibilities of the Auditor-General, and therefore of the Tasmanian Audit Office, are set out in the Audit Act 2008 (the Act).
Our primary responsibility is to conduct financial or ‘attest’ audits of the annual financial reports of State entities. As defined by the Act, State entity includes all public sector entities and those established under the Local Government Act 1993. Specifically, the definition covers an agency, council, Government Business Enterprise, State-owned Company, State Authority, Corporations established by the Water and Sewerage Corporations Act 2008 and the governing body of any corporation, body of persons or institution that are appointed by a Minister or by the Governor.
We also audit those elements of the Treasurer’s Annual Financial Report which report on financial transactions in the Public Account, the General Government financial report and the Whole of Government financial report.
Audits of financial reports are designed to add credibility to assertions made by accountable authorities in preparing financial reports, enhancing their value to end users. Also, the existence of such audits provides a constant stimulus to State entities to ensure sound financial management.
In the main accountable authorities prepare financial reports consistent with Accounting Standards and other mandatory financial reporting requirements in Australia. On occasion reports are “special purpose financial reports” such as the Public Account Statements. In all cases our audits are conducted in accordance with Australian Auditing Standards.
Following a financial audit, we issue a variety of reports to State entities and Responsible Ministers, and we report periodically to the Parliament. In combination these reports give opinions on the truth and fairness of financial reports, and comment on compliance with certain laws, regulations and Government directives. They may comment on financial prudence, probity and waste, and recommend operational improvements.
We also conduct performance audits, compliance audits and carry out investigations. Performance audits examine whether a State entity is carrying out its activities effectively and doing so economically and efficiently and in compliance with relevant laws. Audits may cover all or part of a State entity’s operations, or consider particular issues across a number of State entities.
Compliance audits are aimed at ensuring compliance with directives, regulations and appropriate internal control procedures. Audits focus on selected systems (including information technology systems), legislation, account balances or projects.
Investigations can relate only to public money or to public property.
Performance and compliance audits and investigations are reported separately and at different times of the year, whereas outcomes from financial statement audits are included in one of the regular volumes of the Auditor-General’s reports to the Parliament normally tabled in May and November each year. In doing so the Auditor-General is providing information to the Parliament to assist both the Legislative Council and the House of Assembly in their review of the performance of Executive Government.
Where relevant, the Treasurer, a Minister or Ministers, other interested parties and accountable authorities are provided with opportunity to comment on any matters reported. Where they choose to do so, their responses, or summaries thereof, are detailed within the reports.

2010 (No.16)
2010PARLIAMENT OF TASMANIA
REPORT OF THE AUDITOR-GENERAL
Volume 1
Analysis of Treasurer’s Annual Financial Report
November 2010
Presented to both Houses of Parliament in accordance with the requirements of Section 29 of the Audit Act 2008
ByAuthority:GovernmentPrinter,Tasmania
TASMANIA
• UBERTAS•ET•FIDELITAS •
1

2
©CrowninRightoftheStateofTasmaniaNovember2010
Auditor-General’sreportsareavailablefromtheTasmanianAuditOffice,HOBART.ThisreportandotherrecentreportspublishedbytheOfficecanbeaccessedviatheOffice’shomepage.Forfurtherinformationpleasecontact:
TasmanianAuditOfficeGPOBox851
HobartTASMANIA 7001
Phone:(03)62260100Fax(03)62260199Email:[email protected]:www.audit.tas.gov.au
Thisreportisprintedonrecycledpaper.
ISSN13272608

18 November 2010
President
Legislative Council
HOBART
Speaker
House of Assembly
HOBART
Dear Madam PresidentDear Mr Speaker
In accordance with the requirements of Section 29 of the Audit Act 2008, I have pleasure in presenting my Report on the audit of the General Government Financial Statements and Public Account Statements and the Total State Financial Statements for the year ended 30 June 2010. Te requirement of section 29(3) relating to describing the basis on which audit fees are calculated was met in my Report No 1 of 2010.
Yours sincerely
H M Blake
AUDITOR-GENERAL
16November2010

4
TABLE OF CONTENTS
FOREWORD 5
EXECUTIVE SUMMARY 6
AUDITS DISPENSED WITH 8
GENERAL GOVERNMENT SECTOR FINANCIAL STATEMENTS AND PUBLIC ACCOUNTS 11
TOTAL STATE SECTOR FINANCIAL STATMENTS 35
SPECIAL CAPITAL INVESTMENT FUNDS 55
APPENDIX 1 – GUIDE TO USING THIS REPORT 59
APPENDIX 2 – ACRONYMS AND ABBREVIATIONS 65
APPENDIX 3 – RECENT REPORTS 66
INDEX 67
VISION AND PURPOSE 68
5Foreword
FOREWORD
ThisReportprovidesananalysisoftheGeneralGovernmentSectorandTotalStateSectorfinancialstatementsandofthePublicAccountStatementswhichformpartoftheTreasurer’sAnnualFinancialReport.ItalsorepresentsachangeinthemannerinwhichwereporttoParliamentontheoutcomesofourannualauditsofthefinancialstatementsofStateentities.
Thisfinancialyearwewillprovidefiveseparatevolumes:
• Volume1(whichisthisReport)tabledon16November
• Volume2whichdealswithourauditsoftheExecutiveandLegislature,MinisterialDepartmentsandotherGeneralGovernmentSectorentities,alsotabledon16November
• Volume3whichdealswithourauditsofgovernmentbusinesses,thelocalgovernmentownedwatercompaniesandtheRetirementBenefitsFundBoardtobetabledon18November2010
• Volume4whichwilldealwithourauditsofnon-GeneralGovernmentSectorentitiesandthoseentitieswitha31December2010balancedate.WeplantotablethisreportinApril2011and
• Volume5whichwilldealwith local government councils and their subsidiaries and jointauthorities.WealsoplantotablethisreportinApril2011.
Our intentionis toprovidedetailedandsummaryanalysisatasector levelaimedatreducingthevolumeprovidedinindividualreports.
Ourauditsof thefinancial statementsof theGeneralGovernmentandTotalStateSectorsandofthePublicAccountStatementsresultedinunqualifiedauditopinionsbeingissuedintimefortheTreasurertotablethosestatementsby31October.
HMBlakeAuditor-General16November2010

6 ExecutiveSummary
EXECUTIVE SUMMARY
ThisvolumesummarisesourauditsandanalysisoftheGeneralGovernmentSector(GGS)FinancialStatements,theTotalStateSector(TSS)FinancialStatements,andPublicAccount(PA)Statementsforthefinancialyearended30June2010.FurtherdetailcanbefoundintheoverviewsummariesinthisVolumeandintheindividualChapters.
The GGS andTSS Financial Statements are prepared in accordance with Australian AccountingStandardAASB1049WholeofGovernmentandGeneralGovernmentSectorFinancialReporting.
GENERAL GOVERNMENT SECTOR
TheGeneralGovernmentSector(GGS)reporteda2009-10NetOperatingBalancesurplusof$18m(2008-09,deficit$78m).
However,excludingone-offAustralianGovernmentfundingforspecificmajorcapitalprogramstheNetOperatingBalancewasadeficitof$363m(2008-09,deficit$106m)and2009-10wasthethirdfinancialyearinarowwhereexpendituregrowthoutstrippedrevenuegrowth.
TheGGSComprehensiveResultwas$1.527bnin2009-10(2008-09,$391m),andNetWorthgrewby$1.416bnto$13.066bn.Thisimprovementwasmainlyduetoinclusionforthefirsttimeofwaterandseweragecorporations,$1.749bnandhighlevelsofcapitalworksinvestments,offsettoanextentbyanunfavourablemovementinthenetGGSunfundedSuperannuationliability.Inaddition,aninvestmentof$82mwasmadeinTasmanianRailwaysPtyLtd.
TheNetunfundedSuperannuationliabilityasat30June2010,$4.860bn,exceededtheSuperannuationProvisionAccount(SPA)by$3.496m.Thisvarianceis$1.350mor63%worsethanthedifferencethat existed at 30 June 2006 and indicates the SPA is not keeping pace with the growth in theSuperannuationliability.
Totalcashdecreasedby$261mto$966min2009-10(2008-09,$79mdecrease)andresultedinGGSNetDebtdeteriorating$234mtobefavourable$748m.
PUBLIC ACCOUNT STATEMENTS
At30June2010thebalanceoftheSpecialDepositsandTrust(SDTF)fundwas$2.376bn(2008-09,$2.346bn)beforetheTemporaryDebtRepaymentof$1.438bn($1.156bn).Inadditiontovariousinterdepartmentaloperatingaccounts,majorbalancesincludedintheSDTFweretheSuperannuationProvision Account, $1.364bn ($1.324bn), the Infrastructure Tasmania Fund, $85m ($95m),AustralianGovernmentFundingManagementAccount,$172m($113m),andtheTasmanianStateServiceRiskManagementAccount,$169m($163m).
TOTAL STATE SECTOR
TheTotal State Sector reported a 2009-10 Net Operating Balance surplus of $192m (2008-09,deficit$20m).However,excludingone-offAustralianGovernmentfundingforspecificmajorcapitalprogramstheNetOperatingBalancewasadeficitof$189m(2008-09,deficit$8m).
Grant revenues represented 39% (2008-09, 40%) and State taxes 12% (2008-09, 12%) of totalrevenuesandEmployeeexpenseswere33%(2008-09,33%)oftotalexpenses.
TheState’sNetOperatingResultwasadeficitof$697m.ItincludedanincreaseintheState’sunfundedSuperannuationliabilityof$755m.
The Comprehensive Result for 2009-10 was a surplus of $1.416bn, (2008-09, $268m). Thisimprovementwasmainlyduetoinclusionofwaterandseweragecorporations,$1.749bn,offsetby

7ExecutiveSummary
theunfavourablemovementintheunfundedSuperannuationliability.
TheState’sNetWorthwas$13.065bnat30June2010comparedto$11.650bnayearearlier.Thisimprovementof$1.416bn,linesupwiththeComprehensiveresult.However,cashandcashequivalentsdecreased$1.115bnasfundswereappliedtorepayingdebtandinvestmentsininfrastructure.
Despitedebtrepaymentsin2009-10,atatotalstatelevel,NetDebtdeteriorated$555mtounfavourable$962m.ThehigherNetdebtwasdue to thedecrease inCashand Investments,$1.470bn,beinggreaterthanthenetdecreaseinBorrowingsof$0.916bn.

8 AuditsDispensedWith
AUDITS DISPENSED WITH
The Auditor-General has the discretion, under the Audit Act to dispense with certainaudits ifconsideredappropriateinthecircumstances.ThedispensationissubjecttoconditionsdeterminedbytheAuditor-General.Wehaveimposedthefollowingconditions:
• thattheentitymustdemonstratetousthatitsfinancialreportingandauditingarrangementsareappropriate.
• Tosatisfythiscondition,thedispensedwithauditentitiesarerequiredtosubmittheirauditedfinancialstatementstouseachyear.Thefinancialstatementsarereviewedand,wherenecessary,feedbackisprovidedtotheentityor
• thattheentityisasubsidiaryofaStateentitywhosefinancialtransactionsandbalancesareauditedaspartofthepreparationoftheconsolidatedfinancialstatementsofthecontrollingentityor
• grantsmadetoacategoryofentitiesareproperlymanagedunderTreasurer’sInstruction709“GrantManagementFramework”(discussedfurtherundertheheading‘CategoriesofauditsandNon-GovernmentOrganisations’laterinthisChapter).
TheAuditActalsorequirestheAuditor-GeneraltoconsultwiththeTreasurerbeforeexercisingthepowertodispensewithaudits.ItisimportanttonotethatdispensingwiththeauditdoesnotlimitanyoftheAuditor-General’sfunctionsorpowersgivenundertheAuditAct.
FollowingconsultationwiththeTreasurer,theauditsoftheannualfinanciastatementsofthefollowingspecificaudits,orcategoriesofaudits,weredispensedwith:
SPECIFIC AUDITS
Controlled Subsidiaries – Year Ended 30 June 2010 (controlling entity shown inbrackets)
• AgilityInteractivePtyLtd(TOTETasmaniaPtyLtd)
• AuroracomPtyLtd(AuroraEnergyPtyLtd)
• AuroraEnergy(TamarValley)PtyLtd(AuroraEnergyPtyLtd)
• AuroraGasPtyLtd(AuroraEnergyPtyLtd)
• EzikeyGroupPtyLtd(AuroraEnergyPtyLtd)
• FlindersIslandPortsCorporationPtyLtd(TasmanianPortsCorporationPtyLtd)
• MetroCoaches(Tas)PtyLtd(MetroTasmaniaPtyLtd)
• NewoodEnergyPtyLtd(NewoodHoldingsPtyLtd)
• NewoodHuonPtyLtd(NewoodHoldingsPtyLtd)
• NewoodSmithtonPtyLtd(NewoodHoldingsPtyLtd)
• PortsLogisticsandServicesPtyLtd(TasmanianPortsCorporationPty
• Ltd);woundupandderegistered9January2010
• TasRadioPtyLtd(TOTETasmaniaPtyLtd).

9AuditsSuspensedWith
Drainage Trusts – Year Ended 30 June 2010
• BrittonsSwampDistrictWaterBoard
• BrittonsSwampDrainageTrust
• CheshuntDrainageTrust(dissolved2June2010)
• EggLagoonDrainageTrust
• ForthsideIrrigationWaterTrust
• LakeNowhere-ElseDam/WhitehawkCreekIrrigationTrust
• LawrennyIrrigationTrust
• LowerGeorgesRiverWorksTrust
• MowbraySwampDrainageTrust
• RichmondIrrigationTrust
• TogariDrainageTrust.
WenotethattheMinisterexemptedtheLowerGeorgesRiverWorksTrustfromsubmittingfinancialstatementsuntilSeptember2009forthefinancialperiodNovember2007toJune2009astheTrustwasonly formed inNovember2007. Therefore, thisTrust’sfirstfinancial statementswill coveraperiodcommencing1October2009.
Registration Boards – Year Ended 30 June 2010
• ChiropractorsandOsteopathsRegistrationBoard*
• DentalBoardofTasmania*
• DentalProsthetistsRegistrationBoard*
• MedicalCouncilofTasmania*
• MedicalRadiationScienceProfessionalsRegistrationBoard
• NursingBoardofTasmania*
• OptometristsRegistrationBoard*
• PhysiotherapistsRegistrationBoard*
• PodiatristsRegistrationBoard*
• PsychologistsRegistrationBoard*
• SchoolsRegistrationBoard.
* Indicates Registration Boards which ceased to exist on 30 June 2010 due to the establishmentofasinglenationalregistrationandaccreditationregime.NetassetsweretransferredtothenewlyestablishedAustralianHealthPractitionerRegulationAgency.Finalauditedfinancialstatementshavebeenreceived,orarrangementstoobtainthemhavebeenmade,fortheyearended30June2010.
Drainage Trusts – Year Ended 31 July 2010
• ElizabethMacquarieIrrigationTrust.

10 AuditsDispensedWith
Registration Boards – Year Ending 31 December 2010
• PlumbersandGasfittersRegistrationBoard.
Categories of audits and Non-Government Organisations
ThedefinitionofStateentitiesencompassespublicbodiesandNon-GovernmentOrganisationsthattraditionallyareinreceiptofGovernmentgrants.AgenciesmanagingthesegrantsaresubjecttotheprovisionsofTreasurer’sInstruction709–“Grant Management Framework”.
CompliancewiththerequirementsofTreasurer’sInstruction709shouldensureappropriatereportingand auditing requirements are satisfied. It is our intention to keep the status quo, that is, thoseagenciesdispensingthefundswillberesponsibleforimplementingandmonitoringtherequirementsoftheaboveTreasurer’sInstruction.
As a result, separate audits of these entities were not conducted by our Office and we have notspecificallydispensedwitheachoftheseaudits.
11GGSStatementsandPAStatements
GENERAL GOVERNMENT SECTOR FINANCIAL STATEMENTS AND PUBLIC ACCOUNT STATEMENTS
OVERVIEW
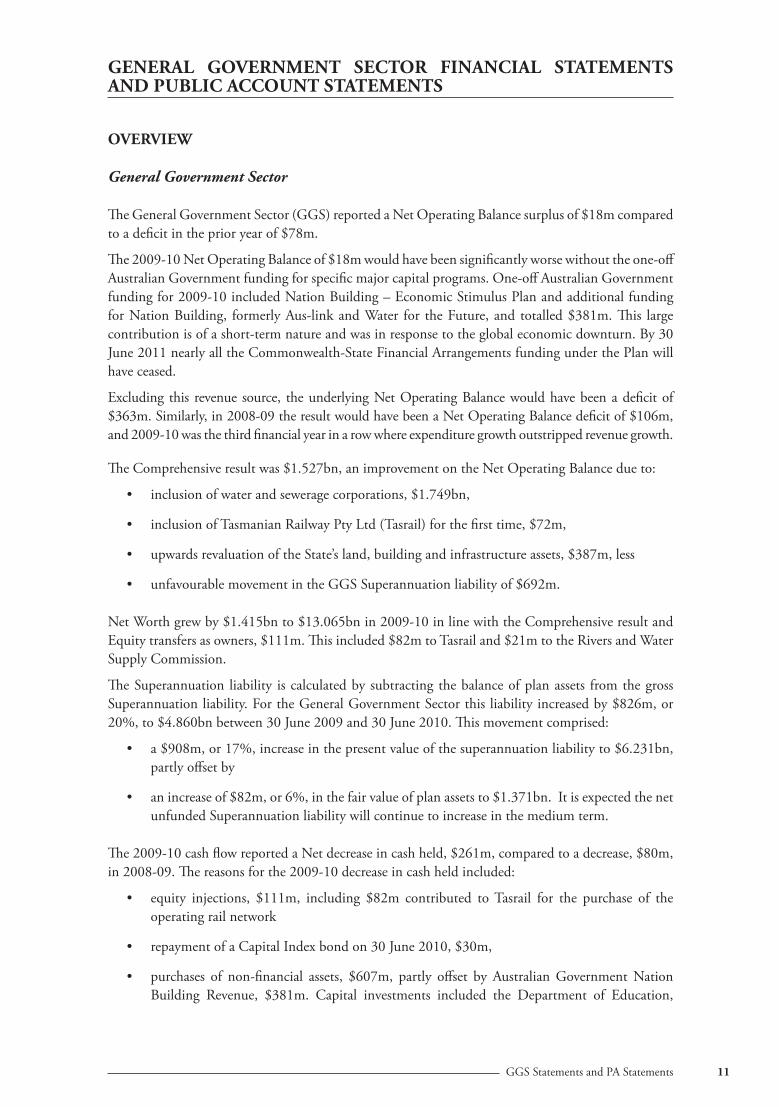
General Government Sector
TheGeneralGovernmentSector(GGS)reportedaNetOperatingBalancesurplusof$18mcomparedtoadeficitintheprioryearof$78m.
The2009-10NetOperatingBalanceof$18mwouldhavebeensignificantlyworsewithouttheone-offAustralianGovernmentfundingforspecificmajorcapitalprograms.One-offAustralianGovernmentfundingfor2009-10includedNationBuilding–EconomicStimulusPlanandadditionalfundingforNationBuilding, formerlyAus-linkandWater for theFuture,and totalled$381m.This largecontributionisofashort-termnatureandwasinresponsetotheglobaleconomicdownturn.By30June2011nearlyalltheCommonwealth-StateFinancialArrangementsfundingunderthePlanwillhaveceased.
Excluding this revenue source, theunderlyingNetOperatingBalancewouldhavebeenadeficitof$363m.Similarly,in2008-09theresultwouldhavebeenaNetOperatingBalancedeficitof$106m,and2009-10wasthethirdfinancialyearinarowwhereexpendituregrowthoutstrippedrevenuegrowth.
TheComprehensiveresultwas$1.527bn,animprovementontheNetOperatingBalancedueto:
• inclusionofwaterandseweragecorporations,$1.749bn,
• inclusionofTasmanianRailwayPtyLtd(Tasrail)forthefirsttime,$72m,
• upwardsrevaluationoftheState’sland,buildingandinfrastructureassets,$387m,less
• unfavourablemovementintheGGSSuperannuationliabilityof$692m.
NetWorthgrewby$1.415bnto$13.065bnin2009-10inlinewiththeComprehensiveresultandEquitytransfersasowners,$111m.Thisincluded$82mtoTasrailand$21mtotheRiversandWaterSupplyCommission.
TheSuperannuation liability iscalculatedbysubtractingthebalanceofplanassets fromthegrossSuperannuationliability.FortheGeneralGovernmentSectorthisliabilityincreasedby$826m,or20%,to$4.860bnbetween30June2009and30June2010.Thismovementcomprised:
• a$908m,or17%,increaseinthepresentvalueofthesuperannuationliabilityto$6.231bn,partlyoffsetby
• anincreaseof$82m,or6%,inthefairvalueofplanassetsto$1.371bn.ItisexpectedthenetunfundedSuperannuationliabilitywillcontinuetoincreaseinthemediumterm.
The2009-10cashflowreportedaNetdecreaseincashheld,$261m,comparedtoadecrease,$80m,in2008-09.Thereasonsforthe2009-10decreaseincashheldincluded:
• equity injections, $111m, including $82m contributed toTasrail for the purchase of theoperatingrailnetwork
• repaymentofaCapitalIndexbondon30June2010,$30m,
• purchases of non-financial assets, $607m, partly offset by Australian Government NationBuilding Revenue, $381m. Capital investments included the Department of Education,

12 GGSStatementsandPAStatements
$216m, Department of Health and Human Services, $111m, and Department ofInfrastructure,EnergyandResources,$202m.
Netcashflowsfromoperatingactivitiesfor2009-10was$39mcomparedto$272mfor2008-09.Thedeclineincashgeneratedfromoperatingactivitiesincluded:
• higherEmployeeentitlementsandsuperannuationcosts,$188m,
• increasedGrantpayments,$132m.
These higher cash outflows were partly offset by increased Grants received, $96m, and increasedTaxationrevenues,$75m.
Public Account Statements
At30June2010thebalanceoftheSpecialDepositsandTrust(SDTF)fundwas$2.376bn(2008-09,$2.346bn)beforetheTemporaryDebtRepaymentof$1.438bn($1.156bn).MajorbalancesincludedintheSDTFwere:
• SuperannuationProvisionAccount,$1.364bn($1.324bn),
• variousinfrastructurefunds,includingtheInfrastructureTasmaniaFund,$85m($95m),
• AustralianGovernmentFundingManagementAccount,$172m($113m),
• TasmanianStateServiceRiskManagementAccount,$169m($163m),
• Otherdepartmentaloperatingaccounts.Forexample,EconomicDevelopment,TourismandtheArts,$28m($32m),HealthandHumanServices,$85m($58m),andPrimaryIndustries,Parks,WaterandEnvironment,$124m($145m).

13GGSStatementsandPAStatements
INTRODUCTION
The General Government Sector Financial Statements (the GGS Statements) are prepared inaccordance with Australian Accounting Standard AASB 1049 Whole of Government and General Government Sector Financial Reporting.TheyincorporatethereportingrequirementsoftheAustralianAccountingStandardsBoard(AASB)andtheUniformPresentationFramework(UPF),basedonthereportingstandardsoftheAustralianBureauofStatistics’GovernmentFinanceStatisticsframework.The GGS Statements comprise a Statement of Comprehensive Income, Statement of FinancialPosition,StatementofCashFlows,StatementofChangesinEquityandnotesthereto.
ExplanationsoftheUPFKeyFiscalAggregatesforpreparingtheGGSStatementsareprovidedinnotestotheGGSStatementsandarenotreproducedhere.
ThePublicAccountStatements(thePAStatements)areaspecialpurposefinancialreportpreparedonacashaccountingbasis.ExplanationsforapplyingthisbasisforthePAStatementsareprovidedinNote1totheStatementsandarenotreproducedhere.
LEGISLATIVE REQUIREMENTS
TheTreasurerandtheSecretaryoftheDepartmentofTreasuryandFinancesignbothStatements,whichareincludedaschapterswithintheTreasurer’sAnnualFinancialReport(theTAFR).
TherequirementforTAFRtobepreparedisinsection26AoftheFinancial Management and Audit Act 1990(FMAA),whichrequiresthat:
1)Assoonaspracticableaftertheendofeachfinancialyear,theTreasureristoprepareanannualreportforthatfinancialyear.
2)Theannualreportistocontainforthefinancialyeartowhichthereportrelates-
a) TheoriginalestimatesdisclosedinthebudgetpapersinrespectofthemajorGovernmentFinanceStatisticsstatements
b) TheresultsinrespectofthemajorGFSstatements
c) Statements reporting on the transactions within the Public Account during thatfinancialyearandthebalancesinthePublicAccountattheendofthatfinancialyear
d) Anexplanationofanysignificantvariationsbetweentheresultsforthefinancialyearandthefinancialestimatesandprojectionsdescribedinthebudgetpapers
e) AnassessmentoftheGovernment’sfiscalperformanceagainstitscurrentfiscalstrategystatement,withinthemeaningoftheCharterofBudgetResponsibilityAct2007
f ) TheAuditor-General’sreportontheresultsandstatementsreferredtoinsection16oftheAuditAct.
3)TheTreasurermayincludeintheannualreport,insuchformormannerastheTreasurermaydetermine,anyotherfinancialorstatisticalreport.
The GGS Statements satisfy the requirements specified in section 26A(2)(b) above and the PAStatementssatisfytherequirementsspecifiedinsection26A(2)(c).

14 GGSStatementsandPAStatements
AUDIT OF THE 2009-10 GENERAL GOVERNMENT SECTOR FINANCIAL STATEMENTS AND PUBLIC ACCOUNT STATEMENTS
Statementsreferredtoinsections26A(2)(b)and(c)oftheFMAAmustbesubmittedtotheAuditorGeneralforauditbefore30Septemberineachyear.SignedGGSStatementsandsignedPAStatementswerereceivedon27September2010.
The Treasurer is required to table in the Parliament audited GGS Statements and audited PAStatementsbynolaterthan31October2010.Separateunqualifiedauditopinionswereissuedon20October2010.
Auditsof the2009-10GGSFinancialStatementsandof thePAStatementswerecompletedwithsatisfactoryresultsandnomajorissuesoutstanding.
GENERAL GOVERNMENT FINANCIAL STATEMENTS
CommentsinthisChaptershouldbereadalongwiththeTAFRandGGSStatementswhichincludeaudited and un-audited commentary explaining 2009-10 financial results against prior years andbudget.
Inpreparingthisanalysis,somematerialthatdoesnotappearintheStatementshasbeenextractedfromourVolume2Report,forexampleFTEstaffingnumbers.

15
2009-10 2009-10 2008-09 2007-08Budget Actual Actual Actual
$m $m $m $mRevenueGrants 2 441 2 730 2 677 2 466Taxation 810 872 804 830
592 303 982 573 secivres dna sdoog fo selaSFines and regulatory fees 64 97 92 83Interest income 34 45 68 74Dividend, tax and rate equivalent income 100 79 210 132Other revenue 74 109 105 106Total Revenue 3 898 4 221 4 259 3 986ExpenditureDepreciation 228 229 229 233Employee expenses 1 875 1 957 1 863 1 654Superannuation 213 233 257 215Supplies, consumables and Other operating expenses 982 1 004 1 000 980
Nominal superannuation interest expense 203 208 193 163Borrowing costs 18 18 16 20Grant expenses 814 935 807 668Total Expenditure 4 333 4 584 4 365 3 933NET OPERATING BALANCE BEFORE: ( 435) ( 363) ( 106) 53Commonwealth Nation Building Revenue 318 381 28 0
35 )87 (81 )711 (ECNALAB GNITAREPO TENPlus Other economic flows - Included inOperating Result
()6 (stessa laicnanif-non fo elas no )ssol( niaG 24) 3 ( 19)Revaluation of equity investment in GBEs/SOCs 110 1 893 387 150Special dividend and other flows fromGBEs/SOCs 0 0 0 293
1 ()296 (0 ytilibail noitaunnarepuS ni stnemevoM 48) 107Other gains (losses) 2 ( 41) ( 28) 13
445 412 631 1 601 ten - swolf cimonoce rehtO795 631 351 1 )11 (TLUSER GNITAREPO
Plus Other economic flows - other movements in equity
772 783 322 stessa laicnanif-non fo snoitaulaveR 1 02022 ()41 ()1 (ytiuqe ni stnemevom renwo-non rehtO ) 38
850 1 552 373 122 stnemevom ytiuqe rehtO latoT556 1 193 725 1 112 TLUSER EVISNEHERPMOC
KEY FISCAL AGGREGATESNet Operating Balance ( 117) 18 ( 78) 53less Net acquisition of non-financial assets
682 706 857 stessa laicnanif-non fo esahcruP 2526 14 96 87 stessa laicnanif-non fo elaS sseL 8
Less Depreciation 228 229 228 233Net acquisition of non-financial assets 452 309 17 ( 49)
201 )59 ()192 ()965 (ECNALAB LACSIF
PDF Created with deskPDF PDF Writer - Trial :: http://www.docudesk.com
GGSStatementsandPAStatements
COMPREHENSIVE INCOME STATEMENT

16 GGSStatementsandPAStatements
COMMENT
Net Operating Balance
TheunderlyingGGSNetOperatingBalancebeforeAustralianGovernmentFunding for SpecificMajor Capital Programs, including Nation Building – Economic Stimulus Plan, was a deficit of$363m,comparedtoadeficitof$106mfortheprioryear.
ThedeclineintheNetOperatingBalancewasdueto:
• higherEmployeeexpenses,up$94m,duepartlytothePublicServiceWageAgreementandadditional costs for theDepartment ofHealth andHumanServices (DHHS), $61m, theDepartmentofEducation(DoE)andthePostYearTenStatutoryAuthorities,$30m,andtheDepartmentofJustice(Justice),$2m,
• lowerInterestincome,$23m,duetoareductionintheCashheldinthePublicAccount
• lower Dividend, tax and rate equivalent revenue, down $131m, due to lower income taxequivalentsreceivedfromGBEsandSOCs,$116m,andlowerdividendrevenues,$15m,
• increasedGrantandsubsidyexpensesof$128m,drivenbyadditionalgrantfundingprovidedtonon-governmentschools,$78mandincreasedgrantsprovidedbytheDHHS,$22m.
Theeffectsoftheforegoingwereoffsetinpartby:
• highergrantsfromtheAustralianGovernment,up$53m,
• highertaxationrevenues,up$68m,mainlyduetoPayrolltax,$12m,Landtax,$11m,Taxesonfinancialandcapitaltransactions,$12m,Guaranteefees,$9mandOthermotorvehiclesfeesandtaxes,$9m,
• lowerSuperannuationexpense,$24m,due to lowercurrent servicecost,$32m.The lowersuperannuation expense was partly offset by an increase in the Nominal superannuationinterestexpenseof$15m.
Theoverall2009-10NetOperatingBalance,$18msurplus,included$381mofAustralianGovernmentfundingundertheNationBuilding–EconomicStimulusPlan.Theoverall2008-09NetOperatingBalance,$78mdeficit,included$28mofeconomicstimulusfunding.
ThebudgetedNetOperatingBalancewasadeficitof$117m.Theactualresultwasasurplusof$18m,anoverallimprovementagainstbudgetof$135m.Thiswasaresultofactualrevenuebeinghigher$323m,8.3%,whileexpensesexceededoriginalbudgetby$251m,5.8%.
Materialvariancesincluded:
• highertotalGrantsrevenue,$351m,duetothereceiptfromtheAustralianGovernmentofhigherthananticipatedGoodsandServicesTaxof$112m, increasedNationalPartnershippayments, $126m, primarily for the Economic Stimulus Plan- Building the EducationRevolution,$72m,increasedGrantstotheStateforLocalGovernment,$17m,andincreasedSpecific Purpose Payments of $17m mainly for Grants to the State for Non-GovernmentSchools. The increase also reflected the reclassification by the DHHS of $55m in MerseyCommunityHospitalAustralianGovernment revenue fromSalesofgoodsand services toGrants
• higherTaxationrevenue,$62m,duetohigherthananticipatedreceiptsincludingincreasedPayroll taxcollections,$14m, increasedDuties,$29m,due toadditional conveyancedutyresultingfromseverallargetransactionsandimprovingpropertyvalues,andincreasedMotorVehicletaxesandFees,$8m,

17GGSStatementsandPAStatements
• lowerSaleofgoodsandservices,$86m,duetoreclassificationofrevenuethatwasincludedinSalesofgoodsandservicesintheoriginalBudgetestimate.TheDHHSreclassified$55mofMerseyCommunityHospitalAustralianGovernmentrevenuetoGrants.DepartmentofTreasuryandFinancereclassified$10mtoFinesandregulatoryfeesandJusticereclassified$9mtoFinesandregulatoryfees
• lowerincomefromDividend,taxandrateequivalentrevenue,down$21m,duelowerincometaxequivalentincome,$28m,partiallyoffsetbyadditionaldividendincome,$8m
• higher Grant expenses, $121m, primarily due to additional grants received mentionedpreviously
• higherEmployeeexpense,$82m,primarilyreflectingincreasesintheDHHS,$30m,Justice,$8m,andthePostYear10StatutoryAuthorities,$14m.
Figure1presents,attheNetOperatingBalancelevel,revenue,expenditureandemployeecosttrendsfortheGGSoverthepastfouryears.Anadditionalrevenuelineexcludingone-offcapitalfundinghasbeenincluded
Figure 1: GGS Revenue and expenditure
Note: Employee expenses in 2007-08 were adjusted to include the secondment of 382 employees from the Mersey Community Hospital to the Australian Government. In 2008-09, 264 FTEs were returned back to the State. Revenue and expenditure for 2007-08 were also adjusted for the Mersey Community Hospital.
Figure1 indicates that the rateof expendituregrowth from2006-07 to2009-10 (annual averageof7.36%)exceededtherateofrevenuegrowth(annualaverageof6.55%,butonly4.3%ifone-offAustralianGovernmentFundingforspecificmajorcapitalprogramsisexcluded).In2009-10revenuegrowthfrom2008-09was7.35%(2007-08,6.56%)andexpendituregrowthwas5.02%(9.98%).However,revenuegrowthexcludingoneoffAustralianGovernmentFundingforspecificmajorcapitalprogramswasnegative.Onabeforecapitalreceiptsbasis,expendituregrowthoutstrippedrevenuegrowthinboth2008-09and2009-10.
0
500
1,000
1,500
2,000
2,500
3,000
3,500
4,000
4,500
5,000
2006-07 2007-08 2008-09 2009-10
GGS Revenue GGS Expenditure
Employee Expenses GGS Revenue excl. one-off capital funding

18 GGSStatementsandPAStatements
Table1presentssourcesofStaterevenues,expressedaspercentages,overthepastfouryears.ThetableexcludesCommonwealthrevenuesreceivedforcapitalstimuluspurposes.
Table 1: Revenues expressed as a percentage
* Total revenue from Australian Government excludes National Partnership Payments, 2009 10, $769m and 2008-09, $130m.
Inpercentageterms,Tasmania’sshareoftheGoodsandServicesTax(GST)poolrepresented42.8%oftheState’srevenueswiththisrevenuesourceslightlyincreasinginpercentageterms.Figure2graphsrevenuesreceivedfromtheCommonwealthovertimewithothergrantsincludingstimulusreceiptsinboth2008-09and2009-10.
2009-10 2008-09 2007-08 2006-07$m $m $m $m
Capital ExpenditureGeneral government sector 607 286 252 233PNFCs and PFCs 717 730 340 352
585295610 1 4231latoT
Opening Balance Deposits Withdrawals
Closing Balance
$m $m $m $m
Economic and Social Infrastructure Fund 22.955 20.366 14.666 28.65562.58861.32546.31
510.81
297.49dnuF ainamsaT erutcurtsarfnI 9Housing Fund 56.439 0.000 8.996 47.443
278.96926.9000.0105.97dnuF laitpaC slatipsoHRoyal Hobart Hospital Redevelopment Fund 2.249 0.000 1.485 0.764Better Roads Fund 2.030 0.000 1.883 0.147Urban Renewal and Heritage Fund 21.499 0.000 10.337 11.162
150.84040.23670.26dnuF erutcurtsarfnI retaW
TOTAL 341.541 52.026 291.363102.204
2009-10 2008-09 2007-08 2006-07% % % %
Australian Government - General purpose payments (GST) 42.8 39.1 41.8 42.4Australian Government - Specific purpose payments 15.1 12.6 12.3 12.0
3.16.11.20.0stnarg latipaC - tnemnrevoG nailartsuATotal revenue from the Australian Government* 57.9 53.8 55.6 55.7Other grants and subsidies 3.2 8.1 6.2 5.9Payroll tax 7.1 6.2 6.3 5.9Taxes on property 8.5 7.0 8.2 7.6Gambling taxes 2.6 2.3 2.3 2.4
3.31.39.24.3sexat dna seef elcihev rotoMTaxes on insurance 1.2 1.0 1.0 1.0Sales of goods and services 7.5 7.3 7.4 8.6
7.43.31.51.2sexat emocni dna sdnediviDInterest income 1.2 1.6 1.9 1.2Other revenue 5.4 4.7 4.8 3.7Total 100.0 100.0 100.0 100.0
PDF Created with deskPDF PDF Writer - Trial :: http://www.docudesk.com
19GGSStatementsandPAStatements
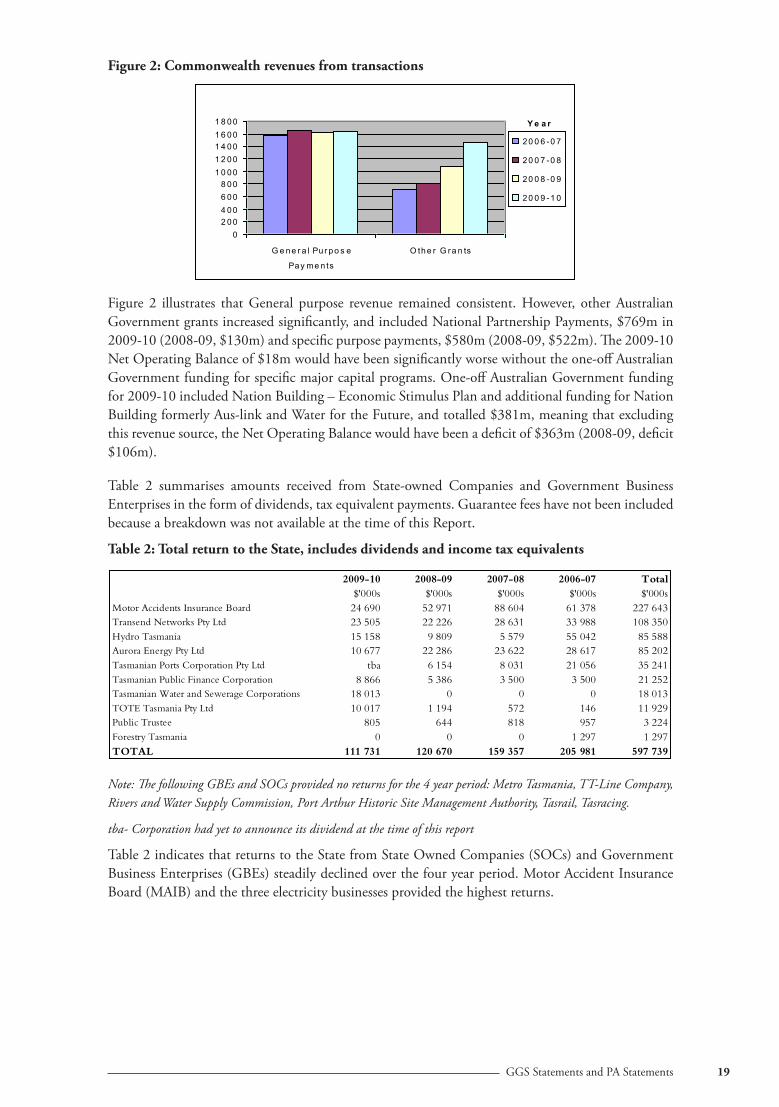
Figure 2: Commonwealth revenues from transactions
Figure 2 illustrates that General purpose revenue remained consistent. However, other AustralianGovernmentgrantsincreasedsignificantly,andincludedNationalPartnershipPayments,$769min2009-10(2008-09,$130m)andspecificpurposepayments,$580m(2008-09,$522m).The2009-10NetOperatingBalanceof$18mwouldhavebeensignificantlyworsewithouttheone-offAustralianGovernmentfundingforspecificmajorcapitalprograms.One-offAustralianGovernmentfundingfor2009-10includedNationBuilding–EconomicStimulusPlanandadditionalfundingforNationBuildingformerlyAus-linkandWaterfortheFuture,andtotalled$381m,meaningthatexcludingthisrevenuesource,theNetOperatingBalancewouldhavebeenadeficitof$363m(2008-09,deficit$106m).
Table 2 summarises amounts received from State-owned Companies and Government BusinessEnterprisesintheformofdividends,taxequivalentpayments.GuaranteefeeshavenotbeenincludedbecauseabreakdownwasnotavailableatthetimeofthisReport.
Table 2: Total return to the State, includes dividends and income tax equivalents
Note: The following GBEs and SOCs provided no returns for the 4 year period: Metro Tasmania, TT-Line Company, Rivers and Water Supply Commission, Port Arthur Historic Site Management Authority, Tasrail, Tasracing.
tba- Corporation had yet to announce its dividend at the time of this report
Table2indicatesthatreturnstotheStatefromStateOwnedCompanies(SOCs)andGovernmentBusinessEnterprises(GBEs)steadilydeclinedoverthefouryearperiod.MotorAccidentInsuranceBoard(MAIB)andthethreeelectricitybusinessesprovidedthehighestreturns.
02 004 006 008 00
1 0 001 2 001 4 001 6 001 8 00
G e ne r a l Pu r po s e
Pay me n ts
O the r G ra n ts
Y e a r
Grants $'millions
20 0 6 -0 7
20 0 7 -0 8
20 0 8 -0 9
20 0 9 -1 0
2009-10 2008-09 2007-08 2006-07 Total
$'000s $'000s $'000s $'000s $'000s
Motor Accidents Insurance Board 24 690 52 971 88 604 61 378 227 643
Transend Networks Pty Ltd 23 505 22 226 28 631 33 988 108 350
Hydro Tasmania 15 158 9 809 5 579 55 042 85 588
Aurora Energy Pty Ltd 10 677 22 286 23 622 28 617 85 202
Tasmanian Ports Corporation Pty Ltd tba 6 154 8 031 21 056 35 241
Tasmanian Public Finance Corporation 8 866 5 386 3 500 3 500 21 252
Tasmanian Water and Sewerage Corporations 18 013 0 0 0 18 013
TOTE Tasmania Pty Ltd 10 017 1 194 572 146 11 929
Public Trustee 805 644 818 957 3 224
Forestry Tasmania 0 0 0 1 297 1 297
TOTAL 111 731 120 670 159 357 205 981 597 739
Government Departments
FTEs at
30 June
2010
FTEs at
30 June
2009
FTEs at
30 June
2008
FTEs at
30 June
2007
Economic Development, Tourism and the Arts*** 479 400 404 240
Education* 7155 7 215 8 102 8 068
Environment, Parks, Heritage and Arts *** 0 714 613 757
Health and Human Services** 9510 9 010 8 618 8 992
Infrastructure, Energy and Resources 503 558 537 503
Justice 957 961 999 972
Police and Emergency Management 1631 1 658 1 672 1 658
Premier and Cabinet 448 485 480 467
Primary Industries Parks Water and Environment*** 1369 988 984 966
Treasury and Finance (excluding GPOC) 322 325 316 324
Sub total**** 22 373 22 314 22 725 22 947
TAFE Tasmania * * 1 077 1 061
Tasmanian Academy 191 149 * *
Tasmanian Polytechnic 1070 1039 * *
Tasmanian Skills Institute 356 358 * *
Total 23 990 23 860 23 802 24 008
Department
Treasury and Finance 3 14%
Police and Emergency Services 11 9%
Infrastructure, Energy and Resources 7 18%
Justice 8 10%
Economic Development, Tourism and the Arts 8 23%
Health and Human Services 157 19%
Education (Including Academy, Skills and Polytechnic) 86 14%
Premier and Cabinet 3 13%
Primary, Industries, Parks, Water and Environment 3 3%
Employee
Entitlements ($m)
PDF Created with deskPDF PDF Writer - Trial :: http://www.docudesk.com

20 GGSStatementsandPAStatements
Turning now to movements in expenditure. Employee expenses (including superannuationexpenditure but not nominal superannuation expense) in 2009-10 represented 47.8% (2008 09,48.6%)oftotalexpenditure.Employeeexpensesincreasedby3.3%,$70m,in2009-10to$2.190bn.TheincreasewasmainlyaresultofthenewPublicServiceWageAgreementandhigherstaffnumbers,primarilyinDHHS.
TheGGSisprimarilycomprisedofGovernmentDepartmentsandtheirstaffinglevelsaredetailedinTable3.
Table 3: Departmental FTEs
* Education and TAFE were restructured during 2008-09 under the Tasmania Tomorrow initiative. ** In November 2007, 382 FTEs from the Mersey Community Hospital were seconded to the Australian Government. In September 2008, 264 FTEs were returned back to DHHS.*** DEPHA responsibilities were transferred to DPIPWE and DEDTA on 1 July 2009. **** Also excludes Tasmanian Audit Office, State Fire Commission, Inland Fisheries, MAST and Executive Legislature Agencies.
Table 3 shows that the number of Full Time Equivalents (FTEs) remained fairly consistent incomparisontoprioryear.DHHSFTE’sincreased500or5.5%during2009-10.At30June2009the Department of Environment, Parks, Heritage and the Arts closed. The operational Divisionsof the Department were transferred to the Departments of Primary Industries, Parks,Water andEnvironmentandEconomicDevelopment,TourismandtheArts,effective1July2009.
2009-10 2008-09 2007-08 2006-07 Total
$'000s $'000s $'000s $'000s $'000s
Motor Accidents Insurance Board 24 690 52 971 88 604 61 378 227 643
Transend Networks Pty Ltd 23 505 22 226 28 631 33 988 108 350
Hydro Tasmania 15 158 9 809 5 579 55 042 85 588
Aurora Energy Pty Ltd 10 677 22 286 23 622 28 617 85 202
Tasmanian Ports Corporation Pty Ltd tba 6 154 8 031 21 056 35 241
Tasmanian Public Finance Corporation 8 866 5 386 3 500 3 500 21 252
Tasmanian Water and Sewerage Corporations 18 013 0 0 0 18 013
TOTE Tasmania Pty Ltd 10 017 1 194 572 146 11 929
Public Trustee 805 644 818 957 3 224
Forestry Tasmania 0 0 0 1 297 1 297
TOTAL 111 731 120 670 159 357 205 981 597 739
Government Departments
FTEs at
30 June
2010
FTEs at
30 June
2009
FTEs at
30 June
2008
FTEs at
30 June
2007
Economic Development, Tourism and the Arts*** 479 400 404 240
Education* 7155 7 215 8 102 8 068
Environment, Parks, Heritage and Arts *** 0 714 613 757
Health and Human Services** 9510 9 010 8 618 8 992
Infrastructure, Energy and Resources 503 558 537 503
Justice 957 961 999 972
Police and Emergency Management 1631 1 658 1 672 1 658
Premier and Cabinet 448 485 480 467
Primary Industries Parks Water and Environment*** 1369 988 984 966
Treasury and Finance (excluding GPOC) 322 325 316 324
Sub total**** 22 373 22 314 22 725 22 947
TAFE Tasmania * * 1 077 1 061
Tasmanian Academy 191 149 * *
Tasmanian Polytechnic 1070 1039 * *
Tasmanian Skills Institute 356 358 * *
Total 23 990 23 860 23 802 24 008
Department
Treasury and Finance 3 14%
Police and Emergency Services 11 9%
Infrastructure, Energy and Resources 7 18%
Justice 8 10%
Economic Development, Tourism and the Arts 8 23%
Health and Human Services 157 19%
Education (Including Academy, Skills and Polytechnic) 86 14%
Premier and Cabinet 3 13%
Primary, Industries, Parks, Water and Environment 3 3%
Employee
Entitlements ($m)
PDF Created with deskPDF PDF Writer - Trial :: http://www.docudesk.com

21GGSStatementsandPAStatements
Table4 summarisesmovements, expressed inmillionsofdollars and inpercentages, in employeeentitlementsbydepartmentfortheperiod2007-08to2009-10.
Table 4: Departmental changes in employee entitlements
Department Employee Entitlements ($m)
TreasureyandFinance 3 14%PoliceandEmergencyServices 11 9%Infrastructure,EnergyandResources 7 18%Justice 8 10%EconomicDevelopment,TourismandtheArts 8 23%HealthandHumanServices 157 19%Education(IncludingAcadmey,SkillsandPolytechnic 86 14%PremierandCabinet 3 13%Primary,Industries,Parks,WaterandEnvironment 3 3%
Table 4 illustrates that in percentage terms each department reported increases in employeeentitlements.IndollartermsDHHSandDoEhadthehighestimpact.
Operating Result
TheOperatingresultshowedasurplusin2009-10of$1.153bn(2008-09,$136m)andwasarrivedatafteradjustingtheNetOperatingBalanceforOtherEconomicFlows.OtherEconomicFlowsarechangesinthevalueofanassetorliabilitythatdoesnotresultfromatransaction.Theincreaseof$1.017bnwasmainlydueto:
• increasedNetOperatingBalance,$96m,explainedpreviously
• inclusionofwaterandseweragecorporations$1.749bn
• inclusionofTasrail,$72m,
• increasedMovementsinsuperannuationliability,up$544m,asaresultofrevisedactuarialprojections.Ingeneraltermstheincreasewascausedbyalowerdiscountrate,$468m,lowerassumedpensionermortalityrates,$22m,higherthananticipatedsalaryincreases,$139m,higher than projected scheme asset balance, $46m, and other miscellaneous experienceadjustments,$81m,
• decreasedOthergains/losses,$13m,primarilyduetoTTLineprioryeartaxloss,$36m,awritedownofroadreplacements,$14m,demolitionofpartiallydestroyedrentalproperties,$8m,netincreaseintheTasmanianRiskManagementFundLiability,$5m,andimpairmentloss, $5m, in the Department of Economic Development, Tourism and the Arts’ equityinvestmentinScreenTasmania
• LossonsaleofNon-financialassets,$28m,whichincludedassetswrittenoffbyDPIPWE,$28m.

22 GGSStatementsandPAStatements
Comprehensive Result
TheComprehensive result reports a surplus in2009-10of$1.527bn (2008-09,$391m)andwasarrivedatafteradjustingtheOperatingResult forOtherEconomicFlows–Othermovements inequity.ThemajoriteminthiscategoryofeconomicflowswasRevaluationsofnon-financialassets,$387m.
Key Fiscal Aggregates - disclosure of the State’s fiscal balance
AASB 1049 does not require disclosure of this information on the face of the Statement ofComprehensive Income.However, thiswas thepracticeunderGFSandwe support its inclusion.EssentiallythisinformationshowstheimpactontheNetOperatingBalanceofnetexpenditureonnon-financialassetsratherthanthedepreciationcharge.
Inthe2009-10financialyear,grossinvestmentonnon-financialassetswas$321mhigherthanthepreviousyear.Expenditureonnon-financialassets iscommentedonintheStatementofFinancialPerformancesectionofthisChapter.
Comparison of operating revenues and expenditures with Gross State Product
Figure3comparesthegrowthinrevenues,expendituresandemployeeexpenseswiththegrowthintheStateeconomyasmeasuredbyGrossStateProduct(GSP)overthepastfouryears.WhiletherewasachangetoaccountingunderAASB1049in200708,becausethechangesbetweenAASB1049andGFSwerenotmaterialat theNetOperatingBalance level, thiscomparison ismadeover theperiod2006-07to2009-10.
Figure 3: GGS Revenue and Expenditure growth compared to GSP growth (%)
Note: Growth figures for 2007-08 were adjusted to include revenue and expenditure for the Mersey Community Hospital The rate of growth in employee expenses in 2007-08 was adjusted to include the secondment of 382 employees from the Mersey Community Hospital to the Australian Government. In 2008-09, 264 of these employees returned to the State.
0
2
4
6
8
10
12
14
2006-07 2007-08 2008-09 2009-10
GSP Growth Revenue Growth Expenditure Growth Employee Expenses Growth

23GGSStatementsandPAStatements
GSPdataforfinancialyearsupto2008-09issourcedfromtheABS,whiletheestimatedGSPfor2009-10issourcedfromtheDepartmentofTreasuryandFinance.GSPisdefinedsimilarlytoGrossDomesticProduct(GDP)butreferstoproductionataStatelevel.Therefore,GSPisthetotalmarketvalueofgoodsandservicesproducedinTasmaniawithinagivenperiod,afterdeductingthecostofgoodsandservicesusedup in theprocessofproduction,butbeforedeductingallowances for theconsumptionoffixedcapital.
Figure3showsthatbothGGSrevenueandGGSexpendituregrewatafasterratethantheTasmanianeconomy ineachof theyearsunder review(2009-10: revenue,7.35%;expenditure,5.02%;GSP,0.25%).However,theStatecannotsustainexpenditureincreasesatthislevel.
General Government Expenses by Purpose
TheTAFR includes details of general government recurrent expenses by purpose rather than byfunction. Figure4depictsgraphicallyrecurrentexpenditureincurredoverthepastsevenyearsbypurpose.
Figure 4: Government expenses by purpose
Note: Other includes Economic affairs, recreation, culture, fuel, energy, agricultural, forestry, fish, hunting, mining, mineral resources, manufacturing, construction and Nominal Interest on unfunded superannuation
Figure4highlightsthecontinuedinvestmentinhealthandeducationand,toalesserextent,insocialsecurity, housing and community services with transport and general public services declining inrelativeterms.
0
200
400
600
800
1000
1200
1400
2002-03 2003-04 2004-05 2005-06 2006-07 2007-08 2008-09 2009-10
$m
Transport andGeneral PublicServices
Social Security,Housing andCommunityAmenitiesEducation
Health
Other
24 GGSStatementsandPAStatements
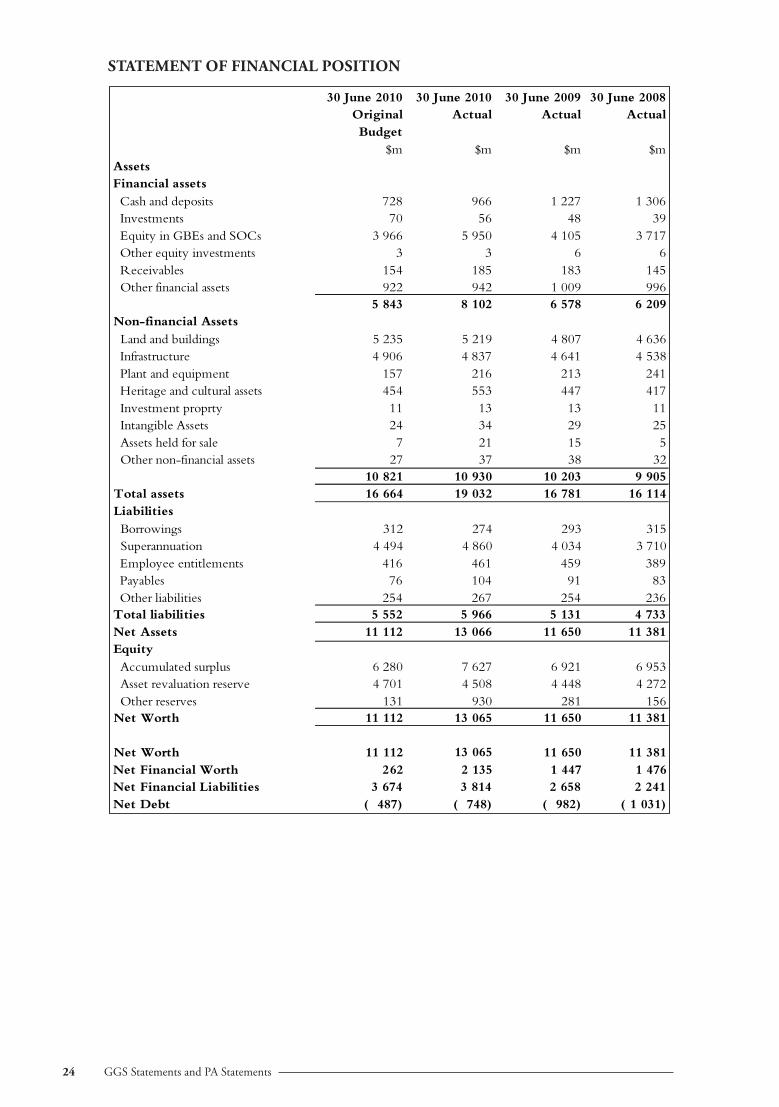
STATEMENT OF FINANCIAL POSITION
30 June 2010 30 June 2010 30 June 2009 30 June 2008Original Actual Actual ActualBudget
$m $m $m $mAssetsFinancial assets
603 1 722 1 669 827 stisoped dna hsaC 93 84 65 07 stnemtsevnI
Equity in GBEs and SOCs 3 966 5 950 4 105 3 717 Other equity investments 3 3 6 6
541 381 581 451 selbavieceR 699 900 1 249 229 stessa laicnanif rehtO
5 843 8 102 6 578 6 209Non-financial Assets
636 4 708 4 912 5 532 5 sgnidliub dna dnaL 835 4 146 4 738 4 609 4 erutcurtsarfnI 142 312 612 751 tnempiuqe dna tnalP
Heritage and cultural assets 454 553 447 41711 31 31 11 ytrporp tnemtsevnI 52 92 43 42 stessA elbignatnI 5 51 12 7 elas rof dleh stessA
Other non-financial assets 27 37 38 32 10 821 10 930 10 203 9 905
411 61 187 61 230 91 466 61 stessa latoTLiabilities
513 392 472 213 sgniworroB 017 3 430 4 068 4 494 4 noitaunnarepuS
Employee entitlements 416 461 459 389 Payables 76 104 91 83
632 452 762 452 seitilibail rehtO 337 4 131 5 669 5 255 5 seitilibail latoT183 11 056 11 660 31 211 11 stessA teN
Equity359 6 129 6 726 7 082 6 sulprus detalumuccA
Asset revaluation reserve 4 701 4 508 4 448 4 272651 182 039 131 sevreser rehtO 183 11 056 11 560 31 211 11 htroW teN
183 11 056 11 660 31 211 11 htroW teN674 1 744 1 531 2 262 htroW laicnaniF teN
Net Financial Liabilities 3 674 3 814 2 658 2 241)130 1 ()289 ()847 ()784 (tbeD teN
PDF Created with deskPDF PDF Writer - Trial :: http://www.docudesk.com

25GGSStatementsandPAStatements
COMMENT
TheGGSshowedanegativeNetDebtpositioninrecentyearsbecausedebt-relatedfinancialassetsexceededgrossdebtliabilities,by$748masat30June2010.However,thelevelofNetdebtdeclinedin2009-10duetothelowerCashanddeposits,$261m,whichexceededthedecreaseinBorrowings,$19m.
NetWorth grew by $1.415bn in 2009-10 to $13.065bn in line with the Comprehensive result,$1.527bn,offsetbyequityinjections,$111m.Theincreasewasattributedto:
• higherEquityinvestments,$1.845bn.EquityinvestmentsvaryeachyeardependingonthenetassetsofGBEsandSOCs.Asmentionedpreviously,themajorityoftheincreasereflectedthe newly created local government water and sewerage corporations, $1.749bn, and NetassetsofTasrail,$72m.
• higherNon-financialAssets,up$727m,whichwasacombinationofadditions,$701m,andrevaluationincrements,$370m,partlyoffsetbydepreciation,$225m,andothermovements.Land andBuildings increasedby$412mdue to capital expenditureby theDoE,$191m,revaluationoflandandbuildingsalsobytheDoE,$72m,andtherecognitionofrailcorridorlandbytheDepartmentofInfrastructure,EnergyandResources(DIER),$51m.Infrastructureassets increasedby$196m,due to the revaluationof roads andbridgesby theDIERandadditionalcapitalexpenditureonroadinfrastructureprojects,includingtheBrightonBypassandtheBrightonTransportHub.
Thesewereoffsetpartlyby:
• lowerCashanddeposits,down$261m,explainedintheStatementofCashFlowssectionofthisChapter
• increasedSuperannuationliability,up$826m,explainedearlier.
TheSuperannuation liability iscalculatedbysubtractingthebalanceofplanassets fromthegrossSuperannuationliability.FortheGeneralGovernmentSector,Superannuationliabilityincreasedby$826m,or20%,to$4.860bnfrom30June2009to30June2010.Thismovementcomprised:
• a$904m,or17%,increaseinthepresentvalueofthesuperannuationliabilityto$6.231bn,partlyoffsetby
• anincreaseof$82m,or6%,inthefairvalueofplanassetsto$1.371bn.
ItisexpectedtheSuperannuationliabilitywillcontinuetoincreaseinthemediumterm.

26 GGSStatementsandPAStatements
Figure5showsthegrowthintheSuperannuationLiability,brokendownintothepresentvalueoftheliabilityandfairvalueofplanassets,bydollarsandpercentage.
Figure 5: Superannuation Liability and Plan Assets and Fluctuations
The graphs illustrate thesignificantmovementin2009-10 and the general upwardstrendinthenetpresentvalueoftheliabilityandfluctuations,inthe liabilityandinplanassestscaused by the global financialcrisis.
Figure 6 shows the growth in the Superannuation Liability compared to the growth in theSuperannuationProvisionAccount,bydollarsandpercentage.
Figure 6: Growth in Net Unfunded Superannuation Liability & Superannuation Provision Account
The graphs illustrate that in 2006-07, 2008-09 and 2009-10 the netunfunded Superannuation liabilityincreased at a higher rate thanthe growth in the SuperannuationProvisionAccount.
The overall outcome over the fouryear period is therefore a muchlarger difference between theSuperannuation liability and theSuperannuationProvisionAccount.
$0$1,000$2,000$3,000$4,000$5,000$6,000
UnfundedSuperannuation Liability
SuperannuationProvision Account
Year
2006-07
2007-08
2008-09
2009-10
0%
5%
10%
15%
20%
25%
Net UnfundedSuperannuation Liability
Superannuation ProvisionAccount
Year
2006-07
2007-08
2008-09
2009-10
(15%)(10%)
(5%)0%5%
10%15%20%25%30%
Present Value of Liability Fair Value of Plan Assets
Year
2006-07
2007-08
2008-09
2009-10
$0$1,000$2,000$3,000$4,000$5,000$6,000$7,000
Present Value of Liability Fair Value of PlanAssets
Year
2006-07
2007-08
2008-09
2009-10

27GGSStatementsandPAStatements
Asmentionedearlier,theState’sinvestmentsinGBEsandSOCsincreasedby$1.845bnto$5.950bn.
Table5detailstheNetAssetsoftheseentities30June2010.
Table 5: Net assets of GBEs and SOCs at 30 June 2010
* Commenced operations during 2008-09** Sold during 2007-08*** Hobart International Airport Pty Ltd sold in 2007-08**** Commenced operations during 2009-10
Table 5 confirms that a significant reason for the higher Equity investment in these entities wasinclusionforthefirsttimeofthewaterandseweragecorporationsandTasrail.
TheGGS’infrastructureassetsareprimarilyroads,bridgesandrailassets.In2009-10,thevalueoftheseassetsincreasedby$196m,4%,from$4.641bnasat30June2009to$4.837bnasat30June2010.
GBE/SOC 2009-10 2008-09 2007-08 2006-07
$m $m $m $m
Aurora Energy Pty Ltd 496 518 410 403
Forestry Tasmania 327 629 548 597
Hydro Tasmania 1882 1665 1397 959
Metro Tasmania Pty Ltd 33 32 30 30
Motor Accidents Insurance Board 271 220 274 339
Port Arthur Historic Site Managment Authority 14 15 13 11
Printing Authority** - - - 3
Rivers and Waters Supply Commission 63 42 - 10
Southern Regional Cemetery Trust** - - - 7
Tasmanian Ports Corporation Pty Ltd*** 123 126 125 157
Tasmanian Public Finance Corporation 38 31 17 22
Tasracing Pty Ltd* 53 - - -
Public Trustee 4 5 5 4
TOTE Tasmania Pty Ltd 9 5 46 42
Transend Networks Pty Ltd 564 525 591 757
TT-Line Company Pty Ltd 249 237 259 235
Tasmanian Railway Pty Ltd**** 72 - - -
Water and Sewerage Corporation (Northern-Region) Pty Ltd**** 489 - - -
Water and Sewerage Corporation (North-Western-Region) Pty Ltd**** 327 - - -
Tasmanian Water and Sewerage Corporation (Southern-Region) Pty Ltd**** 935 - - -
Total Net Assets 5 949 4 050 3 715 3 576
Amount recorded as equity 5 950 4 105 3 717 3 577
PDF Created with deskPDF PDF Writer - Trial :: http://www.docudesk.com

28 GGSStatementsandPAStatements
General Government Assets by purposes
TheTAFRincludesdetailsofgeneralgovernmentassetspurposeratherthanbyfunction.
Figure7depictsassetsbyfunctionfor30June2010,excludingtheequityinvestmentinPNFCandPFCsectors.
Figure 7: GGS Assets by Function (Excluding Equity Investments in PNFC and PFC)
Figure7highlightsthatthemajorityoftheState’sassetsareintransportandcommunications
OneindicatoroftheState’sfinancialpositioninrelationtomaintainingits infrastructureassets isthedifferencebetweentherateatwhichexistinginfrastructurewasbeingusedupandtherateitwasbeingreplaced.Thiscanbemeasuredbycomparingtheamountspentinvestingintheseassetswiththeannualdepreciationchargeontheseassets.Thisisalsoreferredtoastherenewalratiowithatargetofnotlessthan1:1,or100%,indicatingexpenditureoninfrastructureissufficienttomaintaintheassetbase.
2009-10
12%
5%
15%
5%
37%
10%
16% Education
Health
Social Security, Housing andCommunity Amenities
Public Order & Safety
Transport & Communication
Recreation and Culture
Other

29GGSStatementsandPAStatements
Figure8showstheresultscalculatedforinfrastructurereplacementforthefinancialyears2006-07to2009-10.
Figure 8: GGS Investment Ratio
Basedonreportedamounts,theinvestmentratiofortheState increasedfrom0.92in2006-07to2.40in2009-10indicatingspendingoninfrastructureincreasedovertheperiodtothepointthatby30June2010itexceededdepreciationby2.4timessuggestinginvestmentininfrastructureisstrong.Theincreasesin2008-09and200910reflectedtheone-offCommonwealthcapitalfundingundertheeconomicstimulusplan.
Cautionisrequiredwheninterpretingtheseresultsasannualexpenditureoninfrastructureincludesbothrenewalofexistingassetsandacquisitionofnewassets.Atthispointitisnotpossibletoconcludetowhatextentassetrenewalsalonearekeepinginpacewithconsumption(depreciationexpense)ofthoseassets.
0
0.5
1
1.5
2
2.5
3
2006-07 2007-08 2008-09 2009-10
30 GGSStatementsandPAStatements
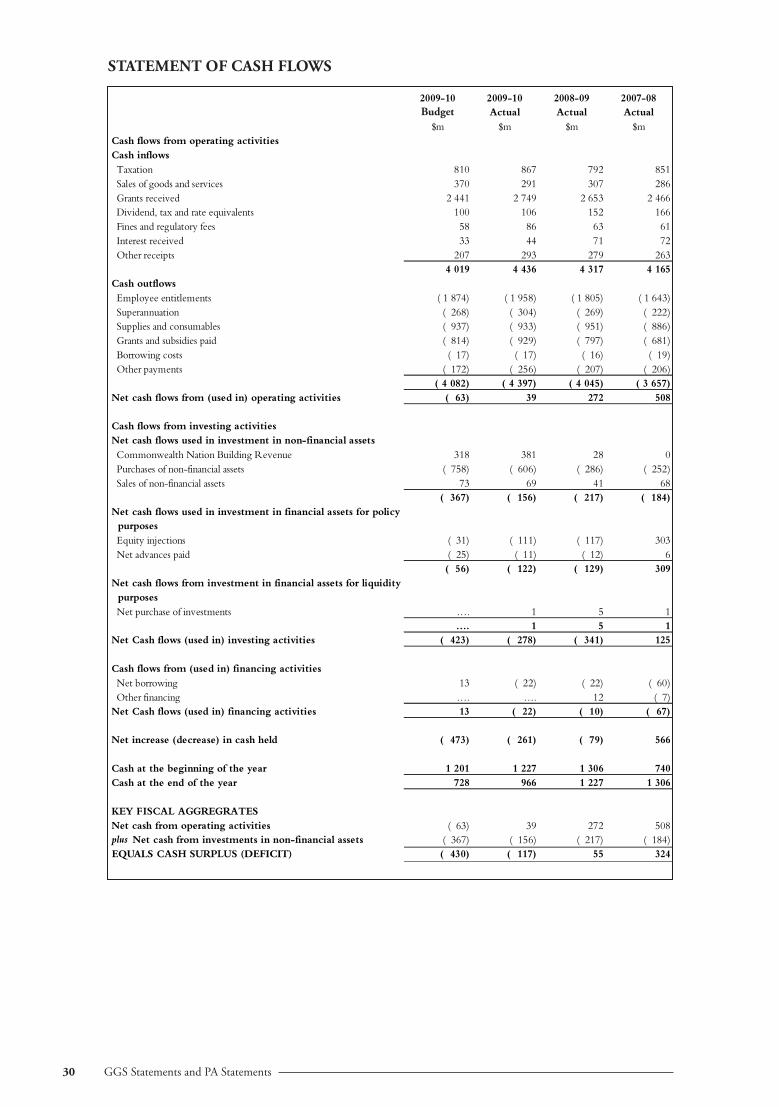
STATEMENT OF CASH FLOWS
2009-10 2009-10 2008-09 2007-08Original Actual Actual Actual
$m $m $m $mCash flows from operating activitiesCash inflows Taxation 810 867 792 851 Sales of goods and services 370 291 307 286 Grants received 2 441 2 749 2 653 2 466 Dividend, tax and rate equivalents 100 106 152 166 Fines and regulatory fees 58 86 63 61 Interest received 33 44 71 72 Other receipts 207 293 279 263
4 019 4 436 4 317 4 165Cash outflows Employee entitlements ( 1 874) ( 1 958) ( 1 805) ( 1 643) Superannuation ( 268) ( 304) ( 269) ( 222) Supplies and consumables ( 937) ( 933) ( 951) ( 886) Grants and subsidies paid ( 814) ( 929) ( 797) ( 681) Borrowing costs ( 17) ( 17) ( 16) ( 19) Other payments ( 172) ( 256) ( 207) ( 206)
( 4 082) ( 4 397) ( 4 045) ( 3 657)(seitivitca gnitarepo )ni desu( morf swolf hsac teN 63) 39 272 508
Cash flows from investing activitiesNet cash flows used in investment in non-financial assets Commonwealth Nation Building Revenue 318 381 28 0 Purchases of non-financial assets ( 758) ( 606) ( 286) ( 252) Sales of non-financial assets 73 69 41 68
( 367) ( 156) ( 217) ( 184)Net cash flows used in investment in financial assets for policy purposes Equity injections ( 31) ( 111) ( 117) 303 Net advances paid ( 25) ( 11) ( 12) 6
( 56) ( 122) ( 129) 309Net cash flows from investment in financial assets for liquidity purposes Net purchase of investments …. 1 5 1
…. 1 5 1324 (seitivitca gnitsevni )ni desu( swolf hsaC teN ) ( 278) ( 341) 125
Cash flows from (used in) financing activities Net borrowing 13 ( 22) ( 22) ( 60) Other financing …. …. 12 ( 7)
(31 seitivitca gnicnanif )ni desu( swolf hsaC teN 22) ( 10) ( 67)
Net increase (decrease) in cash held ( 473) ( 261) ( 79) 566
Cash at the beginning of the year 1 201 1 227 1 306 740Cash at the end of the year 728 966 1 227 1 306
KEY FISCAL AGGREGRATESNet cash from operating activities ( 63) 39 272 508plus Net cash from investments in non-financial assets ( 367) ( 156) ( 217) ( 184)
CASH SURPLUS ( 430) ( 117) 55 324EQUALS (DEFICIT)

31GGSStatementsandPAStatements
COMMENT
Intotal,GGSCashdecreasedby$261mto$966mat30June2010.Thedecreasearoseprimarilydueto:
• equity injections, $111m, including $82m contributed toTasrail for the purchase of theoperatingrailnetworkand$21mtoRiversandWaterSupplyCommission
• purchasesofnon-financialassets,$607m,mainlyrelatedtoincreasedcapitalinvestmentbytheDoE,$216m,DHHS,$111m,andDIER,$202m.Thiswasinpartfundedby$381mcapitalreceiptsfromtheAustralianGovernmentforspecificmajorcapitalprograms
• RepaymentofaCapitalIndexbondon30June2010,$30m,includedinnetborrowingsof$22mintheStatementofCashFlows.
ThedecreasedcashresultedinGGSNetdebtdeteriorating$234mtobenegative$748m.
Reasons for movements in the State’s cash flows are consistent with the commentary previouslyprovidedintheStatementofComprehensiveIncomeStatementandStatementofFinancialPositionsectionsofthisChapter.
TheNetOperatingBalance,$18m,excludingDepreciation,$229m,andNominalsuperannuationinterestexpense,$208m,andthefavourablemovementinthesuperannuationcurrentservicecost,$32m, came to $423m,which is close to theNet cash fromoperating activities, $420m.Grantsreceived under cash operating activities include Capital funding which is subsequently recordedunderinvestingactivitieswhenexpended.

32 GGSStatementsandPAStatements
PUBLIC ACCOUNT STATEMENTS
Whenreviewingthecommentarybelowitneedstobeborne inmindthatthePAStatementsarereportedonacashbasismeaningthatthereisnodistinctionbetweenreceiptsorpaymentsofacapitaloroperatingnatureandborrowingsreceivedorpaid.
PUBLIC ACCOUNT BALANCE
COMMENT
TheSpecialDepositsandTrustFund(SDTF)consistedofvariousaccountsestablishedbytheTreasurer.Themajorityofthesefundsrepresenteddepartmentaloperatingaccounts,wherefundsappropriatedfromtheConsolidatedFundbytheannualAppropriationActaredeposited.Inaddition,operatingaccountscanretainfundsthatareapprovedbytheTreasurerasretainedrevenue.
OtheraccountsintheSDTFincludetrustfunds,approvedoverdraft,whole-of-government,businessunitaccountsandaccountsestablishedunderlegislation,asdetailedintheTable6.
Surpluscash isusedtorepaydebtmaturingwithinafinancialyear, thusdelayinganyrefinancinguntil the latestpossibletimeandtominimiseborrowingcosts.This isshownaboveasTemporarydebtrepayments.
Table6belowdetailsthemainbalancesmakingupthe$2.376bnSDTFbalanceat30June2010.
Table 6: Composition of SDTF
2009-10 2008-09 2007-08 2006-07
Actual Actual Actual Actual
$m $m $m $m
Special deposits and trust fund
balance 30 June (before Temporary debt repayments) 2 376 2 346 2 393 1 889
Less Temporary debt repayments ( 1 438) ( 1 156) ( 1 129) ( 1 170)
Balance 30 June (after Temporary debt repayments) 938 1 189 1 264 719
Represented by:
Westpac Banking Corporation ( 22) ( 19) 14 ( 45)
Treasurer's account fixed deposits 0 0 1 165 710
Specific trust account fixed deposits 0 0 85 54
Tascorp Investments 960 1 209 0 0
Balance 30 June 938 1 189 1 264 719
2009-10 2008-09
$m $m
Superannuation Provision Account 1 364 1 324
Infrastructure Tasmania Fund 85 95
Risk Management Account 169 163
Housing Fund 47 56
DHHS 85 58
DIER* 40 50
DPIPWE** 124 145
Australian Government Funding Management Account 172 113
PDF Created with deskPDF PDF Writer - Trial :: http://www.docudesk.com

33GGSStatementsandPAStatements
*Includes: Mines Deposit Account, $8m (2008-09, $5m), East Tamar Highway Redevelopment Account, $30m ($46m), Abt Railway Account, $1m**Includes: Crown Lands Administration Fund, $11m, ($39m), Water Infrastructure Fund, $48m ($62m)
CONSOLIDATED FUND OUTCOME
COMMENT
ConsolidatedFundOutcomewasadeficitof$266min2009-10,comparedtoadeficitof$11min2008-09.Theincreaseddeficitwasaresultof:
• lower Capital receipts, down $89m. Capital receipts included National Highway System,$42m,andRail,$31m,in2008-09
• higher Recurrent services expenditure, $529m, due to increased funding across the GGS,mainlyDIER,$113m,DHHS,$203mandDoE,$305m.
• higherWorkandservices,$335m,duetoincreasedfunding,mainlyDIER,$104m,andDoE,$194m.
Thesewerepartlyoffsetby:
• higher Recurrent receipts, up $698m, due to additional funding from the AustralianGovernment.
TheConsolidatedFunddeficitwas$84mbetterthanbudgetmainlybecauseofincreasedRecurrentservicesreceiptsof$384m,9.7%.GSTrevenue,$112m,andSpecificpurposepaymentsforschools,$17m.Also,Worksandservicesexpenditurewas$30munderbudgetcausedbysavingsforDHHS,$67m,whichwasoffsetbyDIERoverspending,$24m.
ThiswaspartlyoffsetbyhigherRecurrentexpenditure,$330m,duetoincreasedexpenditureinthefollowingareas,DoE,$82m,DIER,$93mandDHHS,$68m.
2009-10 2009-10 2008-09 2007-08Original Actual Actual ActualBudget
$m $m $m $mReceipts
664 3 136 3 923 4 549 3 stpiecer tnerruceR814 98 0 1 stpiecer latipaC488 3 027 3 923 4 649 3 latoT
Expenditure
902 3 574 3 400 4 576 3 secivres tnerruceR476 652 195 126 secivres dna skroW388 3 137 3 595 4 692 4 latoT
Consolidated Fund Outcome ( 350) ( 266) ( 11) 1
PDF Created with deskPDF PDF Writer - Trial :: http://www.docudesk.com

34
page deliberately left blank

35TotalStateFinancialStatements
TOTAL STATE SECTOR FINANCIAL STATEMENTS
OVERVIEW
Total State Net Operating Balance for 2009-10 was a surplus of $192m compared with $20min2008-09.The2009-10NetOperatingBalanceof$192mwouldhavebeen significantlyworsewithout the one-offAustralianGovernment funding for specificmajor capital programs.One-offAustralianGovernmentfundingfor2009-10includedNationBuilding–EconomicStimulusPlanandadditionalfundingforNationBuildingformerlyAus-linkandWaterfortheFuture,andtotalled$381m.Thislargecontributionisofashort-termnatureandwasinresponsetotheglobaleconomicdownturn. From 2011-12, nearly all the Commonwealth-State Financial Arrangements fundingunderthePlanwillhaveceased.Excludingthisrevenuesource,theNetOperatingBalancewouldhavebeenadeficitof$189m.Similarly, in2008-09 the resultwouldhavebeenaNetOperatingBalancedeficitof$8m.
Atagrosslevel,the$172mimprovementprimarilyresultedfrom:
• increased Grants revenue, $425m or 16%. The increased Grants related to the GeneralGovernmentSector(GGS)andincludedadditionalAustralianGovernmentfundingreferredtoabove
• higherSalesofgoodsandservices,$476mor19%.Thiswasprimarilyduetorevenuefromthenewlocalgovernmentwaterandseweragecorporationsbroughttoaccountforthefirsttime,$190m,andadditionalrevenuegeneratedbyAuroraEnergy,$193m,andHydroTasmania,$105m.
Theincreasedrevenuewasoffsetby:
• higherSuppliesandconsumables,$384mor16%,whichwasduetocostsincurredbythelocalgovernmentwaterandseweragecorporations,$96m,andbyAuroraEnergy,$170m,andHydroTasmania,$82m,
• growth in Employee expenses, $186m or 9%. Approximately half, $94m, of the higheremployeeexpensesrelatedtoGGSentities
• higherdepreciation,$70mor15%,againduetothewaterandseweragecorporations,$51m,andAurora,$13m.
TheTotalStateOperating result for2009-10wasadeficitof$697m,comparedtoasurplusof$73min2008-09.The$770mdecreaseprimarilyrelatedto:
• Adeclineof$168mintheState’sunfundedsuperannuationliabilityin2008-09comparedtoadeclineof$755min2009-10.Thehigherliabilityin2009-10wascausedbyacombinationof:
lowerdiscountrate,from6%to5.35%
higherthananticipatedsalaryincreases
lowerassumedpensionermortalityrates.
• Otherlossesof$107m(2008-09Othergain,$217m)whichinthemaincomprised:
ForestryTasmanian’sloss,$359m,beingthecombinedimpactoftherevisedvaluationapproach and application of normal valuation techniques on the carrying amount ofForestry’snetbiologicalandforestestateassetscomparedto30June2009

36 TotalStateFinancialStatements
Tascorploss,$29m,arisingfromfairvaluemovementsinitsfinancialinstruments
TT-Lineshipvaluationdownwardadjustment,$25m,
DIERloss,$15m,relatedtowritedownofassets.
Offsetpartlyby:
Hydrogain,$257m,onelectricityderivatives,treasuryderivativesandBasslinkfinancialassetandliabilitiesrelatedtoenergymarketpricesandinterestrateschanges
DepartmentofEducation(DoE)gainoninsurancerecovery,$8m,andassetsbroughttoaccountforthefirsttime,$13m,
DepartmentofJustice(Justice)impairmentgainonaccountsreceivable,$8m,
MotorAccidentInsuranceBoard(MAIB)gain,$55m,whichrepresentedgainsontheinvestmentportfolio,includingrealisedgains,$17m,andunrealisedgains$38m.
TheComprehensive resultfor2009-10wasasurplusof$1.416bn,comparedtoasurplusof$268min2008-09.The2009-10ComprehensiveresultincludedRevaluation(gains)onnon-financialassetsof$116m,comparedto$235min2008-09andOthernon-ownermovementsinequityof$1.997bncomparedtoalossof$40min2008-09.Othernon-ownermovementsinequityincludedthewaterandseweragecorporations,$1.749bnbroughttoaccountforthefirsttime.
Gross acquisition of non-financial assets for 2009-10 was $1.324bn, an increase of $308m on2008-09.ThiswasprimarilyduetoassetinvestmentsattheGGSlevelwithcapitalexpenditureof$308mrelatedtotheNationalBuilding–EconomicStimulusPlanandtoinfrastructureandotherinvestmentsattheGGSandPNFClevels.ThemaindepartmentsincludedDepartmentofHealthandHumanServices(DHHS),$111m,DoE,$216mandDepartmentofInfrastructure,EnergyandResources(DIER),$202m.Otherinvestmentsincluded:
• Aurora,$234m,
• Transend,$148m,
• Hydro,$134m,
• Waterandseweragecorporations,$72m,
• Tasrail,$45m.
TheState’sNet assetsandEquity(alsoreferredtoastheState’sNet worth)increasedby$1.415bn,12.15%,primarilyduetothefirsttimerecognitionofwaterandseweragecorporations,$1.917bn,andnetNon-currentassetsadditions,$1.474bn.Thesewereoffsetbyunfavourablemovementsinthe State’s Superannuation liability, $912m or 20%. The net unfunded Superannuation liabilityiscalculatedbysubtractingthebalanceofplanassetsfromthegrossSuperannuationliability.TheincreaseintheSuperannuationliabilityof$912mcomprised:
• a$1.008bn,or17%, increase in thepresentvalueof thegrossSuperannuation liability to$7.036bn,partlyoffsetby
• anincreaseof$97m,or7%,inthefairvalueofplanassetsto$1.539bn.
ItisexpectedtheSuperannuationliabilitywillcontinuetoincreaseinthemediumterm.

37TotalStateFinancialStatements
Net financial worth(alsoreferredtoasNet financial liabilities)increasedby$1.239bntonegative$8.276bn.ThisitemrepresentsthedifferencebetweentheState’stotalfinancialassets less itstotalliabilitiesandismainlyrepresentedbytheState’sunfundedSuperannuationliabilityandtheextentto which financial liabilities such as borrowings and other financial liabilities were used to fundinfrastructureassets.
Net Debtwasnegative$748mat30June2010,whileTotalStatepositive$962m.ThisisduetothePNFC’sholdinghigherborrowings.
Total State’s Net Debt represents thedifferencebetween the state’scash,depositsand investmentassets, $3.450bn, and Borrowings, $4.411bn. Net Debt improved $20m compared to 2008-09,primarilyduetothedecreaseinCashandInvestments,$895m,beinglowerthanthenetdecreaseinBorrowingsof$916bn.
ConsistentwiththelowerNetOperatingBalance(beforeaccountingforcapitalreceipts),theTotalStateNet cash inflows generated fromoperating activities decreased from$583m in2008-09 to$397min2009-10.During2009-10therewasnet$695mcashoutflowoninvestingactivitiesandnet$817moutflowonfinancingactivities.Theserepresentedstronginvestmentsininfrastructureandrepaymentsofborrowings.Cashattheendoftheyearwas$1.574bnwhichwas$1.115bnlowerthanprioryear.
INTRODUCTION
TheTotalStateSectorFinancialStatements(theStatements)consolidateallentitiescontrolledbytheStateofTasmaniawithsegmentedfinancialinformationprovidedfortheGeneralGovernmentSector(GGS),PublicNon-FinancialCorporation(PNFC),PublicFinancialCorporation(PFC)andTotalStatelevels.Theconsolidatedlevelisaftereliminatinginter-sectortransactions.
TheStatementsprovide information about thefinancial performance,financial position and cashflowsoftheStateofTasmaniawiththeprincipalobjectiveofprovidingtotheParliamentinformative,comprehensiveandclearinformationontheState’soverallfinancialposition.
CommentsinthisChaptershouldbereadalongsidetheTreasurer’sAnnualFinancialReport(TAFR),whichincludestheGeneralGovernmentSectorFinancialStatements,PublicAccountStatementsandTotalStateSectorFinancialStatements.Thesereportsincludeauditedandun-auditedcommentaryexplainingthe2009-10financialresultsagainstbudgetandprioryears.InpreparingtheanalysisinthisChapter,somematerialdoesnotappear intheStatementsandhasbeenextractedfromotherChapters in this Volume and in Volume 2 Executive and Legislature, Government DepartmentsandotherGeneralGovernmentSectorStateentities200910andVolume3GovernmentBusinessEnterprises,StateOwnedCompaniesandSuperannuationFunds2009-10.
AUDIT OF THE 2009-10 TOTAL STATE FINANCIAL STATEMENTS
Total State Sector Financial Statements were signed and received on the 12 October 2010. Anunqualifiedauditreportwasissuedon20October2010.Theauditwascompletedsatisfactorilywithnomajoritemsoutstanding.
38 TotalStateFinancialStatements
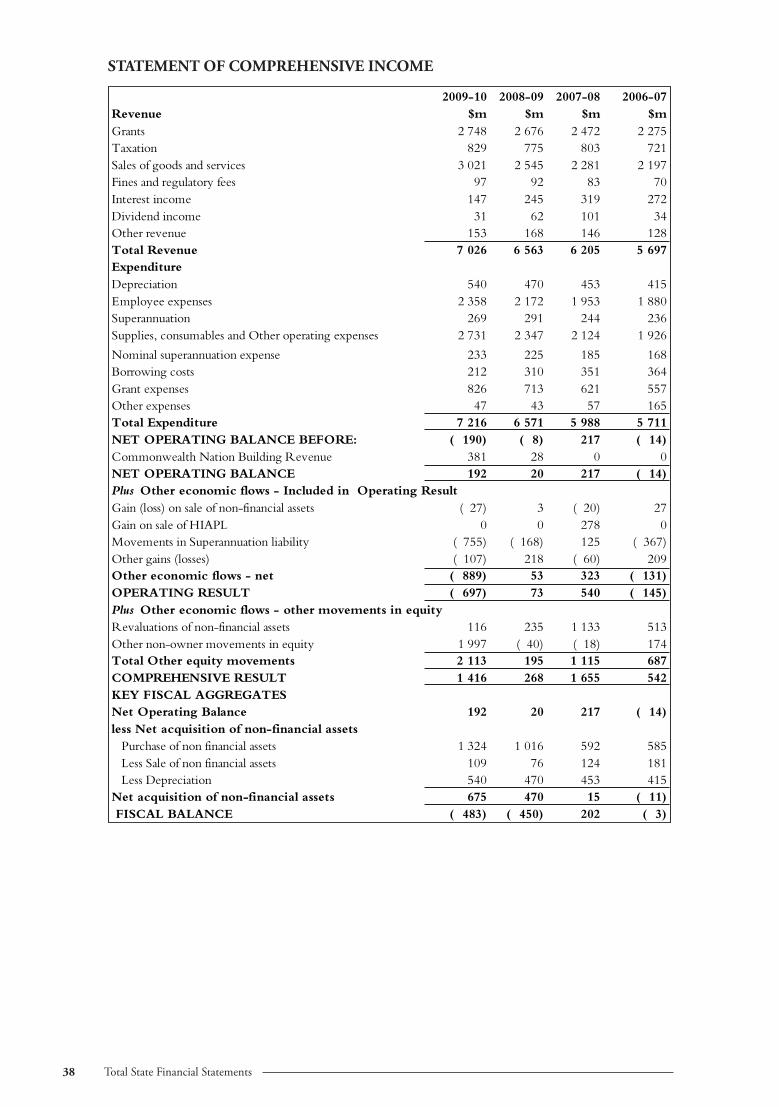
STATEMENT OF COMPREHENSIVE INCOME
2009-10 2008-09 2007-08 2006-07
Revenue $m $m $m $m
Grants 2 748 2 676 2 472 2 275
Taxation 829 775 803 721
Sales of goods and services 3 021 2 545 2 281 2 197
Fines and regulatory fees 97 92 83 70
Interest income 147 245 319 272
Dividend income 31 62 101 34
Other revenue 153 168 146 128
Total Revenue 7 026 6 563 6 205 5 697
Expenditure
Depreciation 540 470 453 415
Employee expenses 2 358 2 172 1 953 1 880
Superannuation 269 291 244 236
Supplies, consumables and Other operating expenses 2 731 2 347 2 124 1 926
Nominal superannuation expense 233 225 185 168
Borrowing costs 212 310 351 364
Grant expenses 826 713 621 557
Other expenses 47 43 57 165
Total Expenditure 7 216 6 571 5 988 5 711
NET OPERATING BALANCE BEFORE: ( 190) ( 8) 217 ( 14)
Commonwealth Nation Building Revenue 381 28 0 0
NET OPERATING BALANCE 192 20 217 ( 14)
Gain (loss) on sale of non-financial assets ( 27) 3 ( 20) 27
Gain on sale of HIAPL 0 0 278 0
Movements in Superannuation liability ( 755) ( 168) 125 ( 367)
Other gains (losses) ( 107) 218 ( 60) 209
Other economic flows - net ( 889) 53 323 ( 131)
OPERATING RESULT ( 697) 73 540 ( 145)
Revaluations of non-financial assets 116 235 1 133 513
Other non-owner movements in equity 1 997 ( 40) ( 18) 174
Total Other equity movements 2 113 195 1 115 687
COMPREHENSIVE RESULT 1 416 268 1 655 542
KEY FISCAL AGGREGATES
Net Operating Balance 192 20 217 ( 14)
less Net acquisition of non-financial assets
Purchase of non financial assets 1 324 1 016 592 585
Less Sale of non financial assets 109 76 124 181
Less Depreciation 540 470 453 415
Net acquisition of non-financial assets 675 470 15 ( 11)
FISCAL BALANCE ( 483) ( 450) 202 ( 3)
Plus Other economic flows - Included in Operating Result
Plus Other economic flows - other movements in equity
PDF Created with deskPDF PDF Writer - Trial :: http://www.docudesk.com

39TotalStateFinancialStatements
COMMENT
TheNetOperatingBalance,OperatingresultandComprehensiveresultwascommentedonwithinthe“Overview”sectionatthestartofthisChapter.
Key Fiscal Aggregates - Disclosure of the State’s Fiscal Balance
AASB1049requiresdisclosureofkeyfiscalaggregatesonthefaceoftheStatementofComprehensiveIncome.Tasmaniapresentedthekeyfiscalaggregates inastylethat isconsistentwiththepracticeunderGeneralFinanceStatistics(GFS)andwesupport its inclusiononthisbasis.Essentiallythisinformationshowsthe impactontheNetOperatingBalanceofnetexpenditureonnon-financialassetsratherthanthedepreciationcharge.
In2009-10,thegrossinvestmentonnon-financialassetswas$1.324bn,being$308mhigherthanthepreviousyear.Expenditureonnon-financialassetsiscommentedonfurther,laterinthisChapter.
ThisconcludesouranalysisoftheStatementofComprehensiveIncome.However,thenotestotheTotalStateSectorFinancialStatements,andthisReport,includeotherfinancialinformationsomeofwhichisnowdealtwith.TheobservationsbelowareaimedatfurtheranalysingcomponentsoftheTotalStateSectorresults.
Four year revenue and expenditure analysis
Revenue and expenditure
Figure1presentsrevenueandexpendituretrendsfortheGGS,PNFC’sandPFC’s,andtheTotalStateoverthepastfouryears.TherevenueandexpendituretrendsexcludeothereconomicflowsandtheCommonwealthnationalBuildinggrants.
Figure 1: Revenue and Expenditure before Other economic flows and Commonwealth National Building grant
1 0 0 0
2 0 0 0
3 0 0 0
4 0 0 0
5 0 0 0
6 0 0 0
7 0 0 0
8 0 0 0
2 0 0 6 -0 7 2 0 0 7 -0 8 2 0 0 8 -0 9 2 0 0 9 -1 0
G G S R e ve n u e G G S E x p e n d it u re S t a t e R e ve n u e
S t a t e E x p e n d it u re P N F C / P F C R e ve n u e P N F C / P F C E x p e n d it u r e
40 TotalStateFinancialStatements
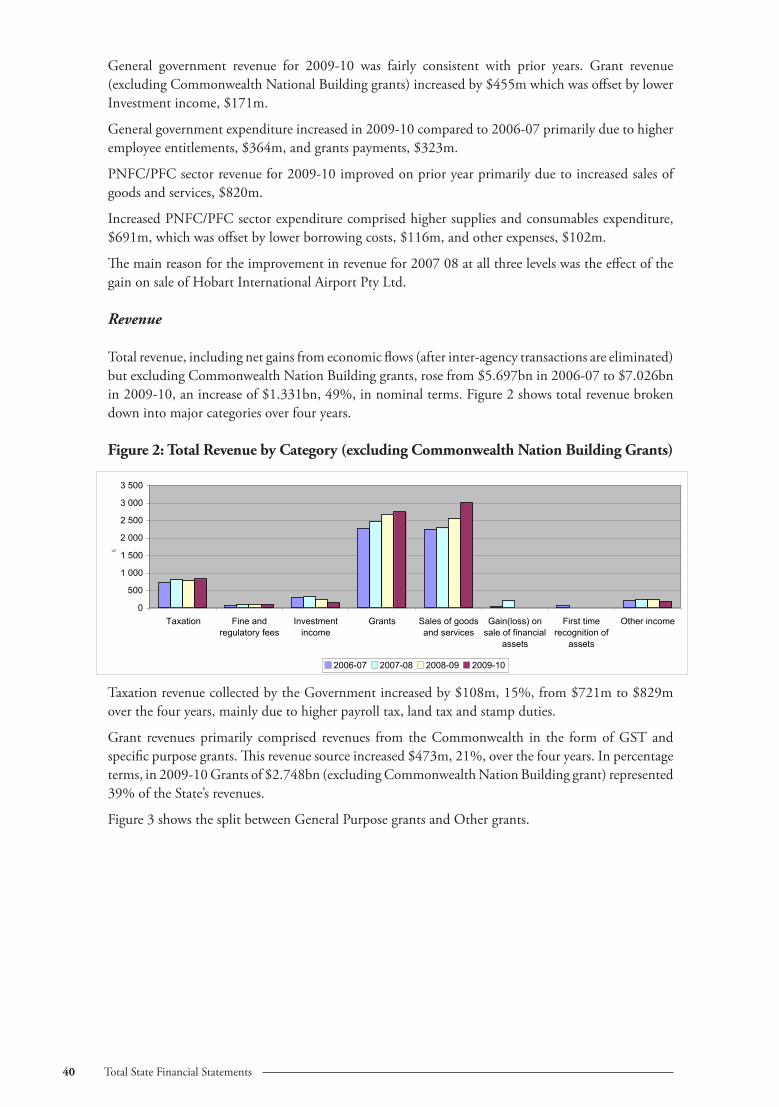
General government revenue for 2009-10 was fairly consistent with prior years. Grant revenue(excludingCommonwealthNationalBuildinggrants)increasedby$455mwhichwasoffsetbylowerInvestmentincome,$171m.
Generalgovernmentexpenditureincreasedin2009-10comparedto2006-07primarilyduetohigheremployeeentitlements,$364m,andgrantspayments,$323m.
PNFC/PFCsectorrevenuefor2009-10improvedonprioryearprimarilyduetoincreasedsalesofgoodsandservices,$820m.
IncreasedPNFC/PFCsectorexpenditurecomprisedhighersuppliesandconsumablesexpenditure,$691m,whichwasoffsetbylowerborrowingcosts,$116m,andotherexpenses,$102m.
Themainreasonfortheimprovementinrevenuefor200708atallthreelevelswastheeffectofthegainonsaleofHobartInternationalAirportPtyLtd.
Revenue
Totalrevenue,includingnetgainsfromeconomicflows(afterinter-agencytransactionsareeliminated)butexcludingCommonwealthNationBuildinggrants,rosefrom$5.697bnin2006-07to$7.026bnin2009-10,anincreaseof$1.331bn,49%,innominalterms.Figure2showstotalrevenuebrokendownintomajorcategoriesoverfouryears.
Figure 2: Total Revenue by Category (excluding Commonwealth Nation Building Grants)
TaxationrevenuecollectedbytheGovernmentincreasedby$108m,15%,from$721mto$829moverthefouryears,mainlyduetohigherpayrolltax,landtaxandstampduties.
Grant revenuesprimarily comprised revenues from theCommonwealth in the formofGSTandspecificpurposegrants.Thisrevenuesourceincreased$473m,21%,overthefouryears.Inpercentageterms,in2009-10Grantsof$2.748bn(excludingCommonwealthNationBuildinggrant)represented39%oftheState’srevenues.
Figure3showsthesplitbetweenGeneralPurposegrantsandOthergrants.
0
500
1 000
1 500
2 000
2 500
3 000
3 500
Taxation Fine andregulatory fees
Investmentincome
Grants Sales of goodsand services
Gain(loss) onsale of financial
assets
First timerecognition of
assets
Other income
$m
2006-07 2007-08 2008-09 2009-10

41TotalStateFinancialStatements
Figure 3: Revenue From Transactions - Grants ($m)
The graph illustrates thatGeneral Purpose revenues(including GST revenues)remainedconsistent.However,other Australian Governmentgrants increased significantly,and included NationalPartnershipPayments,$769min 2009-10 and SpecificPurpose Payments, $580m.The2009-10NetOperatingBalanceof$192mwouldhavebeensignificantlyworsewithoutone-offAustralianGovernmentfundingforspecificmajorcapitalprograms.One-offAustralianGovernmentfundingfor2009-10includedNationBuilding–EconomicStimulusPlanandadditionalfundingforNationBuildingformerlyAus-linkandWaterfortheFuture,andtotalled$381m.
Salesofgoodsandservices,predominantlybyGovernmentBusinesses,contributedaround43%ofStaterevenue.Thisrevenuesourceincreasedby$778m,35%,overthefouryearsunderreview.Muchofthisincreasewasrelatedtothethreeelectricitybusinesses.
Expenditure
Total expenditure (after inter-agency transactions are eliminated), and excludingOther economicflows,increasedfrom$5.711bnin2006-07to$7.216bnin2009-10,anincreaseof$1.504bn,26%,innominalterms.Figure4detailsannualmovementsbymajorcategoriesofexpenditure.
Figure 4: Total Expenditure (excluding Other economic flows)
Employeecosts increased$478m,25%,from2006-07to$2.358bnin2009-10.Theincreasewascausedprimarilybyawardwagerisesandrecruitmentofadditionalstaff,particularlyinthehealthandelectricitysectors.
Figures5and6belowprovidefurtheranalysisofthetwolargestcategoriesofexpenditure,employeeentitlementsandsuppliesandconsumables,bysector.
0
500
1 000
1 500
2 000
2 500
3 000
Employee entitlements Depreciation Borrowing costs Grants and transfer payments
Supplies and consumables Other expenses
$m
2006-07 2007-08 2008-09 2009-10
0
500
1000
1500
2000
General PurposePayments
Other Grants
Year
$m
2006-07
2007-08
2008-09
2009-10

42 TotalStateFinancialStatements
Figure 5: Employee Entitlements ($m)
These figures confirm highgrowth in employee costs on2009-10 in all sectors. Thesignificant growth in suppliesand consumables in 2009-10 was mainly related to theelectricityentities.
Figure 6: Supplies and Consumables ($m)
Table1summarisesmovementsfrom2007-08to2009-10,forSalesofgoodsandservices,employeeentitlementsandinsuppliesandconsumablesforthelargerGBEsandSOCs.
Table 1: Movement analysis of major expenditure items for selected GBEs and SOCs
Entity Sales of goods and Services ($m)
Supplies and Consumables
Employee Entitlements ($m)
TT-Line 22 12% 14 14% 2 4%AuroraEnergy 303 26% 288 30% 23 28HydroTasmania 264 37% 139 35% 4 4%ForestryTasmania (24) (17%) (7) (5%) 0 2%MetroTasmania (0) (3%) 1 10% 2 9%TransendNetworks 38 22% (1) (5%) 7 32%TOTETasmania 19 20% 2 3% 0 2%Tasports (30) (38%) (2) (6%) 1 3%
Thetableillustratesthatinpercentagetermseachentityreportedincreasesinemployeeentitlements.ThetablealsodemonstratesthethreeelectricityentitieshadasignificantfinancialimpactataTotalStateSectorlevel.
Grantexpensesincreasedovertheperiodby$269m,48%,primarilyfundedthroughincreasedgrantrevenuefromtheCommonwealth.
BorrowingcostsdeclinedinlinewithlowernetborrowingsinTascorpandlowerinterestrates.
Depreciation charges increased over the period by $125m, 30%, mainly because of ongoinginvestmentsininfrastructureandassetrevaluations.
Thenominalsuperannuationexpensefluctuatedprimarilyduetochangesinactuarialassumptionssuchasapplyingdifferentdiscount rates, lowervaluesattributed to investmentsdue to theglobalfinancialcrisisandduetolowerpensionermortalityrates.
0
500
1000
1500
2000
2500
GGS PNFC & PFC
Year
$m
2006-07
2007-08
2008-09
2009-10
0
500
1000
1500
2000
GGS PNFC & PFC
Year
$m
2006-07
2007-08
2008-09
2009-10
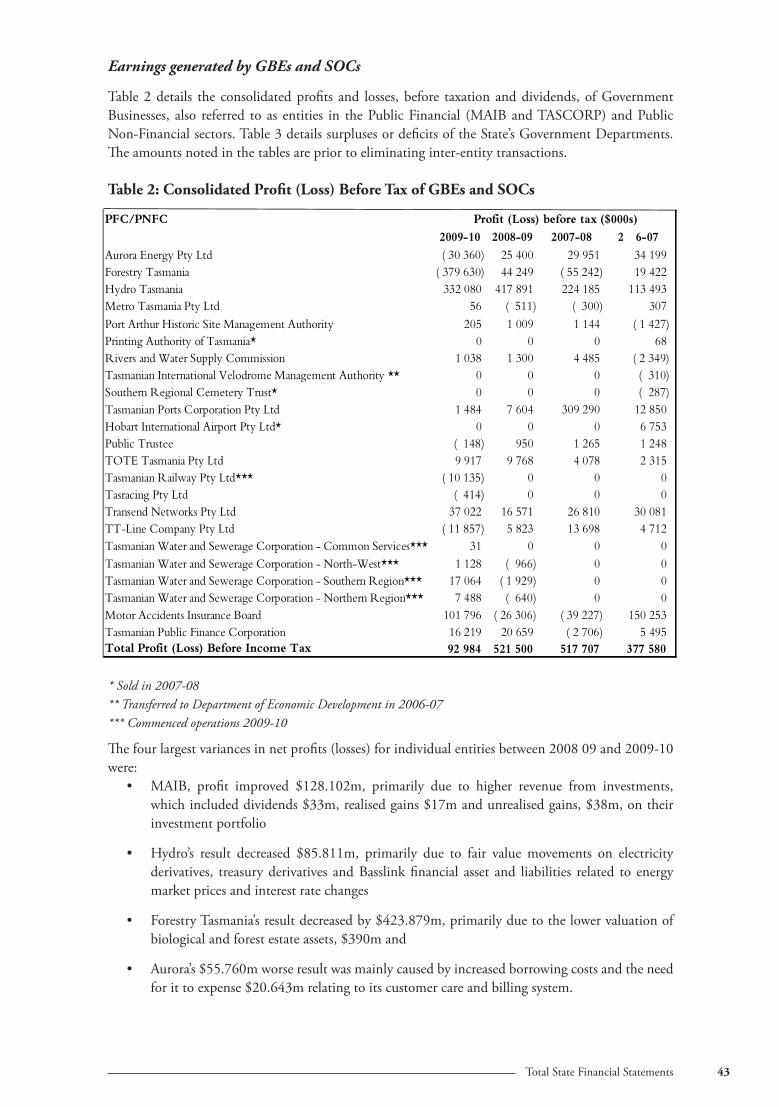
43TotalStateFinancialStatements
Earnings generated by GBEs and SOCs
Table2details the consolidatedprofits and losses,before taxationanddividends,ofGovernmentBusinesses, also referred toas entities in thePublicFinancial (MAIBandTASCORP)andPublicNon-Financialsectors.Table3detailssurplusesordeficitsoftheState’sGovernmentDepartments.Theamountsnotedinthetablesarepriortoeliminatinginter-entitytransactions.
Table 2: Consolidated Profit (Loss) Before Tax of GBEs and SOCs
* Sold in 2007-08** Transferred to Department of Economic Development in 2006-07*** Commenced operations 2009-10
Thefourlargestvariancesinnetprofits(losses)forindividualentitiesbetween200809and2009-10were:
• MAIB, profit improved $128.102m, primarily due to higher revenue from investments,whichincludeddividends$33m,realisedgains$17mandunrealisedgains,$38m,ontheirinvestmentportfolio
• Hydro’s result decreased $85.811m, primarily due to fair value movements on electricityderivatives, treasuryderivatives andBasslinkfinancial asset and liabilities related toenergymarketpricesandinterestratechanges
• ForestryTasmania’sresultdecreasedby$423.879m,primarilyduetothelowervaluationofbiologicalandforestestateassets,$390mand
• Aurora’s$55.760mworseresultwasmainlycausedbyincreasedborrowingcostsandtheneedforittoexpense$20.643mrelatingtoitscustomercareandbillingsystem.
EntityTT - Line 22 12% 14 14% 2 4%Aurora Energy 303 26% 288 30% 23 28%Hydro Tasmania 264 37% 139 35% 4 4%Forestry Tasmania (24) -17% (7) -5% 0 2%Metro Tasmania (0) -3% 1 10% 2 9%Transend Networks 38 22% (1) -5% 7 32%TOTE Tasmania 19 20% 2 3% 0 2%Tasports (30) -38% (2) -6% 1 3%
Employee Entitlements ($'m)
Sales of goods and Services ($'m)
Supplies and Consumables ($'m)
PFC/PNFC
2009-10 2008-09 2007-08 200
6-00
7
Aurora Energy Pty Ltd ( 30 360) 25 400 29 951 34 199 Forestry Tasmania ( 379 630) 44 249 ( 55 242) 19 422 Hydro Tasmania 332 080 417 891 224 185 113 493 Metro Tasmania Pty Ltd 56 ( 511) ( 300) 307
502 ytirohtuA tnemeganaM etiS cirotsiH ruhtrA troP 1 009 1 144 ( 1 427)Printing Authority of Tasmania* 0 0 0 68
4 003 1 830 1 noissimmoC ylppuS retaW dna sreviR 485 ( 2 349)Tasmanian International Velodrome Management Authority ** 0 0 0 ( 310)Southern Regional Cemetery Trust* 0 0 0 ( 287)
3 406 7 484 1 dtL ytP noitaroproC stroP nainamsaT 09 290 12 850 Hobart International Airport Pty Ltd* 0 0 0 6 753 Public Trustee ( 148) 950 1 265 1 248 TOTE Tasmania Pty Ltd 9 917 9 768 4 078 2 315 Tasmanian Railway Pty Ltd*** ( 10 135) 0 0 0 Tasracing Pty Ltd ( 414) 0 0 0 Transend Networks Pty Ltd 37 022 16 571 26 810 30 081 TT-Line Company Pty Ltd ( 11 857) 5 823 13 698 4 712 Tasmanian Water and Sewerage Corporation - Common Services*** 31 0 0 0 Tasmanian Water and Sewerage Corporation - North-West*** 1 128 ( 966) 0 0 Tasmanian Water and Sewerage Corporation - Southern Region*** 17 064 ( 1 929) 0 0 Tasmanian Water and Sewerage Corporation - Northern Region*** 7 488 ( 640) 0 0
()603 62 ( 697 101 draoB ecnarusnI stnediccA rotoM 39 227) 150 253 956 02 912 61 noitaroproC ecnaniF cilbuP nainamsaT ( 2 706) 5 495
Total Profit (Loss) Before Income Tax 92 984 521 500 517 707 377 580
Profit (Loss) before tax ($ s)
PDF Created with deskPDF PDF Writer - Trial :: http://www.docudesk.com

44
page deliberately left blank

45TotalStateFinancialStatements
Surpluses and deficits generated by Ministerial departments
Table3summarisesthefinancialresultsofsomeofthegovernmentdepartments.
Table 3: Surplus (Deficit) of Government Departments.
* DEPHA responsibilities were transferred to DPIPWE and DEDTA on 1 July 2009
Thefourlargestmovementsbetween2008-09and2009-10were:
• DoE,anincreaseof$212m,primarilydrivenbythereceiptofCommonwealthBuildingtheEducationRevolutionfundingtotalling$229m
• DIER,anincreaseof$199m,duetohighercapitalrevenuefromgovernment,anincreaseof$94m,andrevenuefortransfertoTasrail,$82m,
• DHHS,anincreaseof$83m,duetoincreasedrevenuefromgovernment
• The higher deficit in Primary Industries, Parks, Water and Environment of $40.542m,primarilyduetoachangeinestimateof$28.220mrelatingtolandandbuildingstransferredtolocalgovernmentandForestryTasmaniainprioryears.
Government Departments2009-10 2008-09 2007-08 2006-07
Economic Development, Tourism and the Arts* ( 7 851) ( 5 908) ( 1 242) 19 655 Education 198 499 ( 13 579) ( 6 063) 25 747 Health and Human Services 50 257 ( 32 110) 6 491 ( 57 386)
5 72 ( 481 171 secruoseR dna ygrenE ,erutcurtsarfnI 50) 14 985 ( 14 027)Justice 663 7 372 8 426 17 509
10 6 )424 ()452 4 (tnemeganaM ycnegremE dna eciloP 9 ( 355)Premier and Cabinet ( 1 009) ( 600) ( 646) 2 592 Primary Industries Parks Water and Environment* ( 74 999) ( 34 457) 55 747 ( 1 906)
3 22 0 *strA eht dna egatireH ,skraP ,tnemnorivnE 77 4 081 10 499 Treasury and Finance 1 885 ( 6 068) ( 397) 608 Net Surplus (Deficit) Attributable to the State 334 375 ( 90 947) 87 401 2 936
Surplus (Deficit) ($ms)
PNFC2009-10 2008-09 2007-08 2006-07
$m $m $m $mAurora Energy Pty Ltd 1030 933 555 505 Forestry Tasmania 53 53 53 41
1
Hydro Tasmania 3 1 1 1 192 Metro Tasmania Pty Ltd 0 0 0 3
0 0ytirohtuA tnemeganaM etiS cirotsiH ruhtrA troP 0 0 Private Forests Tasmania 1 1 1
51 52 52 32noissimmoC ylppuS retaW dna sreviRPublic Trustee 0 0 0 0 TOTE Tasmania Pty Ltd 10 0 2 2 Tasmanian Railway Pty Ltd 0 0 0 0 Tasracing Pty Ltd 2 2 0 0 Transend Networks Pty Ltd 518 488 409 118 TT-Line Company Pty Ltd 25 50 75 75
3 81 02 02 dtL ytP noitaroproC stroP nainamsaT 3 Tasmanian Water and Sewerage Corporation - Common Services 7 0 0 0 Tasmanian Water and Sewerage Corporation - North-West 79 0 0 0 Tasmanian Water and Sewerage Corporation - Southern Region 108 0 0 0 Tasmanian Water and Sewerage Corporation - Northern Region 17 0 0 0
PDF Created with deskPDF PDF Writer - Trial :: http://www.docudesk.com

46 TotalStateFinancialStatements
STATEMENT OF FINANCIAL POSITION
Note:1 - Majority of Investments represented Tascorp loan advances and securities.2 - Equity investments primarily related to MAIB investments.3 - Other financial assets included Basslink related financial assets.
30 June 2010 30 June 2009 30 June 2008 30 June 2007$m $m $m $m
AssetsFinancial Assets
Cash and deposits a 147 325 346 16
Investments b 1 3303 4 595 4 077 4 374
Equity investments c 2 243 243 652 737
Receivables d 517 590 426 453
Other financial assets e 3 826 841 594 546
Total Financial Assets f 5 036 6 594 6 095 6 126
Non-financial Assets437 4 121 5 203 5 1055sgnidliub dna dnaL
Infrastructure 14168 11 849 11 288 9 957963 493 183 034tnempiuqe dna tnalP 993 714 744 355stessa larutluc dna egatireH
Biological assets 319 385 330 38982 03 92 92ytreporp tnemtsevnI
Goodwill 55 55 Intangible assets 105 90 67 44 Assets held for sale 32 20 24 75 Other 149 128 88 64Total Non-Financial Assets 21 341 18 686 17 759 16 059Total Assets 26 377 25 280 23 854 22 185Liabilities
Borrowings g 4411 5 327 4 734 5 070 Superannuation 5497 4 585 4 231 4 214
554 964 445 765stnemeltitne eeyolpmE Payables 282 425 304 473 Other liabilities 2555 2 749 2 734 2 247
Total Liabilities h 13 312 13 630 12 472 12 459Net Assets 13 065 11 650 11 382 9 727Equity
Accumulated surpluses 8012 6 382 6 193 5 141220 4 551 5 092 5 8705sevreser noitaulaver tessA
Other reserves ( 25) ( 22) 4 564Equity 13 065 11 650 11 382 9 727
Net Worth 13 065 11 650 11 382 9 727 ()873 6 ()730 7 ()672 8 ()h-f( htroW laicnaniF teN 6 333)
Net Financial Liabilities (h-f) 8 276 7 037 6 378 6 333086 213 704 269 )g-b+a( tbeD teN
PDF Created with deskPDF PDF Writer - Trial :: http://www.docudesk.com

47TotalStateFinancialStatements
COMMENT
TheState’sNetAssetsat30June2010was$13.065bn,anincreaseof$1.415bn,12%,from2008-09.Thismovementcomprisedmainly:
• increasedInfrastructureassets,$2.319bnprimarilyduetotheinclusionof$1.873bnforthewaterandseweragecorporationsandTasmanianRailwayPtyLtd,$9m,andcapitalinvestmentininfrastructureassetsmainlyundertakenbytheelectricitycompanies
• increasedLandandbuildings,$199m,mainlyduetotheinclusionofthewaterandseweragecorporations,$52m,andrevaluations,$111m
• achangeinthestructureoftheportfolioofassetsheldbythePublicFinancialCorporation(PFC) Sector which led to a significant decrease in PFC Sector Investments and Otherequityinvestmentsof$1.042bn,andacorrespondingdecreaseinPFCSectorBorrowingsof$1.096bn
• decreasedOtherLiabilitiesheldbythePNFCSectorof$168mduetoadeclineinthevalueofenergypricederivativesheldbyHydroTasmania.
• increasedSuperannuationliability,up$912m,explainedearlier
TotalEquityincreased$1.415bnin2009-10duetoComprehensivesurplus.
Figures 7 to 9 provide graphical representations ofTotal Assets,Total Liabilities, and Net Assetmovementsoverthereviewperiodforeachsector.
Figure 7: Total State assets, liabilities and net assets ($m)
Figure 8: General Government Sector assets, liabilities and net assets ($m)
0 5 000 10 000 15 000 20 000 25 000 30 000
Total Assets
Total Liabilities
Net Assets
2009-102008-092007-082006-07
0 5 000 10 000 15 000 20 000 25 000
Total Assets
Total Liabilities
Net Assets
2009-102008-092007-082006-07
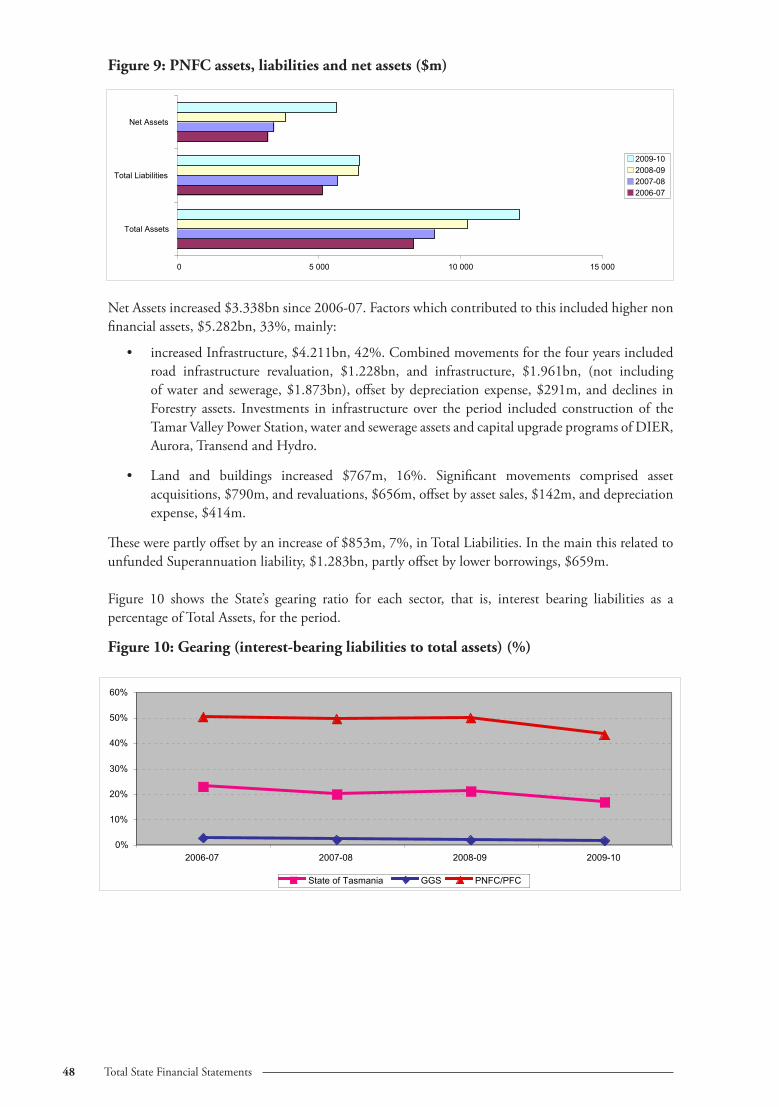
48 TotalStateFinancialStatements
Figure 9: PNFC assets, liabilities and net assets ($m)
NetAssetsincreased$3.338bnsince2006-07.Factorswhichcontributedtothisincludedhighernonfinancialassets,$5.282bn,33%,mainly:
• increasedInfrastructure,$4.211bn,42%.Combinedmovementsforthefouryearsincludedroad infrastructure revaluation, $1.228bn, and infrastructure, $1.961bn, (not includingofwaterandsewerage,$1.873bn),offsetbydepreciationexpense,$291m,anddeclines inForestry assets. Investments in infrastructure over theperiod included constructionof theTamarValleyPowerStation,waterandsewerageassetsandcapitalupgradeprogramsofDIER,Aurora,TransendandHydro.
• Land and buildings increased $767m, 16%. Significant movements comprised assetacquisitions,$790m,andrevaluations,$656m,offsetbyassetsales,$142m,anddepreciationexpense,$414m.
Thesewerepartlyoffsetbyanincreaseof$853m,7%,inTotalLiabilities.InthemainthisrelatedtounfundedSuperannuationliability,$1.283bn,partlyoffsetbylowerborrowings,$659m.
Figure 10 shows the State’s gearing ratio for each sector, that is, interest bearing liabilities as apercentageofTotalAssets,fortheperiod.
Figure 10: Gearing (interest-bearing liabilities to total assets) (%)
0 5 000 10 000 15 000
Total Assets
Total Liabilities
Net Assets
2009-102008-092007-082006-07
0%
10%
20%
30%
40%
50%
60%
2006-07 2007-08 2008-09 2009-10
State of Tasmania GGS PNFC/PFC

49TotalStateFinancialStatements
Figure10illustratesthattheState’sgearingratiodeclinedslightlyoverthepastfouryearsindicatingthatborrowingsdeclinedrelativetogrowthintheState’sassets.
Figures10to12depictdebtsustainabilityatthefollowinglevelsforeachsectorovertheperiod:
• Interest bearing liabilities and unfunded superannuation liabilities to Gross State Product(GSP)
• InterestbearingliabilitiestoGSP
• UnfundedSuperannuationliabilitiestoGSP.
DebtsustainabilityisakeymeasureoftheState’sabilitytosupportandfinanceitsdebt.Thelowertheratio,thebettertheStateisabletoserviceitsdebtobligations.DebtsustainabilityisdeterminedbyexpressinginterestbearingliabilitiesplusunfundedsuperannuationcomparedtoGSP.
Actual2008-09GSPhasbeenusedfor2009-10duetoactual2009-10GSPnotbeingavailableatthedateofcompletingthisReport.
Figure 11: Debt Sustainability (interest bearing liabilities and unfunded superannuation liabilities to GSP) (%)
TheState’sSuperannuationliabilityincreasedby$1.283m,30%,from2006-07to2009-10primarilydue to changes in actuarial assumptions primarily revised actuarial projections due to the lowerdiscount rate, lower assumed pensioner mortality rates, higher than anticipated salary increases,higherthanprojectedschemeassetbalanceandothermiscellaneousexperienceadjustments.
0%
10%
20%
30%
40%
50%
60%
2006-07 2007-08 2008-09 2009-10
State of Tasmania GGS PNFC/PFC

50 TotalStateFinancialStatements
Figure 12: Debt Sustainability (interest bearing liabilities to GSP) (%)
Figure12confirmstheState’sabilitytosupportandfinanceitsinterestbearingliabilitiesremainedrelativelyunchangedsince200607.ThemajorreasonforthevariationsbetweenindividualyearswasinthePNFCsector,duetohigherinterestbearingliabilities.
Table4detailsinterestbearingliabilitybalanceswithinthePNFCandPFCsectors.
Table 4: Interest Bearing Liabilities by Entity for the PNFC sector
PNFC2009-10 2008-09 2007-08 2006-07 2005-06
$m $m $m $m $mAuroraEnergyPtyLtd 1030 933 555 505 461ForestryTasmania 41 41 41 41 35HydroTasmania 873 941 971 1192 1077MetroTasmaniaPtyLtd 0 0 0 3 3Port Arthur Historic Site ManagementAuthority
0 0 0 0 0
PrivateForestsTasmania 1 1 1 1RiversandWaterSupplyCommission 23 25 25 15 4PublicTrustee 0 0 0 0 0TOTETasmaniaPtyLtd 10 0 2 2 2TasmanianRailwayPtyLtd 0 0 0 0 0TasracingPtyLtd 2 2 0 0 0TransendNetworksPtyLtd 518 488 409 118 93TT-LineCompanyPtyLtd 25 50 75 75 186TasmanianPortsCorporationPtyLtd 20 20 18 33 65TasmanianWaterandSewerageCorporation-CommonServices
7 0 0 0 0
TasmanianWaterandSewerageCorporation-North-West
79 0 0 0 0
TasmanianWaterandSewerageCorporation-SouthernRegion
108 0 0 0 0
TasmanianWaterandSewerageCorporation-NorthernRegion
17 0 0 0 0
NB –Most borrowings are from Tascorp to GBEs and SOCs and therefore Tascorp is not listedDebt = Borrowings (current) + Borrowings (non current)
0 %
1 0 %
2 0 %
3 0 %
4 0 %
5 0 %
2 0 0 6 - 0 7 2 0 0 7 - 0 8 2 0 0 8 - 0 9 2 0 0 9 - 1 0
Sta te o f Ta s m a n ia G G S PNFC/PFC

51TotalStateFinancialStatements
WithinthePNFCsectortotalborrowingsincreased$779mfrom200607to$2.764bnin2009-10.HydroandAuroracomprisethemajorportionofthesector’soverallborrowing.BorrowingsincreasedeachyearoverthefouryearperiodforAuroraandTransendanddecreasedforHydroandTT-line.
Figure 13: Debt Sustainability (unfunded superannuation liabilities to GSP) (%)
Debtsustainabilityratio(unfundedsuperannuationliabilities toGSP),as illustratedinFigure13,worsenedslightlybetween2006-07and2008-09butimprovedin2009-10.
TheSuperannuation liability increasedby$1.283bn,30%, from200607 to2009-10 for reasonsoutlinedpreviously.
0 %
5 %
1 0 %
1 5 %
2 0 %
2 5 %
3 0 %
2 0 0 6 - 0 7 2 0 0 7 - 0 8 2 0 0 8 - 0 9 2 0 0 9 - 1 0
S t a t e o f T a s m a n ia G G S P N F C / P F C

52 TotalStateFinancialStatements
STATEMENT OF CASH FLOWS
2009-10 2008-09 2007-08 2006-07Cash flows from operating activitiesCash inflows $m $m $m $m Taxation 825 765 825 722 Sales of goods and services 3 305 2 497 2 401 2 220 Grants received 2 770 2 651 2 466 2 260 Dividend, tax and rate equivalents 31 0 0 0 Fines and regulatory fees 86 63 61 55 Interest received 140 218 313 290 Other receipts 457 511 679 550
7 614 6 705 6 745 6 097Cash outflows Employee entitlements ( 2 321) ( 2 109) ( 1 941) ( 1 795) Superannuation ( 355) ( 303) ( 271) ( 229) Supplies and consumables ( 3 034) ( 2 304) ( 2 274) ( 2 002) Grants and subsidies paid ( 812) ( 703) ( 636) ( 636) Borrowing costs ( 301) ( 319) ( 337) ( 339) Other payments ( 394) ( 384) ( 478) ( 506)
( 7 217) ( 6 122) ( 5 937) ( 5 507) 385 793 seitivitca gnitarepo morf swolf hsac teN 808 590
Cash flows from investing activitiesNet cash flows from investment in non-financial assets
0 82 183 euneveR gnidliuB noitaN htlaewnommoC 0 Purchases of non-financial assets ( 1 324) ( 1 016) ( 592) ( 585) Sales of non-financial assets 109 76 123 182
( 834) ( 912) ( 469) ( 403)
( 453) ( 329) ( 339) ( 187)
Net cash flows from investment in financial assets for policy purposes Equity injections 0 0 0 ( 1) Net advances paid ( 12) ( 12) 35 10
( 12) ( 12) 35 9Net cash flows from investment in financial assets for liquidity purposes Net purchase of investments 151 199 330 440
151 199 330 440Net Cash flows from (used in) investing activities ( 695) ( 725) ( 104) 46Cash flows from financing activities Net borrowing ( 833) 29 ( 461) 285 Other financing 16 12 ( 7) 0Total ( 817) 41 ( 468) 285
)001 ()511 1 (dleh hsac ni )esaerced( esaercni teN 236 921
1 827 2 987 2 986 2 raey eht fo gninnigeb eht ta hsaC 806Cash at the end of the year 1 574 2 689 2 964 2 728
KEY FISCAL AGGREGRATESNet cash from operating activities 397 583 808 590plus distributions paid as Dividends ( 16)plus Net cash from investments in non-financial assets ( 834) ( 912) ( 469) ( 403)
PDF Created with deskPDF PDF Writer - Trial :: http://www.docudesk.com
EQUALS CASH SURPLUS (DEFICIT)

53TotalStateFinancialStatements
COMMENT
Thisyear’scashflowsresultedinaNetdecreaseincashof$1.115bn.Thedecreasewascausedmainlyby:
• repaymentofborrowings,$833m,
• Purchasesofnon-financialassets,$1.324m,mainlydue to increasedcapital investmentbytheDepartmentofEducation,$216m,DepartmentofHealthandHumanServices,$111m,andDepartmentofInfrastructure,EnergyandResources,$202m,Aurora,$233m,Hydro,$134m, Transend, $147 and This was in part funded by $381 capital receipts from theAustralianGovernmentforspecificmajorcapitalprograms.
Reasons for other variations in cash flow receipt and payment amounts reflect comments madepreviously under the Statement of Comprehensive Income and Statement of Financial PositionsectionsofthisChapter.
Table7providesasummaryoftheState’scapitalexpenditureduringthefouryearsto30June2010(basedoncashoutflows,notaccruedexpenditure).
Table 7: Capital Expenditure
2009-10 2008-09 2007-08 2006-07$m $m $m $m
CapitalExpenditureGeneralgovernmentsectore 607 286 252 233PNFCsandPFCs 717 730 340 352Total 1324 1 016 592 585
ThehighercapitalexpenditurebyGGSin2009-10wasprimarilyduetoincreasedcapitalinvestmentby the Department of Education, $216m, Department of Health and Human Services, $111m,DepartmentofInfrastructure,$202m.TheincreaseincapitalexpenditurebyPNFCsin200809wasprimarilyduetoAurora’scapitalspendingof$457minthemainassociatedwiththeTVPS.FurtherhighlevelsofinvestmentweremadebyAurorain2009-10.

54
page deliberately left blank

55SpecialCapitalInvestmentFunds
SPECIAL CAPITAL INVESTMENT FUNDS
Infrastructure investment decisions are managed through the Government’s Capital InvestmentProgram(CIP).TheCIPincludestheRoadsandHousingPrograms,andissupplementedthroughallocationsfromSpecialCapitalInvestmentFundssuchastheRoyalHobartRedevelopmentFund,theBetterRoadsFundandtheEconomicandSocialInfrastructureFund.TheGovernmentestablishedseveralnewinfrastructurerelatedfundsduring200708includingtheInfrastructureTasmaniaFund,theHospitalsCapitalFund,theUrbanRenewalsandHeritageFund,theWaterInfrastructureFundandtheHousingFund.
ThefollowingtablesetsoutthetransactionsofeachoftheFundsduring2009-10.
TheEconomic and Social Infrastructure Fund (ESIF)wasestablishedin2003-04andfundsprojectsassistingeconomicdevelopmentandtheprovisionofsocialinfrastructure.Socialinfrastructureprojectsrelate to education, tourism,parks,heritage,health andhousing throughout theState.Economicdevelopment projects relate to a range of infrastructure and related developments, including themaintenanceoftheState’sroadsandbridges,andwaterinfrastructure.Totalexpenditurein2009-10fromthisfundwas$14.666mandincluded:
• AFLarrangement–HawthornFootballClub,$3.404m,
• BelleriveOvallighting,$2.850m,
• DomainTennisCentre,$1.050m,
• TasmanianMuseumandArtGallery,$1.589m,
• Hospitalequipmentfund,$1.743m,
• ForestryTasmania,$1.000m,
• Mainstreetmakeover,$0.706m.
2009-10 2008-09 2007-08 2006-07$m $m $m $m
Capital ExpenditureGeneral government sector 607 286 252 233PNFCs and PFCs 717 730 340 352
585295610 1 4231latoT
Opening Balance Deposits Withdrawals
Closing Balance
$m $m $m $m
Economic and Social Infrastructure Fund 22.955 20.366 14.666 28.65562.58861.32546.31
510.81
297.49dnuF ainamsaT erutcurtsarfnI 9Housing Fund 56.439 0.000 8.996 47.443
278.96926.9000.0105.97dnuF laitpaC slatipsoHRoyal Hobart Hospital Redevelopment Fund 2.249 0.000 1.485 0.764Better Roads Fund 2.030 0.000 1.883 0.147Urban Renewal and Heritage Fund 21.499 0.000 10.337 11.162
150.84040.23670.26dnuF erutcurtsarfnI retaW
TOTAL 341.541 52.026 291.363102.204
2009-10 2008-09 2007-08 2006-07% % % %
Australian Government - General purpose payments (GST) 42.8 39.1 41.8 42.4Australian Government - Specific purpose payments 15.1 12.6 12.3 12.0
3.16.11.20.0stnarg latipaC - tnemnrevoG nailartsuATotal revenue from the Australian Government* 57.9 53.8 55.6 55.7Other grants and subsidies 3.2 8.1 6.2 5.9Payroll tax 7.1 6.2 6.3 5.9Taxes on property 8.5 7.0 8.2 7.6Gambling taxes 2.6 2.3 2.3 2.4
3.31.39.24.3sexat dna seef elcihev rotoMTaxes on insurance 1.2 1.0 1.0 1.0Sales of goods and services 7.5 7.3 7.4 8.6
7.43.31.51.2sexat emocni dna sdnediviDInterest income 1.2 1.6 1.9 1.2Other revenue 5.4 4.7 4.8 3.7Total 100.0 100.0 100.0 100.0
PDF Created with deskPDF PDF Writer - Trial :: http://www.docudesk.com

56 SpecialCapitalInvestmentFunds
TheInfrastructure Tasmania Fund (ITF)wascreatedin2007-08toprovidesignificantinvestmentinTasmania’smajorinfrastructureincludingroads,healthinfrastructureandinformationtechnology.TheITFwasestablishedwiththeproceedsof$312.900mfromthesalesof HobartInternationalAirportPtyLtdandPrintingAuthorityofTasmania.
ExpenditurefromtheITFfor2009-10was$23.168mandcomprised:
• HealthInfrastructure,$4.640m,
• HealthInformationTechnology,$5.841m,
• BrightonTransportHub,$9.500m,
• NorthWestTouristRoute,$1.711m.
The Housing Fund (HF)was established in2007-08with initial fundingof $60.000m to assistwithincreasingthesupplyofpublichousing.ExpenditurefromtheHousingFundfor2009-10was$8.992m.
TheHospitals Capital Fund (HCF)wasestablishedin2007-08withinitialfundingof$75.000mtoprovidecapacitytoinvestintheState’smajorhospitalfacilitiesatHobart,LauncestonandBurnie.
ExpenditurefromtheHCFfor2009-10was$9.629m,andrelatedto:
• RoyalHobartHospital,$5.765m,
• LauncestonGeneralHospitalcarpark,$1.035m,
• NorthWestRegionalHospitalCapitalandEquipmentUpgrade,$1.562m.
TheRoyal Hobart Hospital (RHH)RedevelopmentFundwasestablishedin2004-05todevelopandenhancethefacilitiesattheRHH.Expenditurefromthisfundwas$1.562min2009-10.
TheBetter Roads Fund (BRF)wasestablished in2004-05 for roadprojects includingassociatedmaintenance.ExpenditurefromtheBRFfor2009-10was$1.883m,andrelatedtotheSistersHillprojectmanagedbyDepartmentofInfrastructure,EnergyandResources.
TheUrban Renewal and Heritage Fund (URHF)wasestablishedin2007-08withinitialfundingof$25.000mfromtheITFtoprovidefortherestorationofheritageassetsandtherenewalofurbanareasincommunitiesthroughoutTasmania.
ExpenditurefromtheURHFfor2009-10was$10.337mandcomprised:
• DepartmentofEconomicDevelopment,TourismandtheArts,$1.000m,relatingtoMerseyBluffPrecinctproject,$0.900m,relatingtotheChannelHeritageMuseum,$0.450m,relatingtotheLauncestonCityCouncil-NorthernRegionalTennisCentreand$0.450mrelatingtotheQueenVictoriaMuseumandArtGallery
• Department of Infrastructure, Energy and Resources, $0.549m, relating to OatlandsUnderground Powerlines Project, $0.216m, Stanley Underground Powerlines Project,$0.174mandTasmanBridgecycleandpedestrianfacilities,$0.085m,
• DepartmentofJustice,$0.448m,relatingtoFranklinWharfDevelopment
• Department of Primary Industries, Parks, Water and Environment, $3.313m, relating toLegerwood Memorial and Recreational Park, $0.060m, Mt Lyell General office EssentialMaintenance, $0.050m, Oatlands Gaol restoration, $0.500m, Scottsdale Walking TrailExtension, $0.255m, Swansea Great Short Walk extension, $0.090m, Swansea HeritageMuseumRedevelopment,$0.250m,andStanleyTownHallrestoration,$0.410m,
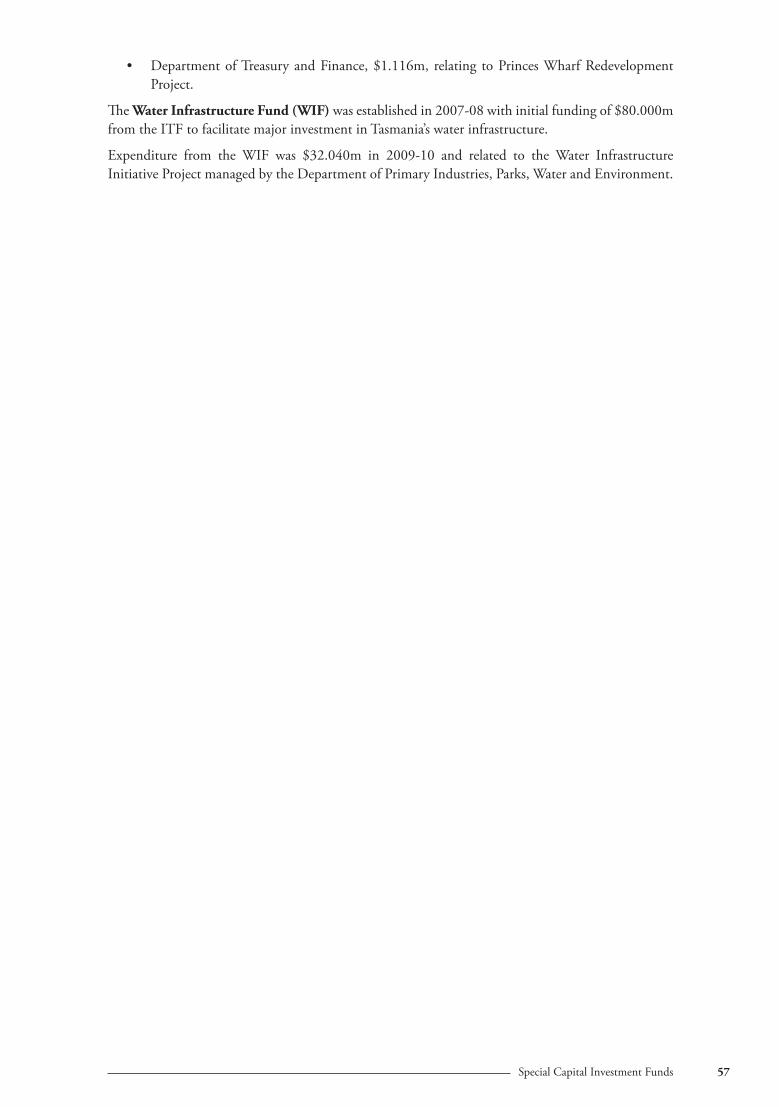
57SpecialCapitalInvestmentFunds
• DepartmentofTreasuryandFinance,$1.116m, relating toPrincesWharfRedevelopmentProject.
TheWater Infrastructure Fund (WIF)wasestablishedin2007-08withinitialfundingof$80.000mfromtheITFtofacilitatemajorinvestmentinTasmania’swaterinfrastructure.
Expenditure from the WIF was $32.040m in 2009-10 and related to the Water InfrastructureInitiativeProjectmanagedbytheDepartmentofPrimaryIndustries,Parks,WaterandEnvironment.
58
page deliberately left blank

59Appendix1–GuidetoUsingThisReport
APPENDIX 1 –GUIDE TO USING THIS REPORT
ThisReportispreparedundersection29oftheAuditAct2008(theAuditAct),whichrequirestheAuditor-General,onorbefore31Decemberineachyear,toreporttoParliamentinwritingontheauditofStateentitiesandauditedsubsidiariesofStateentitiesinrespectoftheprecedingfinancialyear.Theissueofmorethanonereportnowsatisfiesthisrequirementeachyear.
Duringthe2010calendaryeartworeportsweretabled:
• ReportNo.1of2010tabledon10June2010–thisreportdealtwithJune2009financialstatement audits incomplete at the time of tabling the November 2009 report and thosefinancialstatementauditswith31December2009balancedates
• ReportNo.2of2010tabledon16and18November2010–whichisthisReport.Itdealswiththoseauditsoffinancialstatementsofentitieswitha30June2010financialyear-endcompleted on 31 October 2010 with the exception of local government authorities. Theoutcomesfromauditsoflocalgovernmentauthoritiestogetherwiththoseauditscompletedafterthisdatewillbereportedinthefirsthalfof2011.
ReportNo.2of2010comprisesthreevolumes:
• Volume 1 – Analysis of the General Government Sector Financial Statements, the PublicAccountStatementsandtheTotalStateSectorFinancialStatements
• Volume 2 – Executive and Legislature, Government Departments and other GeneralGovernmentSectorStateentities
• Volume 3 – Government Business Enterprises, State Owned Corporations, and localgovernmentownedWaterCorporationsandSuperannuationFunds.
Whererelevant,Stateentitiesareprovidedwiththeopportunitytocommentonanyofthemattersreported.Wheretheychoosetodoso,responsesaredetailedwithinthatparticularsection.
FORMAT OF THE FINANCIAL ANALYSIS
Eachentity’sfinancialperformanceisanalysedbydiscussingtheComprehensiveIncomeStatement,Statement of Financial Position and Statement of Cash Flows supplemented by financial analysisapplying the indicators documented in the Financial Performance sections of this Report. Thelayoutofsomeoftheseprimarystatementshasbeenamendedfromtheauditedstatementsto,whereappropriate:
• makethestatementsmorerelevanttothenatureoftheentity’sbusiness
• highlighttheentity’sworkingcapital,whichisausefulmeasureofliquidity
Departmentsarerequiredtopresentbudgetamountsonthefaceoftheirprimarystatements.AsaconsequencedetailsandcommentaryinrelationtotheseamountshavebeenincludedinthisReport.

60 Appendix1–GuidetoUsingThisReport
FINANCIAL ANALYSIS
Thefollowingtablesillustratethemethodsofcalculating:
• performance indicators used in the individual financial analysis sections of this Report,togetherwithanumberofbenchmarksusedtomeasurefinancialperformance
Financial Performance Indicator
Benchmark1 Method of Calculation
EarningsBeforeInterestandTax(EBIT)($’000s)
ResultfromOrdinaryActivitiesbeforeTaxandbeforeGrossInterestExpense
EBITDA($’000s) ResultfromOrdinaryActivitiesbeforeTax,beforeGrossInterestExpense,DepreciationandAmortisation
Operatingmargin >1.0 OperatingRevenuedividedbyOperatingExpenses
Ownsourcerevenue TotalRevenuelessTotalGrantRevenue,ContributedAssetsandAssetRevaluationAdjustments
Resultfromoperations($’000s)
OperatingRevenuelessOperatingExpenses
Returnonassets EBITdividedbyAverageTotalAssets
Returnonequity ResultfromOrdinaryActivitiesafterTaxationdividedbyAverageTotalEquity
Returnoninvestments 5.5% NetInvestmentincomedividedbyAverageInvestments
Selffinancingratio NetOperatingCashFlowsdividedbyOperatingRevenue
Underlyingresultratio OperatingNetSurplusdividedbyOperatingRevenue
Financial ManagementCapitalexpenditure/depreciation(investmentratio)
>100% PaymentsforProperty,plantandequipmentdividedbyDepreciationexpenses
Capitalexpenditureonexistingassets/depreciation(renewalratio)
100% PaymentsforProperty,plantandequipmentonexistingassetsdividedbyDepreciationexpenses
Costofdebt 6.9% GrossInterestExpensedividedbyAverageBorrowings(includefinanceleases)
Creditorturnover 30days Payablesdividedbycreditpurchasesmultipliedby365

61Appendix1–GuidetoUsingThisReport
Financial Performance Indicator
Benchmark1 Method of Calculation
Currentratio >1 CurrentAssetsdividedbyCurrentLiabilities
Debtcollection 30days ReceivablesdividedbybillableRevenuemultipliedby365
Debtserviceratio BorrowingcostsplusRepaidborrowingsdividedbyOperatingrevenue
Debttoequity DebtdividedbyTotalEquityDebttototalassets DebtdividedbyTotalAssetsIndebtednessRatio NonCurrentLiabilities
dividedbyOwnSourceRevenue
Interestcover–EBIT >2 EBITdividedbyGrossInterestExpense
Interestcover–FundsfromOperations
>2 CashfromOperationsplusGrossInterestExpensedividedbyGrossInterestExpense
Leverageratio TotalAssetsdividebyShareholders’Equity
Returns to GovernmentDividendspaidorpayable($’000s)
Dividendspaidorpayablethatrelatetotheyearsubjecttoanalysis
Dividendpayoutratio 50% DividenddividedbyResultfromOrdinaryActivitiesafterTax
Dividendtoequityratio DividendpaidorpayabledividedbyAverageTotalEquity
Effectivetaxrate 30% IncomeTaxpaidorpayabledividedbyResultformOrdinaryActivitiesbeforeTax
Incometaxpaidorpayable($’000s)
IncomeTaxpaidorpayablethatrelatestotheyearsubjecttoanalysis
TotalreturntotheState($’000s)
DividendsplusIncomeTaxandLoanGuaranteefees
Totalreturntoequityratio TotalReturndividedbyAverageEquity
Other InformationAveragestaffcosts(2)($’000s) Totalemployeeexpenses
(includingcapitalisedemployeecosts)dividedbyStaffNumbers
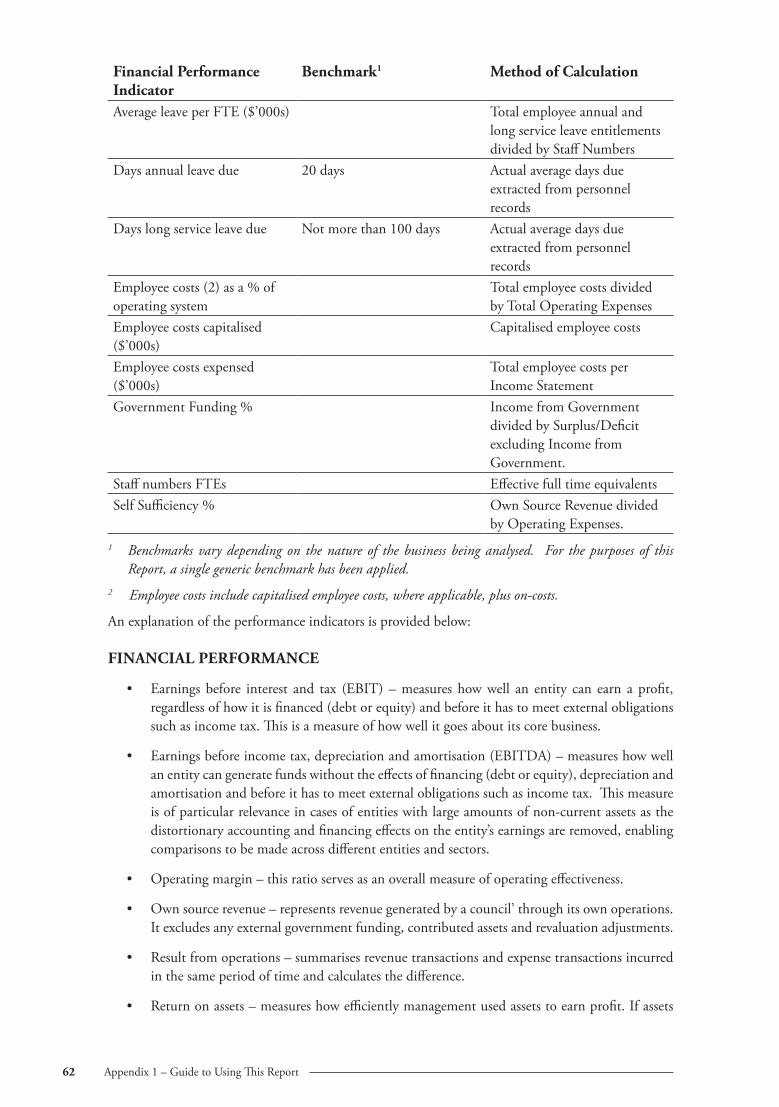
62 Appendix1–GuidetoUsingThisReport
Financial Performance Indicator
Benchmark1 Method of Calculation
AverageleaveperFTE($’000s) TotalemployeeannualandlongserviceleaveentitlementsdividedbyStaffNumbers
Daysannualleavedue 20days Actualaveragedaysdueextractedfrompersonnelrecords
Dayslongserviceleavedue Notmorethan100days Actualaveragedaysdueextractedfrompersonnelrecords
Employeecosts(2)asa%ofoperatingsystem
TotalemployeecostsdividedbyTotalOperatingExpenses
Employeecostscapitalised($’000s)
Capitalisedemployeecosts
Employeecostsexpensed($’000s)
TotalemployeecostsperIncomeStatement
GovernmentFunding% IncomefromGovernmentdividedbySurplus/DeficitexcludingIncomefromGovernment.
StaffnumbersFTEs EffectivefulltimeequivalentsSelfSufficiency% OwnSourceRevenuedivided
byOperatingExpenses.1 Benchmarks vary depending on the nature of the business being analysed. For the purposes of this
Report, a single generic benchmark has been applied. 2 Employee costs include capitalised employee costs, where applicable, plus on-costs.
Anexplanationoftheperformanceindicatorsisprovidedbelow:
FINANCIAL PERFORMANCE
• Earningsbefore interest and tax (EBIT)–measureshowwell an entity can earn aprofit,regardlessofhowitisfinanced(debtorequity)andbeforeithastomeetexternalobligationssuchasincometax.Thisisameasureofhowwellitgoesaboutitscorebusiness.
• Earningsbeforeincometax,depreciationandamortisation(EBITDA)–measureshowwellanentitycangeneratefundswithouttheeffectsoffinancing(debtorequity),depreciationandamortisationandbeforeithastomeetexternalobligationssuchasincometax.Thismeasureisofparticularrelevanceincasesofentitieswithlargeamountsofnon-currentassetsasthedistortionaryaccountingandfinancingeffectsontheentity’searningsareremoved,enablingcomparisonstobemadeacrossdifferententitiesandsectors.
• Operatingmargin–thisratioservesasanoverallmeasureofoperatingeffectiveness.
• Ownsourcerevenue–representsrevenuegeneratedbyacouncil’throughitsownoperations.Itexcludesanyexternalgovernmentfunding,contributedassetsandrevaluationadjustments.
• Resultfromoperations–summarisesrevenuetransactionsandexpensetransactionsincurredinthesameperiodoftimeandcalculatesthedifference.
• Returnonassets–measureshowefficientlymanagementusedassetstoearnprofit.Ifassets

63Appendix1–GuidetoUsingThisReport
areusedefficiently,theyearnprofitfortheentity.Thehardertheassetsworkatgeneratingrevenues,andthusprofit,thebetterthepotentialreturnfortheowners.
• Returnonequity–measures the return theentityhasmade for the shareholderson theirinvestment.
• Returnoninvestments–measureshoweffectivemanagementhavebeeninearninginterestincomefromavailableinvestmentassets.
• Selffinancingratio–thisisameasureofcouncil’sabilitytofundthereplacementofassetsfromcashgeneratedfromoperations.
• Underlyingresultsratio-thisratioprovidesameasureofthestrengthoftheoperatingresult.Thehighertheratio,thestrongertheresult.Negativeresultsindicateanoperatingdeficitthatcannotbesustainedinthelongerterm.
FINANCIAL MANAGEMENT
• Capital expenditure/depreciation (investment ratio) – indicates whether the entity ismaintaining its physical capital by reinvesting in or renewing non-current assets (cautionshouldbeexercisedwheninterpretingthisratioforentitieswithsignificantassetbalancesatcostasthelevelofdepreciationmaybeinsufficient).
• Capital expenditureonexisting assets/depreciation (renewal ratio)– indicateswhether theentityismaintainingitsphysicalcapitalbyreinvestinginorrenewingexistingnon-currentassets (caution should be exercised when interpreting this ratio as the amount of capitalexpenditureonexistingassetshas largelybeenprovidedbytherespectivecouncilsandnotsubjecttoaudit).
• Costofdebt–reflectstheaverageinterestrateapplicabletodebt.
• Creditorsturnover–indicateshowextensivelytheentityutilisescreditextendedbysuppliers.
• Currentratio–currentassetsshouldexceedcurrentliabilitiesbya‘considerable’margin.Itisameasureofliquiditythatshowsanentity’sabilitytopayitsshorttermdebts.
• Debtcollection–indicateshoweffectivelytheentityusesdebtcollectionpracticestoensuretimelyreceiptofmoniesowedbyitscustomers.
• Debtserviceratio–indicatesthecapacityoftheentitytoservicedebtbyrepayingprincipalaswellasinterestonborrowings.
• Debttoequity–anindicatoroftheriskoftheentity’scapitalstructureintermsoftheamountsourcedfromborrowingsandtheamountfromGovernment.
• Debt to total assets – an indicator of the proportion of assets that are financed throughborrowings.
• Indebtednessratio–complimentstheliquidityratioandillustratesacouncil’sabilitytomeetlongertermcommitments.
• Interestcover–EBIT–anindicatoroftheabilitytomeetperiodicinterestpaymentsfromcurrentprofit(beforeinterestexpense).Thelevelofinterestcovergivesaguideofhowmuchroomthereisforinterestpaymentstobemaintainedinthefaceofinterestrateincreasesorreducedprofitability.
• Interestcover–Fundsfromoperations–examinestheexposureorriskinrelationtodebt,an indicatorof theability tomeetperiodic interestpayments fromfunds fromoperations(beforeinterestexpense).Thelevelofinterestcovergivesaguideofhowmuchroomthereis
64 Appendix1–GuidetoUsingThisReport
forinterestpaymentstobemaintainedinthefaceofinterestrateincreasesorreducedfundsfromoperations.
• Leverageratio–measurestheproportionofequityfundingintheassetbase.
RETURN TO GOVERNMENT
• Dividends paid or payable – payment by the entity to its shareholders (whether paid ordeclaredasapayable).
• Dividendpayoutratio–theamountofdividendsrelativetotheentity’snetincome.
• Dividendtoequity–therelativesizeanentity’sdividendpaymentstoshareholders’equity.Alowdividendtoequityratiomayindicatethatprofitsarebeingretainedbytheentitytofundcapitalexpenditure.
• Effectivetaxrate–istheactualrateoftaxpaidonprofits.
• Incometaxpaidorpayable–taxpayments(paidorpayable)bytheentitytotheState.
• TotalreturntotheState–isthefundspaidtotheOwnersconsistingofincometax,dividendsandguaranteefees.
• Total return to equity ratio – measures the Government’s return on its investment in theentity.
OTHER INFORMATION
• Averagestaffcosts–measurestheaveragecostofemployingstaffintheentityfortheyear.
• AverageleavebalanceperFTE($’000s)–indicatestheextentofunusedleaveatbalancedate.
• Daysannualleavedue–recordstheaveragenumberofdaysannualleaveaccumulatedperstaffmember.Ingeneralpublicserviceemployeesaccrue20daysannualleaveperannum.
• Dayslongserviceleavedue–recordstheaveragenumberofdayslongserviceleaveaccumulatedperstaffmember.Ingeneralpublicservantscannotaccruemorethan100daysannualleave.
• Employee costs as a percentage of operating expenses indicates the relative significance ofemployeecostscomparedtootheroperatingexpenses.
• Employee costs capitalised ($’000s)– represents employee costs thathavebeencapitalisedratherthanexpensed.
• Employee costs expensed ($’000s) – represents the level of employee costs expensed, ie.includedintheIncomeStatement.ThistogetherwiththeEmployeecostsCapitalisedwillprovideatotalemployeecostfigureforuseinotherrelatedratios.
• Governmentfundingpercentage–indicatesthelevelofrelianceongovernmentfunding.
• StaffnumbersFTEs–asat theendof thereportingperiodthenumberofstaffemployedexpressedasfull-timeequivalents(FTEs).
• Selfsufficiencypercentage–showsthelevelofindependentfundingthattheentitygeneratedforuseinachievementofitsobjectives.
The above indicators are used because they are commonly applied to the evaluation of financialperformance.Care shouldbe taken in interpreting thesemeasures, as bydefinition they are onlyindicators,andtheyshouldnotbereadinisolation.

65Appendix2–AcronymsandAbbreviations
APPENDIX 2 – ACRONYMS AND ABBREVIATIONS
AAS AustralianAccountingStandard
AASB AustralianAccountingStandardsBoard
ABS AustralianBureauofStatistics
AGAAP AustralianGenerallyAcceptedAccountingPrinciples
BRF BetterRoadsFund
CIP CapitalInvestmentProgram
ESIF EconomicandSocialInfrastructureFund
FMAA FinancialManagementandAuditAct1990
FTE Full-timeequivalent
GBE GovernmentBusinessEnterprise
GDP GrossDomesticProduct
GFS GovernmentFinanceStatistics
GG GeneralGovernment
GGS GeneralGovernmentSector
GPOC GovernmentPricesOversightCommission
GSP GrossStateProduct
GST GoodsandServicesTax
HCF HospitalsCapitalFund
HF HousingFund
HIAPL HobartInternationalAirportPtyLtd
ITF InfrastructureTasmaniaFund
MAIB MotorAccidentsInsuranceBoard
NEM NationalElectricityMarket
PA PublicAccount
PFC PublicFinancialCorporation
PNFC PublicNon-FinancialCorporation
RHH RoyalHobartHospital
RWSC RiversandWaterSupplyCommission
SCIF SpecialCapitalInvestmentFunds
SDTF SpecialDepositsandTrustFund
SOC StateOwnedCompany
TAFR TreasurersAnnualFinancialReport
TASCORP TasmanianPublicFinanceCorporation
Tasrail TasmanianRailwayPtyLtd
UPF UniformPresentationFramework
URHF UrbanRenewalandHeritageFund
WIF WaterInfrastructureFunda
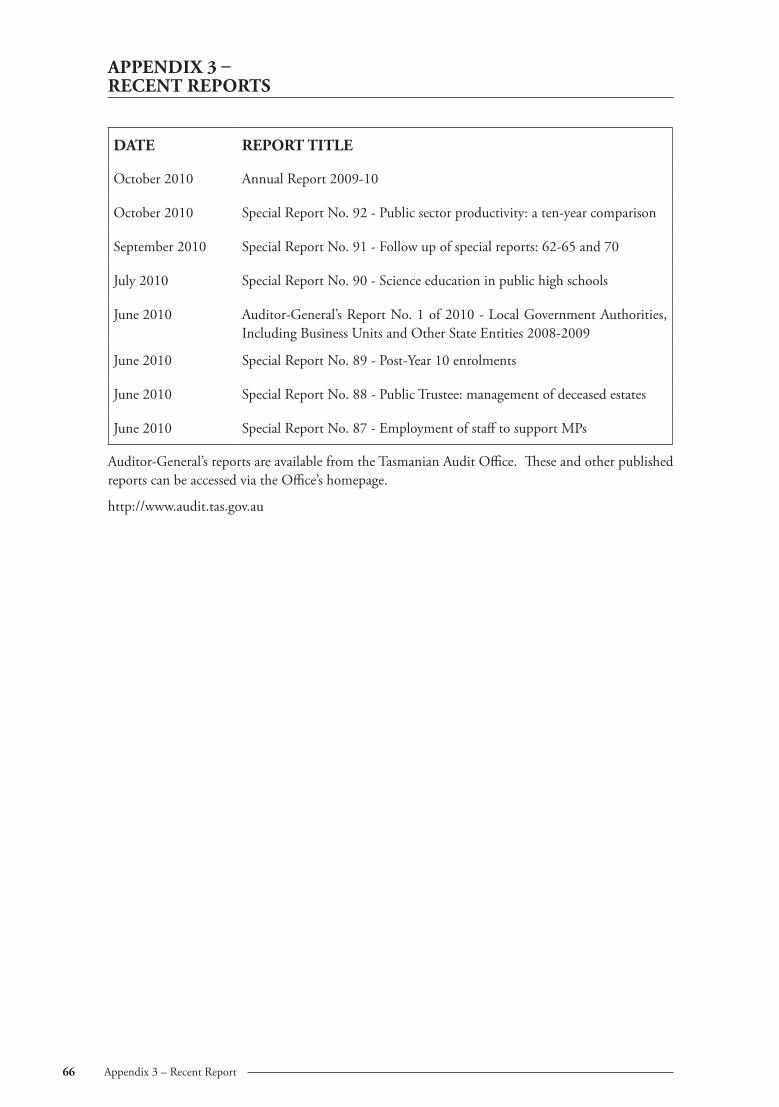
66 Appendix3–RecentReport
APPENDIX 3 – RECENT REPORTS
DATE REPORT TITLE
October2010 AnnualReport2009-10
October2010 SpecialReportNo.92-Publicsectorproductivity:aten-yearcomparison
September2010 SpecialReportNo.91-Followupofspecialreports:62-65and70
July2010 SpecialReportNo.90-Scienceeducationinpublichighschools
June2010 Auditor-General’sReportNo.1of2010-LocalGovernmentAuthorities,IncludingBusinessUnitsandOtherStateEntities2008-2009
June2010 SpecialReportNo.89-Post-Year10enrolments
June2010 SpecialReportNo.88-PublicTrustee:managementofdeceasedestates
June2010 SpecialReportNo.87-EmploymentofstafftosupportMPs
Auditor-General’sreportsareavailablefromtheTasmanianAuditOffice.TheseandotherpublishedreportscanbeaccessedviatheOffice’shomepage.
http://www.audit.tas.gov.au

67Index
INDEX
A
ACRONYMSANDABBREVIATIONS,65
AUDITSDISPENSEDWITH,8
C
CONTROLLEDSUBSIDIARIES,8
D
DRAINAGETRUSTS,9
E
EXECUTIVESUMMARY,6
F
FOREWORD,5
G
GENERALGOVERNMENTSECTOR,6,11
GENERALGOVERNMENTSECTORFINANCIALSTATEMENTSANDPUBLICACCOUNTSTATEMENTS,11
GUIDETOUSINGTHISREPORT,59
P
PUBLICACCOUNTSTATEMENTS,6,12,32
R
RECENTREPORTS,66
REGISTRATIONBOARDS,9
S
SPECIALCAPITALINVESTMENTFUNDS,55
T
TOTALSTATESECTORFINANCIALSTATEMENTS,6,35
68 VisionandPurpose
Our Vision
STRIVE|LEAD|EXCEL|TOMAKEADIFFERENCE
Our Purpose
ToprovideindependentassurancetotheParliamentandCommunityontheperformanceandaccountabilityoftheTasmanianPublicsector
Availability of reports
Auditor-General’sreportsareavailablefromtheTasmanianAuditOffice,HOBART.ThisreportandotherrecentreportspublishedbytheOfficecanbeaccessedviatheOffice’shomepage.Forfurtherinformationpleasecontact:
TasmanianAuditOfficeGPOBox851HobartTASMANIA7001
Phone:(03)62260100Fax:(03)62260199Email: [email protected] Page:http://www.audit.tas.gov.au
This report is printed on recycled paper.
FRONT AND BACK COVER PICTURES BY RICARDA JUNKER
© Crown in Right of the State of Tasmania November 2010
Our Vision
STRIVE | LEAD | EXCEL | TO MAKE A DIFFERENCE
Our Purpose
To provide independent assurance to the Parliament and Community on the performance and accountability of the Tasmanian Public sector
Availability of reports
Auditor-General’s reports are available from the Tasmanian Audit Office, HOBART. This report and other recent reports published by the Office can be accessed via the Office’s home page. For further information please contact:
Tasmanian Audit Office GPO Box 851 Hobart TASMANIA 7001
Phone: (03) 6226 0100, Fax (03) 6226 0199 Email: [email protected] Home Page: http://www.audit.tas.gov.au
This report is printed on recycled paper.
Cover picture: Launceston City Council by Rebecca Clarke back cover picture: burnie City Council
© Crown in Right of the State of Tasmania May 2009
246 Visions & Values
AUDIT MANDATE AND STANDARDS APPLIED
MANDATE
Section 17(1) of the Audit Act 2008 states that “… An accountable authority other than the Auditor-General, as soon as possible and within 45 days after the end of each financial year, is to prepare and forward to the Auditor-General a copy of the financial statements for that financial year which are complete in all material respects. …”
Under the provisions of section 18, the Auditor-General:
“...(1) is to audit the financial statements and any other information submitted by a State entity or an audited subsidiary of a State entity under section 17(1).”
Under the provisions of section 19, the Auditor-General:
“...(1) is to prepare and sign an opinion on an audit carried out under section 18(1) in accordance with requirements determined by the Australian Auditing and Assurance Standards.
(2) is to provide the opinion prepared and signed under subsection (1), and any formal communication of audit findings that is required to be prepared in accordance with the Australian Auditing and Assurance Standards, to the State entity’s appropriate Minister and provide a copy to the relevant accountable
authority.”
STANDARDS APPLIED
Section 31 specifies that:
“… The Auditor-General is to perform the audits required by this or any other Act in such a manner as the Auditor-General thinks fit having regard to –
(a) the character and effectiveness of the internal control and internal audit of the relevant State entity or audited subsidiary of a State entity; and
(b) the Australian Auditing and Assurance Standards. …”
The auditing standards referred to are Australian Auditing Standards as issued by the Australian Auditing and Assurance Standards Board.
ThE RoLE of ThE AUDIToR-GENERAL
The roles and responsibilities of the Auditor-General, and therefore of the Tasmanian Audit Office, are set out in the Audit Act 2008 (the Act).
Our primary responsibility is to conduct financial or ‘attest’ audits of the annual financial reports of State entities. As defined by the Act, State entity includes all public sector entities and those established under the Local Government Act 1993. Specifically, the definition covers an agency, council, Government Business Enterprise, State-owned Company, State Authority, Corporations established by the Water and Sewerage Corporations Act 2008 and the governing body of any corporation, body of persons or institution that are appointed by a Minister or by the Governor.
We also audit those elements of the Treasurer’s Annual Financial Report which report on financial transactions in the Public Account, the General Government financial report and the Whole of Government financial report.
Audits of financial reports are designed to add credibility to assertions made by accountable authorities in preparing financial reports, enhancing their value to end users. Also, the existence of such audits provides a constant stimulus to State entities to ensure sound financial management.
In the main accountable authorities prepare financial reports consistent with Accounting Standards and other mandatory financial reporting requirements in Australia. On occasion reports are “special purpose financial reports” such as the Public Account Statements. In all cases our audits are conducted in accordance with Australian Auditing Standards.
Following a financial audit, we issue a variety of reports to State entities and Responsible Ministers, and we report periodically to the Parliament. In combination these reports give opinions on the truth and fairness of financial reports, and comment on compliance with certain laws, regulations and Government directives. They may comment on financial prudence, probity and waste, and recommend operational improvements.
We also conduct performance audits, compliance audits and carry out investigations. Performance audits examine whether a State entity is carrying out its activities effectively and doing so economically and efficiently and in compliance with relevant laws. Audits may cover all or part of a State entity’s operations, or consider particular issues across a number of State entities.
Compliance audits are aimed at ensuring compliance with directives, regulations and appropriate internal control procedures. Audits focus on selected systems (including information technology systems), legislation, account balances or projects.
Investigations can relate only to public money or to public property.
Performance and compliance audits and investigations are reported separately and at different times of the year, whereas outcomes from financial statement audits are included in one of the regular volumes of the Auditor-General’s reports to the Parliament normally tabled in May and November each year. In doing so the Auditor-General is providing information to the Parliament to assist both the Legislative Council and the House of Assembly in their review of the performance of Executive Government.
Where relevant, the Treasurer, a Minister or Ministers, other interested parties and accountable authorities are provided with opportunity to comment on any matters reported. Where they choose to do so, their responses, or summaries thereof, are detailed within the reports.
Phone (03) 6226 0100Fax (03) 6226 0199email [email protected] www.audit.tas.gov.au
Address Level 4, Executive Building, 15 Murray Street, HobartPostal Address GPO Box 851, Hobart 7001Office Hours 9am to 5pm Monday to Friday
Strive, lead, excel To Make a Difference
Report of the Auditor-General
Volume 1 - Analysis of Treasurer’s Annual Financial Report 2009-10
Report of the Auditor-General Volum
e 1 - Analysis of Treasurer’s Annual Financial Report 2009-10


