HALDEMAN, MICHAEL EDWARD, D.M.A. Stroke Velocity in Two-Mallet Marimba Performance. (2008) Directed by Cort A. McClaren. 66 pp. The purpose of this study was to measure and report stroke velocity in two- mallet marimba performance using a tri-axial accelerometer module and LabView 5.1 data collection and display software. A review of keyboard percussion instrument pedagogy materials and a review of previous research completed in this area of study revealed a lack of information dealing with the ability to quantify stroke velocity executed by a percussionist when playing keyboard percussion instruments. Pedagogical materials addressing keyboard percussion instruments were reviewed and three previous scholarly studies aided in the design of this study. Using a tri-axial accelerometer, a low velocity and high velocity piston stroke were measured, as well as three variations of a piston stroke as outlined by Leigh Howard Stevens in his book Method of Movement for Marimba. Stroke velocity in selected two-mallet marimba excerpts were also measured. Data was organized by specified stroke motions and excerpts. Line graphs were used to indicate stroke velocity values calculated using a mathematical formula that converted the x, y, and z axes of acceleration values into one composite stroke velocity measurement.
Transcript
HALDEMAN, MICHAEL EDWARD, D.M.A. Stroke Velocity in Two-Mallet Marimba Performance. (2008)Directed by Cort A. McClaren. 66 pp.
The purpose of this study was to measure and report stroke velocity in two-
mallet marimba performance using a tri-axial accelerometer module and LabView 5.1
data collection and display software. A review of keyboard percussion instrument
pedagogy materials and a review of previous research completed in this area of study
revealed a lack of information dealing with the ability to quantify stroke velocity
executed by a percussionist when playing keyboard percussion instruments.
Pedagogical materials addressing keyboard percussion instruments were
reviewed and three previous scholarly studies aided in the design of this study. Using a
tri-axial accelerometer, a low velocity and high velocity piston stroke were measured, as
well as three variations of a piston stroke as outlined by Leigh Howard Stevens in his
book Method of Movement for Marimba. Stroke velocity in selected two-mallet marimba
excerpts were also measured.
Data was organized by specified stroke motions and excerpts. Line graphs were
used to indicate stroke velocity values calculated using a mathematical formula that
converted the x, y, and z axes of acceleration values into one composite stroke velocity
measurement.
The conclusion of this study indicates that stroke velocity can be quantified
adhering to the outlined methods found in this research design. Further studies are
needed to determine any relationship between stroke velocity and sound quality.
STROKE VELOCITY IN TWO-MALLET
MARIMBA PERFORMANCE
by
Michael Edward Haldeman
A Dissertation Submitted tothe Faculty of the Graduate School at
The University of North Carolina at Greensboroin Partial Fulfillment
of the Requirements for the DegreeDoctor of Musical Arts
Committee Members _________________________________________
Dr. Dennis Askew
_________________________________________
Dr. Scott Rawls
_________________________________________
Dr. Welborn Young
__________________________________Date of Acceptance by Committee
__________________________________Date of Final Oral Examination
iv
ACKNOWLEDGMENTS
I would like to extend my deepest gratitude to my committee chair, Dr. Cort
McClaren. Over the five years that I have been his student, he has cultivated my ability
to be an influential teacher, a better performer, a deep thinker, and most importantly a
better person. His knowledge, intellect, and ability to inspire is infectious.
A sincere thanks to my committee members, Dr. Dennis Askew, Dr. Scott Rawls,
and Dr. Welborn Young. Their guidance and knowledge has influenced me both within
my research and outside of higher academia. I aspire to be as influential to my students
as they were to me.
An enormous amount of gratitude to Dr. Randy Schmitz for his help with
“crunching” the data. Without his help this study would not have been possible.
Additional thanks to Christina Palermo for her aid in collecting data during this study,
and thanks to Jessica Bays for her help in proofreading and grammatically aiding in the
completion of this document.
Thank you to my family and friends for their love, support, and encouragement.
Thank you to my parents, John and Lois Haldeman, for their unwavering support
throughout my educational aspirations and career goals. They taught me to function
with a strong work ethic, to believe in myself, and to know when to take a break along
the way. Thank you to my brother Matthew, who always said just the right words to
v
put things into perspective when my focus was a bit off. Thank you to my
grandparents, Alyou and Mae Bredbenner, and William and Mary Haldeman. They are
a constant reminder to me that knowledge is learned through books, but wisdom is
learned through experience. I miss you Pop-pop B.
vi
TABLE OF CONTENTS
Page
..........................................................................................................................LIST OF TABLES viii
..........................................................................................................................LIST OF FIGURES ix
CHAPTER
I. ......................................................................................................... INTRODUCTION 1
................................................................... II. REVIEW OF PREIOUS RESEARCH 12
.................................................................................. III. OUTINE OF PROCEDURES 17
................................................................................................................ Equipment 17............................................................................................ Set-up of Equipment 18
....................................................................................................... Data Collection 19
................................ IV. TREAMENT AND REPORT OF COLLECTED DATA 22
........................................................................ The Low Velocity Piston Stroke 24....................................................................... The High Velocity Piston Stroke 25
........................................................................................ The Preparation Stroke 26...................................................................................... The Resurrection Stroke 27
............................................................................................ The Academic Stroke 29 Keyboard Audition Etude #2 .................................................................. Excerpt 31 Concerto No.1 for Marimba: Gate to Heaven ........................................Excerpt 33
................................................. V. INTERPRETATION OF COLLECTED DATA 37
........................................................................ The Low Velocity Piston Stroke 39....................................................................... The High Velocity Piston Stroke 41
........................................................................................ The Preparation Stroke 42...................................................................................... The Resurrection Stroke 43
............................................................................................ The Academic Stroke 44
vii
Right Hand Velocity Magnitude Measurements for Keyboard Audition Book Etude #2........................................................................................................ 47 Left Hand Velocity Magnitude Measurements for Keyboard Audition Book Etude #2........................................................................................................ 50 Right Hand Velocity Magnitude Measurements for Concerto No.1 for Marimba: Gate to Heaven..................................................................................... 53 Left Hand Velocity Magnitude Measurements for Concerto No.1 for Marimba: Gate to Heaven..................................................................................... 56
....... VI. LIMITATIONS AND IMPLICATIONS FOR FUTURE RESEARCH 60
.............................................................................................................. Limitations 60....................................................................... Implications for Future Research 62
Figure 12. Concerto No.1 for Marimba: Gate to Heaven, ............................... meas. 289 – 295 21
............................Figure 13. Velocity Magnitude Values of a Low Velocity Piston Stroke 24
...........................Figure 14. Velocity Magnitude Values of a High Velocity Piston Stroke 25
............................................Figure 15. Velocity Magnitude Values of a Preparation Stroke 27
..........................................Figure 16. Velocity Magnitude Values of a Resurrection Stroke 28
.............................................Figure 17. Velocity Magnitude Values of an Academic Stroke 30
x
Figure 18. Right Hand Velocity Magnitude Values of Keyboard Audition Etude #2 ..........................................................................................................................Excerpt 32
Figure 19. Left Hand Velocity Magnitude Values of Keyboard Audition Etude #2 ..........................................................................................................................Excerpt 32
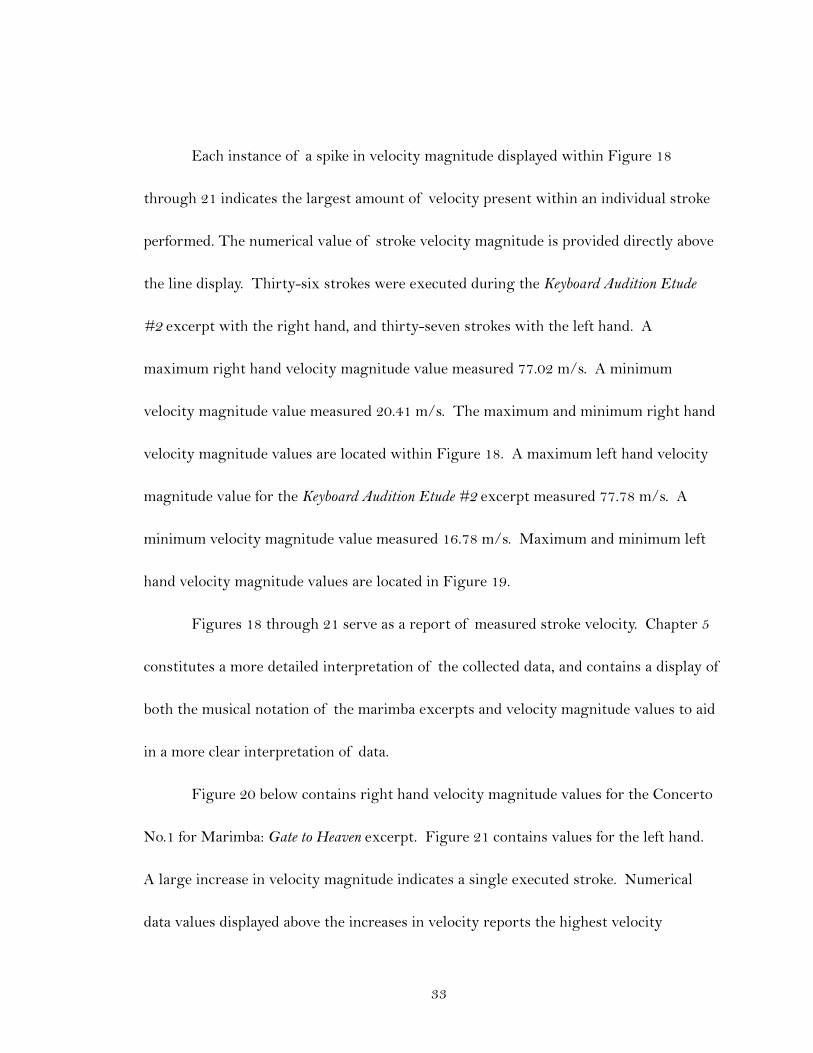
Figure 20. Right Hand Velocity Magnitude Values of Concerto No.1 for Marimba: Gate to Heaven Excerpt.............................................................................................. 35
Figure 21. Left Hand Velocity Magnitude Values of Concerto No.1 for Marimba: Gate to Heaven ..............................................................................................Excerpt 35
.................................................................................Figure 22. Pitch and Octave Identification 46
Figure 23. Right Hand Velocity Magnitude Values of Keyboard Audition Etude #2 ...............................................................................Excerpt with Musical Notation 48
Figure 24. Left Hand Velocity Magnitude Values of Keyboard Audition Etude #2 ...............................................................................Excerpt with Musical Notation 51
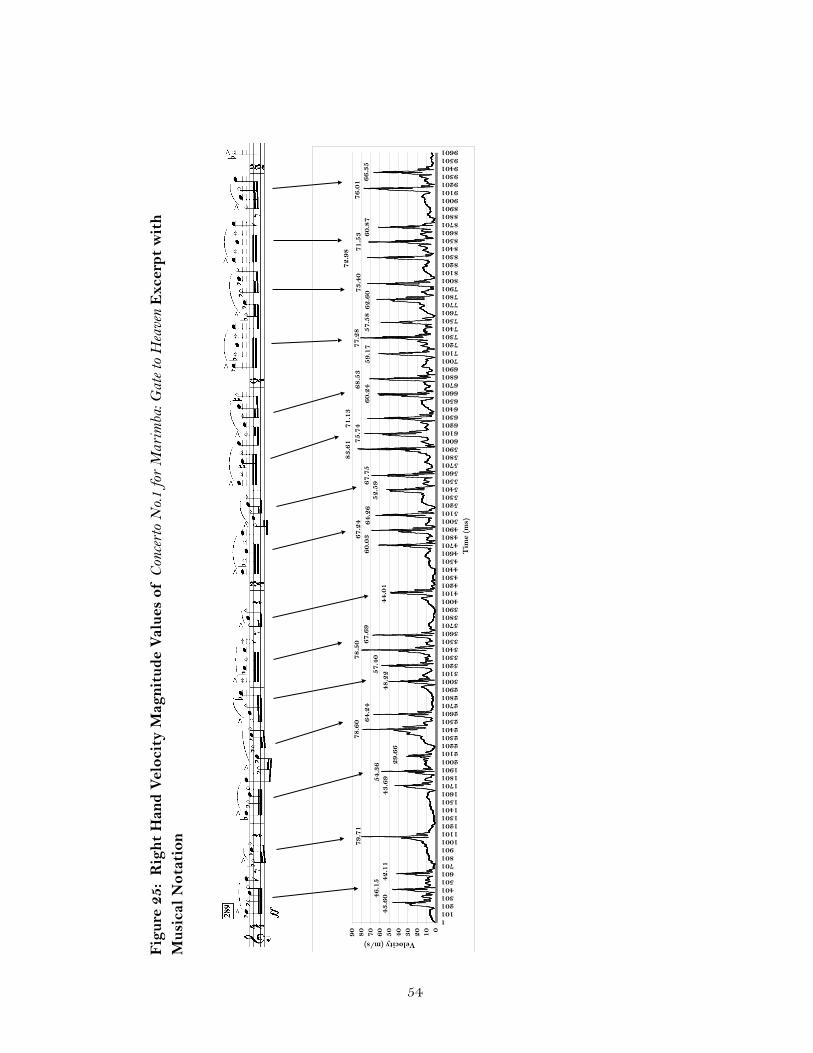
Figure 25. Right Hand Velocity Magnitude Values of Concerto No.1 for Marimba: Gate to Heaven ................................................... Excerpt with Musical Notation 54
Figure 26. Left Hand Velocity Magnitude Values of Concerto No.1 for Marimba: Gate to Heaven ................................................... Excerpt with Musical Notation 57
1
CHAPTER I
INTRODUCTION
Percussionists produce sound by striking an object and causing it to vibrate.
The object used by a percussionist comes in many forms such as a drumhead, marimba
bar, vibraphone bar, suspended cymbal, or timpani head. The specific physical
movement of a percussionist’s lower body, upper body, arms, wrists, and hands
determine the type of sound produced. An understanding of these physical movements
will ultimately enable a percussionist to produce multiple timbres and control sound
quality while performing.
One of the most widely accepted factors that affect timbre and sound quality is
striking motion. Cort McClaren, in his book The Book of Percussion Pedagogy: A Step-
By-Step Approach for Teachers and Performers, defines striking motion as the method of
“hitting” an instrument.1 The manner in which a percussionist strikes an instrument
determines the quality of sound produced.2 He further states that piston motion is
recommended for all percussion performance. Piston motion will provide the most
1 Cort McClaren, The Book of Percussion Pedagogy: A Step-By-Step Approach for Teachers and Performers, 2nd ed. (Greensboro: C. Alan Publications, 2006), 1.
2 Ibid., 6.
2
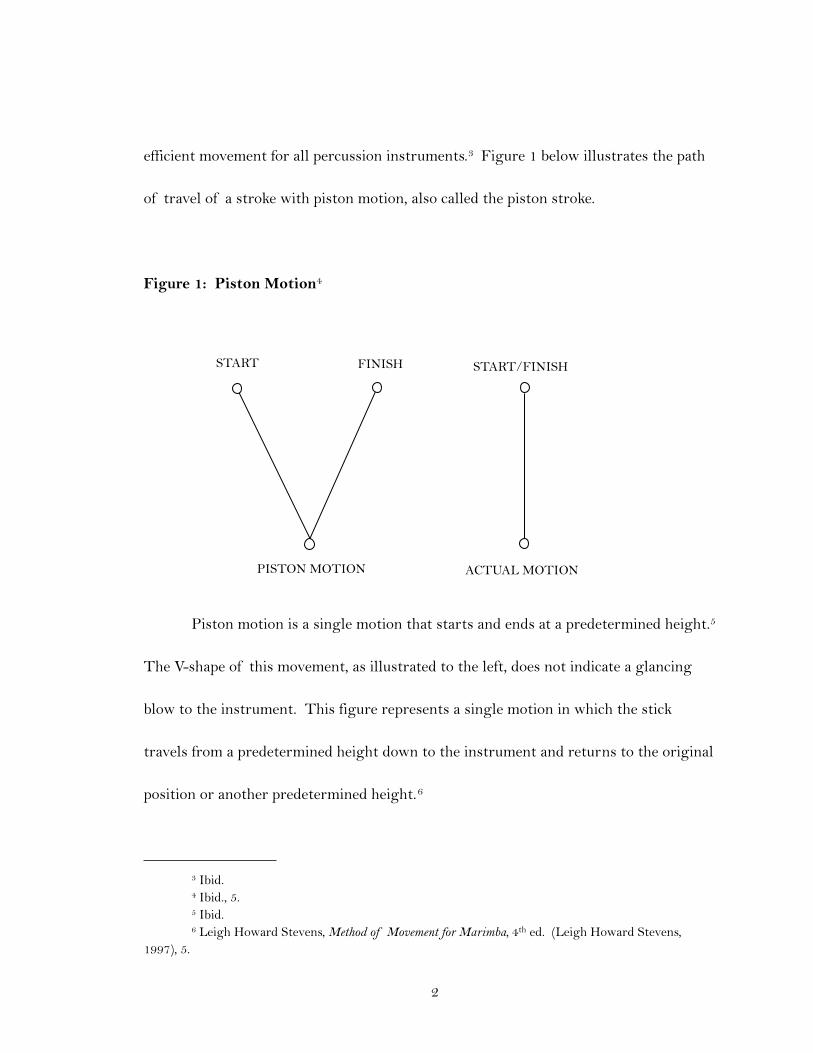
efficient movement for all percussion instruments.3 Figure 1 below illustrates the path
of travel of a stroke with piston motion, also called the piston stroke.
Figure 1: Piston Motion4
Piston motion is a single motion that starts and ends at a predetermined height.5
The V-shape of this movement, as illustrated to the left, does not indicate a glancing
blow to the instrument. This figure represents a single motion in which the stick
travels from a predetermined height down to the instrument and returns to the original
position or another predetermined height.6
3 Ibid.4 Ibid., 5.5 Ibid.6 Leigh Howard Stevens, Method of Movement for Marimba, 4th ed. (Leigh Howard Stevens,
1997), 5.
START FINISH
PISTON MOTION
START/FINISH
ACTUAL MOTION
3
The information involving piston motion is intended to provide a general
knowledge of one widely accepted method of striking percussion instruments. In this
study, piston motion was applied and manipulated during data collection. Subsequent
reference to piston motion or the piston stroke is assumed to apply to a marimba unless
otherwise specified.
In his book, Method of Movement for Marimba, Leigh Howard Stevens states that,
“although variation in terminology exists, the two most often recommended stroking
methods are: (1) the stroke with preparation (up – down), and (2) the stroke with lift
(down – up)”.7 He further recommends the use of piston or cyclic motion while playing
the marimba.8
There is nothing new or unusual about the piston stroke. Even players who advocate the use of preparation or lift routinely use a piston style stroke when playing fast passages. (There is no time between rapid stroke repetitions for preparation or lift.) Rather than have a “slow tempo stroke” and a “fast tempo stroke”, this author strongly recommends that the marimbist use the same piston stroking method in practice and slow tempi as in performance and fast tempi.9
In his publication, Stevens further advocates the use of piston motion even in an
instance where a small preparatory stroke is used. In addition, he states that
7 Ibid., 16.8 Ibid.9 Ibid.
4
consecutively executed strokes at moderate to fast tempi result in multiple instances of
piston strokes due to the inherent need for stroke efficiency.10
Chapter IX of Part 1 in Stevens’ book addresses the path of travel of the piston
stroke with several commonly misused variations. In Figures 2, 3, and 4 below, a series
of strokes and variations are illustrated. A solid line represents the actual stroke, dotted
lines represent recovery of a stroke, and dashed lines represent preparation before the
stroke.
Figure 2: Stroke with Preparation11
10 Ibid.11 Ibid.
Preparation
StrokeRecovery
5
Figure 3: Stroke with Lift12
Figure 4: Stroke with Preparation and Lift13
According to Stevens, the stroke with preparation, the stroke with lift, and the
stroke with preparation and lift contain motion that is unnecessary to create sound on
percussion instruments. To further clarify, Stevens extracts one stroke from Figures 2,
3, and 4, assigns labels to these strokes, and identifies the unnecessary motions in
brackets. The individual strokes and assigned labels are illustrated in Figures 5, 6, and
7 below.
12 Ibid.13 Ibid.
Stroke
Preparation
Lift
Recovery
Stroke
Preparation
Lift
Recovery
Recovery
6
Figure 5: The Preparation Stroke14
Figure 6: The Resurrection Stroke15
Figure 7: The Academic Stroke16
14 Ibid.15 Ibid.16 Ibid.
7
All of these stroke variations are important for the reader to understand since
they occur frequently in percussion performance. Frequent use of these variations cause
problems with pitch accuracy, unwanted timbre change, unwanted variation in volume,
or an ensemble rhythmic issue, for instance, multiple players using multiple stroke
variations to play one note at the same time.
While several variations of stroke motion exist, an important constant in
percussion performance is volume. Obtaining the appropriate dynamic level on
percussion instruments is directly related to correct striking motion.17 The terms
volume and dynamic level work interchangeably in music and within this study.
McClaren suggests that dynamics can be achieved through stick height alone. If a loud
dynamic is desired, a high stick height should be used. If a softer dynamic is desired, a
low stick height should be used. Figure 8 below illustrates the use of stick height to
achieve dynamics.
17 McClaren, 7.
8
Figure 8: Formula for Volume18
Loud Volume = High Stick Height
Soft Volume = Low Stick Height
Advance preparation is the careful manipulation of stick or mallet height before a
stroke motion occurs. The ending position for one motion will be the starting position
for the next motion. Proper preparation in advance of a stroke will result in the ability
to play with low stick velocity. Throughout the remainder of this document the speed
at which the stick travels downward is labelled stick velocity or stroke velocity. These
terms are interchangeable. Advance preparation eliminates wasteful motion, and when
executed efficiently, the performer will visually demonstrate the appropriate stick height
18 Ibid.
9
of a dynamic level before the dynamic level is actually performed. Figure 9 below
illustrates a series of quarter notes performed at varying dynamics and the appropriate
beginning stick height for each stroke motion. Note that the stick height illustrated
represents the advance preparation of stick height before the dynamic level is
performed.
Figure 9: Illustration of Advance Preparation
The utilization of the idea of advance preparation in percussion performance
aims to minimize movement and use of energy, thus eliminating wasted motion that
may result in an unnecessary variation of the piston stroke. A variation of the piston
stroke, because of the inherent inclusion of wasteful motion, requires the performer to
move the stick with a quicker motion than if a piston stroke without wasteful motion
were used. A large amount of stroke velocity tends to produce a brittle, pinched sound,
10
and a low amount of stroke velocity tends to produce a resonant, smooth sound. This is
a result of the physical reaction of the object being struck and the amount of stroke
velocity used. Wasted motion present in a stroke correlates in relative fashion to the
amount of velocity present, ultimately affecting the quality of sound produced.
The first portion of data collection in this study strictly focused on the
difference in stroke velocity found in the stroke variations discussed by Stevens.
Although sound quality may be affected by stroke velocity, and the apparent relationship
between stroke velocity and sound quality was one of the catalysts in the design of this
research, the primary focus of this study was to determine whether stroke velocity
could be quantified using the methods outlined in Chapter 3. When determined possible
or impossible using these methods, the relationship of stroke velocity and sound quality
could be further explored in another study.
The second portion of data collection in this study constituted measuring stroke
velocity of two-mallet marimba excerpts, adhering to the methods outlined in Chapter
3. As stated above, although sound quality is an issue that all percussionists manipulate
in a performance setting, the focus of this study was to determine whether the outlined
methods for data collection are accurate and efficient in measuring stroke velocity. It
was the author’s intent to discover whether the relationship of stroke velocity and
sound quality might be explored in future research. Additional possible relationships
11
between varying performance issues and stroke velocity will also be discussed in
Chapter 6.
12
CHAPTER II
REVIEW OF PREVIOUS RESEARCH
A minimal amount of research in the area of stick motion in percussion
performance exists. Even less research is available in the area of stroke velocity in
marimba performance. Through a review of previous research performed in this area of
study, Sofia Dahl is a researcher and drummer whose name appears most frequent. Her
study, The Playing of An Accent: Preliminary Observations from Temporal and Kinematic
Analysis of Percussionists, illustrates the movements and timing of a percussionist’s stick
when playing an interleaved accent by studying three professionals and one amateur.19
Dahl explains that a common way to denote the character of a stroke preceding a
sudden change in dynamic level is to use the terms upstroke and downstroke.20 The use of
the terms upstrokes and downstrokes is synonymous with the term striking motion
used in Chapter 1 of this study. These terms, upstroke and down stroke, describe the
desired final position of the stick in preparation for the next stroke, also termed stick
height and advance preparation in chapter 1 of this study. Finally, Dahl explains that
the upstroke and the down stroke, along with a soft stroke called a tap, are commonly
19 Dahl, Sofia (2000). The Playing of An Accent: Preliminary Observations from Temporal and Kinematic Analysis of Percussionists. Journal of New Music Research, 29, 225.
20 Ibid., 226.
13
executed by percussionists to help plan and carry out the correct movements for a
successful performance. This is described as advanced preparation in Chapter 1.
Dahl’s inclusion of these stroke motions, although slightly different in
terminology as compared to those discussed in Chapter 1, intend to highlight the
importance of striking motion, stick height, and advanced preparation in percussion
performance. In her study, Dahl used time lapse photography to track the path of a
drumstick set in motion by a percussionist playing sequential hits on a drum, with an
accent on every fourth hit. Dahl’s study and discussion of stroke motion, in addition to
the lack of information found on stroke velocity in a review of previous research,
directly influenced the development and methodology of this project.
A second study that influenced the design of this project was Diana Young’s and
Ichiro Fujinaga’s research titled, AoBachi: A New Interface for Japanese Drumming.21
Young and Fujinaga embedded electronics in traditional Japanese drumsticks called
AoBachi. The electronically embedded AoBachi measured path of travel in the air,
called gesture-tracking, and also stick motion and speed. This data was wirelessly
captured using Bluetooth technology similar to that of a mobile phone or laptop
device.22
21 Young, D., Fujinaga, I. AoBachi: A New Interface for Japanese Drumming. Proceedings of the 2004 Conference on New Interfaces for Musical Expression (NIME04), 2.
22 Ibid.
14
Young and Fujinaga designed the AoBachi interface to preserve natural feel and
weight. The AoBachi, measuring approximately 20 inches long and 1.5 inches in
diameter, were hollowed at one end in order to create an enclosure for the necessary
electronics.23 To encourage the traditional techniques of Japanese drumming, the
AoBachi were designed to be lightweight, small, and wireless. Due to the size of these
sticks, the gesture sensing system had to also be minimal in size. Young and Fujinaga
equipped the AoBachi with technology that could measure 2 axes of angular velocity
and acceleration, but did not measure the twisting motion of the stick about its own
axis since such a motion is less important to taiko technique..24 Throughout the study
two players used two sticks each, totaling four sticks measured to capture data.25
The prototypes in the Young and Fujinaga study included 4 sensors per stick
that measured five independent degrees of freedom, 2 two-axis accelerometers capable
of measuring a full-scale range with a variation of +/– 2G, and two single-axis Murata
Gyrostar gyroscopes to reflect the angular velocity of the sticks.26
Young and Fujinaga’s study was a pilot experiment to measure the success of
the AoBachi prototype, and lacked prescribed research design methods. Their study
influenced the design of the current project in exploring the possibility of measuring
23 Ibid.24 Ibid.25 Ibid.26 Ibid.
15
stroke velocity for performance on the marimba. Young and Fujinaga’s treatment of
data and collection methods were helpful and additionally influenced the current study.
Finally, a study in the area of sports medicine titled Kinematic Quantitation of the
Patellar Tendon Reflex using a Tri-axial Accelerometer influenced the design of the current
study.27 In this research project, the angular speed of the knee joint is calculated from
the acceleration data generated in response to the tapping force applied to the patellar
tendon, or knee cap, with a customized tendon hammer, and was measured using a tri-
axial accelerometer placed at the ankle joint.28 The data was collected using a signal
analyzer and a personal computer.
In the Mamizuka, et al. study, each participant sat upright in a customized seat,
and the right ankle joint was fitted with a short leg brace. The motions of the trunk
and extremities were not restrained so that the participant’s motion could be naturally
elicited by muscle contraction. A tri-axial accelerometer was fixed to the brace, and the
patellar tendon was manually tapped with a hammer fitted with a force sensor to
measure the force impact on the kneecap. Data was then collected from both the
accelerometer and the hammer.29
27 Mamizuka, N., Sakane, M., Kaneoka, K., Hori, N., & Ochiai, N. (2007) Kinematic Quantitation of the Patellar Tendon Reflex Using a Tri-axial Accelerometer. Journal of Biomechanics, 40, Issue 9, 2107.
28 Ibid.29 Ibid., 2108.
16
Participants remained fully relaxed during the procedures. During one
procedure, the tendon was tapped a total of 25 times with random forces ranging from
10N (Neutons) to 80N. The reflex response, which lasted for a maximum of 5 seconds,
was not inhibited and was allowed to stop naturally.30
The research design of Mamizuka, et al. influenced the current research project.
The seated position of the participant correlates with the comfortable, natural standing
position of the marimbist in this study. The use and placement of an accelerometer in
the patellar tendon reflex study is similar to the current study, except that the
accelerometer was placed on the top of the hand rather than the ankle. In addition,
acceleration data is displayed along three axes of movement and then combined into one
composite measurement of stroke velocity.
30 Ibid.
17
CHAPTER III
OUTLINE OF PROCEDURES
The purpose of this study was to determine if stroke velocity used in two-mallet
marimba performance can be quantified. Although a correlation between the piston
stroke, a variation of the piston stroke, and the resulting stroke velocity has been
discussed, no attempt was made to determine the exact relationship between stroke
velocity and sound quality. The purpose of this study was to determine whether stroke
velocity can be measured using the research design discussed in this chapter.
Equipment
The equipment used to measure stroke velocity is included in List 1 below.
List 1: Equipment and Materials Used in Study
1. 5-octave Yamaha marimba (YM-5100A)2. 1 pair of Marimba One brand Katarzyna Mycka model (KMB2) marimba
mallets3. 1 copy of The Book of Percussion Audition Music for the 21st Century written by
Dr. Cort McClaren and Dr. Nathan Daughtrey31
31 Cort McClaren and Nathan Daughtrey, The Book of Percussion Audition Music for the 21st Century (North Carolina: C. Alan Publications, 2006)
18
4. 1 copy of Concerto No.1 for Marimba: Gate to Heaven by David R. Gillingham32
5. 1 tri-axial accelerometer module6. 1 MacBook laptop equipped with iMovie software7. 1 personal computer equipped with LabView 5.1 software8. 1 roll of adhesive medical gauze/tape
Set-up of Equipment
Once the marimba placement was determined, the personal computer and
subsequent accelerometer interface equipment was placed approximately ten feet behind
the performer. The MacBook laptop was placed at the front of the marimba to digitally
video record the data collection process.
The tri-axial accelerometer was first attached to the top of the performer’s right
hand using adhesive medical gauze and tape in a manner to avoid constricting the
performer’s ability to execute proper striking motion. Location of the accelerometer on
top of the performer’s hand and the distance from the accelerometer to the head of the
mallet was measured to ensure accuracy of data collection from excerpt to excerpt.
Equipment was removed and repositioned for performance of multiple excerpts. Cables
connecting the accelerometer to the personal computer were run along the side of the
performer’s forearm and secured using medical gauze and tape. Once the equipment
32 Gillingham, David R., Concerto No.1 for Marimba: Gate to Heaven (North Carolina: C. Alan Publications, 1998)
19
was properly secured, the performer’s fulcrum, point of hand contact on the marimba
mallet, was marked on the mallet shaft to ensure data accuracy throughout the data
collection.
Figure 10: Performer’s Hand and Placement of Accelerometer
Data Collection
First, a low velocity piston stroke executed with the performer’s right hand was
measured. Second, a high velocity piston stroke was measured using the same method.
20
Third, the three variations of a piston stroke, outlined in Chapter 1, were
measured; the preparation stroke, the resurrection stroke, and the academic stroke
respectively. All three of these strokes were measured only with the right hand, and
every attempt to accurately demonstrate these stroke variations was made.
Fourth, data was collected for the right hand and the left respectively for the last
eight measures from the Keyboard Audition Etude #2 from the publication, The Book of
Percussion Audition Music for the 21st Century of McClaren and Daughtrey. Figure 11
During the performance of the Gate to Heaven excerpt, thirty-four strokes were
executed with the right hand, and thirty-six strokes were executed in the left hand. A
maximum right hand velocity magnitude value measured 83.61 m/s. A minimum
velocity magnitude value measured 29.66 m/s. These values are located in Figure 20.
A maximum left hand velocity magnitude value measured 88.77 m/s, and a minimum
velocity magnitude value measured 27.00 m/s. These velocity magnitude values are
both located in Figure 21 above. A detailed interpretation and display of both the
musical notation and the velocity magnitude values of the Gate to Heaven excerpt appear
in Chapter 5.
37
CHAPTER V
INTERPRETATION OF COLLECTED DATA
The purpose of this study was to determine if stroke velocity used in two-mallet
marimba performance could be quantified. Although a correlation between the piston
stroke, variations of the piston stroke, and the resulting stroke velocity has been
discussed, no attempt in this study was made to determine the exact relationship
between stroke velocity and sound quality. The design of this study was intended to
determine whether stroke velocity could be measured using the procedures discussed in
Chapter 3.
In this chapter, data interpretation occurs in the same order that it was collected.
Relationships between the low velocity and high velocity piston stroke, the preparation
stroke, the resurrection stroke, and the academic stroke appear. Second, relationships
between stroke path of travel, and the concept of conservation of energy and advance
preparation are made. Third, an evaluation and interpretation of the data collected
during the performance of two marimba excerpts appear. A discussion about selected
musical gestures and figures found within these excerpts, and a correlation between
these figures and the velocity magnitude values present appear in this chapter. An
attempt to correlate the ideal of sound quality and stroke velocity is not made.
38
To aid in the interpretation of the collected data values, Table 1 below provides
velocity magnitude values beginning at 0 m/s and ending at 100 m/s, increasing at
increments of 5 m/s in column 1, and the corresponding value converted from meters
per second to miles per hour in column 2. This conversion was done using the formula
velocity * 2.24 = speed. (meters per second * 2.24 = miles per hour) This conversion is
supplied to aid in the reader’s understanding of velocity as a unit of measurement, as it
is not commonly used in a field of study other than physics. The use of a unit of
measurement such as miles per hour is used quite often, and may aid the reader in
understanding the collected data. The application of a unit of measurement such as
miles per hour is intended to aid in the reader’s interpretation of data, and is not used
for any other purpose. Data values converted to miles per hour are found in parenthesis
directly after the corresponding velocity magnitude value originally displayed in a unit
of measurement of meters per second.
39
Table 1: Conversion of Velocity Values (m/s) to Speed (mph)
0 m/s 0 mph5 m/s 11.2 mph10 m/s 22.4 mph15 m/s 33.6 mph20 m/s 44.8 mph25 m/s 56 mph30 m/s 67.2 mph35 m/s 78.4 mph40 m/s 89.6 mph45 m/s 100.8 mph50 m/s 112 mph55 m/s 123.2 mph60 m/s 134.4 mph65 m/s 145.6 mph70 m/s 156.8 mph75 m/s 168 mph80 m/s 179.2 mph85 m/s 190.4 mph90 m/s 201.6 mph95 m/s 212.8 mph100 m/s 224 mph
The Low Velocity Piston Stroke
The low velocity piston stroke, figure 13 found in chapter 4, contained a
maximum velocity magnitude value of 35.99 m/s (80.42 mph). All subsequent data
values were rounded to the one hundredth place value. The low velocity piston stroke
was performed at an approximate stick height of twelve inches above the marimba bar.
40
Stroke motion was executed in a relaxed manner and contained only a minimal amount
of stroke velocity. The low velocity piston stroke took approximately three thousandth
of one second to execute, and measured along the x-axis from approximately 800 ms
(milliseconds) to 1100 ms. Low lying data values occurring between x-value 1 ms to
799 ms, and 1101 ms to 2001 ms are a result of unintentional minute movement of the
mallet before and after the stroke, and a low level occurrence of frequency fluctuation
common with the type of equipment used in this study. To enable a centered
illustration of the low velocity piston stroke within Figure 13, these data values are
displayed.
The numerically displayed data value present in Figure 13 of 17.37 m/s (38.91
mph) measured during the downward portion of the low velocity piston stroke, and
12.88 m/s (28.67 mph) during the recovery of the low velocity piston stroke, is likely a
result of a small fluctuation within the fluid movement of the respective parts of the
low velocity piston stroke, and was not an intentional variation within the stroke
motion. In addition, the small and sudden change in velocity magnitude present during
the recovery may be a result of a slight flex in the mallet shaft and within the
performer’s hand as the recovery of the mallet stopped and returned to the original
stick height found at the beginning of the low velocity piston stroke.
41
The High Velocity Piston Stroke
Within Figure 14 found in Chapter 4, data measured during the execution of a
high velocity piston stroke is located. A maximum velocity magnitude value of 61.16
m/s (137.00 mph) was measured. The high velocity piston stroke contained a 25.17 m/s
(56.38 mph) increase in maximum stroke velocity compared to the low velocity piston
stroke. The high velocity piston stroke occurred between approximately 450 ms and
825 ms, almost identical to the duration of time the low velocity piston stroke was
executed. Low lying data values before and after the stroke were most likely a result of
minute and unintentional movement occurring before and after the stroke, and are also
present in Figure 14 for the display of the stroke within the figure.
The numerically displayed values found before and after the maximum velocity
value is likely a result of a slight and unintentional variation within the smooth path of
travel towards the marimba bar and back to the original stick height. The stick height
used for the execution of the high velocity piston stroke was approximately twelve
inches. The slight fluctuations noted are significantly increased in comparison to the
low velocity piston stroke, and are likely a result of the release of a greater amount of
potential energy initial present before execution of the stroke.
42
The Preparation Stroke
The preparation stroke, Figure 15 found in Chapter 4, displays a different path of
travel as compared to the low velocity piston stroke and the high velocity piston stroke.
The preparation stroke contained an initial velocity magnitude value of 14.86 m/s
(33.29 mph), and was most likely the preparation segment of this particular piston
stroke variation. A similar velocity magnitude occurs a second time before the stroke
itself, possibly constituting the variance of velocity during the change in direction of
the stroke from a resting position upwards, and then back down towards the beginning
stick height established before motion occurred.
During the preparation stroke, a maximum velocity magnitude value measured
63.60 m/s (142.46 mph). Although a high measurement of velocity in comparison to
the low velocity piston stroke, this value does not necessarily represent the inability for
this stroke to contain low velocity, as the execution of a single stroke can theoretically
contain a large variance in velocity magnitude. Of importance is the path of travel of
the preparation stroke, and the significant affect this path of travel made during the
attempted steady increase and decrease of velocity magnitude during the stroke and
recovery portions respectively. In addition, while a relatively moderate amount of
velocity is present, the length of time for the preparation stroke to occur was longer
than both the low velocity piston stroke and the high velocity piston stroke. The
43
preparation stroke occurred between the x-axis values of approximately 410 ms and
1025 ms. Approximate elapsed time of the preparation stroke was 615 ms, or .615
seconds. The elapsed time of the preparation stroke was .240 seconds longer than the
high velocity piston stroke, and .315 seconds longer than the low velocity piston stroke.
This may indicate that variations of the piston stroke, when velocity is relatively equal
during successive strokes, result in an elongated elapsed time of execution, and may
result in inconsistent timing when used in an ensemble setting.
The Resurrection Stroke
The resurrection stroke, Figure 16 of Chapter 4, contains a maximum velocity
magnitude value of 45.90 m/s (102.82 mph). In comparison to the low velocity piston
stroke, the high velocity piston stroke, and the preparation stroke, this may be of
minimal significance. A mature percussionist can vary stroke velocity with relative ease
when one stroke is isolated. Of greater importance in Figure 16 is the presence of an
elevated velocity magnitude during the recovery and subsequent preparation occurring
after the stroke. During a large spike in velocity magnitude occurring after the stroke at
an x-value of approximately 1601 ms, a velocity magnitude value of 24.05 m/s
44
(53.87 mph) occurred. This is likely a result of the increase in distance of stroke
recovery compared to the stick height of the down stroke, and the resulting preparation
for another stroke afterwards, inherent of this stroke variation.
The resurrection stroke occurred between x-axis values of approximately 1250
ms and 1875 ms, constituting an elapsed time duration of .625 seconds, and is
approximately the same duration as the preparation stroke. Empirical data suggests
that the preparation stroke and the resurrection stroke, when velocity magnitude values
are similar, yield the same approximate duration of time to execute.
The Academic Stroke
The academic stroke, Figure 17 in Chapter 4, contained a maximum velocity
magnitude value of 57.54 m/s (138.10 mph). Like the resurrection stroke, this
maximum velocity magnitude is not of significant importance in comparison to the low
velocity piston stroke, the high velocity piston stroke, the preparation stroke, and the
academic stroke. This is because the isolation of a single stroke and the ability to vary
the stroke velocity during the execution of such a stroke. Of importance is the
elongated duration of time that the academic stroke was executed. The academic stroke
began at an x-axis value of approximately 225 ms, and ended at 1150 ms. Duration of
45
time for the academic stroke to be executed was longer than the four strokes previously
measured.
The academic stroke took approximately .925 seconds to execute, and included
both a substantial velocity magnitude variation during the preparation and the recovery
segment of the stroke. The fluctuation in velocity magnitude measured at
approximately 15 m/s, and lasted approximately 350 ms during the preparation, and 325
ms during the recovery respectively. A notable amount of low velocity magnitude
values found during the preparation and recovery of the academic stroke are present.
Additional stroke motion may hinder the ability of a performer to achieve sound with
little effort, and supports the notion that advance preparation, and the removal of
wasted stroke motion, enables a percussionist to achieve sound with a stroke using one
motion toward the instrument, and a recovery that returns to the original pre-
determined stick height.
The velocity magnitude values collected during the execution of a low velocity
piston stroke and a high velocity piston stroke, the preparation stroke, the resurrection
stroke, and the academic stroke, although valuable, tend to be arbitrary because of the
nature of the isolation of each stroke, and the absence of a terminal stroke velocity to
play multiple strokes in succession. Data collected while performing these five strokes
are of importance because the preparation stroke, the resurrection stroke, and the
46
academic stroke show an obvious addition of wasted motion in comparison to a stroke
motion that simply contains a stroke and a recovery. This is important to a
percussionist when preparing in advance to play different dynamics, as the addition of
wasteful motion leads to the unintentional execution of varied dynamics, and causes
timing issues in ensemble playing. In addition, for instance, when moving horizontally
from one drum to another during timpani performance, the addition of this wasteful
motion tends to lead to incorrect playing areas or a change in timbre.
Figure 22 below includes pitch and respective octave identification to aid in
interpreting collected data, and allows for a clearer discussion of data while referencing
the appropriate musical notation. This octave identification system is used often in
music theory research and is intended to aid in the reader’s interpretation of specified
data. Octave numbering begins on the pitch C of any given octave, and progresses in
numeric order as pitch increases. Accidental markings, ≤ or ≥ signs do not affect octave
identification.
Figure 22: Pitch and Octave Identification
47
Right Hand Velocity Magnitude Measurements for Keyboard Audition Book Etude #2
Keyboard Audition Etude #2 consisted of 36 strokes executed with the right hand,
and contained an average velocity magnitude of 37.95 m/s (85.00 mph). The velocity
magnitude values, along with the corresponding musical notation for this excerpt are
displayed in Figure 23. The use of solid note heads and hollow note heads were used to
better aid in the reader’s interpretation of the data as well as the use of arrows
directing the reader from the musical notation to the corresponding velocity magnitude
value. In Figure 23, the solid note heads notate the right hand strokes executed in this
excerpt, and the hollow note heads notate the left hand strokes, of which data values
were not measured in this particular portion of the study.
The performance of Gate to Heaven yielded 36 left hand strokes and an average
velocity magnitude value of 57.70 m/s (129.25 mph). The average stroke velocity
measured approximately 4.86 m/s less than the right hand average velocity values
collected. A difference in average velocity magnitude value from one hand to another
may be a result of the performer being right handed and inadvertently favoring the
stronger hand.
At x-value 9701 ms a maximum velocity magnitude value of 88.77 m/s (198.85
mph) appears, and at x-value 2050 ms a minimum velocity magnitude value of 27.00
m/s (60.48 mph) occurs. Similar data discussed for the right hand is evident with the
left hand. During measure 289, the repeated G≤5 contains similar velocity values
respectively, a difference of 3.77 m/s (8.44 mph), whereas the same musical fragment
occurring at the beginning of measure 290 contains a difference in velocity magnitude
of 17.6 m/s (39.42 mph). Although this musical figure is exactly the same and should
theoretically contain similar velocity values, an anticipation of the jump of an octave
down from A≤5 to A≤4 may have affected the amount of velocity used.
Empirical data shows that an overall increase in velocity magnitude occurred
throughout the Gate to Heaven excerpt culminating in the highest velocity magnitude
value found within this study occurring during the last stroke executed. A large
velocity magnitude value found within the last stroke of the Gate to Heaven excerpt may
59
be a result of an inherent increase in musical tension as the pitch and key center
progressively becomes higher, in addition to a cadence point occurring on the downbeat
of measure 295. Data collected during this performance tends to support the idea that
an increased dynamic level, combined with musical phrasing that purposely creates
tension, may result in increased levels of velocity magnitude values.
60
CHAPTER VI
LIMITATIONS AND IMPLICATIONS FOR FUTURE RESEARCH
Limitations
There are notable limitations to the present study. First, although data was
collected in a consistent manner throughout the study, and stroke velocity was measured
accurately given the equipment implemented, the placement of the accelerometer on top
of the performer’s hand measured stroke velocity in close proximity to the wrist, where
stroke motion was initiated, and not at the head of the mallet where the largest amount
of stroke velocity most likely occurred. Positioning the accelerometer on the marimba
mallet head itself would have caused severe damage to the equipment, and likely
rendered it unusable. While an attempt was made to ensure a consistent execution of
grip, hand position, and stroke motion, small unintentional variations may have
occurred. Bluetooth technology, such as that used in Fujinaga’s study, would aid in
eliminating possible damage to the equipment, and enable placement of the
accelerometer inside the mallet head. In addition, using wireless equipment would
enable the performer to execute the marimba excerpts without any physical impediment.
Second, collection of data points every one thousandth of one second diminished
the amount of data able to be collected at one instance. This resulted in the need to
61
select short marimba excerpts to avoid potential loss of data. Access to a more
sophisticated data collection software may enable a larger amount of collectable data to
be captured at one time without diminishing the frequency of data collection per
second. In addition to the short length of time that the software was able to capture
data, the treatment of data, converting acceleration values to velocity magnitude values,
is somewhat laborious. This significantly limits the practical application of data
collection equipment within a pedagogical environment.
Third, the current study was treated as a pilot study, solely designed to answer
the question of whether stroke velocity used in two-mallet marimba performance could
be quantified using the prescribed methodology. The use of stroke velocity during the
execution of a preparation stroke, resurrection stroke, and the academic stroke is
subjective, and the velocity magnitude values measured in comparison to the low
velocity piston stroke and high velocity piston stroke may be unintentionally skewed.
As stated in Chapter 5, stroke velocity, when executed by an experienced performer, is
subject to change. The preparation stroke, the resurrection stroke, and the academic
stroke could have been executed with an extreme minimal amount of stroke velocity, or
an extreme high amount of stroke velocity. The amount of stroke velocity used in this
study was a result of a focused path of travel true to the variations of a correctly
62
executed piston stroke and the use of a stroke velocity most comfortable to the
performer at the time of data collection.
Implications for Future Research
Because of the nature of this study, a multitude of implications for future
research are possible. An obvious follow-up to this study would aim at determining the
relationship between sound quality and stroke velocity. This may be explored using the
same equipment and methodology of this study while including a number of
percussionists performing the same marimba excerpt, and should include access to more
sophisticated data collection equipment A panel of educators and professional
musicians could then determine the quality of sound achieved using a rubric designed
to aid in this process. A panel of educators and professional musicians would best serve
this type of study because of the relative subjectivity of sound quality found in
percussion performance.
In addition to determining a relationship between sound quality and stroke
velocity, an acoustical relationship between stroke velocity and marimba bar resonance
may serve as a useful extension of this study. Using audio recording software to
measure the length of marimba bar resonance when varying degrees of stroke velocity
are executed would determine to what extent stroke velocity affects the timbre achieved
63
by a percussionist. In many instances, an obvious difference in timbre and resonance is
noticeable when an excessive amount of stroke velocity is used during a performance.
The ability to quantify this aural difference would be of significant value to a
percussionist and to percussion instrument manufacturers.
Similar to determining a relationship between acoustics and stroke velocity, the
extent to which a marimba bar bends downward during a stroke in relationship to
stroke velocity could be of particular interest to marimba manufacturers and
percussionists alike. Determining if a relationship exists between the amount of stroke
velocity found within a stroke, and whether or not velocity affects the shape the
marimba bar takes during it being struck by a mallet may determine more specific
causes in timbre change when velocity is altered.
Pedagogically, this study may lead to a design method in aiding beginner
percussionists to learn how to vary the amount of stroke velocity used in percussion
performance, ultimately enabling the student to alter velocity to a greater extent in a
shorter amount of practice time. In many instances, beginner percussionists, if not
taught properly from the onset of private or group lessons, develop a habit of playing
with a large amount of stroke velocity to achieve sound. This significantly hinders a
student’s ability to perform with less exertion of energy, perform with a relaxed
physical approach to the instrument, and to manipulate the sticks or mallets effectively
64
during moderate to advanced level literature performance. With significant changes to
simplify the conversion of data from acceleration values to velocity values, access to
more sophisticated data collection equipment, and the use of real-time data capturing,
the measuring of a student’s stroke velocity used during a performance may provide
instant feedback for the student to better enable he or she to minimize stroke velocity
when necessary or desired.
65
BIBLIOGRAPHY
Aimi, R. “New Expressive Percussion Instruments.” M.S. Thesis, MIT Media Laboratory, 2002.
Bean. “Techno Taiko with a Twist.” Electronic Musician Magazine (February 1998): 124-125.
Braffort, A., Gherbi, R., Gibet, S., Richardson, J., and Teil, D. “Gesture-Based Communication in Human-Computer Interaction.” Proceedings of the International Gesture Workshop, 1999.
Dahl, Sophia. “Measurements of the Motion of the Hand and Drumstick in a Drumming Sequence with Interleaved Accented Strokes – A Pilot Study.” In Report Speech, Music and hearing, Quarterly Progress and Status Report, 4/1997, 1-6. Stockholm: Royal Institute of Technology.
Dahl, Sophia. “Timing in Drumming - Some Preliminary Results.” In Report Speech, Music and Hearing, Quarterly Progress and Status Report, 4/1998, 95-102. Stockholm: Royal Institute of Technology.
Dahl, Sophia. “The Playing of An Accent: Preliminary Observations from Temporal and Kinematic Analysis of Percussionists.” Journal of New Music Research 29 (September 2000): 225-233.
Gillingham, David R. Concerto No.1 for Marimba: Gate to Heaven. Greensboro, NC: C. Alan Publications, 1998
Gottry, Josh. For Four. Greensboro: C. Alan Publications, 2007.
Howarth, Gifford. Simply Four: 4-Mallet Technique as Easy As 1-2-3…4. Portland: Tap Space Publications, 2002.
66
Mamizuka, N., Minami, T., Toi, T., Okubo, N., Sakane, M., Kaneoka, K., Ochiai, N. “Tri-axial Accelerometer and Instrumented Hammer System for Quantification of Stretch Reflex.” In The Japan Society of Mechanical Engineers Dynamics and Design Conference, 2004, 718-1-718-4.
Mamizuka, N., Sakane, M., Kaneoka, K., Hori, N., & Ochiai, N. “Kinematic Quantitation of the Patellar Tendon Reflex Using a Tri-axial Acceleromter.” Journal of Biomechanics 20 (2007): 2107-2111.
McClaren, Cort. The Book of Percussion Pedagogy, A Step-By-Step Approach for Teachers & Performers, 2nd ed. Greensboro: C. Alan Publications, 2006.
Stevens, Leigh Howard. Method of Movement for Marimba, 4th ed. Leigh Howard Stevens, 1997.
Young, Diana and Ichiro Fujinaga. AoBachi: A New Interface for Japanese Drumming. Conference on New Interfaces for Musical Expression, 2004.
Zeltsman, Nancy. Four-Mallet Marimba Playing. Milwaukee: Hal Leonard Corporation, 2003.