Cross-Asset Weekly 01 September 2017 1 | Cross-Asset Weekly Strong macro data is bullish equities and bearish bonds The global economy surprised in the past few months with strong activity numbers that have rarely been so synchronized in this decade. At the same time inflation remains subdued which gives central banks time to only slowly remove policy accommodation, as we discuss in our Macro Outlook section. Bond yields have diverged from economic fundamentals, as we argue in our Fixed In- come and FX Outlook section. Given the strong and broad based economic data, we continue to expect bond yields to rise. On the FX side, we remain positive the Euro and the Swiss Franc until year-end, while being cautious on the British Pound and the Japa- nese Yen. We reaffirm our year-end stock index price targets. We believe economic and monetary conditions are poised to remain favourable for equities into year-end, as we discuss in our Global Equities Outlook section. European equity indices underwent a correction that is now advanced while US equity indices also inspire confidence over the medium term. In our Emerging Markets Outlook section, we analyse potential risk-return profiles, given current market conditions, across the main asset classes. We prefer local cur- rency over hard currency bonds and within hard currency bonds corporates over sover- eigns. Finally, we analyse the economic implication of Hurricane Harvey in our US Macro sec- tion. In the region, the reconstruction and full recovery will take years. Nevertheless, at the national level we expect only a temporary impact on prices and the economy. This week’s highlights Macro Outlook 2 Globally synchronized upswing Fixed Income and FX Outlook 4 Diverging from fundamentals Global Equity Outlook 5 Sticking to our guns and waiting for the uptrend Emerging Markets Outlook 6 We prefer corporate over sovereign debt US Macro 7 Hurricane Harvey strikes Texas Economic Calendar 9 Week of 04/09 – 08/09/2017 Market Performance 10 Global Markets in Local Currencies Contacts Dr. Karsten Junius, CFA Chief Economist [email protected]+41 58 317 32 79 Adolfo Laurenti Global Economist [email protected]+41 58 317 30 86 Ursina Kubli Forex Strategist [email protected]+41 58 317 32 80 Cédric Spahr, CFA Equity Strategist [email protected]+41 58 317 31 28 Dr. Florian Weber, CFA Fixed Income Strategist [email protected]+41 58 317 31 14 Emiliano Surballe, CFA Emerging Market Credit Strategist [email protected]+41 58 317 35 64 Kunal Singh, CFA Emerging Market Credit Strategist [email protected]+41 58 317 31 21 Thilina Hewage, CFA Emerging Market Credit Strategist [email protected]+65 6230 66 61
Transcript
Cross-Asset Weekly 01 September 2017
1 | Cross-Asset Weekly
Strong macro data is bullish equities and bearish bonds
The global economy surprised in the past few months with strong activity numbers thathave rarely been so synchronized in this decade. At the same time inflation remainssubdued which gives central banks time to only slowly remove policy accommodation,as we discuss in our Macro Outlook section. Bond yields have diverged from economic fundamentals, as we argue in our Fixed In-come and FX Outlook section. Given the strong and broad based economic data, wecontinue to expect bond yields to rise. On the FX side, we remain positive the Euro and the Swiss Franc until year-end, while being cautious on the British Pound and the Japa-nese Yen. We reaffirm our year-end stock index price targets. We believe economic and monetaryconditions are poised to remain favourable for equities into year-end, as we discuss in our Global Equities Outlook section. European equity indices underwent a correctionthat is now advanced while US equity indices also inspire confidence over the mediumterm. In our Emerging Markets Outlook section, we analyse potential risk-return profiles, given current market conditions, across the main asset classes. We prefer local cur-rency over hard currency bonds and within hard currency bonds corporates over sover-eigns. Finally, we analyse the economic implication of Hurricane Harvey in our US Macro sec-tion. In the region, the reconstruction and full recovery will take years. Nevertheless, at the national level we expect only a temporary impact on prices and the economy. This week’s highlights
Macro Outlook 2Globally synchronized upswing
Fixed Income and FX Outlook 4Diverging from fundamentals
Global Equity Outlook 5Sticking to our guns and waiting for the uptrend
Emerging Markets Outlook 6We prefer corporate over sovereign debt
US Macro 7Hurricane Harvey strikes Texas
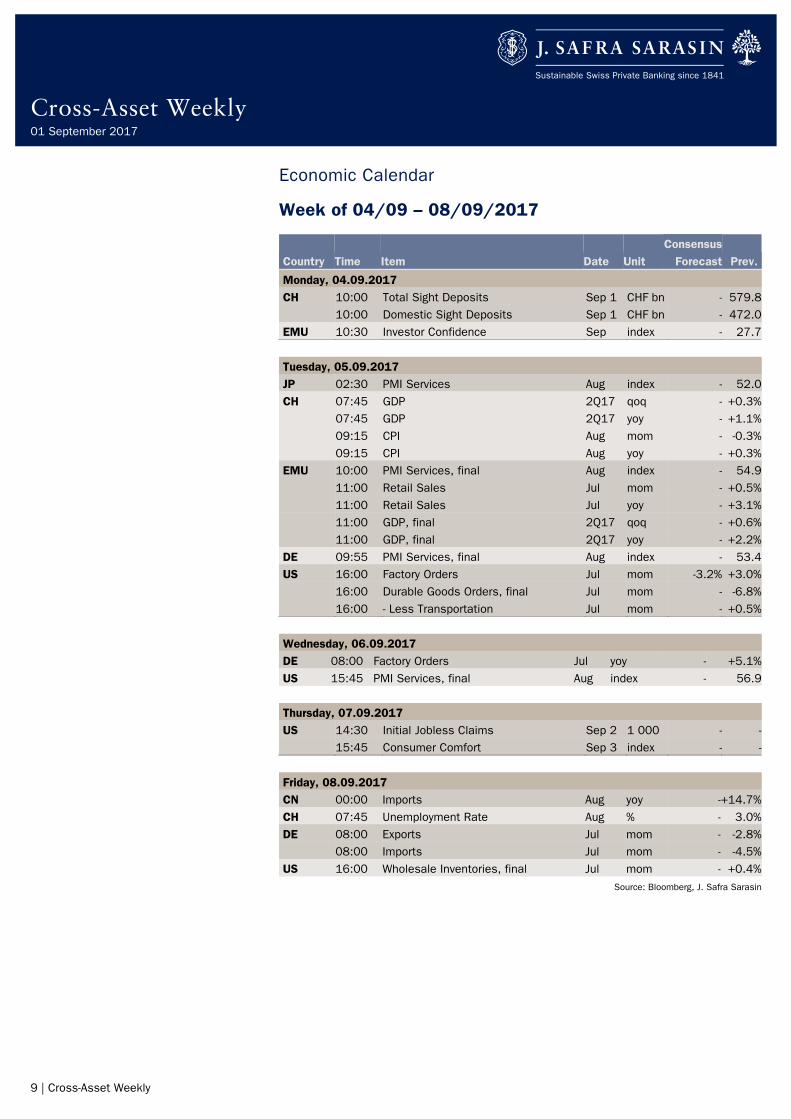
Economic Calendar 9Week of 04/09 – 08/09/2017
Market Performance 10Global Markets in Local Currencies
The global economy surprised in the past few months with strong activity numbers that have rarely been so synchronized in this decade. At the same time inflation remains subdued which gives central banks time to only slowly remove policy ac-commodation: a Goldilocks-scenario. Some of the known short term risks might lead to some volatility in the coming months but won’t change the overall benign environment. Instead, we see productivity growth is not picking up as the most important risk, such that growth rates might fall back to more moderate levels.
The world economy is expanding fast and forward looking indicators for the reminder of the year are very favourable. In the euro area, consumer confidence just climbed to a 10 year high this week, while the unemployment rate fell to the lowest level since 2009. Together with a strong currency and low inflation, this provides the ground for stronger private consumption in the coming quarters. In the US, growth picked-up in the second quarter even without additional infrastructure spending, a tax or health care re-form. Also Emerging Markets are growing strongly – not because of China – but this time independent of China. Inflation rates continue to fall in most Emerging Markets while business sentiment improves. Both lead to inflows into the EM asset class that stabilizes local currencies, which in turn allows central banks to cut policy rates further – a virtuous circle. Our only concern is that valuations of hard currency debt are becom-ing a bit stretched, as we argue in our EM-section. Exhibit 1: Global trade contributes to economic growth again
Source: Datastream, J. Safra Sarasin, 01.09.2017
Inflation rates remain below targets in most major countries – even those where unem-ployment rates are at very low levels like the US or Germany. Central banks are strug-gling with explanations but are unanimous with their conclusion. They are in no rush to tighten monetary policy. As a consequence, we expect one more rate hike of the Fed this year (in December) and an ECB that will wait until its October meeting to announce that it intends to wind down its asset purchases in 1H 2018. The ECB is likely to main-tain its easing bias – indicating that it stands ready to extend the QE programme in size/duration if necessary. The Bank of England (BoE) is facing higher inflation rates due to the depreciating GBP. Institutional uncertainty regarding the Brexit develop-ments and an only moderately expanding economy are in our view enough reasons for the BoE not to hike rates in the foreseeable future.
-5
0
5
10
15
20
48
50
52
54
56
58
2010 2010 2011 2012 2013 2014 2015 2016 2017
Global manufacturing PMI
Container throughput in % yoy (RHS)
Dr. Karsten Junius, CFA Chief Economist [email protected] +41 58 317 32 79
Very strong economic activity in most ma-jor parts of the world
Low inflation rates allow for low policy rates – providing a Goldilocks environment for financial markets
Cross-Asset Weekly 01 September 2017
3 | Cross-Asset Weekly
Exhibit 2: New JSS Macro Forecasts (in % yoy)
Source: J. Safra Sarasin, 31.08.2017
The combination of low policy rates and strong growth couldn’t be better for financial markets. As a result, the volatility of equity and rates markets declined to very low lev-els such that we are concerned that they might be priced for perfection already. Hence, our analytical focus should be on what could go wrong in the future Exhibit 3:Volatility of equity markets and interest rates is extremely low
Source: J. Safra Sarasin, 01.09.2017
We acknowledge certain short term risks that financial markets seem to neglect: Ger-man elections, Italian elections, a hard Brexit, government shutdown in the US, a clash between the Fed and the US government over financial market reform, appointment of a new Fed chairperson, and North Korea. However besides the last point, we do not be-lieve that any of those risks has the potential to change our positive outlook for the world economy in the next two quarters. The one risk that we see, however, for the medium term is that productivity growth is not picking up. In the US, for example, it remained at only 1% per year between 2010 and 2017. This compares to 2.4% for the years 1990-2007. Currently, most countries are able to grow strongly and above long term potential as negative output gaps in-crease the speed limit for economic growth. The US economy is already close to the point of full employment and full capacity utilization. Other countries will follow. As la-bour force growth is limited by demographic change, growth of GDP and personal in-come will depend on the ability to become more productive. Productivity growth, in turn, depends on an open environment where ideas can spread. The more partisan and closed societies become, the more difficult productivity growth becomes. It will there-fore be important to resist protectionism and to secure a safe environment for the mo-bility of labour and capital.
2016 2017 2018US GDP 1.5 2.1 2.3
CPI 1.3 1.9 1.9Euroland GDP 1.7 2.0 1.8
CPI 0.2 1.5 1.2Switzerland GDP 1.3 1.2 1.7
CPI -0.4 0.5 0.7UK GDP 1.8 1.6 1.0
CPI 0.7 2.7 2.6Japan GDP 1.0 1.9 1.4
CPI -0.1 0.3 0.6China GDP 6.7 6.8 6.3
CPI 2.1 1.4 1.9
40bp
50bp
60bp
70bp
80bp
90bp
100bp
110bp
10%
15%
20%
25%
30%
35%
40%
45%
2000 2003 2005 2007 2009 2011 2013 2015 2017
EuroStoxx 50 30-year German Bund (RHS)
Financial markets priced for perfection?
Few (known) major risks that could change our economic scenario for the remainder of 2017
Low productivity growth is the most im-portant risk for financial markets and polit-ical stability
Cross-Asset Weekly 01 September 2017
4 | Cross-Asset Weekly
Fixed Income and FX Outlook
Diverging from fundamentals
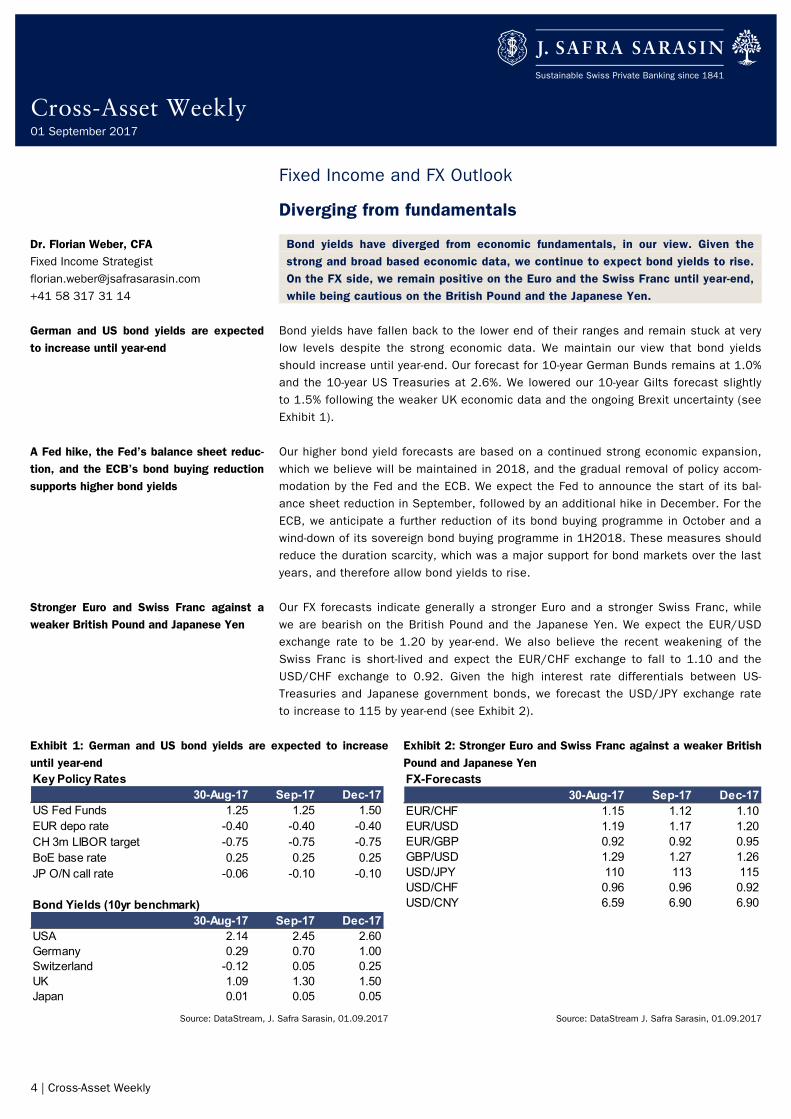
Bond yields have diverged from economic fundamentals, in our view. Given the strong and broad based economic data, we continue to expect bond yields to rise. On the FX side, we remain positive on the Euro and the Swiss Franc until year-end, while being cautious on the British Pound and the Japanese Yen.
Bond yields have fallen back to the lower end of their ranges and remain stuck at very low levels despite the strong economic data. We maintain our view that bond yields should increase until year-end. Our forecast for 10-year German Bunds remains at 1.0% and the 10-year US Treasuries at 2.6%. We lowered our 10-year Gilts forecast slightly to 1.5% following the weaker UK economic data and the ongoing Brexit uncertainty (see Exhibit 1). Our higher bond yield forecasts are based on a continued strong economic expansion, which we believe will be maintained in 2018, and the gradual removal of policy accom-modation by the Fed and the ECB. We expect the Fed to announce the start of its bal-ance sheet reduction in September, followed by an additional hike in December. For the ECB, we anticipate a further reduction of its bond buying programme in October and a wind-down of its sovereign bond buying programme in 1H2018. These measures should reduce the duration scarcity, which was a major support for bond markets over the last years, and therefore allow bond yields to rise. Our FX forecasts indicate generally a stronger Euro and a stronger Swiss Franc, while we are bearish on the British Pound and the Japanese Yen. We expect the EUR/USD exchange rate to be 1.20 by year-end. We also believe the recent weakening of the Swiss Franc is short-lived and expect the EUR/CHF exchange to fall to 1.10 and the USD/CHF exchange to 0.92. Given the high interest rate differentials between US-Treasuries and Japanese government bonds, we forecast the USD/JPY exchange rate to increase to 115 by year-end (see Exhibit 2).
Dr. Florian Weber, CFA Fixed Income Strategist [email protected] +41 58 317 31 14
German and US bond yields are expected to increase until year-end
A Fed hike, the Fed’s balance sheet reduc-tion, and the ECB’s bond buying reduction supports higher bond yields
Stronger Euro and Swiss Franc against a weaker British Pound and Japanese Yen
Exhibit 1: German and US bond yields are expected to increase until year-end
Exhibit 2: Stronger Euro and Swiss Franc against a weaker British Pound and Japanese Yen
Source: DataStream, J. Safra Sarasin, 01.09.2017 Source: DataStream J. Safra Sarasin, 01.09.2017
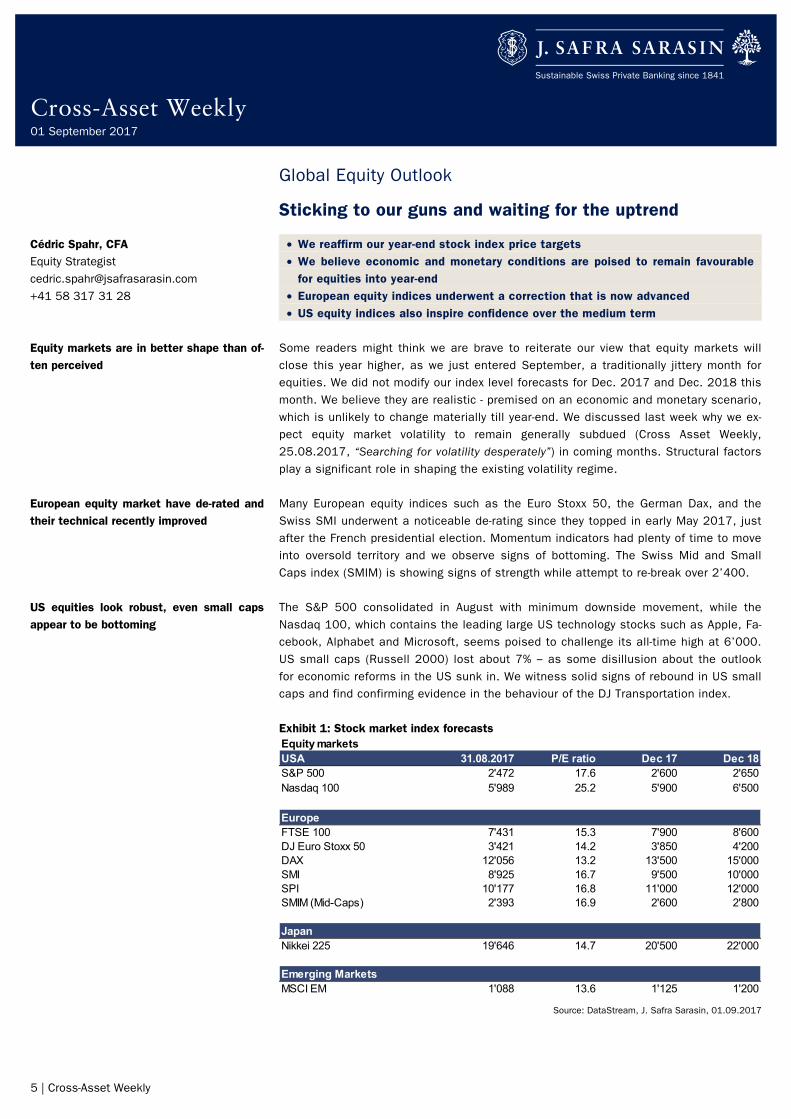
• We reaffirm our year-end stock index price targets • We believe economic and monetary conditions are poised to remain favourable
for equities into year-end • European equity indices underwent a correction that is now advanced • US equity indices also inspire confidence over the medium term
Some readers might think we are brave to reiterate our view that equity markets will close this year higher, as we just entered September, a traditionally jittery month for equities. We did not modify our index level forecasts for Dec. 2017 and Dec. 2018 this month. We believe they are realistic - premised on an economic and monetary scenario, which is unlikely to change materially till year-end. We discussed last week why we ex-pect equity market volatility to remain generally subdued (Cross Asset Weekly, 25.08.2017, “Searching for volatility desperately”) in coming months. Structural factors play a significant role in shaping the existing volatility regime. Many European equity indices such as the Euro Stoxx 50, the German Dax, and the Swiss SMI underwent a noticeable de-rating since they topped in early May 2017, just after the French presidential election. Momentum indicators had plenty of time to move into oversold territory and we observe signs of bottoming. The Swiss Mid and Small Caps index (SMIM) is showing signs of strength while attempt to re-break over 2’400. The S&P 500 consolidated in August with minimum downside movement, while the Nasdaq 100, which contains the leading large US technology stocks such as Apple, Fa-cebook, Alphabet and Microsoft, seems poised to challenge its all-time high at 6’000. US small caps (Russell 2000) lost about 7% ‒ as some disillusion about the outlook for economic reforms in the US sunk in. We witness solid signs of rebound in US small caps and find confirming evidence in the behaviour of the DJ Transportation index. Exhibit 1: Stock market index forecasts
Source: DataStream, J. Safra Sarasin, 01.09.2017
Equity marketsUSA 31.08.2017 P/E ratio Dec 17 Dec 18S&P 500 2'472 17.6 2'600 2'650Nasdaq 100 5'989 25.2 5'900 6'500
Equity markets are in better shape than of-ten perceived
European equity market have de-rated and their technical recently improved
US equities look robust, even small caps appear to be bottoming
Cross-Asset Weekly 01 September 2017
6 | Cross-Asset Weekly
Emerging Markets Outlook
We prefer corporate over sovereign debt
• Emerging market local currency bonds are less risky in this particular moment • Emerging market hard currency debt is expensive, but there are still pockets of
value in Latin America and CEEMEA • For index investors, we prefer corporate credit within hard currency bonds Emerging markets (EM) fixed income offers three main sub segments to invest: 1) local currency bonds, 2) hard currency (HC) corporate debt and 3) hard currency sovereign bonds. While the first sub segment depends on domestic growth, lower domestic infla-tion and stable FX in order to perform, hard currency debt depends on lower credit spreads and treasury yields to enhance returns. Emerging markets are currently going through a good moment in terms of improving economic activity. However not all EM asset classes are benefiting to the same extent. In the case of local currency bonds, the most risky asset class within EM debt, risks to the downside seem well contained; decreasing inflation and improving growth dynamics continue to support domestic bonds and exchange rates, respectively. On the hard currency side the situation is quite different. Bond spreads are very close to their 3-year tights and US treasury yields are likely to go up, adding downside risks to the asset class. Despite our moderate concerns about EM HC bonds, we would like to highlight that pricing is still heterogeneous across regions. Bonds in Asia offer very little yield in rela-tion to comparable credits in Latin America or CEEMEA. The fact that many sovereign credits were downgraded to junk in recent years helps explain the differential. Yet, we are of the view that many issuers in CEMEEA and Latin America would be rated invest-ment grade if it wasn’t for the rating of their sovereigns. Also, we would like to highlight that the economic crises we saw in recent years in Brazil and Russia will most likely not be repeated. Therefore, we believe the spreads of Latin America are not likely to go up to the levels seen in the previous three years. Overall, we believe improving growth dynamics should keep EM credit spreads close to tights. Yet a key risk arises from higher treasury yields. These could drag the perfor-mance of EM HC bonds with long duration, making EM sovereign bonds in HC particu-larly vulnerable. As it can be seen in Exhibit 2, EM HC corporates have much less downside than EM HC sovereigns. Consequently, we recommend EM HC corporates due to their lower interest rate sensitivity.
Local currency bonds are less risky in this particular moment
EM HC debt is expensive, but there is value in some regions
We prefer HC corporates, as they have less downside risk
Exhibit 1: HC bonds – Spread range by region… Exhibit 2: …expected performance using past spread range
Source: JPM, J. Safra Sarasin, 01.09.2017 Source: JPM, J. Safra Sarasin, 01.09.2017
150
200
250
300
350
400
450
500
550
CORPEM
CORPLATAM
CORPCEEMEA
CORPASIA
SOV EM SOVLATAM
SOVMIDDLE
EAST
SOVAFRICA
SOVEUROPE
SOVASIA
Spread
1-year range Last
-5.0
-3.0
-1.0
1.0
3.0
5.0
7.0
9.0
CORP EM CORPLATAM
CORPCEEMEA
CORPASIA
SOV EM SOVLATAM
SOVMIDDLE
EAST
SOVAFRICA
SOVEUROPE
SOV ASIA
Expected Performance (%)
Cross-Asset Weekly 01 September 2017
7 | Cross-Asset Weekly
US Macro
Hurricane Harvey strikes Texas
A comparison with previous national disasters may help to assess the economic impact of Hurricane Harvey, which devastated parts of Texas including Houston, the fourth major city in the US. In the region, the reconstruction and full recovery will take years. Nevertheless, at the national level we expect only a temporary im-pact on prices and the economy.
There are growing concerns about the economic impact of Hurricane Harvey, which hit Southeast Texas earlier this week. Torrential rain and a storm surge resulted in a major flooding of the Houston region. Harvey is on track to become one of the five costliest hurricanes in US history, possibly second only to Hurricane Katrina in 2005, which caused damages of $105bn and levelled a large swath of New Orleans, Louisiana. Historical precedents offer a template for an assessment of what the economic conse-quences might be. The immediate concern is for the oil and energy industry, for which Houston and the nearby coastal area is a major hub. For instance, the region hosts about one third of the US refining capacity. Early estimates suggest that 2/3 of it is currently shut down – that means about 20% of the total refining capacity of the United States now being offline. This is on par with the impact of Hurricane Katrina, which shut more than 23% percent of the total refining capacity. Unlike Katrina and Ike, though, Harvey might have physically damaged refinery plants, which may result in a slower recovery of production in future weeks and months. Of course, there are signifi-cant structural differences between the economy in 2005 and the economy in 2017. The shale revolution has transformed the US energy sector. When hurricane Katrina hit in 2005, the US was the largest importer of gasoline; now it is the world’s largest ex-porter of refined products (the country is still a net importer of crude oil). Impact on prices and inflation In Exhibit 1, we show how Katrina affected retail gasoline prices and inflation at na-tional level. The average cost of gasoline rose 17% from $2.60 to $3.05 in the weeks after the hurricane. The good news is that the surge was short-lived: by the first week of November gasoline prices had returned to their pre-Katrina levels.
Hurricane Harvey’s blow to Texas might make it one of the costliest natural disas-ters in US history
The immediate concern is for the energy sector, for which Texas is a major hub
In a historical perspective, hurricanes’ im-pact on prices and inflation tend to be large but temporary
Exhibit 1: Hurricane Katrina impact on energy prices in 2005 Exhibition: A large but short-lived spike in inflation after Katrina
Source: Datastream, J. Safra Sarasin, 01.09.2017 Source: Datastream, J. Safra Sarasin, 01.09.2017
-10
-5
0
5
10
15
$2.00
$2.25
$2.50
$2.75
$3.00
$3.25
Apr-05 Jun-05 Aug-05 Nov-05 Jan-06 Apr-06
Gasoline prices ($per gallon)
CPI energy, mom %ch. (RHS)
-1.0
-0.5
0.0
0.5
1.0
1.5
Apr-05 Jun-05 Sep-05 Nov-05 Jan-06 Apr-06
CPI all items, mom % ch.
CPI core excl. energy and food, mom % ch.
Cross-Asset Weekly 01 September 2017
8 | Cross-Asset Weekly
Similarly, headline CPI rose by more than 1.4% on a mom basis, but quickly re-tracked its surge (see Exhibit 2). On a yoy basis, inflation peaked at 4.7% in September 2005, and eased to 3.3% in October (3.3% was indeed the inflation annual average for 2005). Impact on the real economy Because of the extensive disruptions, we anticipate negative effect on real consump-tion, payrolls, initial claims for unemployment benefits, and industrial production during the months of August and September. Precedents like Katrina or Hurricane Ike in 2008 indicate that refinery utilization is likely to drop by about 10%. In the case of the labor market, we can look at the consequences of Hurricane Sandy. Sandy hit the Eastern seaboard in October 2012 causing loss of lives (233 fatalities) and damages in a densely populated region. Initial claims for unemployment benefits spiked in November, but quickly rolled back as the area returned to work. There was a minor deceleration to national payrolls gains in October and November, but by December the labor market was back at creating new jobs at a pace above 200k per month. After Katrina in 2005, Louisiana’s gross state product contracted for two consecutive years (-1.7% in 2006 and -3% in 2007), but with little visible effects on national GDP (see Exhibit 4). Of course, the size of Texas might make a difference this time around: Houston is the 4th largest city in the US, and its metropolitan area has a population of 6.7 million (versus a total population of 4.6 million for the entire state of Louisiana in 2005.) The bottom line is, we expect some pain for southern Texas, but relatively minor consequences for the US economy at large. The silver lining: a fiscal truce in Congress The cost of reconstruction will be sizeable. According to Texas Gov. Abbott, federal funding needs will be “far in excess” of $125 billion, topping Hurricane Katrina. The silver lining is that the need to help Texas may spur action in Congress. Emergency re-lief funding will likely be passed in September, and this resolution might become the legislative “vehicle” for a relatively swift approval of a new debt ceiling, and possibly a deal for the 2018 budget that would prevent a government shutdown in October. (For a discussion of the fiscal deadlines in September, see our “Economics and politics of the looming fiscal deadlines” -- Cross Asset Weekly, 25 August 2017). As political pres-sure mounts, the risk surrounding the September fiscal deadline has decreased.
Recovery will be slow for Texas, but the impact on the US economy should be con-tained
The pressure to approve emergency fund-ing for Texas might accelerate a deal in Congress on the debt ceiling and on the 2018 budget
Exhibit 3: The impact of Hurricane Sandy on the labor market Exhibit 4: The pain for natural disasters is regional, not national
Source: Datastream; J. Safra Sarasin, 01.09.2017 Source: Datastream; J. Safra Sarasin, 01.09.2017
0
50
100
150
200
250
300
350
400
320
340
360
380
400
420
440
460
Dec-11 Mar-12 Jun-12 Sep-12 Dec-12 Mar-13
Initial claims for unemploymentbenefits (thous.)Monthly change in total payrolls(thous. RHS)
Disclaimer/Important Information This publication has been prepared by the Research Department of Bank J. Safra Sarasin Ltd (“the Bank”) for information purpose only; the Bank is responsible for the content of this publication. The Bank is regulated by the Swiss Financial Market Supervisory Authority FINMA. The publication is based on publicly available information (“the Information”). While the Bank makes every effort to use reliable and com-prehensive Information, it cannot make any representation that it is actually accurate or complete. Possible errors in this information do not constitute legal grounds for liability, either directly or indirectly. The Bank does not assume any liability for the suitability, the actuality, completeness and/or for the accuracy or continuing accuracy of these information or opinions. Furthermore the Bank does not assume any liability for possible losses which the distribution and/or the usage of this publication may cause, and/or which may be caused in connec-tion with the distribution and/or the usage of this publication. The publication is given for information purposes only and does not constitute an offer or a solicitation of an offer for the purchase or sale of financial instruments. Past performance is no indication of current or future performance. The return of a financial instrument may go down as well as up due to changes in rates of exchange between currencies. The Bank does not assume any liability, neither explicit nor implicit for the future performance of a financial instrument. Before considering any investment the latest available product documentation should be carefully read and an independent consultant should be consulted before considering any investment. Direct investments in U.S. securities may expose the investor to U.S. taxation (e.g. U.S. estate tax). and may lead to U.S. taxation of the investor even in cases where the investor is not domiciled in the U.S. and/or does not have U.S. person status. The Bank may at any time be a buyer or seller of the financial instruments cited in this publication or may act as a principal or mandate holder or may provide investment advisory or investment banking services to the issuer of said financial instruments or to a company close-ly affiliated with the issuer through economic or financial ties. In accordance with legal and regulatory requirements, the Bank has taken organizational and administrative precautions to avoid conflicts of interests wherever possible. In the event that such precautions are insufficient, the Bank discloses the nature and cause of the poten-tial conflict of interests. The precautionary measures that the Bank has taken include: 1. The erection of a Chinese Wall in circumstances where sharing of information between certain persons or departments could give rise
to a conflict of interests. 2. Analysts’ compensation is not tied to their recommendations or views in connection with financial analyses. 3. Regulation of employees’ securities transactions and employees’ business activities to avoid conflicts with clients’ interests. The Bank will disclose conflicts of interests regarding the issuer of the stock mentioned in this publication if: 1. a shareholding of at least 3% in the capital stock of the issuer that is the subject of the financial analysis exists, or 2. the Bank has been involved in the management of a consortium that, within the last twelve months, has issued, by way of a public of-
fering, financial instruments of the issuer that is the subject of the financial analysis, or 3. the Bank has made a market in financial instruments of this issuer through the placement of buying or selling orders, or 4. the Bank has concluded within the last twelve months an agreement with issuers, which are either themselves or through their finan-
cial instruments the subject of a financial analysis, covering services related to investment banking transactions or have received within the last twelve months a service or a promise of services under such an agreement, provided that the disclosure of such in-formation does not involve confidential business information, or
5. the Bank has concluded an agreement regarding the preparation of a financial analysis with issuers that are either themselves or through their financial instruments the subject of the financial analysis, or
6. the Bank holds other significant financial interests with regard to issuers that are either themselves or through their financial instru-ments the subject of a financial analysis.
Information on potential conflicts of interests is provided at the end of each financial analysis (disclosure clause). The opinions and views expressed in this document are those of the analyst at the time of writing and may change at any time without prior notice.