Structural and vibrational stability of M and Z phases of silicon and germanium from first principles A. Bautista-Hernández, T. Rangel, A. H. Romero, G.-M. Rignanese, M. Salazar-Villanueva et al. Citation: J. Appl. Phys. 113, 193504 (2013); doi: 10.1063/1.4804668 View online: http://dx.doi.org/10.1063/1.4804668 View Table of Contents: http://jap.aip.org/resource/1/JAPIAU/v113/i19 Published by the American Institute of Physics. Additional information on J. Appl. Phys. Journal Homepage: http://jap.aip.org/ Journal Information: http://jap.aip.org/about/about_the_journal Top downloads: http://jap.aip.org/features/most_downloaded Information for Authors: http://jap.aip.org/authors
Transcript
Structural and vibrational stability of M and Z phases of silicon andgermanium from first principlesA. Bautista-Hernández, T. Rangel, A. H. Romero, G.-M. Rignanese, M. Salazar-Villanueva et al. Citation: J. Appl. Phys. 113, 193504 (2013); doi: 10.1063/1.4804668 View online: http://dx.doi.org/10.1063/1.4804668 View Table of Contents: http://jap.aip.org/resource/1/JAPIAU/v113/i19 Published by the American Institute of Physics. Additional information on J. Appl. Phys.Journal Homepage: http://jap.aip.org/ Journal Information: http://jap.aip.org/about/about_the_journal Top downloads: http://jap.aip.org/features/most_downloaded Information for Authors: http://jap.aip.org/authors
Structural and vibrational stability of M and Z phases of silicon andgermanium from first principles
A. Bautista-Hern�andez,1,a) T. Rangel,2,3 A. H. Romero,4,5,6,a) G.-M. Rignanese,2,3
M. Salazar-Villanueva,1 and E. Chigo-Anota7
1Facultad de Ingenier�ıa, Benem�erita Universidad Aut�onoma de Puebla, Apdo. Postal J-39,Puebla, Pue. 72570, Mexico2Institute of Condensed Matter and Nanosciences (IMCN), Universit�e Catholique de Louvain,Chemin des �Etoiles 8 bte L7.03.01, B-1348 Louvain-la-Neuve, Belgium3European Theoretical Spectroscopy Facility, ETSF4CINVESTAV, Departamento de Materiales, Unidad Quer�etaro, Quer�etaro 76230, Mexico5Max-Planck-Institute f€ur Mikrostrukturphysik, Weinberg 2, D-06120, Halle, Germany6Phyics Department, West Virginia University, Morgantown, West Virginia 26506, USA7Facultad de Ingenier�ıa Qu�ımica, Benem�erita Universidad Aut�onoma de Puebla, Av.San Claudio y 18 Sur S/N Edificio106A, C.U. San Manuel, 72570 Puebla, Mexico
(Received 11 February 2013; accepted 26 April 2013; published online 15 May 2013)
First-principles calculations were performed to investigate the structural feasibility of M and Z phases
(novel monoclinic and orthorhombic structures recently reported for carbon) for silicon and
germanium. The lattice parameters, bulk modulus, vibrational properties, and elastic constants are
calculated using the local density approximation to describe the exchange-correlation energy, while the
optical properties are calculated by using Many-Body Perturbation Theory in the G0W0 approximation.
Our results indicate that silicon and germanium with the proposed crystal symmetries are elastically
and vibrationally stable and are small band-gap semiconductors. We discuss the possible synthesis of
such materials. VC 2013 AIP Publishing LLC. [http://dx.doi.org/10.1063/1.4804668]
I. INTRODUCTION
The search of allotropes and polymorphs of single ele-
ments and polyatomic compounds has attracted considerable
attention from both theoretical and experimental researchers.
Indeed, since most of chemical and physical properties
depend on the crystal structure, it is expected that materials
with new crystal structures might show novel properties.
Among the important future electronic components, those
based on carbon are very promising. Indeed, its most stable
phase is a planar sp2 structure (graphite) and it has a wide va-
riety of allotropes such as graphene,1 fullerenes,2–4 nano-
tubes,5,6 and other more complicated structures,7 leading to a
large variety of electronic properties. The carbon family also
formed by silicon and germanium has a similar atomic elec-
tronic configuration with the same number of valence elec-
trons: they have an open-shell p orbital with only four
electrons, leading to the possibility of finding a diverse set of
geometries due to different hybridization as in the case of
carbon. Just to cite a few examples, Fujimoto et al. recently
reported two new silicon and germanium phases with body-
centered tetragonal (bct) unit cells.8 Using ab initio evolu-
tionary structural search, Li et al. have discovered a new
carbon phase with a monoclinic structure (referred to as Mphase) with hardness comparable to diamond.9 Applying abinitio random structure search on the phase diagram of sili-
con, Malone et al. have identified a new phase with the Ibamcrystal structure.10 More recently, Amsler et al.11 have found
a new orthorhombic form of cold-compressed graphite
(called Z phase) showing the Cmmm symmetry and com-
posed by sp3 bonds. All these previous studies have opened
the possibility for a broader search of new allotropes of sili-
con and germanium (in the absence of pressure) possibly
showing novel properties within these materials. For
instance, Wu et al. have investigated the vibrational stability
and characterized the electronic properties of two of these
new allotropes (bct and M-phase) of silicon,12 discussing
their possible use as anode materials for lithium batteries.12
While Malone and Cohen have recently published a quite
complete report of different Germanium phases,13 some con-
sidered in this work for reference, neither the Z nor the M
phases were considered in this original work. On the other
hand, recently there has been strong interest in the Z phase of
carbon, where the elastic constants, stress-strain diagram,
vibrational stability, hardness, and Raman spectrum were
detailed studied. From these results, it has been shown that
the carbon Z has hardness comparable to diamond.14,15
On the other hand, various silicon and germanium allo-
tropes such as cubic diamond, allo16–18 clathrate,19,20 and nano-
tube phases21,22 have been synthetized at ambient pressure.
Some other allotropes can be synthesized under hydrostatic
conditions, such as b-Sn, Imma, simple hexagonal, Cmca, and
hexagonal close packed phases. Even more complex phases
can be obtained by decompression of the b-Sn phase (such as
R8, BC8, and ST12). This large number of allotropes has moti-
vated the theoretical study of new phases of silicon and germa-
nium. From the pioneering work of Joannopoulos and
Cohen,23,24 who performed predictions of new allotropes of sil-
icon and germanium with different physical properties of the
diamond phase, a long path has been committed into new crys-
tal structures based on these atoms. We refer the reader to
a)Authors to whom correspondence should be addressed. Electronic addresses:
193504-4 Bautista-Hern�andez et al. J. Appl. Phys. 113, 193504 (2013)
On the other hand, Fig. 3 shows the curves of pressure
vs. enthalpy difference for the phases considered in this
study. As we can see, there are some possible phase transi-
tions within the considered structures as a function of hydro-
static tensile pressure
diamond!M (11.3 GPa)!bct (12.3 GPa)!Z (14.1 GPa)
for silicon, and
diamond!bct (9.4 GPa)!M (9.6 GPa)!Z (11 GPa) for
germanium.
The band-structures are calculated using MBPT within
the G0W0 approximation, which is known to be very accurate
in describing the electronic structure of the diamond phases
for these systems. For instance, our G0W0 gap of diamond Si
(Ge) is 1.17 (0.65) eV, in good agreement with the experi-
mental gap of 1.17 (0.74) eV.58 Therefore, our results for the
gaps of the solids in diamond phase are in good agreement
with previous works.49 The band-structures for silicon and
germanium in the M and Z phases are shown in Fig. 4. The
DFT (red [gray] lines) and G0W0 (solid lines) results are
shown. For M-Si, the G0W0 indirect gap is of 0.85 eV
between the C and M (0.5, 0.5, 0.5) points. Silicon in the Zphase has a gap of 1.12 eV between the C and Y (�0.5, 0.5,
0.0) points. For M-Ge, the G0W0 gap is of 0.30 eV. Here, the
top of the valence band (TVB) is at C, whereas the bottom of
the conduction band (BCB) is located between C and M (at
�57% of their distance) in the Brillouin zone. The Z-Ge
structure has a G0W0 gap of 0.64 eV. The TVB is at Y and
the BCB is at the C point. The G0W0 corrections, in both
materials, corresponds to an almost shift of the electronic
bands, as a simple scissors-operator, which happen to be
similar to the corrections for the diamond structures of sili-
con and germanium.
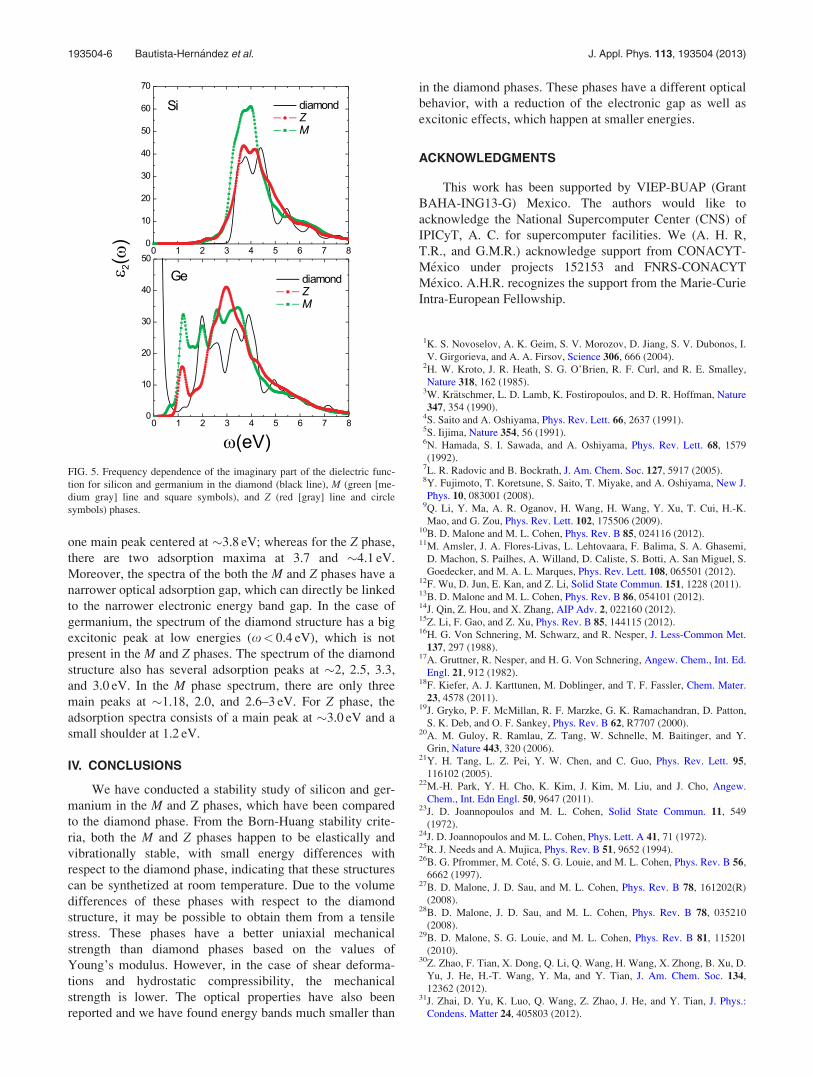
Figure 5 shows the imaginary part of the dielectric func-
tion of silicon and germanium in the diamond (solid lines),
M (green [medium gray] lines and square symbols), and Z(red [gray] lines and circle symbols). In the case of silicon,
the diamond spectra have two main peaks: an excitonic peak
at �3.6 eV and a second peak at 4.4 eV. The M phase shows
FIG. 3. Enthalpy pressure curves for different phases of silicon and germanium.
Black lines, red [gray] squares, green [medium gray] triangles, and yellow [light
gray] triangles correspond to diamond, Z, and M phases, respectively.
FIG. 4. Energy band structure along
high-symmetry lines of the Brillouin
zone for silicon and germanium in the Mand Z phases. Red lines correspond to
DFT, while solid lines correspond to the
G0W0 calculation.
193504-5 Bautista-Hern�andez et al. J. Appl. Phys. 113, 193504 (2013)
one main peak centered at �3.8 eV; whereas for the Z phase,
there are two adsorption maxima at 3.7 and �4.1 eV.
Moreover, the spectra of the both the M and Z phases have a
narrower optical adsorption gap, which can directly be linked
to the narrower electronic energy band gap. In the case of
germanium, the spectrum of the diamond structure has a big
excitonic peak at low energies (x< 0.4 eV), which is not
present in the M and Z phases. The spectrum of the diamond
structure also has several adsorption peaks at �2, 2.5, 3.3,
and 3.0 eV. In the M phase spectrum, there are only three
main peaks at �1.18, 2.0, and 2.6–3 eV. For Z phase, the
adsorption spectra consists of a main peak at �3.0 eV and a
small shoulder at 1.2 eV.
IV. CONCLUSIONS
We have conducted a stability study of silicon and ger-
manium in the M and Z phases, which have been compared
to the diamond phase. From the Born-Huang stability crite-
ria, both the M and Z phases happen to be elastically and
vibrationally stable, with small energy differences with
respect to the diamond phase, indicating that these structures
can be synthetized at room temperature. Due to the volume
differences of these phases with respect to the diamond
structure, it may be possible to obtain them from a tensile
stress. These phases have a better uniaxial mechanical
strength than diamond phases based on the values of
Young’s modulus. However, in the case of shear deforma-
tions and hydrostatic compressibility, the mechanical
strength is lower. The optical properties have also been
reported and we have found energy bands much smaller than
in the diamond phases. These phases have a different optical
behavior, with a reduction of the electronic gap as well as
excitonic effects, which happen at smaller energies.
ACKNOWLEDGMENTS
This work has been supported by VIEP-BUAP (Grant
BAHA-ING13-G) Mexico. The authors would like to
acknowledge the National Supercomputer Center (CNS) of
IPICyT, A. C. for supercomputer facilities. We (A. H. R,
T.R., and G.M.R.) acknowledge support from CONACYT-
M�exico under projects 152153 and FNRS-CONACYT
M�exico. A.H.R. recognizes the support from the Marie-Curie
Intra-European Fellowship.
1K. S. Novoselov, A. K. Geim, S. V. Morozov, D. Jiang, S. V. Dubonos, I.
V. Girgorieva, and A. A. Firsov, Science 306, 666 (2004).2H. W. Kroto, J. R. Heath, S. G. O’Brien, R. F. Curl, and R. E. Smalley,
Nature 318, 162 (1985).3W. Kr€atschmer, L. D. Lamb, K. Fostiropoulos, and D. R. Hoffman, Nature
347, 354 (1990).4S. Saito and A. Oshiyama, Phys. Rev. Lett. 66, 2637 (1991).5S. Iijima, Nature 354, 56 (1991).6N. Hamada, S. I. Sawada, and A. Oshiyama, Phys. Rev. Lett. 68, 1579
(1992).7L. R. Radovic and B. Bockrath, J. Am. Chem. Soc. 127, 5917 (2005).8Y. Fujimoto, T. Koretsune, S. Saito, T. Miyake, and A. Oshiyama, New J.
Phys. 10, 083001 (2008).9Q. Li, Y. Ma, A. R. Oganov, H. Wang, H. Wang, Y. Xu, T. Cui, H.-K.
Mao, and G. Zou, Phys. Rev. Lett. 102, 175506 (2009).10B. D. Malone and M. L. Cohen, Phys. Rev. B 85, 024116 (2012).11M. Amsler, J. A. Flores-Livas, L. Lehtovaara, F. Balima, S. A. Ghasemi,
D. Machon, S. Pailhes, A. Willand, D. Caliste, S. Botti, A. San Miguel, S.
Goedecker, and M. A. L. Marques, Phys. Rev. Lett. 108, 065501 (2012).12F. Wu, D. Jun, E. Kan, and Z. Li, Solid State Commun. 151, 1228 (2011).13B. D. Malone and M. L. Cohen, Phys. Rev. B 86, 054101 (2012).14J. Qin, Z. Hou, and X. Zhang, AIP Adv. 2, 022160 (2012).15Z. Li, F. Gao, and Z. Xu, Phys. Rev. B 85, 144115 (2012).16H. G. Von Schnering, M. Schwarz, and R. Nesper, J. Less-Common Met.
137, 297 (1988).17A. Gruttner, R. Nesper, and H. G. Von Schnering, Angew. Chem., Int. Ed.
Engl. 21, 912 (1982).18F. Kiefer, A. J. Karttunen, M. Doblinger, and T. F. Fassler, Chem. Mater.
23, 4578 (2011).19J. Gryko, P. F. McMillan, R. F. Marzke, G. K. Ramachandran, D. Patton,
S. K. Deb, and O. F. Sankey, Phys. Rev. B 62, R7707 (2000).20A. M. Guloy, R. Ramlau, Z. Tang, W. Schnelle, M. Baitinger, and Y.
Grin, Nature 443, 320 (2006).21Y. H. Tang, L. Z. Pei, Y. W. Chen, and C. Guo, Phys. Rev. Lett. 95,
116102 (2005).22M.-H. Park, Y. H. Cho, K. Kim, J. Kim, M. Liu, and J. Cho, Angew.
Chem., Int. Edn Engl. 50, 9647 (2011).23J. D. Joannopoulos and M. L. Cohen, Solid State Commun. 11, 549
(1972).24J. D. Joannopoulos and M. L. Cohen, Phys. Lett. A 41, 71 (1972).25R. J. Needs and A. Mujica, Phys. Rev. B 51, 9652 (1994).26B. G. Pfrommer, M. Cot�e, S. G. Louie, and M. L. Cohen, Phys. Rev. B 56,
6662 (1997).27B. D. Malone, J. D. Sau, and M. L. Cohen, Phys. Rev. B 78, 161202(R)
(2008).28B. D. Malone, J. D. Sau, and M. L. Cohen, Phys. Rev. B 78, 035210
(2008).29B. D. Malone, S. G. Louie, and M. L. Cohen, Phys. Rev. B 81, 115201
(2010).30Z. Zhao, F. Tian, X. Dong, Q. Li, Q. Wang, H. Wang, X. Zhong, B. Xu, D.
Yu, J. He, H.-T. Wang, Y. Ma, and Y. Tian, J. Am. Chem. Soc. 134,
12362 (2012).31J. Zhai, D. Yu, K. Luo, Q. Wang, Z. Zhao, J. He, and Y. Tian, J. Phys.:
Condens. Matter 24, 405803 (2012).
FIG. 5. Frequency dependence of the imaginary part of the dielectric func-
tion for silicon and germanium in the diamond (black line), M (green [me-
dium gray] line and square symbols), and Z (red [gray] line and circle
symbols) phases.
193504-6 Bautista-Hern�andez et al. J. Appl. Phys. 113, 193504 (2013)
32P. Hohenberg and W. Kohn, Phys. Rev. 136, B864 (1964); W. Kohn and
L. Sham, Phys. Rev. 140, A1133 (1965).33J. P. Perdew and A. Zunger, Phys. Rev. B 23, 5048 (1981).34For this calculation, we use the Generalized Gradient Approximation para-
meterized by Perdew, Burke and Ernzerhof (J. P. Perdew, K. Burke, and
M. Ernzerhof, Phys. Rev. Lett. 77, 3865 (1996)) and Hartwigsen-
Goedecke-Hutter pseudopotentials. The results for silicon are: C11¼ 152.9
GPa, C12¼ 56 GPa, and C44¼ 74.9 GPa. For germanium, the results are:
C11¼ 103.6 GPa, C12¼ 35.8 GPa, and C44¼ 55.4 GPa. The average errors
for the three elastic constants of the two elements are 14.68% and 2.19%
for the GGA and LDA functionals, respectively.35C. Hartwigsen, S. Goedecker, and J. Hutter, Phys. Rev. B 58, 3641
(1998).36D. Vanderbilt, Phys. Rev. B 41, 7892 (1990).37H. J. Monkhorst and J. D. Pack, Phys. Rev. B 8, 5747 (1973).38F. Birch, Phys. Rev. 71, 809 (1947).39S. Q. Wang and H. Q. Ye, Phys. Status Solidi B 240, 45 (2003).40D. R. Hamann, X. Wu, K. M. Rabe, and D. Vanderbilt, Phys. Rev. B 71,
035117 (2005).41S. J. Clark, M. D. Segall, C. J. Pickard, P. J. Hasnip, M. J. Probert, K.
Refson, and M. C. Payne, Z. Kristallogr. 220, 567 (2005).42X. Gonze, G.-M. Rignanese, M. Verstraete, J.-M. Beuken, Y. Pouillon, R.
Caracas, F. Jollet, M. Torrent, G. Zerah, M. Mikami, Ph. Ghosez, M.
Veithen, J.-Y. Raty, V. Olevano, F. Bruneval, L. Reining, R. Godby, G.
Onida, D. R. Hamann, and D. C. Allan, Z. Kristallogr. 220, 558 (2005).43S. Baroni, S. de Gironcoli, A. Dal Corso, and P. Giannozzi, Rev. Mod.
and C. Lee, ibid. 55, 10355 (1997).44S. L. Adler, Phys. Rev. 126, 413 (1962); N. Wiser, ibid. 129, 62 (1963).45F. Bruneval and X. Gonze, Phys. Rev. B 78, 085125 (2008).46J. R. Yates, X. Wang, D. Vanderbilt, and I. Souza, Phys. Rev. B 75,
195121 (2007), D. R. Hamann and D. Vanderbilt, Phys. Rev. B 79,
045109 (2009).47X. Gonze, B. Amadon, P.-M. Anglade, J.-M. Beuken, F. Bottin, P.
Boulanger, F. Bruneval, D. Caliste, R. Caracas, M. Cot�e, T. Deutsch, L.
Genovese Ph. Ghosez, M. Giantomassi, S. Goedecker, D. R. Hamann, P.
Hermetp, F. Jollet, G. Jomard, S. Leroux, M. Mancini, S. Mazevet, M. J.
T. Oliveira, G. Onida, Y. Pouillon, T. Rangel, G.-M. Rignanese, D.
Sangalli, R. Shaltaf, M. Torrent, M. J. Verstraete, G. Zerah, and J. W.
Zwanziger, Comput. Phys. Commun. 180, 2582 (2009); ABINIT is a com-
mon project of the Universite Catholique de Louvain, Corning
Incorporated, and other contributors.48R. Gomez-Abal, X. Li, M. Scheffler, and C. Ambrosch-Draxl, Phys. Rev.
Lett. 101, 106404 (2008).49M. S. Hybertsen and S. G. Louie, Phys. Rev. B 34, 5390 (1986).50See http://dp-code.org/ for documentation and download.51L. Reining, V. Olevano, A. Rubio, and G. Onida, Phys. Rev. Lett. 88,
066404 (2002).52M. Levi, H. E. Bass, and R. R. Stern, Handbook of Elastic Properties of
Solids, Liquids, and Gases (Academic Press, 2001), Vol. II.53Elastic constants were calculated by finite strain method and Vanderbilt
ultrasoft pseudopotentials. In the case of diamond phases for Si and Ge,
the results are: C11¼ 162.8, 133.9; C12¼ 63.9, 49.7; and C44¼ 76.8, 69.1
GPa, respectively. The average errors for the three elastic constants of the
two elements are 2.66% and 2.19% for the ultrasoft and HGH pseudopo-
tential, respectively. For Si and Ge in monoclinic phase, the elastic con-