Page 1
M. M. Correia / Instituto Superior Técnico (2012)
1
STRUCTURAL BEHAVIOR OF PULTRUDED GFRP PROFILES
EXPERIMENTAL STUDY AND NUMERICAL MODELING
Manuel Mendes Correia
Department of Civil Engineering, Arquitecture and Georesources, Instituto Superior Técnico, Technical University of Lisbon, Av. Rovisco Pais, 1049-001 Lisbon – Portugal
February 2012
ABSTRACT: The design of GFRP pultruded profiles is limited by deformations in service limit states (SLS) and by local and/or global buck-
ling in ultimate limit states (ULS). This work focuses on the structural behavior of GFRP pultruded I-profiles, particularly on the local
buckling behavior. Hence, experimental studies were conducted: (i) coupon tests; and (ii) full-scale tests on short columns and three-
point and four-point bending tests on beams. Numerical models using the finite element method (FEM) were developed to analyze the
profiles local buckling. Using these models, the influence of different cross-section shapes and members length on local buckling was
evaluated.
KEYWORDS: GFRP, structural behavior, beam, column, experimental tests, numerical modeling, local buckling.
1. INTRODUCTION
Glass Fiber Reinforced Polymers (GFRP) are composite
materials made of glass fiber reinforced polymer matrix.
Due to their high durability and lightweight qualities, GFRP
profiles are a valid option as structural members. Howev-
er, they are governed by deformations (SLS) and global
and/or local buckling (ULS).
Local buckling of GFRP profiles has been a matter of study
for many researchers. Both experimental and numerical
studies were developed in order to increase the
knowledge about the material and the local buckling phe-
nomenon. Bank and Yin [1] studied experimentally and
numerically postbuckled failure on I-beams, Turvey and
Zhang [2] studied the same issues, but in the scope of
columns. Experimental tests and numerical simulations
conducted by Kollár [3, 4] enabled the development of
analytical calculations to obtain the critical stress.
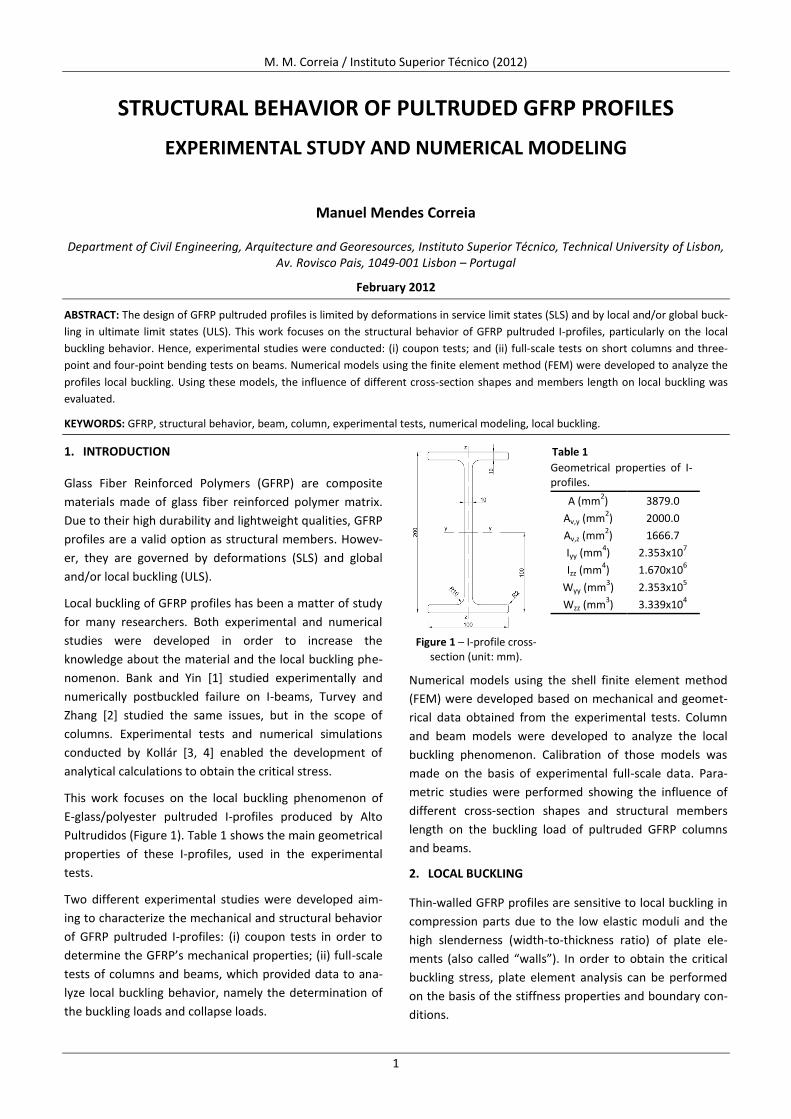
This work focuses on the local buckling phenomenon of
E-glass/polyester pultruded I-profiles produced by Alto
Pultrudidos (Figure 1). Table 1 shows the main geometrical
properties of these I-profiles, used in the experimental
tests.
Two different experimental studies were developed aim-
ing to characterize the mechanical and structural behavior
of GFRP pultruded I-profiles: (i) coupon tests in order to
determine the GFRP’s mechanical properties; (ii) full-scale
tests of columns and beams, which provided data to ana-
lyze local buckling behavior, namely the determination of
the buckling loads and collapse loads.
Table 1
Geometrical properties of I-profiles.
A (mm2) 3879.0
Av,y (mm2) 2000.0
Av,z (mm2) 1666.7
Iyy (mm4) 2.353x10
7
Izz (mm4) 1.670x10
6
Wyy (mm3) 2.353x10
5
Wzz (mm3) 3.339x10
4
Figure 1 – I-profile cross-section (unit: mm).
Numerical models using the shell finite element method
(FEM) were developed based on mechanical and geomet-
rical data obtained from the experimental tests. Column
and beam models were developed to analyze the local
buckling phenomenon. Calibration of those models was
made on the basis of experimental full-scale data. Para-
metric studies were performed showing the influence of
different cross-section shapes and structural members
length on the buckling load of pultruded GFRP columns
and beams.
2. LOCAL BUCKLING
Thin-walled GFRP profiles are sensitive to local buckling in
compression parts due to the low elastic moduli and the
high slenderness (width-to-thickness ratio) of plate ele-
ments (also called “walls”). In order to obtain the critical
buckling stress, plate element analysis can be performed
on the basis of the stiffness properties and boundary con-
ditions.
Page 2
M. M. Correia / Instituto Superior Técnico (2012)
2
Table 2 shows the stiffness properties for orthotropic plate
elements, where Ex is the flexural longitudinal modulus, Ey
is the flexural transversal modulus, Gxy is the shear modu-
lus, νx is the longitudinal Poisson ratio and νy is the trans-
versal Poisson ratio given by:
(1)
Table 2 Stiffness properties for orthotropic plate elements.
Stiffness Expression
flexural longitudinal direc-
tion
(2)
flexural transversal direc-
tion
(3)
flexural transversal direc-tion due to longitudinal
bending
(4)
shear stiffness
(5)
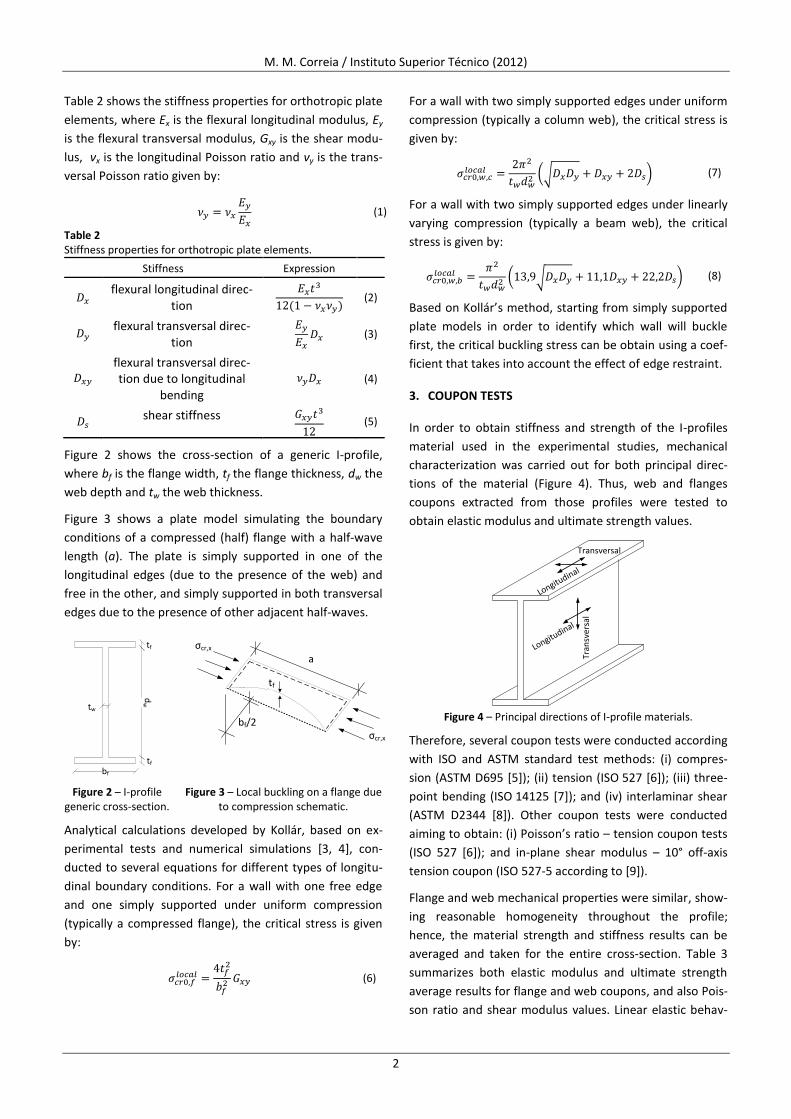
Figure 2 shows the cross-section of a generic I-profile,
where bf is the flange width, tf the flange thickness, dw the
web depth and tw the web thickness.
Figure 3 shows a plate model simulating the boundary
conditions of a compressed (half) flange with a half-wave
length (a). The plate is simply supported in one of the
longitudinal edges (due to the presence of the web) and
free in the other, and simply supported in both transversal
edges due to the presence of other adjacent half-waves.
bf
dw
tf
tf
tw
σcr,x
σcr,x
bf/2
a
tf
Figure 2 – I-profile
generic cross-section. Figure 3 – Local buckling on a flange due
to compression schematic.
Analytical calculations developed by Kollár, based on ex-
perimental tests and numerical simulations [3, 4], con-
ducted to several equations for different types of longitu-
dinal boundary conditions. For a wall with one free edge
and one simply supported under uniform compression
(typically a compressed flange), the critical stress is given
by:
(6)
For a wall with two simply supported edges under uniform
compression (typically a column web), the critical stress is
given by:
(√ ) (7)
For a wall with two simply supported edges under linearly
varying compression (typically a beam web), the critical
stress is given by:
( √ ) (8)
Based on Kollár’s method, starting from simply supported
plate models in order to identify which wall will buckle
first, the critical buckling stress can be obtain using a coef-
ficient that takes into account the effect of edge restraint.
3. COUPON TESTS
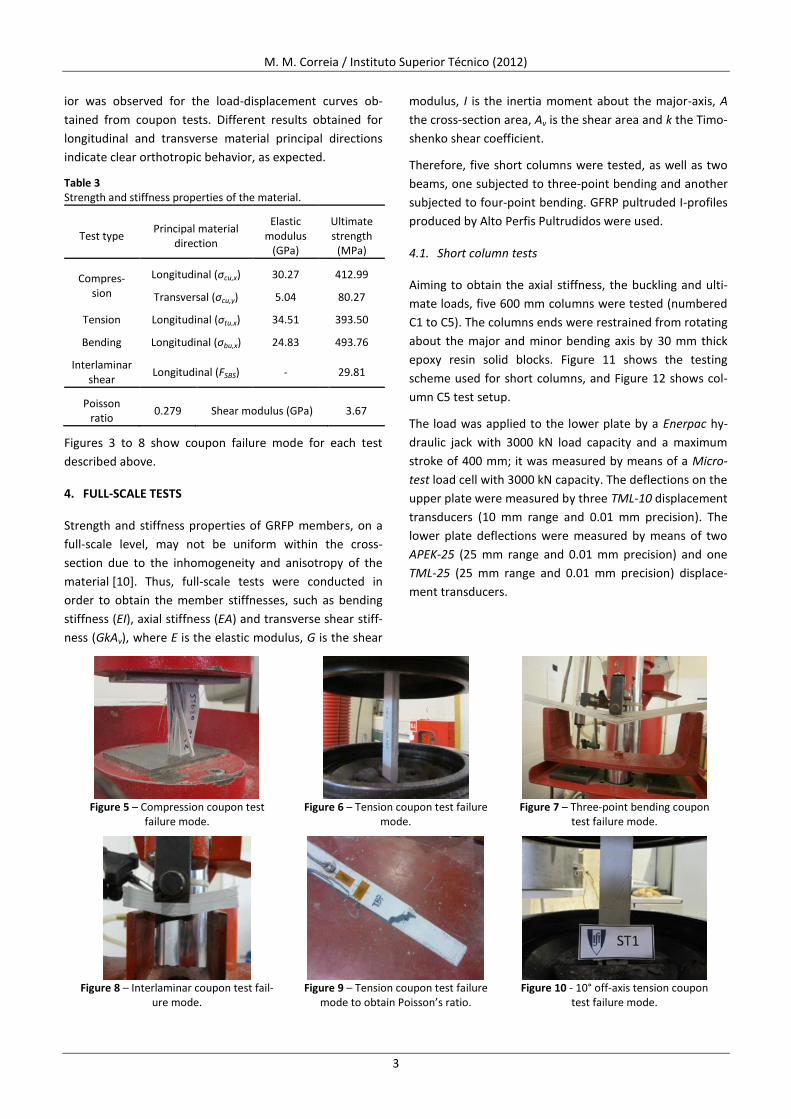
In order to obtain stiffness and strength of the I-profiles
material used in the experimental studies, mechanical
characterization was carried out for both principal direc-
tions of the material (Figure 4). Thus, web and flanges
coupons extracted from those profiles were tested to
obtain elastic modulus and ultimate strength values.
Longitudinal
Tran
sver
sal
Longitudinal
Transversal
Figure 4 – Principal directions of I-profile materials.
Therefore, several coupon tests were conducted according
with ISO and ASTM standard test methods: (i) compres-
sion (ASTM D695 [5]); (ii) tension (ISO 527 [6]); (iii) three-
point bending (ISO 14125 [7]); and (iv) interlaminar shear
(ASTM D2344 [8]). Other coupon tests were conducted
aiming to obtain: (i) Poisson’s ratio – tension coupon tests
(ISO 527 [6]); and in-plane shear modulus – 10° off-axis
tension coupon (ISO 527-5 according to [9]).
Flange and web mechanical properties were similar, show-
ing reasonable homogeneity throughout the profile;
hence, the material strength and stiffness results can be
averaged and taken for the entire cross-section. Table 3
summarizes both elastic modulus and ultimate strength
average results for flange and web coupons, and also Pois-
son ratio and shear modulus values. Linear elastic behav-
Page 3
M. M. Correia / Instituto Superior Técnico (2012)
3
ior was observed for the load-displacement curves ob-
tained from coupon tests. Different results obtained for
longitudinal and transverse material principal directions
indicate clear orthotropic behavior, as expected.
Table 3 Strength and stiffness properties of the material.
Test type Principal material
direction
Elastic modulus
(GPa)
Ultimate strength
(MPa)
Compres-sion
Longitudinal (σcu,x) 30.27 412.99
Transversal (σcu,y) 5.04 80.27
Tension Longitudinal (σtu,x) 34.51 393.50
Bending Longitudinal (σbu,x) 24.83 493.76
Interlaminar shear
Longitudinal (FSBS) - 29.81
Poisson ratio
0.279 Shear modulus (GPa) 3.67
Figures 3 to 8 show coupon failure mode for each test
described above.
4. FULL-SCALE TESTS
Strength and stiffness properties of GRFP members, on a
full-scale level, may not be uniform within the cross-
section due to the inhomogeneity and anisotropy of the
material [10]. Thus, full-scale tests were conducted in
order to obtain the member stiffnesses, such as bending
stiffness (EI), axial stiffness (EA) and transverse shear stiff-
ness (GkAv), where E is the elastic modulus, G is the shear
modulus, I is the inertia moment about the major-axis, A
the cross-section area, Av is the shear area and k the Timo-
shenko shear coefficient.
Therefore, five short columns were tested, as well as two
beams, one subjected to three-point bending and another
subjected to four-point bending. GFRP pultruded I-profiles
produced by Alto Perfis Pultrudidos were used.
4.1. Short column tests
Aiming to obtain the axial stiffness, the buckling and ulti-
mate loads, five 600 mm columns were tested (numbered
C1 to C5). The columns ends were restrained from rotating
about the major and minor bending axis by 30 mm thick
epoxy resin solid blocks. Figure 11 shows the testing
scheme used for short columns, and Figure 12 shows col-
umn C5 test setup.
The load was applied to the lower plate by a Enerpac hy-
draulic jack with 3000 kN load capacity and a maximum
stroke of 400 mm; it was measured by means of a Micro-
test load cell with 3000 kN capacity. The deflections on the
upper plate were measured by three TML-10 displacement
transducers (10 mm range and 0.01 mm precision). The
lower plate deflections were measured by means of two
APEK-25 (25 mm range and 0.01 mm precision) and one
TML-25 (25 mm range and 0.01 mm precision) displace-
ment transducers.
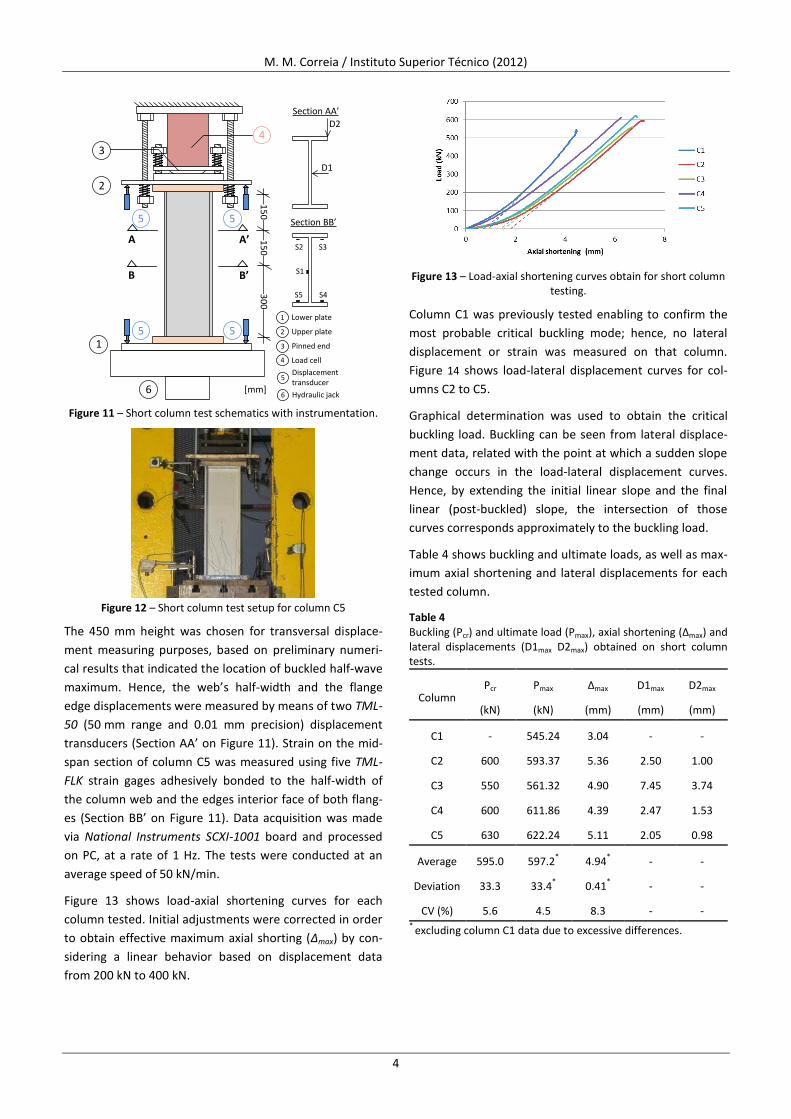
Figure 5 – Compression coupon test
failure mode. Figure 6 – Tension coupon test failure
mode. Figure 7 – Three-point bending coupon
test failure mode.
Figure 8 – Interlaminar coupon test fail-
ure mode. Figure 9 – Tension coupon test failure
mode to obtain Poisson’s ratio. Figure 10 - 10° off-axis tension coupon
test failure mode.
Page 4
M. M. Correia / Instituto Superior Técnico (2012)
4
5
Section AA’
D2
D1
30
01
50
15
0
B B’
A A’
1
4
2
3
5
5 5
6
Section BB’
1 Lower plate
3 Pinned end
4 Load cell
5Displacement transducer
6 Hydraulic jack
2 Upper plate
S4S5
S2
S1
S3
[mm]
Figure 11 – Short column test schematics with instrumentation.
Figure 12 – Short column test setup for column C5
The 450 mm height was chosen for transversal displace-
ment measuring purposes, based on preliminary numeri-
cal results that indicated the location of buckled half-wave
maximum. Hence, the web’s half-width and the flange
edge displacements were measured by means of two TML-
50 (50 mm range and 0.01 mm precision) displacement
transducers (Section AA’ on Figure 11). Strain on the mid-
span section of column C5 was measured using five TML-
FLK strain gages adhesively bonded to the half-width of
the column web and the edges interior face of both flang-
es (Section BB’ on Figure 11). Data acquisition was made
via National Instruments SCXI-1001 board and processed
on PC, at a rate of 1 Hz. The tests were conducted at an
average speed of 50 kN/min.
Figure 13 shows load-axial shortening curves for each
column tested. Initial adjustments were corrected in order
to obtain effective maximum axial shorting (Δmax) by con-
sidering a linear behavior based on displacement data
from 200 kN to 400 kN.
Figure 13 – Load-axial shortening curves obtain for short column
testing.
Column C1 was previously tested enabling to confirm the
most probable critical buckling mode; hence, no lateral
displacement or strain was measured on that column.
Figure 14 shows load-lateral displacement curves for col-
umns C2 to C5.
Graphical determination was used to obtain the critical
buckling load. Buckling can be seen from lateral displace-
ment data, related with the point at which a sudden slope
change occurs in the load-lateral displacement curves.
Hence, by extending the initial linear slope and the final
linear (post-buckled) slope, the intersection of those
curves corresponds approximately to the buckling load.
Table 4 shows buckling and ultimate loads, as well as max-
imum axial shortening and lateral displacements for each
tested column.
Table 4 Buckling (Pcr) and ultimate load (Pmax), axial shortening (Δmax) and lateral displacements (D1max D2max) obtained on short column tests.
Column Pcr
(kN)
Pmax
(kN)
Δmax
(mm)
D1max
(mm)
D2max
(mm)
C1 - 545.24 3.04 - -
C2 600 593.37 5.36 2.50 1.00
C3 550 561.32 4.90 7.45 3.74
C4 600 611.86 4.39 2.47 1.53
C5 630 622.24 5.11 2.05 0.98
Average 595.0 597.2*
4.94*
- -
Deviation 33.3 33.4* 0.41
* - -
CV (%) 5.6 4.5 8.3
- - *
excluding column C1 data due to excessive differences.
Page 5
M. M. Correia / Instituto Superior Técnico (2012)
5
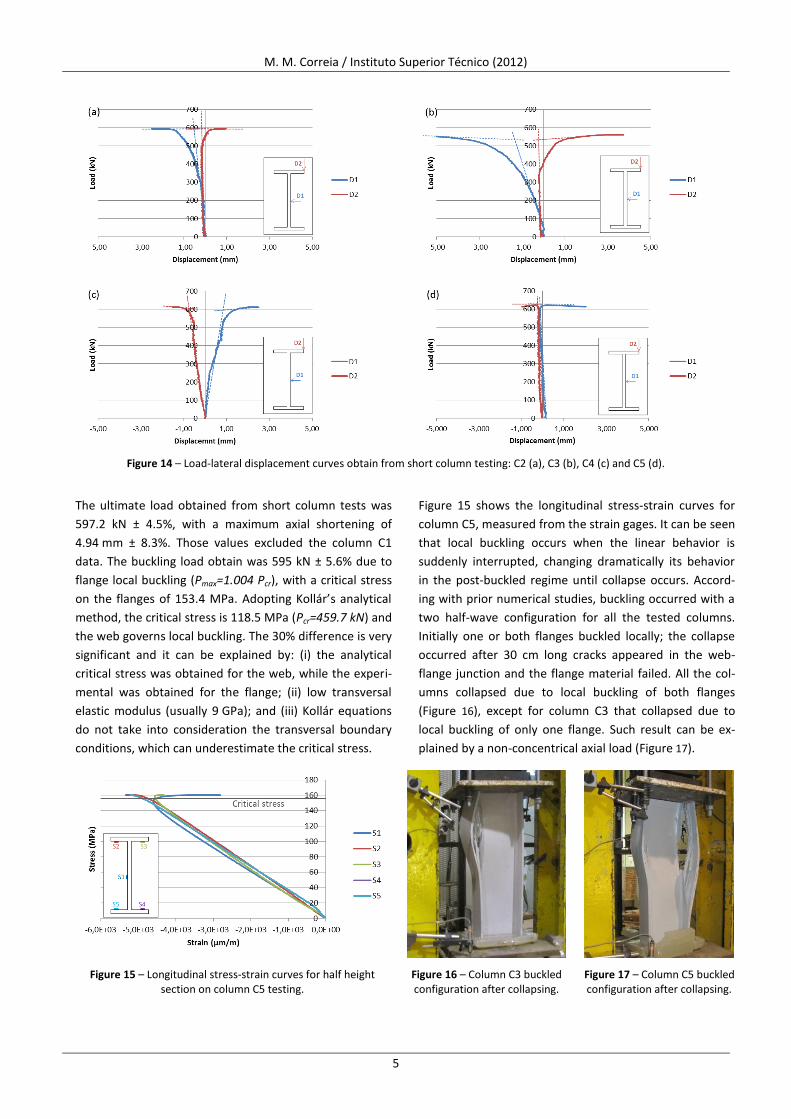
Figure 14 – Load-lateral displacement curves obtain from short column testing: C2 (a), C3 (b), C4 (c) and C5 (d).
The ultimate load obtained from short column tests was
597.2 kN ± 4.5%, with a maximum axial shortening of
4.94 mm ± 8.3%. Those values excluded the column C1
data. The buckling load obtain was 595 kN ± 5.6% due to
flange local buckling (Pmax=1.004 Pcr), with a critical stress
on the flanges of 153.4 MPa. Adopting Kollár’s analytical
method, the critical stress is 118.5 MPa (Pcr=459.7 kN) and
the web governs local buckling. The 30% difference is very
significant and it can be explained by: (i) the analytical
critical stress was obtained for the web, while the experi-
mental was obtained for the flange; (ii) low transversal
elastic modulus (usually 9 GPa); and (iii) Kollár equations
do not take into consideration the transversal boundary
conditions, which can underestimate the critical stress.
Figure 15 shows the longitudinal stress-strain curves for
column C5, measured from the strain gages. It can be seen
that local buckling occurs when the linear behavior is
suddenly interrupted, changing dramatically its behavior
in the post-buckled regime until collapse occurs. Accord-
ing with prior numerical studies, buckling occurred with a
two half-wave configuration for all the tested columns.
Initially one or both flanges buckled locally; the collapse
occurred after 30 cm long cracks appeared in the web-
flange junction and the flange material failed. All the col-
umns collapsed due to local buckling of both flanges
(Figure 16), except for column C3 that collapsed due to
local buckling of only one flange. Such result can be ex-
plained by a non-concentrical axial load (Figure 17).
Figure 15 – Longitudinal stress-strain curves for half height section on column C5 testing.
Figure 16 – Column C3 buckled configuration after collapsing.
Figure 17 – Column C5 buckled configuration after collapsing.
Page 6
M. M. Correia / Instituto Superior Técnico (2012)
6
4.2. Three-point bending beam
In order to obtain flexural and shear moduli, the EN 13706
Annex G method [11] was followed. Thus, a simply sup-
ported beam was tested for different span lengths (L):
1.40 m, 2.10 m, 2.80 m and 3.50 m).
Due to typical low shear-to-elastic flexural moduli ratio,
also called anisotropy degree, the determination of elastic
moduli at a full-section level, both should consider the
flexural deformation and shear deformation. Thus, the
Timoshenko Beam Theory (TBT) should be considered
instead of the Euler-Bernoulli Theory (EBT). The mid-span
deflection for a three-point bending beam is given by:
(9)
As the TBT was considered, flexural and shear moduli are
named “effective”. On the other hand, if the EBT was
considered, flexural modulus is named “apparent” [12]
and is given by:
(
⁄
) (10)
Figure 19 shows the testing schematics used on three-
point bending beam tests, and Figure 20 shows the test
setup.
The load (P) was applied at mid-span on the superior
flange of the profile by a Enerpac hydraulic jack with 600
kN load capacity and a maximum stroke of 250 mm; it was
measured by means of a Novatech load cell with 100 kN
capacity. The deflection at the mid-span (δ) was measured
by a TML-100 displacement transducer, of 100 mm range
and 0.01 mm precision. Data acquisition was made via
HBM Spider8 board and processed on PC, at a rate of
10 Hz.
Roberts and Al-Ubaidi [13] suggest that shear stiffness and
shear modulus show significant variation when deter-
mined by full-scale beam tests. Hence, two load cycles
were performed on each span length tested; due to GFRP
linear elastic behavior monotonic load was applied up to
5 kN, and then unloaded. Prior numerical studies for
three-point bending were developed in order to prevent
lateral-torsional buckling (P > 14.39 kN). The tests were
conducted at an average speed of 5 kN/min.
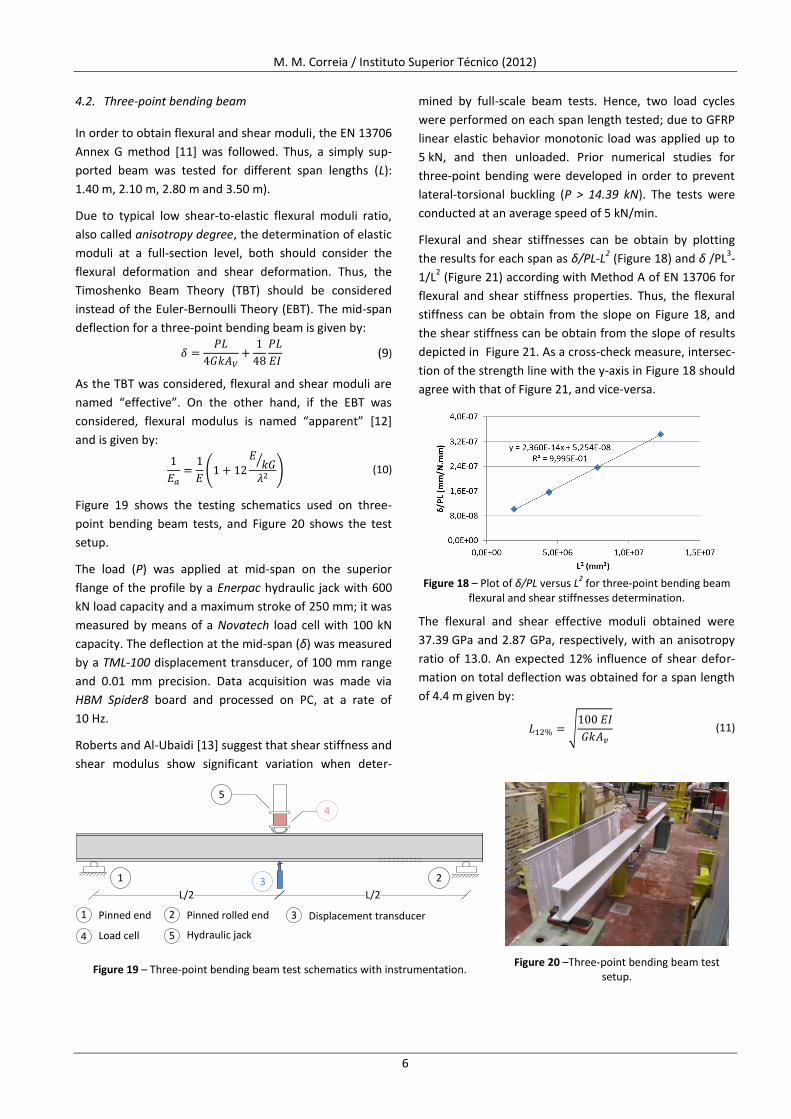
Flexural and shear stiffnesses can be obtain by plotting
the results for each span as δ/PL-L2 (Figure 18) and δ /PL
3-
1/L2 (Figure 21) according with Method A of EN 13706 for
flexural and shear stiffness properties. Thus, the flexural
stiffness can be obtain from the slope on Figure 18, and
the shear stiffness can be obtain from the slope of results
depicted in Figure 21. As a cross-check measure, intersec-
tion of the strength line with the y-axis in Figure 18 should
agree with that of Figure 21, and vice-versa.
Figure 18 – Plot of δ/PL versus L
2 for three-point bending beam
flexural and shear stiffnesses determination.
The flexural and shear effective moduli obtained were
37.39 GPa and 2.87 GPa, respectively, with an anisotropy
ratio of 13.0. An expected 12% influence of shear defor-
mation on total deflection was obtained for a span length
of 4.4 m given by:
√
(11)
1 23L/2 L/2
1 Pinned end
4
2 Pinned rolled end 3 Displacement transducer
4 Load cell 5 Hydraulic jack
5
Figure 19 – Three-point bending beam test schematics with instrumentation. Figure 20 –Three-point bending beam test
setup.
Page 7
M. M. Correia / Instituto Superior Técnico (2012)
7
Thus, for the range of span lengths tested the influence of
shear deformation on the total beam deflection was high-
er than 12%.
Figure 21 – Plot of δ/PL
3 versus 1/L
2 for three-point bending
beam flexural and shear stiffnesses determination.
4.3. Four-point bending beam
The main goal of this test was to obtain the buckling and
ultimate load for four-point bending. The beam tested was
simply supported with a 4.0 m span length; the load was
applied 1.3 m from each support. As referred previously
for the three-point bending test, TBT should be considered
in order to predict the deflection of the beam considering
the shear deformation. The (symmetrical) deflection (in m)
of the beam, function of the distance (x) to the pinned
end, is given by:
{
(
)
(12)
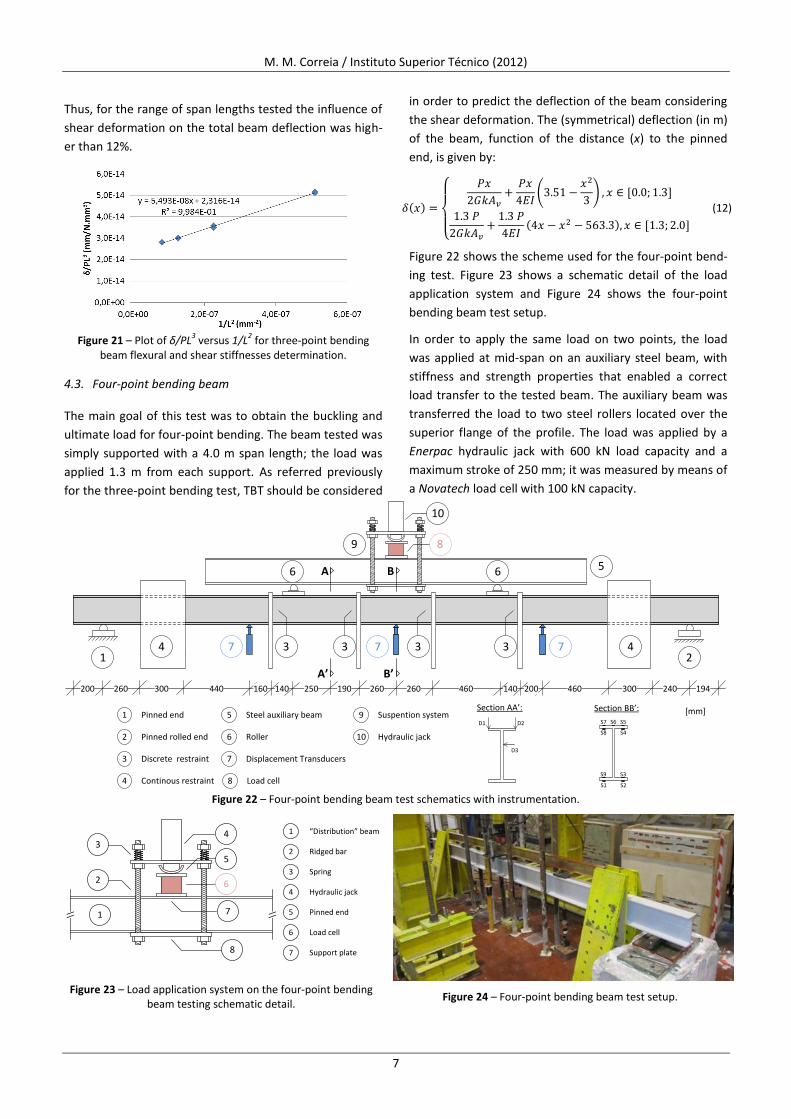
Figure 22 shows the scheme used for the four-point bend-
ing test. Figure 23 shows a schematic detail of the load
application system and Figure 24 shows the four-point
bending beam test setup.
In order to apply the same load on two points, the load
was applied at mid-span on an auxiliary steel beam, with
stiffness and strength properties that enabled a correct
load transfer to the tested beam. The auxiliary beam was
transferred the load to two steel rollers located over the
superior flange of the profile. The load was applied by a
Enerpac hydraulic jack with 600 kN load capacity and a
maximum stroke of 250 mm; it was measured by means of
a Novatech load cell with 100 kN capacity.
B
B’
13
2
56
3
6
7 7 74 4
8
200 260 300 440 160 140 260 260 140 200 460 300 240 194
3 3
9
10
A
A’190250 460
1 Pinned end
2 Pinned rolled end
3 Discrete restraint
4 Continous restraint
5 Steel auxiliary beam
6 Roller
7 Displacement Transducers
8 Load cell
9 Suspention system
10 Hydraulic jack
Section BB’:
S3
S2
S9
S1
S5
S4
S7
S8
S6
Section AA’:
D1 D2
D3
[mm]
Figure 22 – Four-point bending beam test schematics with instrumentation.
\\ \\
4
1
2
8
3
7
5
6
1 “Distribution” beam
2 Ridged bar
3 Spring
4 Hydraulic jack
5 Pinned end
6 Load cell
7 Support plate
Figure 23 – Load application system on the four-point bending beam testing schematic detail.
Figure 24 – Four-point bending beam test setup.
Page 8
M. M. Correia / Instituto Superior Técnico (2012)
8
The deflection was measured in three point spaced 1.0 m
from each other: at 1.0 m from each support (d1 and d3)
the displacements were measured by means of two
TML-100 displacement transducer (100 mm range and
0.01 mm precision), and at the mid-span (d2) it was meas-
ured by a APEK-100 displacement transducer (100 mm
range and 0.01 mm precision). A section located 1550 mm
from the pinned end was chosen for transversal displace-
ment measuring purposes, based on prior numerical tests
indicating where the buckled half-wave maximum would
occur. In both edges of the top flange, vertical displace-
ments were measured and the lateral displacement of the
web ¾ width by means of three TML-500 (500 mm range
and 0.01 mm precision) displacement transducers (Section
AA’ on Figure 22). Strain in the mid-span section was
measured by nine TML-FLK strain gages adhesively bonded
to the half-width of the web, to the edges of both flanges
on the interior and exterior faces, and to the center of the
top flange on the external face (Section BB’ on Figure 22).
Data acquisition was made via HBM Spider8 data logger
and processed on PC, at a rate of 10 Hz. The test was con-
ducted at an average speed of 5 kN/min. In order to pre-
vent the beam from buckling laterally, eight steel props
were placed against the profile on each side; torsion on
the supports was prevented by four steel triangular blocks,
one on each side of both supports. The load was applied
until the beam collapsed.
Figure 25 shows the deflections, spaced by 1.0 m from
each other plotted, versus the load. Linear elastic behavior
can be seen until the beam collapses at 61.3 kN, corre-
sponding to a maximum bending moment of 39.7 kNm.
The maximum displacement obtained was at the mid-span
(d2) and it was 85.26 mm; d1 maximum value was 63.08
and d3 maximum value was 61.67 mm.
Figure 25 – Load-deflection curves at one meter from each sup-
port and at mid-span for the four-point bending beam test.
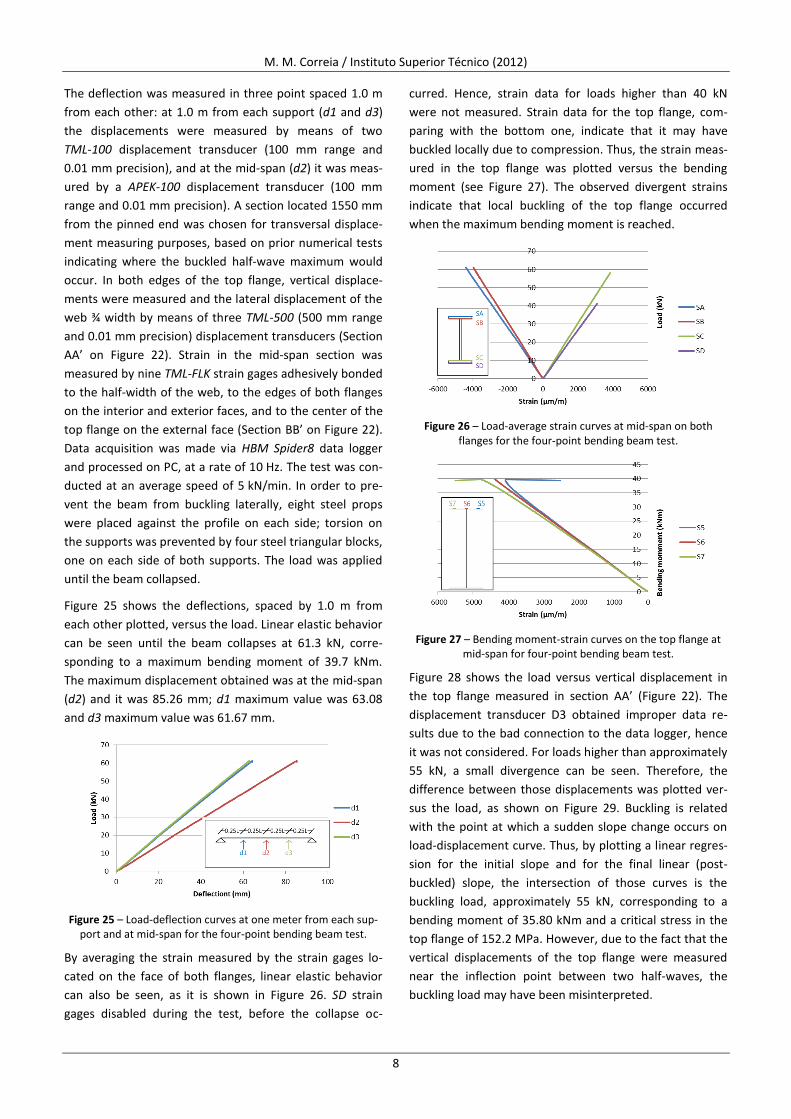
By averaging the strain measured by the strain gages lo-
cated on the face of both flanges, linear elastic behavior
can also be seen, as it is shown in Figure 26. SD strain
gages disabled during the test, before the collapse oc-
curred. Hence, strain data for loads higher than 40 kN
were not measured. Strain data for the top flange, com-
paring with the bottom one, indicate that it may have
buckled locally due to compression. Thus, the strain meas-
ured in the top flange was plotted versus the bending
moment (see Figure 27). The observed divergent strains
indicate that local buckling of the top flange occurred
when the maximum bending moment is reached.
Figure 26 – Load-average strain curves at mid-span on both
flanges for the four-point bending beam test.
Figure 27 – Bending moment-strain curves on the top flange at
mid-span for four-point bending beam test.
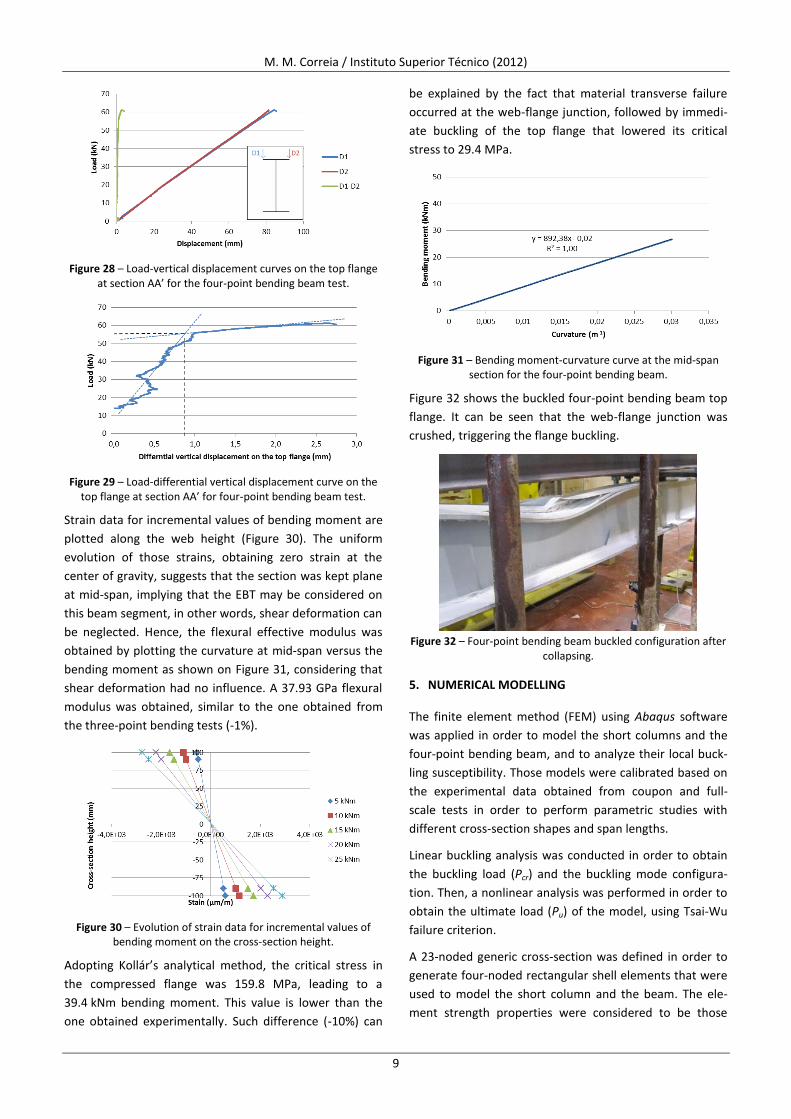
Figure 28 shows the load versus vertical displacement in
the top flange measured in section AA’ (Figure 22). The
displacement transducer D3 obtained improper data re-
sults due to the bad connection to the data logger, hence
it was not considered. For loads higher than approximately
55 kN, a small divergence can be seen. Therefore, the
difference between those displacements was plotted ver-
sus the load, as shown on Figure 29. Buckling is related
with the point at which a sudden slope change occurs on
load-displacement curve. Thus, by plotting a linear regres-
sion for the initial slope and for the final linear (post-
buckled) slope, the intersection of those curves is the
buckling load, approximately 55 kN, corresponding to a
bending moment of 35.80 kNm and a critical stress in the
top flange of 152.2 MPa. However, due to the fact that the
vertical displacements of the top flange were measured
near the inflection point between two half-waves, the
buckling load may have been misinterpreted.
Page 9
M. M. Correia / Instituto Superior Técnico (2012)
9
Figure 28 – Load-vertical displacement curves on the top flange
at section AA’ for the four-point bending beam test.
Figure 29 – Load-differential vertical displacement curve on the
top flange at section AA’ for four-point bending beam test.
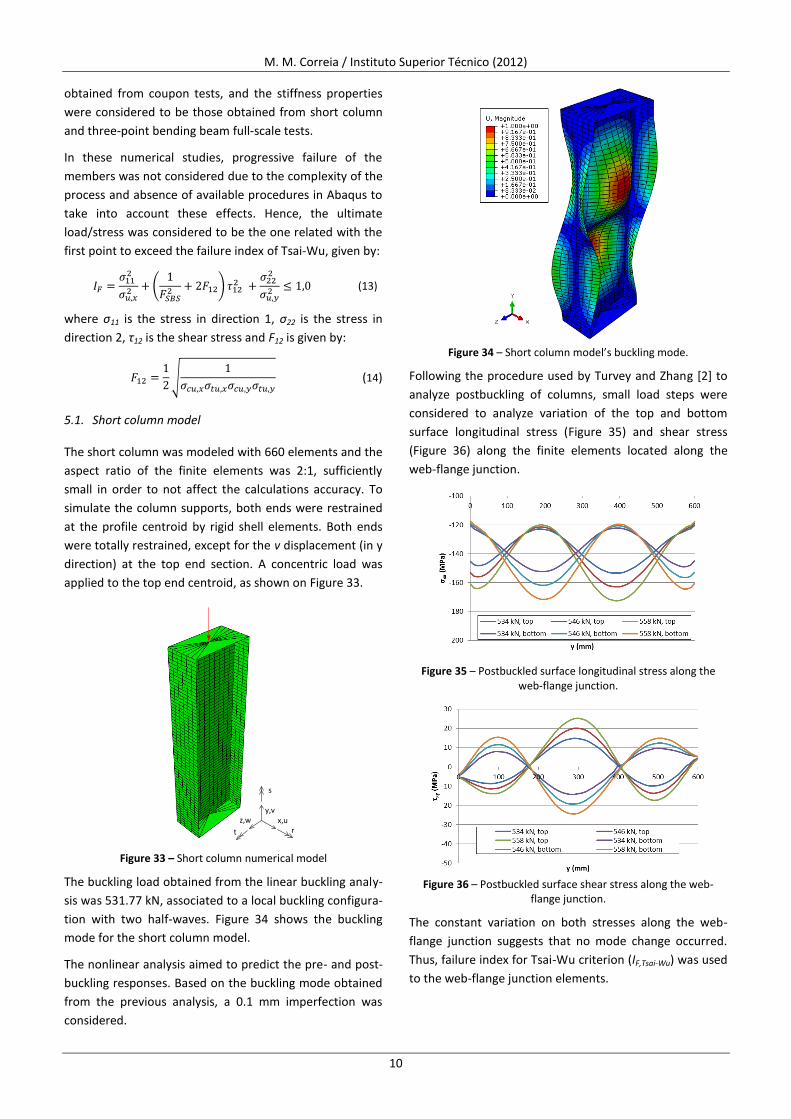
Strain data for incremental values of bending moment are
plotted along the web height (Figure 30). The uniform
evolution of those strains, obtaining zero strain at the
center of gravity, suggests that the section was kept plane
at mid-span, implying that the EBT may be considered on
this beam segment, in other words, shear deformation can
be neglected. Hence, the flexural effective modulus was
obtained by plotting the curvature at mid-span versus the
bending moment as shown on Figure 31, considering that
shear deformation had no influence. A 37.93 GPa flexural
modulus was obtained, similar to the one obtained from
the three-point bending tests (-1%).
Figure 30 – Evolution of strain data for incremental values of
bending moment on the cross-section height.
Adopting Kollár’s analytical method, the critical stress in
the compressed flange was 159.8 MPa, leading to a
39.4 kNm bending moment. This value is lower than the
one obtained experimentally. Such difference (-10%) can
be explained by the fact that material transverse failure
occurred at the web-flange junction, followed by immedi-
ate buckling of the top flange that lowered its critical
stress to 29.4 MPa.
Figure 31 – Bending moment-curvature curve at the mid-span
section for the four-point bending beam.
Figure 32 shows the buckled four-point bending beam top
flange. It can be seen that the web-flange junction was
crushed, triggering the flange buckling.
Figure 32 – Four-point bending beam buckled configuration after
collapsing.
5. NUMERICAL MODELLING
The finite element method (FEM) using Abaqus software
was applied in order to model the short columns and the
four-point bending beam, and to analyze their local buck-
ling susceptibility. Those models were calibrated based on
the experimental data obtained from coupon and full-
scale tests in order to perform parametric studies with
different cross-section shapes and span lengths.
Linear buckling analysis was conducted in order to obtain
the buckling load (Pcr) and the buckling mode configura-
tion. Then, a nonlinear analysis was performed in order to
obtain the ultimate load (Pu) of the model, using Tsai-Wu
failure criterion.
A 23-noded generic cross-section was defined in order to
generate four-noded rectangular shell elements that were
used to model the short column and the beam. The ele-
ment strength properties were considered to be those
Page 10
M. M. Correia / Instituto Superior Técnico (2012)
10
obtained from coupon tests, and the stiffness properties
were considered to be those obtained from short column
and three-point bending beam full-scale tests.
In these numerical studies, progressive failure of the
members was not considered due to the complexity of the
process and absence of available procedures in Abaqus to
take into account these effects. Hence, the ultimate
load/stress was considered to be the one related with the
first point to exceed the failure index of Tsai-Wu, given by:
(
)
(13)
where σ11 is the stress in direction 1, σ22 is the stress in
direction 2, τ12 is the shear stress and F12 is given by:
√
(14)
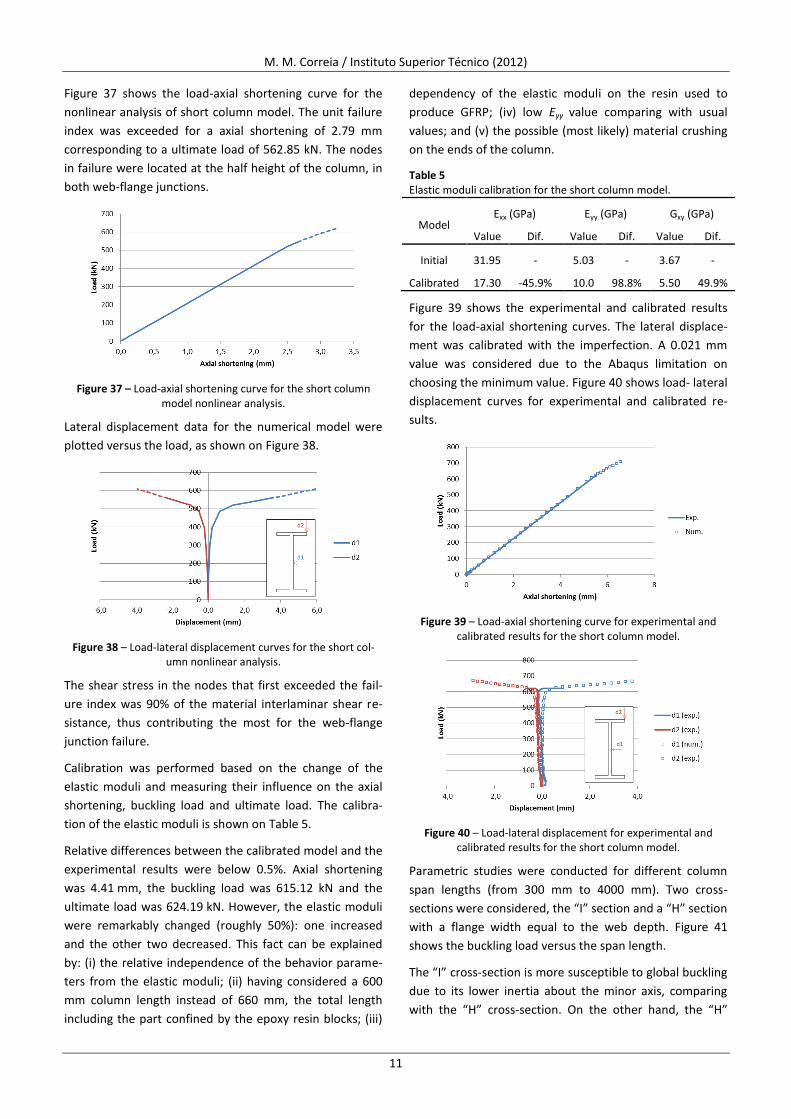
5.1. Short column model
The short column was modeled with 660 elements and the
aspect ratio of the finite elements was 2:1, sufficiently
small in order to not affect the calculations accuracy. To
simulate the column supports, both ends were restrained
at the profile centroid by rigid shell elements. Both ends
were totally restrained, except for the v displacement (in y
direction) at the top end section. A concentric load was
applied to the top end centroid, as shown on Figure 33.
x,uy,v
z,w
t r
s
Figure 33 – Short column numerical model
The buckling load obtained from the linear buckling analy-
sis was 531.77 kN, associated to a local buckling configura-
tion with two half-waves. Figure 34 shows the buckling
mode for the short column model.
The nonlinear analysis aimed to predict the pre- and post-
buckling responses. Based on the buckling mode obtained
from the previous analysis, a 0.1 mm imperfection was
considered.
Figure 34 – Short column model’s buckling mode.
Following the procedure used by Turvey and Zhang [2] to
analyze postbuckling of columns, small load steps were
considered to analyze variation of the top and bottom
surface longitudinal stress (Figure 35) and shear stress
(Figure 36) along the finite elements located along the
web-flange junction.
Figure 35 – Postbuckled surface longitudinal stress along the
web-flange junction.
Figure 36 – Postbuckled surface shear stress along the web-
flange junction.
The constant variation on both stresses along the web-
flange junction suggests that no mode change occurred.
Thus, failure index for Tsai-Wu criterion (IF,Tsai-Wu) was used
to the web-flange junction elements.
Page 11
M. M. Correia / Instituto Superior Técnico (2012)
11
Figure 37 shows the load-axial shortening curve for the
nonlinear analysis of short column model. The unit failure
index was exceeded for a axial shortening of 2.79 mm
corresponding to a ultimate load of 562.85 kN. The nodes
in failure were located at the half height of the column, in
both web-flange junctions.
Figure 37 – Load-axial shortening curve for the short column
model nonlinear analysis.
Lateral displacement data for the numerical model were
plotted versus the load, as shown on Figure 38.
Figure 38 – Load-lateral displacement curves for the short col-
umn nonlinear analysis.
The shear stress in the nodes that first exceeded the fail-
ure index was 90% of the material interlaminar shear re-
sistance, thus contributing the most for the web-flange
junction failure.
Calibration was performed based on the change of the
elastic moduli and measuring their influence on the axial
shortening, buckling load and ultimate load. The calibra-
tion of the elastic moduli is shown on Table 5.
Relative differences between the calibrated model and the
experimental results were below 0.5%. Axial shortening
was 4.41 mm, the buckling load was 615.12 kN and the
ultimate load was 624.19 kN. However, the elastic moduli
were remarkably changed (roughly 50%): one increased
and the other two decreased. This fact can be explained
by: (i) the relative independence of the behavior parame-
ters from the elastic moduli; (ii) having considered a 600
mm column length instead of 660 mm, the total length
including the part confined by the epoxy resin blocks; (iii)
dependency of the elastic moduli on the resin used to
produce GFRP; (iv) low Eyy value comparing with usual
values; and (v) the possible (most likely) material crushing
on the ends of the column.
Table 5 Elastic moduli calibration for the short column model.
Model Exx (GPa) Eyy (GPa) Gxy (GPa)
Value Dif. Value Dif. Value Dif.
Initial 31.95 - 5.03 - 3.67 -
Calibrated 17.30 -45.9% 10.0 98.8% 5.50 49.9%
Figure 39 shows the experimental and calibrated results
for the load-axial shortening curves. The lateral displace-
ment was calibrated with the imperfection. A 0.021 mm
value was considered due to the Abaqus limitation on
choosing the minimum value. Figure 40 shows load- lateral
displacement curves for experimental and calibrated re-
sults.
Figure 39 – Load-axial shortening curve for experimental and
calibrated results for the short column model.
Figure 40 – Load-lateral displacement for experimental and
calibrated results for the short column model.
Parametric studies were conducted for different column
span lengths (from 300 mm to 4000 mm). Two cross-
sections were considered, the “I” section and a “H” section
with a flange width equal to the web depth. Figure 41
shows the buckling load versus the span length.
The “I” cross-section is more susceptible to global buckling
due to its lower inertia about the minor axis, comparing
with the “H” cross-section. On the other hand, the “H”
Page 12
M. M. Correia / Instituto Superior Técnico (2012)
12
cross-section is more sensitive to local buckling due to the
fact that its flanges are wider, and so more sensitive to
local buckling than “I” cross-section columns.
Figure 41 – Buckling load for different span length for “I” and “H”
sections.
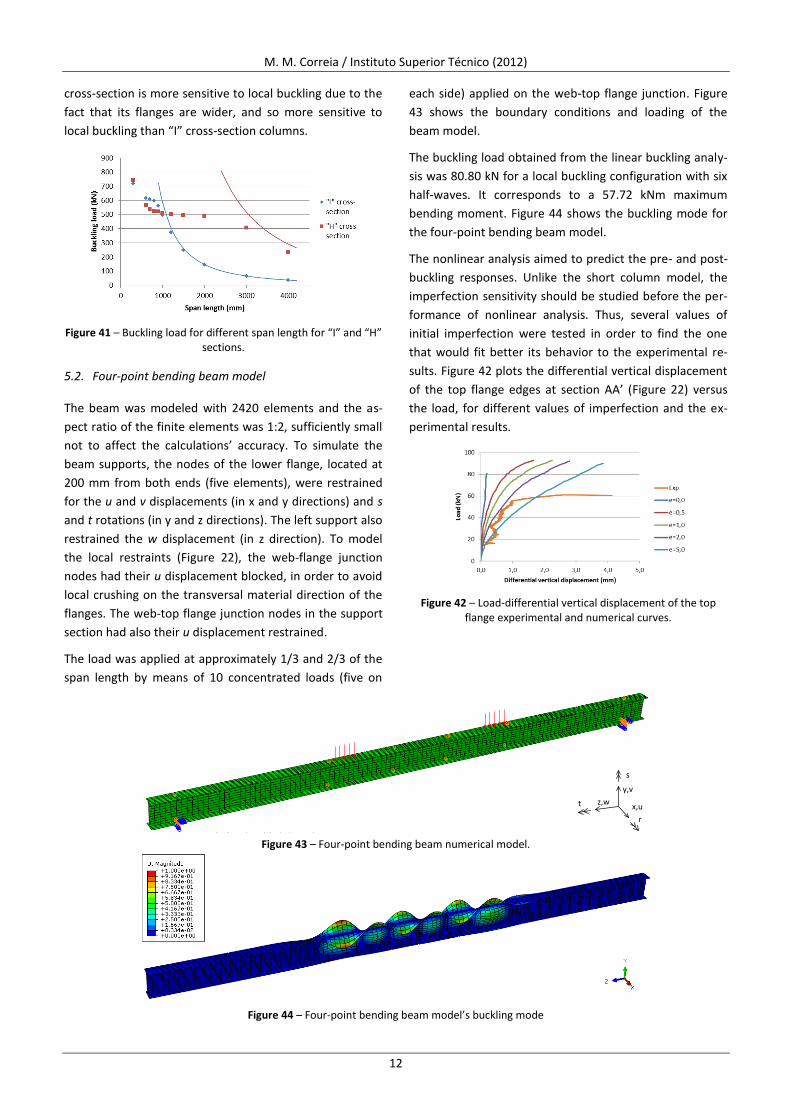
5.2. Four-point bending beam model
The beam was modeled with 2420 elements and the as-
pect ratio of the finite elements was 1:2, sufficiently small
not to affect the calculations’ accuracy. To simulate the
beam supports, the nodes of the lower flange, located at
200 mm from both ends (five elements), were restrained
for the u and v displacements (in x and y directions) and s
and t rotations (in y and z directions). The left support also
restrained the w displacement (in z direction). To model
the local restraints (Figure 22), the web-flange junction
nodes had their u displacement blocked, in order to avoid
local crushing on the transversal material direction of the
flanges. The web-top flange junction nodes in the support
section had also their u displacement restrained.
The load was applied at approximately 1/3 and 2/3 of the
span length by means of 10 concentrated loads (five on
each side) applied on the web-top flange junction. Figure
43 shows the boundary conditions and loading of the
beam model.
The buckling load obtained from the linear buckling analy-
sis was 80.80 kN for a local buckling configuration with six
half-waves. It corresponds to a 57.72 kNm maximum
bending moment. Figure 44 shows the buckling mode for
the four-point bending beam model.
The nonlinear analysis aimed to predict the pre- and post-
buckling responses. Unlike the short column model, the
imperfection sensitivity should be studied before the per-
formance of nonlinear analysis. Thus, several values of
initial imperfection were tested in order to find the one
that would fit better its behavior to the experimental re-
sults. Figure 42 plots the differential vertical displacement
of the top flange edges at section AA’ (Figure 22) versus
the load, for different values of imperfection and the ex-
perimental results.
Figure 42 – Load-differential vertical displacement of the top
flange experimental and numerical curves.
y,v
s
x,uz,w
r
t
Figure 43 – Four-point bending beam numerical model.
Figure 44 – Four-point bending beam model’s buckling mode
Page 13
M. M. Correia / Instituto Superior Técnico (2012)
13
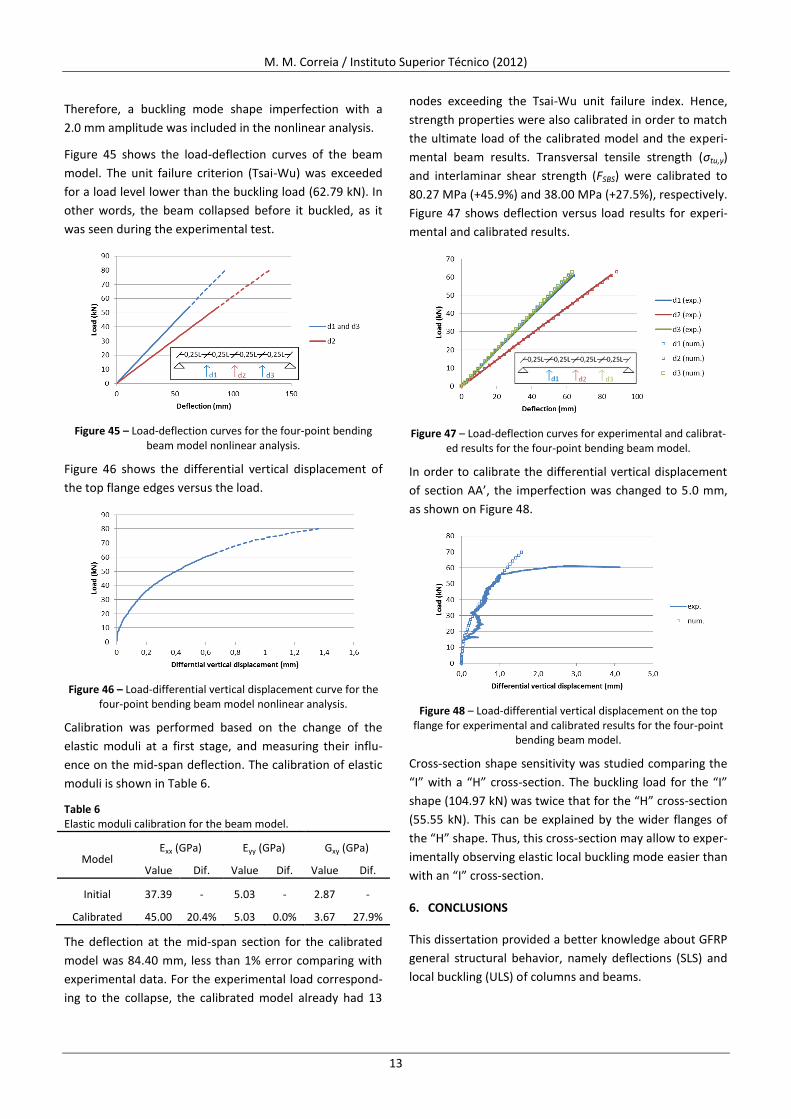
Therefore, a buckling mode shape imperfection with a
2.0 mm amplitude was included in the nonlinear analysis.
Figure 45 shows the load-deflection curves of the beam
model. The unit failure criterion (Tsai-Wu) was exceeded
for a load level lower than the buckling load (62.79 kN). In
other words, the beam collapsed before it buckled, as it
was seen during the experimental test.
Figure 45 – Load-deflection curves for the four-point bending
beam model nonlinear analysis.
Figure 46 shows the differential vertical displacement of
the top flange edges versus the load.
Figure 46 – Load-differential vertical displacement curve for the
four-point bending beam model nonlinear analysis.
Calibration was performed based on the change of the
elastic moduli at a first stage, and measuring their influ-
ence on the mid-span deflection. The calibration of elastic
moduli is shown in Table 6.
Table 6 Elastic moduli calibration for the beam model.
Model Exx (GPa) Eyy (GPa) Gxy (GPa)
Value Dif. Value Dif. Value Dif.
Initial 37.39 - 5.03 - 2.87 -
Calibrated 45.00 20.4% 5.03 0.0% 3.67 27.9%
The deflection at the mid-span section for the calibrated
model was 84.40 mm, less than 1% error comparing with
experimental data. For the experimental load correspond-
ing to the collapse, the calibrated model already had 13
nodes exceeding the Tsai-Wu unit failure index. Hence,
strength properties were also calibrated in order to match
the ultimate load of the calibrated model and the experi-
mental beam results. Transversal tensile strength (σtu,y)
and interlaminar shear strength (FSBS) were calibrated to
80.27 MPa (+45.9%) and 38.00 MPa (+27.5%), respectively.
Figure 47 shows deflection versus load results for experi-
mental and calibrated results.
Figure 47 – Load-deflection curves for experimental and calibrat-
ed results for the four-point bending beam model.
In order to calibrate the differential vertical displacement
of section AA’, the imperfection was changed to 5.0 mm,
as shown on Figure 48.
Figure 48 – Load-differential vertical displacement on the top
flange for experimental and calibrated results for the four-point bending beam model.
Cross-section shape sensitivity was studied comparing the
“I” with a “H” cross-section. The buckling load for the “I”
shape (104.97 kN) was twice that for the “H” cross-section
(55.55 kN). This can be explained by the wider flanges of
the “H” shape. Thus, this cross-section may allow to exper-
imentally observing elastic local buckling mode easier than
with an “I” cross-section.
6. CONCLUSIONS
This dissertation provided a better knowledge about GFRP
general structural behavior, namely deflections (SLS) and
local buckling (ULS) of columns and beams.
Page 14
M. M. Correia / Instituto Superior Técnico (2012)
14
Mechanical properties obtained from experimental cou-
pon tests were consistent with the manufacturer data.
Short column full-scale tests enabled to observe local
buckling. On the other hand, the four-point bending beam
test showed one of the major disadvantages of GFRP, the
transversal material strength. The beam material failed
before local buckling occurred.
Numerical models predicted accurately GFRP member
behavior, namely the buckling mode shape. Calibrated
models enabled to understand “I” profiles general greater
sensitivity to global buckling and that “H” profiles are
more sensitive to local buckling.
The results obtained in this dissertation should be com-
pared with those obtained by Francisco Nunes [15] in
order to compare the influence of CFRP (Carbon Fiber
Reinforced Polymers) strip in the deflection and local
buckling of GFRP pultruded profiles.
7. REFERENCES
[1] BANK, L. C., e YIN, J. (1999), Failure of Web-Flange
Junction in Postbubkled pultrud I-Beams, Journal of Com-
posites for Construction, Vol. 3, No. 4, pp. 177-184;
[2] TURVEY, G. J. e ZHANG, Y. (2006), A computational and
experimental analysis of the buckling, postbuckling and
initial failure of pultruded GRP columns, Computers and
Structures, Vol. 84, pp. 1527-1537;
[3] KOLLÁR, L.P. (2002), Buckling of unidirectionally loaded
composite plates with one free and one rotationally re-
strained unloaded edge, Journal of Structural Engineering,
Vol. 128, No. 9, pp. 1202-1211;
[4] KOLLÁR, L. P. (2003), Local buckling of fiber reinforced
plastic composite structural members with open and clos-
es cross-section, Journal of Structural Engineering,
Vol. 129, No. 11, pp. 1503-1513;
[5] ASTM International (2002), Standard Test Method for
Compressive Properties of Rigid Plastics (D 695), West
Conshohocken, Pennsylvania;
[6] Comité Européen de Normalisation (1997), Plastiques – Détermination des propriétés en traction (ISO 527:1997), Brussels;
[7] Comité Européen de Normalisation (1998), Fiber-
reinforced plastic composites: determination of flexural
properties (ISO 14125:1998), Brussels;
[8] ASTM International (2000), Standard Test Method for
Short-Beam Strength of Polymer Matrix Composite Mate-
rials and their Laminates (D 2344), West Conshohocken,
Pennsylvania;
[9] HODGKINSON, J.M. (2000), Mechanical Testing of Ad-
vanced Fiber Composites, CRC Press, Boca Raton, Califor-
nia;
[10] BANK L. C. (2006), Composites for Construction: Struc-
tural design with FRP materials, John Wiley & sons, New
York;
[11] Comité Européen de Normalisation (2002), Reinforced
plastics composites: specifications for pultruded profiles
(EN 13706:2002), Brussels;
[12] BANK, L. C. (1989), Flexural and shear moduli of full-
section Fiber Reinforced plastic (FRP) pultruded beams,
Journal of Testing and Evaluation, Vol. 17, No. 1, pp. 40-
45;
[13] ROBERTS, T. M., AL-UBAIDI, H. (2002), Flexural and
torsional properties of pultruded fiber reinforced plastic I-
profiles, Journal of Composites for Constructions, Vol. 6,
No. 1, pp. 28-34;
[14] Abaqus CAE 6.10 (2010), Simulia;
[15] NUNES, F. (2012), Structural behavior of GFRP pul-
truded profiles reinforced with CFRP strips: experimental
characterization and numerical modeling, Masters of Sci-
ence Civil Engineering Dissertation, Instituto Superior
Técnico, Universidade Técnica de Lisboa, Lisbon.